Article

A Two-Stage Cascade for Increased High-Value Product Accumulation in Chlamydomonas asymmetrica

1
Department of Chemical and Bioengineering, Friedrich Alexander University (FAU) Branch Campus Busan, Busan 618-230, Republic of Korea
2
Department of Mechanical Engineering and Environmental Engineering, Ostbayerische Technische Hochschule Amberg-Weiden (OTH-AW), Kaiser-Wilhelm-Ring 23, 92224 Amberg, Germany
3
Centre for Energy and Environment, Malaviya National Institute of Technology, Jaipur 302017, India
*
Author to whom correspondence should be addressed.
Fermentation 2024, 10(1), 38; https://doi.org/10.3390/fermentation10010038
Submission received: 3 November 2023 / Revised: 1 December 2023 / Accepted: 5 December 2023 / Published: 3 January 2024
(This article belongs to the Section Fermentation Process Design)

Abstract

:
Cascade systems are used in the large-scale production of astaxanthin, facilitating a successful value-added process despite high accumulating costs. However, their application to other high-value products (HVPs), like lutein, β-carotene, chlorophylls, and fatty acids, remains unexplored. This study investigates Chlamydomonas asymmetica in chemostatic cultures, focusing on the impact of light and dilution rate. A two-stage cascade system is designed, combining high-light growth with low-light pigment accumulation. The results show potential for productivity improvement. Notably, the spacetime yield (STY) of Chlorophyll a increased by 20.96%, reaching 2.73 g·L−1·d−1 at the lowest dilution rate. Lutein maintains a consistent concentration of 22.34 mg·g−1, while β-carotene achieves a maximum STY of 3.60 mg·L·d−1. A cascade modification with a hollow fiber membrane significantly enhances HVP concentrations—Chlorophyll b, Lutein, Chlorophyll a, β-carotene, EPS, and GLA increase 27.23%, 38.95%, 31.88%, 86.19%, 128.7%, and 57.71%, respectively. STY improvements for these HVPs range from 1.78% to 82.96%. This study offers insights into C. asymmetica’s response and proposes a cascade modification for enhanced HVP production and downstream processing efficiency.

1. Introduction

Biofuel production, food additives, antioxidants, cosmetics, and many other industrial uses are just a few of the many that can be accomplished with microalgae grown on a commercial scale [1]. Out of the approximately 350,000 isolated algae, only around 20 organisms have been successfully cultivated on a commercial scale [2]. The few commercial products currently available on the market are grown in open cultivation systems with carefully controlled pH, salinity, irradiance, and temperature [3,4], although there are benefits and drawbacks to growing algae in a closed reactor system [5]. The implementation of production processes for HVP such as pigments, fatty acids, and exopolysaccharides (EPS) by microalgae in industries has been slow, primarily due to the persistently unprofitable nature of these production processes. Many HVP agglomerates are produced in small quantities, making it impossible to achieve an economical profit. Additionally, synthetic compounds produced at lower costs but with lower applicability due to quality issues pose a formidable challenge to the market share held by algae-derived products. Algae has a great chance of succeeding due to the rising demand for all-natural products despite the higher cost that comes with it [6,7].
Continuous cultivation has emerged as a critical tool in bioprocess research. The direct relationship between “cause and effect” is best studied under steady-state conditions, which are not possible in batch cultivations. The growth of biomass over time in batch processes induces a constant state of transience in key culture parameters such as substrate concentrations and light supply. Because of their validity, screening, selection, and media, optimization are general processes that are carried out in continuous processes [8,9,10]. Continuous industrial large-scale processes for photoautotrophic microalgae are used in contrast to batch cultivations performed in minor open culture systems [11]. Despite the benefits of higher productivity and a higher degree of automatization resulting in lower labor intensity, the higher technical effort is avoided. Multistage cascades are used in industrial biotechnology when the formation of secondary metabolites is required due to stress or other factors [12].
The formation of astaxanthin, labeled E161j, as a food additive by microalgae is the most notable example of a two-stage reactor system. The algae Haematococcus pluvialis is thought to be the richest source of naturally derived astaxanthin, which is used in cosmetics, healthcare products, food, and feed additives, to name a few applications [7]. Natural astaxanthin market prices range between USD 2500 and 7000 per kilo, far exceeding those for artificially produced astaxanthin, allowing for the use of more complex cultivation systems [13]. The pigment’s function within the algae is to protect against harmful stress situations. Because stress conditions would significantly reduce H. pluvialis growth, astaxanthin production must be divided into two phases: growth- and stress-induced accumulation. Numerous stressors cause changes in algae, including salinity, carbon–nitrate ratio, light quantity and quality, hydroxyl radicals, temperature changes, and many others. The algae are grown in the so-called green stage, named as such because of their visible color due to high chlorophyll accumulation and biomass concentrations. Following that, the vegetative cell culture is transferred to the red stage, and stress is induced for ketocarotenoid formation, changing the color from green to red [7,13,14,15].
Drawing inspiration from the astaxanthin production in a cascade system, we investigated various HVP product types, including Chlorophyll a and b, the xanthophyll Lutein, and the carotene β-carotene, aiming to determine their optimum process points in a chemostat system using the microalgae Chlamydomonas asymmetrica. To determine the effects of a second stage on the productivity of the mentioned HVP in comparison to the single-stage process, a continuous two-step cascade approach is used. At two-photon flux densities (PFDs) in the first stage (659 and 1319 µmol·m−2·s−1) and a fixed PFD of 73 µmol·m−2·s−1 in the second stage and various residence times, the separation of the growth and HVP accumulation phases was investigated. Furthermore, process parameters were varied by changing the nitrate concertation of the second stage and the residence time by adding a hollow fiber membrane, allowing for an operation similar to a perfusion bioreactor. This innovative approach led to improvements in several STYs, underscoring the potential of spatially separating growth and biotransformation stages. Moreover, the incorporation of a perfusion reactor in the secondary stage denoted further advancements, underscoring the significance of the product’s nature in influencing the viability of cascade systems.

2. Materials and Methods

2.1. Organism: Chlamydomonas asymmetrica

The algae used in this work was isolated from the fresh waters of South Korea. Sequence homology of 85% suggested a close relationship to C. asymmetrica, which was first isolated in 1927. It was first mentioned in literature by Ludwig et al. [16]. Antiviral tests using EPS against the two worldwide occurring fish viruses, Koi Herpes Virus and Viral Hemorrhagic Septicemia Virus, revealed the high antiviral effectiveness of the substances. So far, only a limited amount of information about C. asymmetrica has been published [17,18].

2.2. Preparation Modified AF-6 Medium

The modified AF6 medium, according to Watanabe et al., was chosen as the most suitable medium due to a medium screening [19]. For cultivations, AF6 medium containing macro elements (0.00205 M MES buffer; 1.65 × 10⁻³ M NaNO3; 2.75 × 10⁻⁵ M NH4NO3; 1.22 × 10⁻⁵ M MgSO4·H2O; 7.35 × 10⁻⁵ M K2HPO4; 2.87 × 10⁻⁵ M KH2PO4; 6.8 × 10⁻⁵ M CaCl2·2H2O; 8.17 × 10⁻⁶ M Fe-citrate; 1.04 × 10⁻⁵ M citric acid) and trace metals (1.34 × 10⁻⁵ M Na2EDTA·2H2O; 3.63 × 10⁻⁶ M FeCl3·6H2O; 9.1 × 10⁻⁷ M MnCl2·4H2O; 3.83 × 10⁻⁷ M ZnSO4·7H2O; 8.41 × 10⁻⁸ M CoCl2·6H2O; 5.17 × 10⁻⁸ M Na2MoO4·2H2O) were mixed and set to a pH of 6.8. Subsequently, a vitamin stock (2.96 × 10⁻⁸ M thiamine, 8.19 × 10⁻⁹ M biotin, 7.38 × 10⁻¹⁰ M cyanocobalamin, and 5.91 × 10⁻⁹ M pyridoxine) must be added and sterile filtrated to the prior components after autoclaving and cooling down to room temperature.

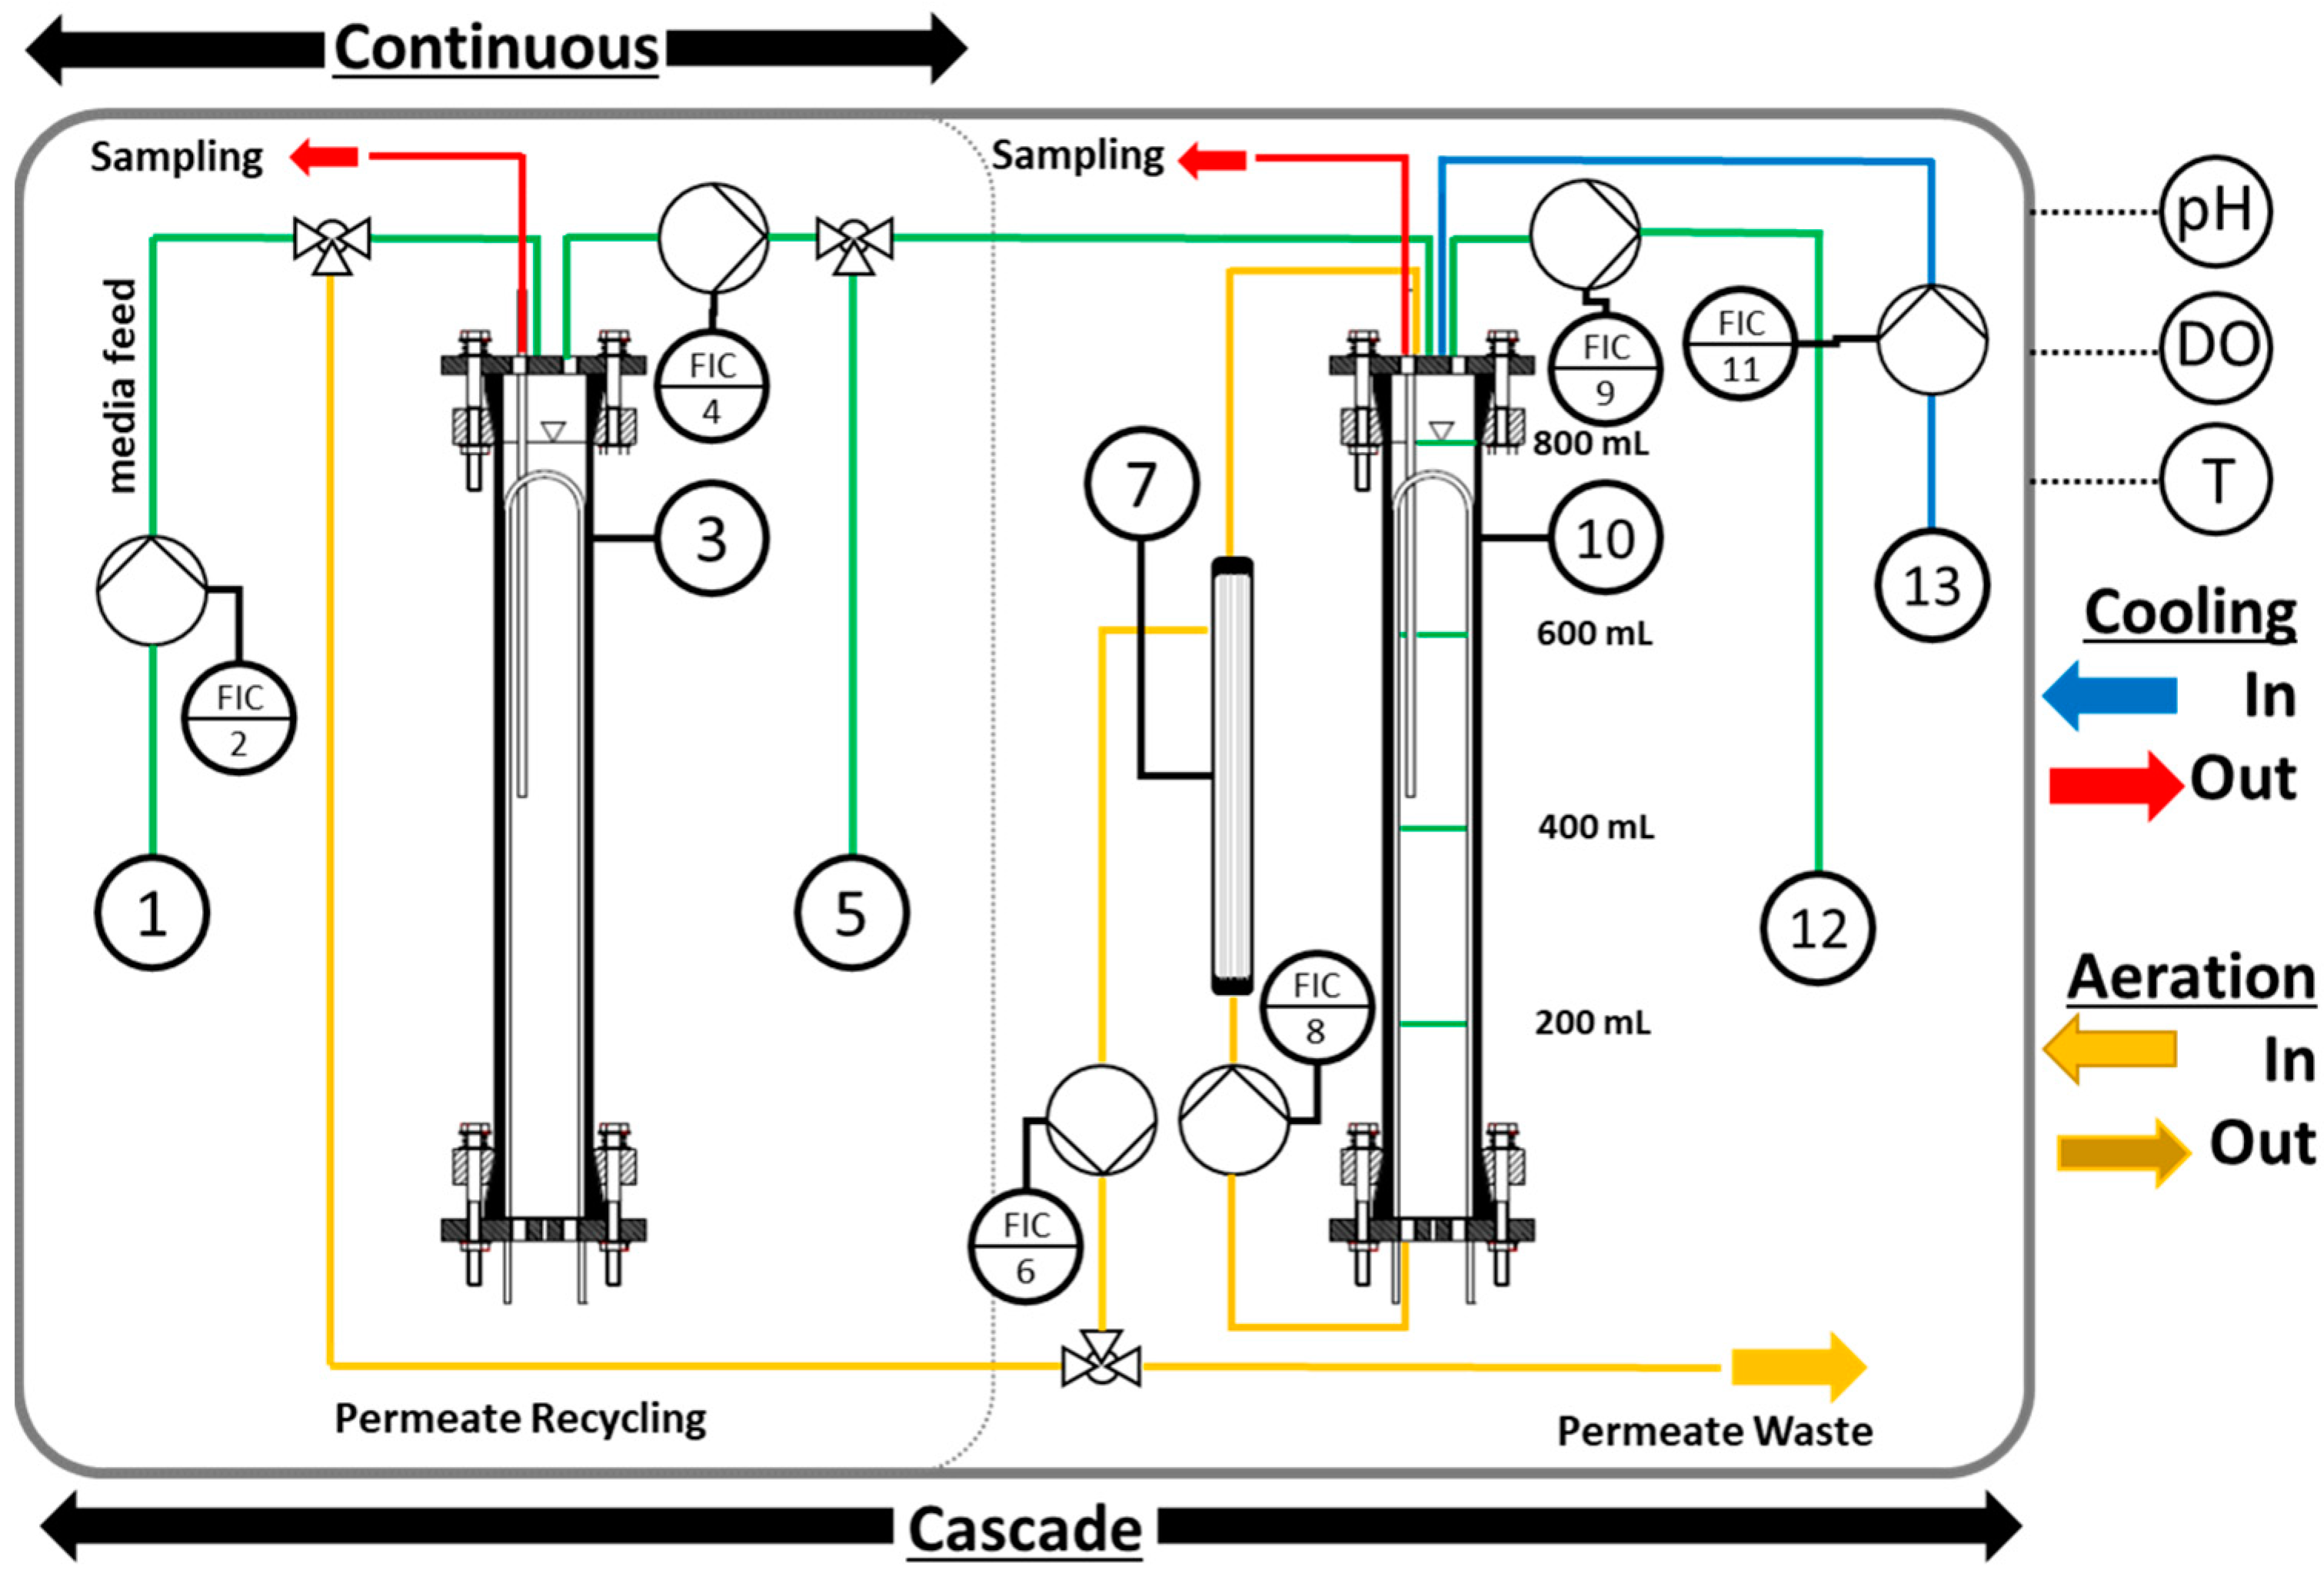
2.3. Reactor System Setup

For chemostat cultivations (see Figure 1), tubular “Photo Bioreactor Screening Modules” (PSMs, 800 mL) were used. An adjustable feed pump transferred fresh sterile medium from a reservoir tank to the reactor system. The volume was kept constant at 800 mL using level control, as a waste pump constantly removed excess medium.
The cascade reactor system (see Figure 1) consists of two PSM modules. The first one was operated in chemostat mode. The outlet of the chemostat step was used for feeding the second reactor stage, which, in contrast to the 1st stage, had a variable filling height of 200, 400, 600, 800, and 900 mL to adjust the residence time of the system. A hollow fiber module (HFM) (CFP-2-E-MM01A, GE Healthcare Life Science, Chicago, IL, USA) was connected to the second stage for an optional concentration of the biomass of C. asymmetrica. The retentate stream was backcirculated to the second stage. The permeate stream could be recycled into the first PSM or be transferred out of the cascade as a waste stream.
For the chemostat and each cascade stage, the aeration was kept constant at 0.5 vvm with 3% CO2-enriched sterile compressed air indicated by online gas measurements (BlueInOne Ferm, Bluesense, Herten, Germany) and regulated manually with rotameters. A cryostat kept the temperature level in the reactor constant. Constant PFDs with dimmable fluorescent lamps (Lumilux Cool White L 18W/84, Osram, Regensburg Germany) were adjusted via external light intensity measurements (LI 250 A, LI-COR, Bad Homburg, Germany). A calibration curve was used to calculate a reactor’s internal PFD. For calibration, an external PFD was plotted against the resulting PFD measured using a spherical light sensor inside the reactor (US-SQS/L, Walz, Effeltrich, Germany). Algae samples were collected from the sampling line of the reactor once equilibrium was achieved while varying the process parameters. All streams of fresh medium, culture, permeate, and nitrate solution were constantly measured and controlled to guarantee constant flow rates.

2.4. Cultivation

For inoculation of the reactor systems, axenic cultures of C. asymmetrica were stored within a CO3 (3%) incubator at 10 µmol·m−2·s−1 before the experiments. The desired PFD was set in the chemostat system, and the dilution rate was increased stepwise. After a constant biomass concentration was reached, the reactor was emptied for analysis of the biomass. Subsequently, the reactor was refilled, and the dilution rate was changed. The PFD was changed after generating a complete set of data points at different equilibrium points between dilution rates and biomass.
The two-stage cascade was operated identically. After constant biomass values were reached, both reactors were harvested, and the biomass was analyzed. The dilution rate, thus the residence time, was kept constant in stage one for all measurements. In stage two, the residence time of the system was adjusted by varying the liquid volume and the permeate stream of the HFM.

2.5. Biomass and OD Quantification

The OD was measured at a 750 nm wavelength unaffected by pigment absorption in a UV/VIS—photo spectrometer (UV-1800 Shimadzu, Kyoto, Japan) in triplicates against a pure medium as a blank value. To quantify the biomass concentration (X), triplicates of 2 mL samples were taken and centrifuged at 17,000× g for 5 min (Combi 514R, Hanil, Gwangju, Republic of Korea). The supernatant was removed for later analysis of the carbohydrate content. Samples were resuspended and centrifuged with deionized H2O twice. The generated pellet was freeze-dried (−60 °C, vacuum condition) (FDB-7002, Operon, Gimpo, Republic of Korea), and the weight was determined with a delicate balance (Sartorius, Göttingen, Germany). The reactor’s biomass for further analytical processing was transferred into 80 mL centrifuge tubes. Two-time centrifugation (3500× g, 15 min) and washing with deionized water were followed by freeze-drying (−60 °C, vacuum condition).

2.6. Nitrate Analysis

For the determination of the nitrate content, a photospectrometic measurement was used. Samples of the biomass-free supernatant were analyzed at 220 nm and 275 nm using a UV/VVIS–photo spectrometer (UV-1800 Shimadzu, JAP). The absorption Atotal was determined using the equation Atotal = A220 nm − 2A275 nm, which then was inserted into the linear fitting of the calibration performed with diluted pure medium samples to determine the overall nitrate concentration.

2.7. High-Performance Liquid Chromatography (HPLC): Pigments

Pigments of C. asymmetrica were analyzed in triplicates based on the chromatographic method of Taucher et al. with a reversed-phase column (YMC-Carotenoid C30, 150 × 4.6 mm, 3 µm, YMC, Kyoto, Japan) [20]. Pigment extraction was performed in triplicates from 350 mg of biomass in 15 mL centrifuge glass tubes with screw caps using Dichloromethane (DCM). Per tube, 10 mL were added, and samples were agitated on a shaker for 15 min in darkness and N2 atmosphere on ice. Afterward, the biomass was centrifuged (1500× g, 5 min), and the extract was stored (−20 °C N2 atmosphere). Extraction was repeated three times. After removal of the solvent with a rotary evaporator (RV 8 V C, IKA, Staufen, Germany), pigments were redissolved in 2 mL Tert-Butyl methyl ether (MTBE) and transferred into HPLC vials through a 0.2 µm nylon filter. Measurements were performed according to Taucher et al. but at a wavelength of 450 nm [20].

Gas Chromatography–Mass Spectrometry (GC-MS): Polyunsaturated Fatty Acids (PUFA)

A modified method by Lewis et al. was used for the extraction and methylation of the PUFAs [21] Samples were analyzed in triplicates according to Khoomrung et al. by GC-MS [22]. The temperature gradient was kept constant at 50 °C for 1.5 min and then increased to 220 °C until minute 5.75. A ramp to 250 °C until minute 6.75 was followed by a hold until minute 11.75. The column used was an SP-2380 30 m × 20 μm × 25 mm with a linear velocity of Helium of 20 cm∙s−1.

2.8. Carbohydrate Content: EPS

Total carbohydrate content could be used as an estimation for the EPS accumulation in the algae medium. Supernatant samples from the first biomass centrifugation step without algae were analyzed with a method of DuBois et al. modified for 96 well-plates using a plate reader (Infinite M200 Pro, Tecan Group Ltd., Männedorf, Swiss) for higher sample processing in triplicates [23]. Glucose sugar was used as the calibration standard for the carbohydrate assay.

3. Results and Discussion

3.1. Chemostat Cultivation

C. asymmetrica was analyzed for its Chlorophyll a and b content, the two carotenoids Lutein and β-carotene, and the extracellular EPS and GLA as one member of the fatty acid (FA) pool. Cultures were cultivated at seven different reactor internal PFDs of 73, 147, 293, 440, 586, 659, and 806 µmol·m−2·s−1 and at different dilution rates.
Figure 2A exemplarily depicts a typical X-D-diagram at a PFD of 806 µmol·m−2·s−1. Increasing dilution caused a reduction in the X due to the decreased residence time of the algae in the reactor and an increasing nitrate concentration. A clear vertex occurred regarding the biomass STY indicating the maximum volumetric productivity of the set PFD at this point. The washout point, which would require dilution rates higher than the specific maximum growth rate of the algae, was not reached. The highest growth rates, which correspond to the dilution rate in the reactor system, reached a level of 3.34 d−1. Figure 2B gives an overview of the maximum biomass concentrations of C. asymmetrica. The highest biomass concertation X with 2.6 g·L−1 was reached at 440 µmol·m−2·s−1, and the maximum OD of 2.86 occurred at 806 µmol·m−2·s−1. The highest biomass STY with 2.21 g·L−1·d−1 was determined at 659 µmol·m−2·s−1. At maximum PFD above 659 µmol·m−2·s−1, despite the OD, the values for the biomass concentration and STY strongly decline. C. asymmetrica actively adapts to changes in the dilution rate and PFD, resulting in changes in specific product concentrations and STYs. The general trend of the pigments Chlorophyll a and b and the carotenoids lutein and β-carotene is shown in Figure 2C for 806 µmol·m−2·s−1. The lowest concentrations for each HVP occurred at the lowest dilution rates, from where they steadily increased until an optimum of each was reached. Maximum values appear at similar dilution rates as the maximum biomass STY. In contrast to the pigments, maximum EPS, which were secreted by the algae into the medium, and GLA, which accumulate within the cell, concentrations are reached at a minimum dilution rate from where on they steadily decrease. For all other PFDs, similar trends for the HVPs were determined, only varying in the absolute values and the occurrence of the optima for each PFD. The corresponding pigment STYs were in accordance with the trend of the biomass STYs, as shown in Figure 2A,D. The maximum value for pigment STYs was observed at a dilution rate of around 2.24 d−1. In contrast to the specific concentrations, the maxima were reached at higher dilution rates. At both sides of the inflexion point, lower STYs were determined. The STYs can be assumed to be zero at a dilution rate equal to zero and at the washout point. The maximum values for all products at different PFDs are summarized in the following section.
Figure 3 indicates the development of all the maximum specific concentrations and STYs of all HVPs in dependency on the set PFD. Both chlorophylls depict the same trend as demonstrated in Figure 3A,B. The highest maximum concentrations of 39.15 mg·g−1 for Chlorophyll a and 12.34 mg·g−1 for Chlorophyll b were determined at the lowest PFD of 73 µmol·m−2·s−1. The decrease in concentration, in an almost linear manner with rising PFD, as a result of photoacclimation, was published by [24] and reported for C. reinhardtii [25]. In contrast, the STYs show a distinct maximum at 586 µmol·m−2·s−1 with concentrations of 42.00 mg·g−1 and 11.46 mg·g−1, respectively, for CHA and CHB. Among the two carotenoids, found in C. asymmetrica, the maximum concentration of Lutein was almost constant at around 22.34 mg·g−1 in the range of measured PFD from 73 to 806 µmol·m−2·s−1 (see Figure 3C,D). Therefore, for the lutein STY, a clear maximum was reached at the point of highest biomass productivities with 46.61 mg·L−1·d−1. Despite the relatively high concentrations of lutein produced under phototrophic conditions, it could not compete with the yields of heterotrophic cultivations, where a maximum of 225.3 mg·L−1 was reached [10]. The β-carotene concentration slightly increased to a PFD of 293 µmol·m−2·s−1, reaching an optimum of 2.84 mg·g−1. However, higher PFD resulted in a lower accumulation of β-carotene. The maximum STY was determined at 589 µmol·m−2·s−1 with 3.60 mg·L·d−1. Those results were contradictory to outcomes of other algae, such as Dunaliella bardawil and Dunaliella salina, where β-carotene concentration increases at high radiation levels to protect from photo damage [26].
The highest GLA concertation with 6.67 mg·g−1 was reached at a PFD of 293 µmol·m−2·s−1. As depicted in Figure 3E, the maximum STY of GLA lies at a PDF of 659 µmol·m−2·s−1 with 7.29 mg d−1·L−1. The formation of GLA at the highest biomass concentrations and low dilution rate was known for many algae. Solovchenko et al. concluded that the limitations in nutrient supply, such as nitrate, and low growth rates are well known for inducing FA formation into storage products and inhibiting further cell division [27]. In contrast to all other products, maximum EPS concentrations increased with PFD, reaching 0.58 g·g−1 at 806 µmol·m−2·s−1. At identical PFD, the STY is highest with 0.19 g·L−1·d−1. At identical PFD, the specific productivity (STY) was highest, reaching 0.19 g·L−1·d−1. EPS and GLA shared a common trait, as their highest accumulation occurred at the lowest dilution rate, independent of the PFD, whereas the pigments showed clear optima at intermediate levels. Clear tendencies for C. asymmetrica regarding all its HVPs were measured in the chemostat, depending on the PFD and dilution rate. Except for the EPS, no HVP reached a maximum specific concentration and STY at identical PFD. The maximum biomass STY at 659 µmol·m−2·s−1 influenced the occurrence of these optima for C. asymmetrica, which were not in accordance with the maximum specific concentrations in the case of Chlorophyll a and b, β-carotene, and GLA. However, the maximum concentrations of Lutein remained uncoupled from the light supply, with a constant maximum level observed between 73 and 806 µmol·m−2·s−1.

3.2. Cascade-System

To deal with the problem of high HVP accumulation at conditions of low biomass STYs, the growth phase of C. asymmetrica and the product accumulation phase were spatially separated into two consecutive reactor stages operating under different conditions. Stage one was operated at high PFD to produce biomass at high rates, however, with low HVP content. The second stage was darkened, and 73 µmol·m−2·s−1 was the lowest reachable PFD for the reactor systems to enable a ripening effect in the form of HVP accumulation at substantially lower PFD. The biomass transformation process strongly depends on the period given for the accumulation of HVPs. In this context, the direct impact of the residence time on the STYs is of significant interest, accessed by changes in the reactor volume in the second stage.
Table 1 gives an overview of the tested reactor settings for the cultivation of C. asymmetrica in the two-stage cascade system. The volume flow of fresh medium entering stage one was constant for all cascade cultivations and it was set at a 2.14 L·d−1 ± 0.07 L·d−1, which was an equally high level as the optimum in STY observed at a PFD of 659 µmol·m−2·s−1 in the chemostat measurements. For Run 3, an additional nitrate supply to stage two was connected. The nitrate stream was set to a constant flow rate of 60.86 mL·d−1 ± 2.17 mL·d−1 with a concentration of 12 g L−1. In contrast to Run 1, the PFD of stage one in Run 2 and Run 3 was not under the optimum biomass conditions, resulting in lower biomass production and lower HVP concentrations and STYs. Despite these differences, the changes in concentration reached higher values during the concentration increase. During the cascade cultivation, fluctuations in pigment concentrations and STYs could not be prohibited totally. To point out the changes in specific concentration and STY, the derived value from stage one was subtracted from the value derived from stage two. In the following sections, the ΔcHVP and ΔSTYHVP of the HVPs are plotted against Δτ, which is derived from the difference in residence time between stage one and the full cascade. Thus, at Δτ = 0, the algae were transferred to stage two, and the transformation process began. Chlorophyll a and Chlorophyll b showed a similar trend in all experiments, as shown in Figure 4D–F. In Run 1, the concentration increased by 4.54 mg·g−1 (21.54%) at the highest residence time of 0.37 d. The concentration increased at higher light intensity for stage one in Run 2 with a surplus of 7.93 mg·g−1 (81.00%) after 0.41 d in stage two. For Run 3, at Δτ = 0.37 d, additional 7.67 mg·g−1 (65.48%) were agglomerated. However, the increase in concentration resulted only in the case of Run 2 in an improvement of STY for Chlorophyll a by 2.73 g· L−1·d−1 (20.96%) at the lowest Δτ = 0.09 d. The concentrations of Lutein, depicted in Figure 4G–I, increased for all runs. In Run 1 the specific Lutein concertation increased by 5.19 mg· g−1 (24.94%) at a residence time of 0.37 d in the second stage. The improvement by the second stage achieved in Run 2 was slightly lower at 3.01 mg·g−1 (17.18%), and in Run 3, it was slightly higher at 5.86 mg·g−1 (32.16%). Despite the increase in specific concentration, no improvement of STY for Lutein was reached. The outcome for β-carotene is shown in Figure 4J–L. The maximum agglomeration in Run 1 was 0.38 mg·g−1 (31.37%) after 0.37 d; in Run 2, it was 0.51 mg·g−1 (78.15%) after 0.41 days; and in Run 3, it was 0.47 mg·g−1 (66.14%) after 0.37 days. In Run 2, there was a measured improvement of 0.13 mg·L−1·d−1 in β-carotene STY after 0.09 days, which corresponds to a 22.61% increase.
No other Run accomplished increases in STY of the cascade compared to the first stage alone. Trends in EPS concentrations developed similarly to the other HVPs. However, the pattern was less clear due to the big fluctuations seen in Figure 4M–O. The percentage concentration increase is in the case of EPS highest of all HVP. Run 1 results in a 56.63% increase (0.10 g·g−1), Run 3 in 122.12% (0.13 g·g−1), and Run 2 in a 240.33% (0.14 g·g−1) increase but all at different residence times (Run 1 0.37d, Run 2 0.19 d, and Run 3 0.09 d). All runs improved their STYs: Run 1 by 0.01 g·L·d−1 (9.8%), Run 2 by 0.10 g·L−1·d−1 (112.25%), and Run 3 by 0.09 g·L−1·d−1 (43.3%). Changes in GLA concentrations are depicted in Figure 4P–R. In Run 1, the GLA content increased by 1.67 mg·g−1 (36.62%) after 0.37 d. Higher improvements were determined for Run 2 with 2.23 mg·g−1 (53.50%) at Δτ = 0.41 d and 2.95 mg·g−1 (75.21%) and for Run 3 at Δτ = 0.37 d. Despite the higher specific concentrations, STY only increased for Runs 1 and 2. However, the prolonged stay in the second stage reduced the overall STY for most HVPs. The data demonstrate that improving STYs in the cascade is only possible if the second reactor volume is kept small. It was shown for Run 1 that the STYs for GLA and EPS increase at the lowest residence time in stage two. The cascade was more productive for these two HVPs than the single-stage reactor running at optimum biomass STY conditions derived from the chemostat. For Run 2, all HVPs except Lutein reached higher STYs at a minimum second reactor volume. It has to be pointed out that the absolute STYs of Run 2 are still lower than for the first reactor of Run 1, as the biomass in stage one was not cultured at optimum PFD. However, the improvement in STYs demonstrates the cascade system’s ability to increase the system’s output if growth and HVP accumulation are spatially separated. Run 3 demonstrated the least potential among the three, except for the EPS, as all other HVP STYs strongly declined, possibly since nitrate uptake is an energy-consuming step and, therefore, the amount of free energy available for HVP accumulation is reduced [28]. Furthermore, according to Solovchenko et al. and Kroen et al., EPS and GLA are predominantly produced in nitrate-limited states [27,29]. The outcomes of the study conducted by Kandilian et al. align with our findings, demonstrating a triglyceride accumulation under conditions of nitrate deprivation in Parachlorella kessleri [30]. The impact of nitrate limitation on pigment composition exhibits a heightened level of intricacy. In particular, nitrate deprivation under conditions of elevated light intensities is elucidated to amplify pigment content, whereas diminished light intensities precipitate a degradation of pigments [31,32].
The modified version of the cascade system features a hollow fiber membrane to achieve higher biomass concentrations in the second stage. The biomass-free permeate stream was set at 2/3 of the feed stream. The overall residence time, however, stayed constant due to constant in and outlet streams. The setup was used for a 200 mL liquid level in the second reactor at identical settings according to runs 2 and 3, as shown in Table 1. The permeate flux was set to 2/3 of the feed flux; thus, a higher amount of pure medium was continuously leaving stage two than concentrated algae culture, increasing the residence at otherwise constant residence time.
Using the HFM, the concentrations of all HVPs could be significantly increased, as demonstrated in Figure 5A. Adding nitrate to stage two did not result in higher accumulation compared to without nitrate. For Run 2-like settings, the highest increases were determined (Chlorophyll b 27.23%, Lutein 38.95%, Chlorophyll a, 31.88%, β-carotene 86.19%, EPS 128.7%, and GLA 57.71%). Regarding the STYs, as shown in Figure 5B, this resulted in improvements for all HVPs. Improvements for Chlorophyll b 1.78%, Lutein 11.16%, Chlorophyll a 5.5%, β-carotene 48.95%, EPS 82.96%, and GLA 26.16% were detected. Except for EPS and Chlorophyll b, all other HVP concentrations significantly reached higher levels. The negative impact of the nitrate (comparing Run 2 and Run 3) on the HVP accumulation and especially on the STYs can be an effect of the nitrate itself, as already discussed before, or due to the dilution of the medium. Without nitrate, the results outperform the ones from the unmodified cascade. This observation aligns with extant literature documenting that nitrogen starvation can instigate an elevation in the production of specific high-value compounds [27,29,30,31,32]. While the STYs for Chlorophylls only reached around 2–5% higher levels, Lutein with 11.16%, β-carotene with 48.95%, EPS with 82.96%, and GLA with in total 26.16% clearly reached higher levels. The results from both cascades, particularly the extended cascade with HFM, indicate the setup’s potential. The increase in specific HVP concentration and STYs are connected to a multitude of successive positive consequences. The value of the algae is increased due to the higher product content.
Furthermore, as demonstrated for Run 2, the HVPs were produced faster than the STYs indicated. The membrane utilization eases the downstream process after the cultivation, as the biomass concentrations are higher. Furthermore, downstream costs are reduced as the biomass has higher product content; thus, fewer algae need to be dried, broken up, and extracted for the exact product quantities. The filtrated permeate stream can be recycled, reducing costs for cultivation or discharge. For example, according to estimates made by Molina et al., the downstream processing for pure EPA as a pure substance makes up to 60% of the total arising costs. Biomass production in tubular reactor systems is only with the remaining 40% of the costs of EPA [33]. Therefore, increasing the amount of product within the biomass is a very successful approach to reduce costs after the cultivation, subsequently following downstream processing.

4. Conclusions

Our study on C. asymmetrica using a chemostat cultivation has provided valuable insights into optimizing process conditions for the production of HVPs. The steady-state conditions in the chemostat allowed us to establish a direct correlation between various process parameters and the content of HVPs in C. asymmetrica. However, it is evident that there is room for improvement in the cultivation process, particularly in bridging the gap between optimal conditions for achieving high specific concentrations and maximizing the STY.
A notable advancement in our research lies in the implementation of a two-stage reactor cascade, which successfully separated the phases of growth and HVP accumulation. This innovative approach led to improvements in several STYs, underscoring the potential of spatially separating these critical stages. Furthermore, the integration of a perfusion reactor in the second stage marked additional progress, emphasizing the importance of the product itself in determining the feasibility of cascade systems.
Looking ahead, there remains significant potential for further exploration and refinement of our findings. The cascade system’s efficacy should be investigated across a broader spectrum of algae species and products to gauge its versatility and applicability. Addressing this gap in knowledge will not only enhance our understanding of algae cultivation dynamics but will also contribute to the development of robust systems for the sustainable production of high-value compounds.
In summary, our study not only highlights the current state of algae cultivation methodologies but also points towards future avenues for research and innovation. By continuously refining and expanding our understanding of these cultivation techniques, we can pave the way for more efficient and sustainable production processes with broader applications in the biotechnology sector.

Author Contributions

Conceptualization, C.L.; Methodology, J.H. and S.-H.J.; Writing—original draft, J.H. and C.L.; Writing—review & editing, S.K., P.T., N.V. and V.V.; Supervision, V.V. and C.L.; Funding acquisition, C.L. All authors have read and agreed to the published version of the manuscript.

Funding

This research was funded by German Federal Ministry of Education and Research (BMBF) grant number [03SF0457].

Institutional Review Board Statement

Not applicable.

Informed Consent Statement

Not applicable.

Data Availability Statement

Data is contained within the article.

Conflicts of Interest

The authors have no financial or other conflict of interest which could influence the content of this manuscript.

References

  1. Tsygankov, A.; Solovchenko, A. “Microalgae as Converters of Light Energy into Biofuels and High-Value Products”: A Session of the Russian Photobiology Society 9th Congress (Shepsi, Krasnodar Region, Russia; September, 12–19, 2021). Biophys. Rev. 2022, 14, 761–763. [Google Scholar] [CrossRef] [PubMed]
  2. Guiry, M.D. How Many Species of Algae Are There? J. Phycol. 2012, 48, 1057–1063. [Google Scholar] [CrossRef] [PubMed]
  3. Borowitzka, M.A. High-Value Products from Microalgae-Their Development and Commercialisation. J. Appl. Phycol. 2013, 25, 743–756. [Google Scholar] [CrossRef]
  4. McBride, R.C.; Lopez, S.; Meenach, C.; Burnett, M.; Lee, P.A.; Nohilly, F.; Behnke, C. Contamination Management in Low Cost Open Algae Ponds for Biofuels Production. Ind. Biotechnol. 2014, 10, 221–227. [Google Scholar] [CrossRef]
  5. Pulz, O. Photobioreactors: Production Systems for Phototrophic Microorganisms. Appl. Microbiol. Biotechnol. 2001, 57, 287–293. [Google Scholar] [CrossRef]
  6. Li, H.B.; Chen, F.; Zhang, T.Y.; Yang, F.Q.; Xu, G.Q. Preparative Isolation and Purification of Lutein from the Microalga Chlorella Vulgaris by High-Speed Counter-Current Chromatography. J. Chromatogr. A 2001, 905, 151–155. [Google Scholar] [CrossRef]
  7. Shah, M.M.R.; Liang, Y.; Cheng, J.J.; Daroch, M. Astaxanthin-Producing Green Microalga Haematococcus Pluvialis: From Single Cell to High Value Commercial Products. Front. Plant Sci. 2016, 7, 531. [Google Scholar] [CrossRef] [PubMed]
  8. Barbosa, M.J.; Zijffers, J.W.; Nisworo, A.; Vaes, W.; van Schoonhoven, J.; Wijffels, R.H. Optimization of Biomass, Vitamins, and Carotenoid Yield on Light Energy in a Flat-Panel Reactor Using the A-Stat Technique. Biotechnol. Bioeng. 2005, 89, 233–242. [Google Scholar] [CrossRef]
  9. Zijffers, J.W.F.; Schippers, K.J.; Zheng, K.; Janssen, M.; Tramper, J.; Wijffels, R.H. Maximum Photosynthetic Yield of Green Microalgae in Photobioreactors. Mar. Biotechnol. 2010, 12, 708–718. [Google Scholar] [CrossRef]
  10. Shin, W.S.; Lee, H.; Sung, M.G.; Hwang, K.T.; Jung, S.M.G.; Kwon, J.H. Enrichment as a Screening Method for a High-Growth-Rate Microalgal Strain under Continuous Cultivation System. Biotechnol. Bioprocess Eng. 2016, 21, 268–273. [Google Scholar] [CrossRef]
  11. Lee, Y.-K.; Shen, H. Basic Culturing Techniques. In Handbook of Microalgal Culture; Blackwell Publishing Ltd.: Oxford, UK, 2007; pp. 40–56. [Google Scholar]
  12. Markou, G.; Nerantzis, E. Microalgae for High-Value Compounds and Biofuels Production: A Review with Focus on Cultivation under Stress Conditions. Biotechnol. Adv. 2013, 31, 1532–1542. [Google Scholar] [CrossRef] [PubMed]
  13. Panis, G.; Carreon, J.R. Commercial Astaxanthin Production Derived by Green Alga Haematococcus Pluvialis: A Microalgae Process Model and a Techno-Economic Assessment All through Production Line. Algal Res. 2016, 18, 175–190. [Google Scholar] [CrossRef]
  14. Sarada, R.; Tripathi, U.; Ravishankar, G.A. Influence of Stress on Astaxanthin Production in Haematococcus Pluvialis Grown under Different Culture Conditions. Process Biochem. 2002, 37, 623–627. [Google Scholar] [CrossRef]
  15. Lemoine, Y.; Schoefs, B. Secondary Ketocarotenoid Astaxanthin Biosynthesis in Algae: A Multifunctional Response to Stress. Photosynth. Res. 2010, 106, 155–177. [Google Scholar] [CrossRef]
  16. Ludwig, W.; Ludwig, W. Protozoa. Flagellata. In Das Rechts-Links-Problem im Tierreich und Beim Menschen; Springer: Berlin/Heidelberg, Germany, 1932; pp. 62–71. [Google Scholar]
  17. Hahm, J.; Bauer, A.; Jung, S.-H.; Zell, N.; Boßle, F.; Buchholz, R.; Lindenberger, C. Process Parameter Screening for the Microalga Chlamydomonas Asymmetrica in Batch and Turbidostat Cultivations. Chemie Ing. Tech. 2021, 93, 1565–1572. [Google Scholar] [CrossRef]
  18. Jung, S.-H.; Zell, N.; Boßle, F.; Teipel, U.; Rauh, C.; McHardy, C.; Lindenberger, C. Influence of Process Operation on the Production of Exopolysaccharides in Arthrospira Platensis and Chlamydomonas Asymmetrica. Front. Sustain. Food Syst. 2022, 6, 883069. [Google Scholar] [CrossRef]
  19. Watanabe, M.; Kasai, F.; Kawachi, M.; Erata, M.; Yumoto, K.; Sato, M. NIES-Collection List of Strains, 8th Edition. Jpn. J. Phycol 2009, 57, 1–350. [Google Scholar]
  20. Taucher, J.; Baer, S.; Schwerna, P.; Hofmann, D.; Hümmer, M.; Buchholz, R.; Becker, A. Cell Disruption and Pressurized Liquid Extraction of Carotenoids from Microalgae. J. Thermodyn. Catal. 2016, 7, 158. [Google Scholar] [CrossRef]
  21. Lewis, T.; Nichols, P.D.; McMeekin, T.A. Evaluation of Extraction Methods for Recovery of Fatty Acids from Lipid-Producing Microheterotrophs. J. Microbiol. Methods 2000, 43, 107–116. [Google Scholar] [CrossRef]
  22. Khoomrung, S.; Chumnanpuen, P.; Jansa-Ard, S.; Nookaew, I.; Nielsen, J. Fast and Accurate Preparation Fatty Acid Methyl Esters by Microwave-Assisted Derivatization in the Yeast Saccharomyces Cerevisiae. Appl. Microbiol. Biotechnol. 2012, 94, 1637–1646. [Google Scholar] [CrossRef]
  23. DuBois, M.; Gilles, K.A.; Hamilton, J.K.; Rebers, P.A.; Smith, F. Colorimetric Method for Determination of Sugars and Related Substances. Anal. Chem. 1956, 28, 350–356. [Google Scholar] [CrossRef]
  24. Takache, H.; Pruvost, J.; Cornet, J.-F. Kinetic Modeling of the Photosynthetic Growth of Chlamydomonas Reinhardtii in a Photobioreactor. Biotechnol. Prog. 2012, 28, 681–692. [Google Scholar] [CrossRef]
  25. Bonente, G.; Pippa, S.; Castellano, S.; Bassi, R.; Ballottari, M. Acclimation of Chlamydomonas Reinhardtii to Different Growth Irradiances. J. Biol. Chem. 2012, 287, 5833–5847. [Google Scholar] [CrossRef]
  26. Xie, S.-R.; Liang, M.-H.; Yan, B.; Jiang, J.-G. Creatinine Combined with Light Increases the Contents of Lutein and β-Carotene, the Main Carotenoids of Dunaliella Bardawil. Enzyme Microb. Technol. 2021, 151, 109913. [Google Scholar] [CrossRef]
  27. Solovchenko, A.E.; Khozin-Goldberg, I.; Didi-Cohen, S.; Cohen, Z.; Merzlyak, M.N. Effects of Light Intensity and Nitrogen Starvation on Growth, Total Fatty Acids and Arachidonic Acid in the Green Microalga Parietochloris Incisa. J. Appl. Phycol. 2008, 20, 245–251. [Google Scholar] [CrossRef]
  28. Hoober, J.K. The Chlamydomonas Sourcebook. A Comprehensive Guide to Biology and Laboratory Use. Elizabeth H. Harris. Academic Press, San Diego, CA, 1989. Xiv, 780 Pp., Illus. $145. Science 1989, 246, 1503–1504. [Google Scholar] [CrossRef] [PubMed]
  29. Kroen, W.K.; Rayburn, W.R. Influence of Growth Status and Nutrients on Extracellular Polysaccharide Synthesis by the Soil Alga Chlamydomonas Mexicana (Chlorophyceae). J. Phycol. 1984, 20, 253–257. [Google Scholar] [CrossRef]
  30. Kandilian, R.; Taleb, A.; Heredia, V.; Cogne, G.; Pruvost, J. Effect of Light Absorption Rate and Nitrate Concentration on TAG Accumulation and Productivity of Parachlorella Kessleri Cultures Grown in Chemostat Mode. Algal Res. 2019, 39, 101442. [Google Scholar] [CrossRef]
  31. Mogany, T.; Bhola, V.; Ramanna, L.; Bux, F. Photosynthesis and Pigment Production: Elucidation of the Interactive Effects of Nutrients and Light on Chlamydomonas Reinhardtii. Bioprocess Biosyst. Eng. 2022, 45, 187–201. [Google Scholar] [CrossRef] [PubMed]
  32. Kamalanathan, M.; Pierangelini, M.; Shearman, L.A.; Gleadow, R.; Beardall, J. Impacts of Nitrogen and Phosphorus Starvation on the Physiology of Chlamydomonas Reinhardtii. J. Appl. Phycol. 2016, 28, 1509–1520. [Google Scholar] [CrossRef]
  33. Molina Grima, E.; Belarbi, E.H.; Acién Fernández, F.G.; Robles Medina, A.; Chisti, Y. Recovery of Microalgal Biomass and Metabolites: Process Options and Economics. Biotechnol. Adv. 2003, 20, 491–515. [Google Scholar] [CrossRef] [PubMed]
Figure 1. Schematic basic structure of chemostat and two-stage cascade. All different reactors were operated at controlled aeration and temperature levels. pH, DO and T sensors were attached to the reactors. The following components were assembled: (1) sterile feed tank, (2) medium feed pump, (3) single continuous reactor/ first cascade step, (4) waste pump of single continuous reactor/ transfer pump to stage 2, (5) algae waste tank, (6) permeate flow control pump, (7) hollow fiber membrane for perfusion, (8) hollow fiber membrane feed pump, (9) stage 2 waste pump, (10) reactor stage two, (11) nitrate feed pump for stage 2, (12) waste tank second stage, (13) nitrate storage for second stage.
Fermentation 10 00038 g001
Figure 2. (A) Nitrate concentration (▲), X (■), and STY (●) plotted against the dilution rate at 806 µmol·m−2·s−1; (B) maximum OD (▲), maximum X (●), and maximum STY (■) plotted over the PFD; (C) concentrations of Chlorophyll a (CHA) (), Chlorophyll b (CHB) (), LU (), and BC () over dilution rate at 806 µmol·m−2·s−1; (D) STYs of CHA (), (CHB) (), LU (), and BC () over dilution rate at 806 µmol·m−2·s−1.
Fermentation 10 00038 g002
Figure 3. Maximum specific concentrations (triangle) and STYs (circles) of the HVPs Chlorophyll b (A), Chlorophyll a (B), Lutein (C), β-carotene (D), GLA (E), and EPS (F) derived from variation in the PFD.
Fermentation 10 00038 g003
Figure 4. Graphical comparison of the differences in specific concertation and STYs of all HVPs between the first and second stages in Runs 1, 2, and 3. Positive values indicate higher values within the second stage, negative ones indicate higher levels in the first stage. The differences in HVP accumulation ΔcHVP are indicated for Chlorophyll a () (subfigures AC), Chlorophyll b () (subfigures DF), Lutein () (subfigures GI), β-carotene () (subfigures JL), EPS () (subfigures MO), and GLA () (subfigures PR). Furthermore, the differences in the corresponding STYHVP are plotted for Chlorophyll a (), Chlorophyll b (), Lutein (), β-carotene (), EPS (), and GLA (). Cascade settings for the different runs can be taken from Table 1.
Fermentation 10 00038 g004
Figure 5. Relative changes of HVP concentrations (A) and STYs (B) in the modified cascade for Run 2 (black) and Run 3 (white).
Fermentation 10 00038 g005
Table 1. Parameter variations in stage one (1) and stage two (2) of the cascade system for C. asymmetrica.
PFD (1)
[µmol·m−2·s−1]
PFD (2)
[µmol·m−2·s−1]
V (2)
[mL]
Nitrate Addition (2)
Run 165973200–800No
Run 2131973200–900No
Run 3131973200–900Yes
Disclaimer/Publisher’s Note: The statements, opinions and data contained in all publications are solely those of the individual author(s) and contributor(s) and not of MDPI and/or the editor(s). MDPI and/or the editor(s) disclaim responsibility for any injury to people or property resulting from any ideas, methods, instructions or products referred to in the content.

