Article

Improving the Synthesis of Odd-Chain Fatty Acids in the Oleaginous Yeast Yarrowia lipolytica

by
Nour Tabaa Chalabi
1,
Sally El Kantar
1,
Camilla Pires De Souza
2,
Anissa Khelfa
1,
Jean-Marc Nicaud
2,
Espérance Debs
3,
Nicolas Louka
4 and
Mohamed Koubaa
1,*
1
Université de Technologie de Compiègne, ESCOM, TIMR (Integrated Transformations of Renewable Matter), Centre de Recherche Royallieu, CS 60319, CEDEX, 60203 Compiègne, France
2
Micalis Institute, Institut National de Recherche pour l’Agriculture, l’Alimentation et l’Environnement (INRAE), AgroParisTech, Université Paris-Saclay, 78350 Jouy-en-Josas, France
3
Department of Biology, Faculty of Arts and Sciences, University of Balamand, P.O. Box 100, Tripoli 1300, Lebanon
4
Centre d’Analyses et de Recherche, Unité de Recherche Technologies et Valorisation Agro-alimentaire, Faculté des Sciences, Université Saint-Joseph de Beyrouth, Mar Roukos, Dekwaneh, P.O. Box 1514, Riad El Solh, Beirut 1107 2050, Lebanon
*
Author to whom correspondence should be addressed.
Fermentation 2024, 10(12), 597; https://doi.org/10.3390/fermentation10120597
Submission received: 15 October 2024 / Revised: 13 November 2024 / Accepted: 19 November 2024 / Published: 22 November 2024

Abstract

:
(1) Background: Odd-chain fatty acids (OCFAs) have garnered attention for their potential health benefits and unique roles in various biochemical pathways. Yarrowia lipolytica, a versatile yeast species, is increasingly studied for its capability to produce OCFAs under controlled genetic and environmental conditions. However, optimizing the synthesis of specific OCFAs, such as cis-9-heptadecenoic acid (C17:1), remains a challenge. (2) Methods: The gene coding for the Δ9 fatty acid desaturase, YlOLE1, and the gene coding the diacylglycerol O-acyltransferase 2, YlDGA2, were overexpressed in Y. lipolytica. With the engineered strain, the main goal was to fine-tune the production of OCFA-enriched lipids by optimizing the concentrations of sodium propionate and sodium acetate used as precursors for synthesizing odd- and even-chain fatty acids, respectively. (3) Results: In the strain overexpressing only YlDGA2, no significant changes in fatty acid composition or lipid content were observed compared to the control strain. However, in the strain overexpressing both genes, while no significant changes in lipid content were noted, a significant increase was observed in OCFA content. The optimal conditions for maximizing the cell density and the C17:1 content in lipids were found to be 2.23 g/L of sodium propionate and 17.48 g/L of sodium acetate. These conditions resulted in a cell density (optical density at 600 nm) of 19.5 ± 0.46 and a C17:1 content of 45.56% ± 1.29 in the culture medium after 168 h of fermentation. (4) Conclusions: By overexpressing the YlOLE1 gene and optimizing the concentrations of fatty acid precursors, it was possible to increase the content of OCFAs, mainly C17:1, in lipids synthesized by Y. lipolytica.

1. Introduction

Finding alternatives to conventional petroleum-derived fuels has become imperative in a world where the call for sustainable and environmentally friendly practices is increasingly urgent [1]. The growing interest in a greener and cleaner ecosystem has influenced a revolution in the lipid-derived oleochemical field. Among the multiple possibilities, microbial oils have risen as a promising substitution, presenting an exceptional solution to the global quest for sustainable energy sources [2,3,4].
Microbial oils are lipids and fatty acid-derived products synthesized by microorganisms such as bacteria, yeasts, and algae through fermentation processes [5]. Microbial oil production often requires fine-tuning culture conditions, nutrient availability, and various other factors to boost the accumulation of lipids [6,7,8,9]. Among the several microorganisms studied, Yarrowia lipolytica, an oleaginous yeast, has emerged as one of the most promising for lipid production [10,11]. Through diverse metabolic engineering approaches, it can accumulate high lipid content in its biomass, offering a potential alternative to fossil resources [12]. This model organism is considered non-pathogenic and is Generally Recognized As Safe (GRAS) by the American Food and Drug Administration (FDA). It requires strictly aerobic conditions, a temperature around 30 °C, and is adaptable to a mildly acidic pH range of 5.5–6.5. In addition, Y. lipolytica demonstrates remarkable versatility by assimilating a diverse range of substrates. It is reported to valorize a broad range of cheap and renewable feedstocks including sugars, volatile fatty acids, alkanes, and municipal organic wastes [13,14,15]. Moreover, mono-, di-, and polysaccharides that Y. lipolytica cannot assimilate naturally can be processed by either introducing heterologous enzymes (e.g., SUC2 from Saccharomyces cerevisiae for sucrose metabolism or glucoamylase from Aspergillus niger for starch metabolism) or awakening native enzymes (e.g., XK for xylose metabolism) in Y. lipolytica [16,17,18]. This substrate flexibility offers an environmentally friendly approach to valorizing raw materials to high-value chemicals with a reduced fossil carbon footprint and improved process benefits [19].
The metabolic engineering of Y. lipolytica also extends to the production of high-value-added lipids, specifically odd-chain fatty acids (OCFAs), which are not commonly found in the yeast’s natural products [20,21]. OCFAs emerge as a distinctive solution in the field of lipid-derived oleochemicals, promising sustainable and economically feasible production. They are of great interest due to their unique structural and functional properties, which differ significantly from even-chain fatty acids. They serve as valuable precursors in the synthesis of high-value chemicals, such as flavors, fragrances, and pharmaceuticals, offering a pathway to products that are otherwise difficult to obtain from traditional sources. Additionally, OCFAs have been shown to possess anti-inflammatory and antimicrobial properties, making them promising for therapeutic applications [22].
OCFA synthesis is initiated by supplementing the media with a three-carbon atom substrate (e.g., sodium propionate), which is converted into propionyl-CoA that condensates with a malonyl-CoA to yield 3-oxovaleryl-ACP, a five-carbon (C5) compound serving as the starting point for OCFA synthesis. Several studies reported that propionate supplementation has led to an increase in lipid yields [20,23]. However, inhibitory effects of this substrate were reported for cell growth, particularly when the concentration exceeded 5 g/L [24,25]. Thus, it is important to balance between acetyl-CoA and propionyl-CoA precursor pools to find the optimal culture conditions and avoid growth inhibition. In addition, it was shown from previous studies that desaturases located in the endoplasmic reticulum play a crucial role in lipid biosynthesis [26,27]. For instance, OLE1 is a Δ9 fatty acid desaturase gene that kickstarts the synthesis of palmitoleic (C16:1) or oleic acid (C18:1), whereas FAD2 is a Δ12 desaturase that introduces a second double bond, leading usually to the formation of linoleic acid (C18:2). Remarkably, the overexpression of OLE1 unexpectedly led to an increased lipid yield in previously engineered strains [28].
In light of these observations, this study aimed to further enhance OCFA synthesis by genetically engineering the Y. lipolytica OCFA-producing strain JMY7877, previously studied [19], and optimizing the concentrations of two key substrates for fatty acid biosynthesis: sodium propionate and sodium acetate.

2. Materials and Methods

2.1. Strains, Plasmids, and Media

The strain JMY7877 previously studied [19] was transformed to integrate a second copy of DGA2 and OLE1 genes from Y. lipolytica (YlDGA2 and YlOLE1, respectively). All strains and plasmids used in this project are described in Table 1 and illustrated in Figure 1. Yeast extract peptone dextrose (YPD)-rich medium was prepared containing yeast extract (10 g/L), peptone (20 g/L), and glucose (20 g/L). Yeast nitrogen base minimal media were prepared containing YNB (1.7 g/L) without amino acids and ammonium sulfate, NH4Cl (5 g/L), and 50 mM KH2PO4-Na2HPO4. To complement strain auxotrophy, 0.1 g/L of uracil and/or leucine was supplemented in the media. Solid media were prepared by adding 15 g/L agar.
Standard molecular biology techniques were performed as previously described [29]. For gene overexpression, plasmids were prepared by NotI digestion and transformed into Y. lipolytica strains using the lithium acetate method, as described previously [30]. Restriction enzymes were obtained from New England Biolabs, PCR amplification was performed with Promega GoTaq DNA polymerases, and plasmids were purified with a Macherey-Nagel Plasmid Miniprep Kit. YlOLE1 and YlDGA2 gene integration were confirmed via colony PCR using the primers 5′-CTGTCGAGGGCTCCATCCGATG-3′ and 5′-CTAAGCAGCCATGCCAGACATAC-3′, and 5′-TCTGGAATCTACGCTTGTTCAG-3′ and 5′-ATAAGATTGAGACCGTTCTGG-3′, respectively.

2.2. Fermentation Process

2.2.1. Preparation of Stock Cell Culture

To prepare a stock cell culture for the JMY9178 strain, culture was performed in a 500 mL Erlenmeyer flask containing 100 mL of a medium composed of sucrose (20 g/L), yeast extract (10 g/L), and peptone (20 g/L), along with Na2HPO4 (0.05 M) and KH2PO4 (0.05 M) used as pH buffers to maintain a pH of ≈6. All components were previously prepared and autoclaved in an HMC HV-110L autoclave (HMC Europe GmbH, Tüßling, Germany) for 20 min at 121 °C to ensure sterility.
The medium was inoculated with 2 mL of a previously prepared stock solution of the strain JMY9178. Subsequently, the flask was placed in a shaker (New Brunswick Scientific, Edison, NJ, USA) set at 28 °C, with agitation maintained at 170 rpm for 24 h. Following this incubation period, 1 mL of cell culture was combined with 1 mL of a 50% sterile solution of pure glycerol (w/v) and preserved in cryotubes at −80 °C.

2.2.2. Culture Media Composition

The fermentation media were composed of all components listed in Table 2. Sugar beet molasses (≈800 g/L sucrose, Tereos Company, Origny-Sainte-Benoite, France) and crude glycerol (≈80% purity, SAS PIVERT, Venette, France) were used in this study as low-cost substrates for fermentation. Based on the previously published paper, the concentrations of sugar beet molasses and crude glycerol were set at 20 g/L and 30 g/L, respectively [19]. The medium was supplemented with yeast extract and ammonium chloride as organic and inorganic nitrogen sources, respectively (Table 2). Both components allowed a controlled carbon-to-nitrogen (C/N) ratio. Excessive nitrogen concentration could divert nutritional resources toward biomass growth rather than lipid accumulation [31]. Sodium acetate and sodium propionate used as precursors of acetyl-CoA and propionyl-CoA, respectively, were added at different concentrations to determine the experimental domain for the design of experiments approach. Na2HPO4 and KH2PO4 served as pH buffers, maintaining the pH ≈ 6. Distilled water was then added to fulfill the volume requirement of the media.

2.2.3. Fermentation Conditions

The fermentation process was performed in 500 mL Erlenmeyer flasks placed in a shaking incubator at 28 °C, 170 rpm agitation, for 168 h. Each flask contained 100 mL of culture medium. The yeast cell growth was monitored by periodically sampling 1 mL from each flask during fermentation. The samples were diluted 20 times with a non-inoculated medium used as blank. The optical density (OD) was then measured over the blank at a wavelength of 600 nm using a spectrophotometer (Thermo BioMate 3, Waltham, MA, USA). At the end of fermentation, 50 mL of the culture medium was used to quantify the dry cell weight (DCW). Accumulated biomass was harvested by centrifugation for 10 min at 4600 rpm. It was then freeze-dried for three days using an Alpha 1-4 LD Plus lyophilizer (Martin Christ, Osterode am Harz, Germany) set at a temperature of −70 °C and a pressure of 0.52 mbar. Dry biomass was subsequently used for lipid extraction and fatty acid quantification.

2.2.4. Optimization of the Concentrations of Fatty Acid Precursors

A central composite experimental design was applied to optimize the concentrations of two variables: sodium acetate (X1, ranging from 15 to 20 g/L) and sodium propionate (X2, ranging from 2 to 3.5 g/L). These experimental domains were selected based on results obtained by varying the concentrations of the precursors. The responses investigated in this experimental design were the maximization of the cell growth (measured by optical density at 600 nm, Y1) and the percentage of C17:1 in lipids (Y2), selected as the primary OCFA synthesized. This design consisted of 22 experiments (4 points from the factorial design and 4 star points, all repeated twice (4 × 2 + 4 × 2 = 16 points)), along with 3 center points (repetitions for statistical analysis) and 3 test points for the validation of the predicted models.
With two variables and 5 levels, the experimental data were fitted to a second-degree regression model represented by Equation (1):
Y= β0 + β1X12X212X1X211X1222X22
In this equation, Y denotes the predicted response, X1 and X2 represent, respectively, the variables 1 and 2, β0 is the constant coefficient, β1 and β2 are the linear coefficients, β12 denotes the interaction term coefficient, and β11 and β22 denote the quadratic effect term coefficients.
Fermentation of the 22 Erlenmeyer flasks corresponding to the runs of the experimental design was performed as mentioned in Section 2.2.3. The two responses (i.e., cell density (OD600nm) and C17:1 content (%)) were recorded for each experiment and entered into NemrodW software (v.2017) for analysis.

2.3. Lipid Extraction and Fatty Acid Analysis

2.3.1. Lipid Extraction from Y. lipolytica Biomass

Lipid quantification was performed as previously demonstrated [32], with slight modifications. Lyophilized biomass obtained at the end of fermentation was ground in a bead miller (Retsch MM400, Haan, Germany) for 3 × 5 min at 30 Hz and then washed by Soxhlet with 250 mL n-hexane for 24 h. After evaporation of n-hexane at 60 °C and reduced pressure using a rotary evaporation system, the lipid content (%) was determined, according to Equation (2).
L i p i d   c o n t e n t   ( % ) = m a s s   o f   r e c o v e r e d   l i p i d s   m a s s   o f   t h e   s a m p l e   × 100
For fatty acid analysis, lipid extraction from Y. lipolytica freeze-dried biomass was performed as previously outlined [19]. Approximately 30 mg of dry biomass were placed into a 2 mL tube with two stainless steel beads (5 mm diameter). Subsequently, 1 mL of a cyclohexane–isopropanol mixture (2:1, v:v) was added to each tube, and the contents were milled for 5 min at 30 Hz using the bead miller Retsch MM400. Afterward, the mixtures were centrifuged for 10 min at 13,500 rpm using a Micro Star 12 centrifuge (VWR, Rosny-Sous-Bois, France), and the resulting supernatants were transferred each to a glass tube. The extraction process was repeated three times by adding 1 mL of cyclohexane–isopropanol, bead-milling the samples, and centrifuging until a total of 3 mL of supernatant was gathered in the glass tube. The resulting volume of supernatants was evaporated under a nitrogen flow at 60 °C, and the collected lipids were subjected to a transesterification reaction.

2.3.2. Preparation and Analysis of Fatty Acid Methyl Esters

Each lipid sample was resuspended in 0.3 mL of toluene (Carlo Erba, Val de Reuil, France), and a 1 mL methanolic HCl (3 M) (Sigma Aldrich, Saint-Quentin-Fallavier, France) was added to each mixture. Following this, the tubes were purged with nitrogen to prevent oxidation and were placed in an 80 °C oven for 2 h. The samples were mixed by vortexing every 30 min. To stop the transesterification reaction, 0.5 mL of sodium bisulfite (5% w:v prepared in water, Acros Organics, Fisher Scientific, Illkirch, France) was introduced, and the tube underwent vortexing for 10 s. The extraction of fatty acid methyl esters (FAMEs) was accomplished by adding 1.7 mL of cyclohexane (Carlo Erba, Val-de-Reuil, France) and vortexing for 1 min. After centrifugation at 2500 rpm for 2 min, 200 μL was withdrawn from the upper organic phase containing FAMEs and transferred to an injection vial. The vial content was then evaporated under a nitrogen flow and reconstituted in 500 μL of cyclohexane for gas chromatography (GC) analysis.
GC analysis of FAMEs was performed using an Agilent Technologies GC apparatus equipped with a capillary column (AIT-50, 50% cyanopropyl-50% methyl polysiloxane, 60 m × 320 μm × 0.25 μm) and coupled to a flame ionization detector (GC-FID Agilent Technologies 7890A, Les Ulis, France). FAMEs were identified compared to a commercial standard mixture (FAME37, Merck, Fontenay Sous Bois, France). The GC oven was initially set at 150 °C for 2 min, then gradually increased to 220 °C at a rate of 1.5 °C/min, and maintained at this temperature for 30 min. Hydrogen was employed to ignite the flame, and helium served as the carrier gas with a flow rate of 30 mL/min. The injector temperature was set at 250 °C and 1 µL of the FAME sample was injected. After a 30 min run, FAME peaks were identified, integrated, and quantified.

2.4. Statistical Analysis

One-way analysis of variance (ANOVA) was used to determine the significant differences using StatPlus V6 software for Macintosh systems.

3. Results and Discussion

3.1. YlOLE1-Overexpressing Strain JMY9178

Previous studies demonstrated that the potential of Y. lipolytica to produce and accumulate OCFAs can be improved by a combinatorial strategy to simultaneously overexpress and delete multiple key genes associated with lipid biosynthesis and degradation, respectively [20,33]. In this work, the gene coding for the Δ9 fatty acid desaturase, YlOLE1, and the gene coding the diacylglycerol O-acyltransferase 2, YlDGA2, were overexpressed. The OLE1 enzyme catalyzes the desaturation of saturated fatty acids by introducing a double bond between the ninth and tenth carbon atoms from the carboxyl end of the fatty acid chain [34], whereas the DGA2 enzyme is recognized as a key component of the lipid pathway by performing the final step of TAG biosynthesis (the incorporation of the third acyl-CoA onto the diacylglycerol backbone) and its storage [35]. In the strain JMY9112 overexpressing only YlDGA2, no significant changes in the fatty acid composition or lipid content were observed, compared to the control strain JMY7877. However, in the strain JMY9178 overexpressing both genes (i.e., YlOLE1 and YlDGA2), significant changes were observed in the OCFA content. Although there was no significant increase in the total lipid content, the C17:1 (%) and the ratio of unsaturated fatty acids to total fatty acids were improved in the strain JMY9178, compared to the control JMY7877, studied previously [19].
For this comparison, microbial cultures were performed under similar conditions. The concentrations of the fatty acid precursors, sodium acetate and sodium propionate, were set at 20 g/L and 5 g/L, respectively. The results showed that in strains JMY7877 and JMY9178, the cell densities (OD600nm) after 168 h of fermentation were 18.90 ± 0.23 and 14.8 ± 1.89, respectively. OCFAs represented 58% ± 4.08 and 67% ± 1.17 of the total fatty acids, while the C17:1 content was 36.45% ± 1.2 and 50.4% ± 0.18, respectively. Overexpression of the YlOLE1 gene significantly increased the content in OCFAs and C17:1 and decreased the cell density. This decrease in cell density was also observed in a previous work where the authors overexpressed OLE3 into Schizochytrium sp. S31 [36]. In addition, the OCFA content was among the highest reported in the literature [37], while the C17:1 content obtained in this study was the highest reported to date.

3.2. Impact of Fatty Acid Precursors on Yeast Cell Growth and OCFA Synthesis

3.2.1. Impact of Sodium Propionate

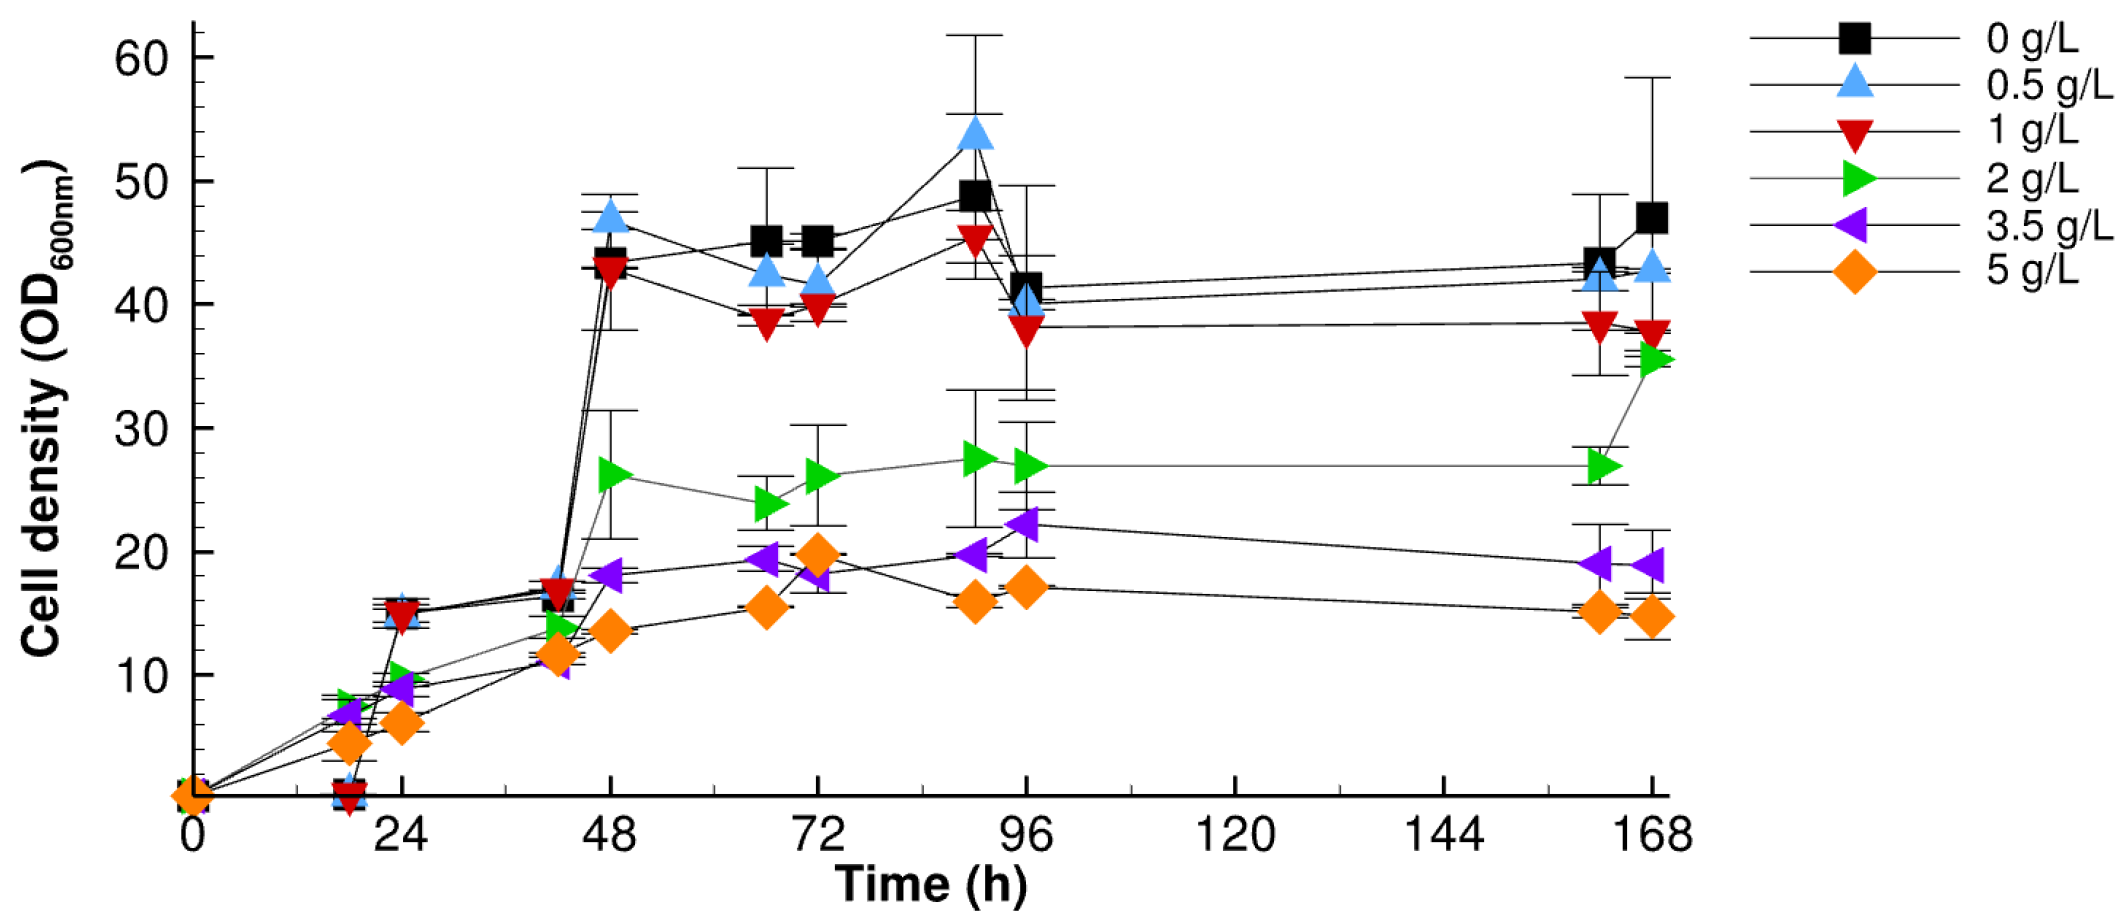
OCFAs are synthesized using various three-carbon precursors. Propionate, for example, has been widely used in microbial production systems. For instance, Candida sp. DBM 2163, Trichosporon cutaneum, and Y. lipolytica have demonstrated the ability to incorporate propionic acid to produce significant amounts of C17:1 [33,38,39]. Other microorganisms, such as Rhodococcus opacus PD630, utilize 1-propanol as a precursor to produce OCFAs [40]. Although required for OCFA synthesis, the literature has reported that propionate may negatively impact Y. lipolytica growth and lipid biosynthesis [24,37,41]. Therefore, the salt form, sodium propionate, has been used in some studies to reduce the toxicity of propionic acid, especially in Y. lipolytica [19,32]. To further reduce the inhibitory effect of this precursor, multiple fermentation conditions were conducted in this work with the YlDGA2/YlOLE1 overexpressing JMY9178 strain. Various concentrations of sodium propionate (0–5 g/L) were tested while maintaining a constant sodium acetate concentration of 20 g/L. The results of these fermentations are shown in Figure 2.
The results indicate that cell density (OD600nm) decreases as the concentration of sodium propionate increases. The lowest cell density (OD600nm = 14.8 ± 1.89) was observed at the highest sodium propionate concentration (5 g/L). An inverse correlation was observed between the sodium propionate concentration and cell density. Additionally, the control medium, which did not contain sodium propionate, achieved the highest cell density after 168 h of fermentation (Figure 2). These observations suggest that sodium propionate exerted an inhibitory effect on cell growth, with higher concentrations inhibiting cell proliferation. However, as previously mentioned, propionate plays a crucial role in OCFA synthesis. These fermentations were conducted to determine the concentration range of propionate that supports both cell growth (biomass accumulation) and the highest content of OCFAs. Therefore, the fatty acid composition was analyzed after 168 h of fermentation. The results obtained are summarized in Table 3.
The GC-FID analysis of the extracted lipids revealed that the engineered strain JMY9178, cultivated in the presence of 2, 3.5, and 5 g/L of sodium propionate, accumulated the highest OCFA content (up to 67.39% ± 1.17 with 5 g/L sodium propionate) relative to the total fatty acids. In contrast, media with lower concentrations of sodium propionate accumulated lower OCFA levels (8.71% ± 0.67, 18.8% ± 1.12, and 30.3% ± 0.76 for 0, 0.5, and 1 g/L sodium propionate, respectively). These results confirm that sodium propionate is essential for OCFA synthesis, as highlighted in recent studies [19,37,42]. Additionally, cis-9-heptadecenoic acid (C17:1) was the major OCFA synthesized by the yeast, with its accumulation increasing as the sodium propionate concentration increased from 0.5 to 5 g/L. Other OCFAs, such as pentadecanoic acid (C15:0), heptadecanoic acid (C17:0), nonadecanoic acid (C19:0), and nonadecenoic acid (C19:1), were produced in smaller amounts.
These findings suggest that while the engineered Y. lipolytica strain JMY9178 can proliferate in media with low sodium propionate concentrations, it requires higher concentrations of sodium propionate to synthesize efficiently OCFAs. To achieve both high cell growth and significant C17:1 production, the concentration range of sodium propionate was identified as 2–3.5 g/L for further optimization with response surface methodology.

3.2.2. Impact of Sodium Acetate

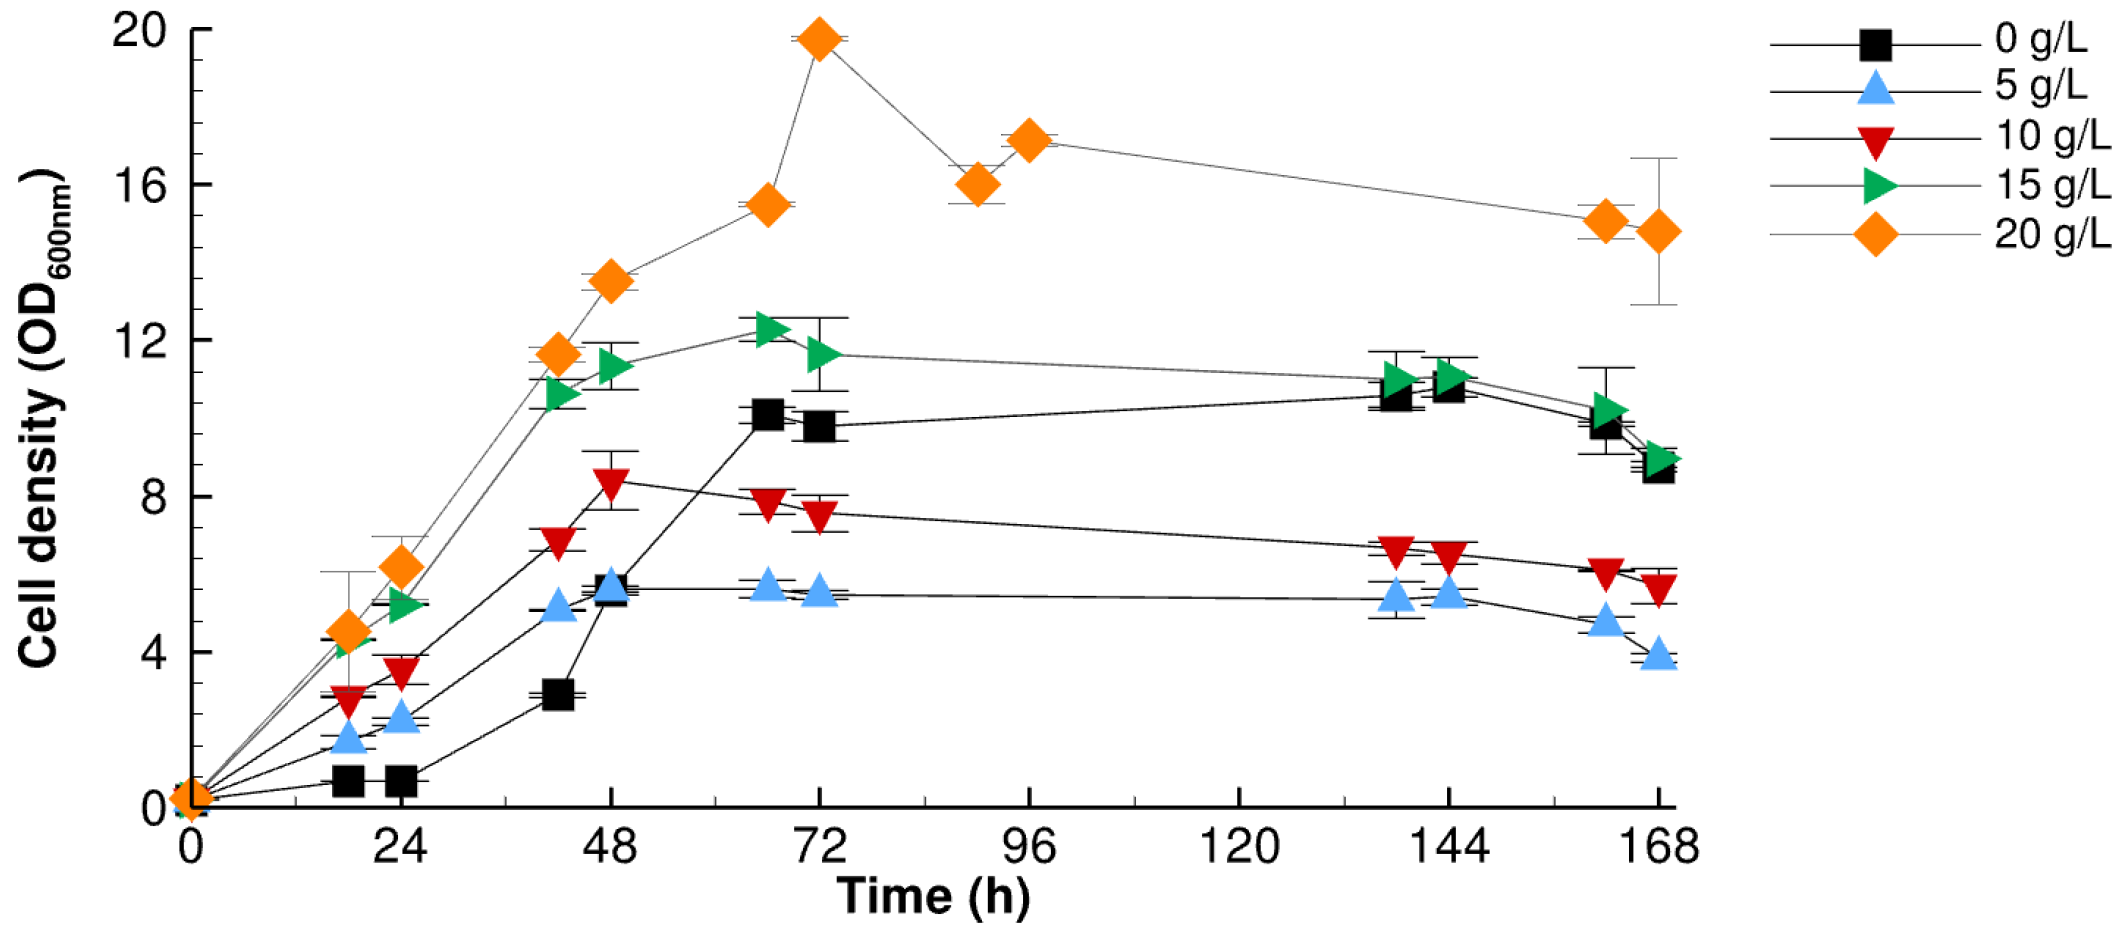
Acetate plays an essential role in yeast cell proliferation and is a precursor of even-chain fatty acids (ECFAs). Its concentration in the culture medium ranged from 0 to 20 g/L, with a fixed concentration of sodium propionate at 5 g/L. Figure 3 shows the cell density measurements (OD600nm) obtained for each experimental condition.
The results indicate that the highest cell growth (OD600nm = 14.8 ± 1.89) was achieved at the highest sodium acetate concentration (20 g/L). In contrast, lower concentrations of sodium acetate (5 g/L) led to a significantly lower cell density (OD600nm = 3.83 ± 0.11). When fermentation was conducted without sodium acetate, the adaptation phase lasted for 24 h before yeast proliferation began, ultimately reaching a cell density that was not significantly different from that obtained with 15 g/L of sodium acetate. Moreover, a significant increase (p < 0.05) in cell density (OD600nm) was observed as the sodium acetate concentration increased from 5 to 20 g/L. These findings demonstrate that the highest cell densities were observed within the sodium acetate concentration range of 15–20 g/L.
Table 4 shows the effect of increasing sodium acetate concentrations on dry cell weight (DCW) and FAME profiles in the engineered strain JMY9178. As the sodium acetate concentration increased from 0 to 20 g/L, both cell growth and fatty acid composition were significantly affected. At 20 g/L sodium acetate concentration, the DCW reached its highest value of 10.5 ± 1.13 g/L, much higher than at lower concentrations, such as with 5 g/L (3.94 ± 0.17 gDCW/L) and 15 g/L (6.85 ± 0.03 gDCW/L) sodium acetate. This indicates that higher sodium acetate concentrations strongly favor cell growth. This observation concurs with the results reported in a previous work, where the dry cell weight increased by increasing the concentration of acetic acid up to a certain level [43].
Regarding the FAME profile, C17:1 remained the major OCFA for all tested sodium acetate concentrations, with percentages ranging from 49.11% ± 0.06 to 53.42% ± 0.69, compared to the total fatty acids. However, as the sodium acetate concentration increased, the content of other OCFAs (i.e., C15:0, C17:0, and C19:0) decreased. In contrast, C19:1 increased from 2.32% ± 0.37 in the absence of sodium acetate to 11.66% ± 1.76 at 15 g/L before decreasing to 8.51% ± 0.49 at 20 g/L.
It could be also observed from Table 4 that as the sodium acetate concentration increases, the synthesis of ECFAs is favored, as evidenced by the higher proportions of C16:0, C18:0, and C18:1 at elevated sodium acetate concentrations. The proportion of saturated fatty acids decreased from 24.15% at 0 g/L to 10.19% at 20 g/L, while the percentage of unsaturated fatty acids increased from 75.81% to 86.69%. This indicates that higher sodium acetate concentrations drive the synthesis of ECFAs, which likely competes with OCFA synthesis.
In terms of total OCFA content, the highest accumulation was observed in the control (73.31%) and at 5 g/L sodium acetate (71%). However, as the sodium acetate concentration increased, the OCFA content gradually decreased to 67.39% at 20 g/L. This reduction in OCFA content with increasing sodium acetate concentration in the culture medium can be attributed to the promotion of ECFA synthesis, over the synthesis of OCFAs.
Taking together the results of cell density (OD600nm), DCW, and OCFA content in lipids, it seems that the concentration of sodium acetate should be optimized in the range of 15–20 g/L, which will be further studied using response surface methodology.

3.3. Optimization of Concentration of FA Precursors

3.3.1. Model’s Validation and Fitting

A central composite design was applied to optimize the culture conditions of Y. lipolytica, focusing on maximizing two responses: the cell density (OD600nm) and the C17:1 content (%) in lipids. The experimental domains of the factors were defined according to the results obtained in Section 3.2.1 and Section 3.2.2. Table 5 displays the experimental conditions along with the corresponding measured responses obtained from the experiments.
The experimental design was validated using the test points corresponding to experiments 20–22. The analysis of the residues showed non-significant differences (p > 0.05) between the measured responses and the predicted ones, indicating the validation of both models (Table 5). The measured responses of the test points were then included in the models provided using NemrodW software as follows (Equations (3) and (4)) (* means significant coefficient):
Ycell density (OD600nm) = 17.269* + 1.911* X1 + 0.926 X1X2 − 3.147* X2 + 0.413 (X1)2 + 2.226* (X2)2
Y% C17:1 = 48.811* + 0.214 X1 + 3.609* X2 − 0.266 X1X2 − 0.855 (X1)2 − 4.607* (X2)2
In addition, the results of the ANOVA for cell density (Table 6) indicate that there are significant differences between the regression model and the residual error, as evidenced by the p-value of 0.0307 (p < 0.05). However, no significant difference is observed between the lack of fit and the pure error (p = 19.7, p > 0.05). This indicates that the model adequately fits the data. For the response C17:1(%), the ANOVA results in Table 6 show a highly significant difference between the regression model and the residual error, with a p-value of less than 0.01. However, unlike the cell density model, there is no significant difference between the lack of fit and the pure error (p = 0.219, p > 0.05), indicating that the model might still need further refinement to better capture the response variability. It should be noted that although the p-value is higher than 5%, this is due to the fact that the pure error for the C17:1 content is very low (indicating a small difference between repetitions). Therefore, it is expected that the model error does not fall below the pure error. In other words, considering this, we can consider the model for C17:1 content as adequate.

3.3.2. Optimal Culture Condition Analyses

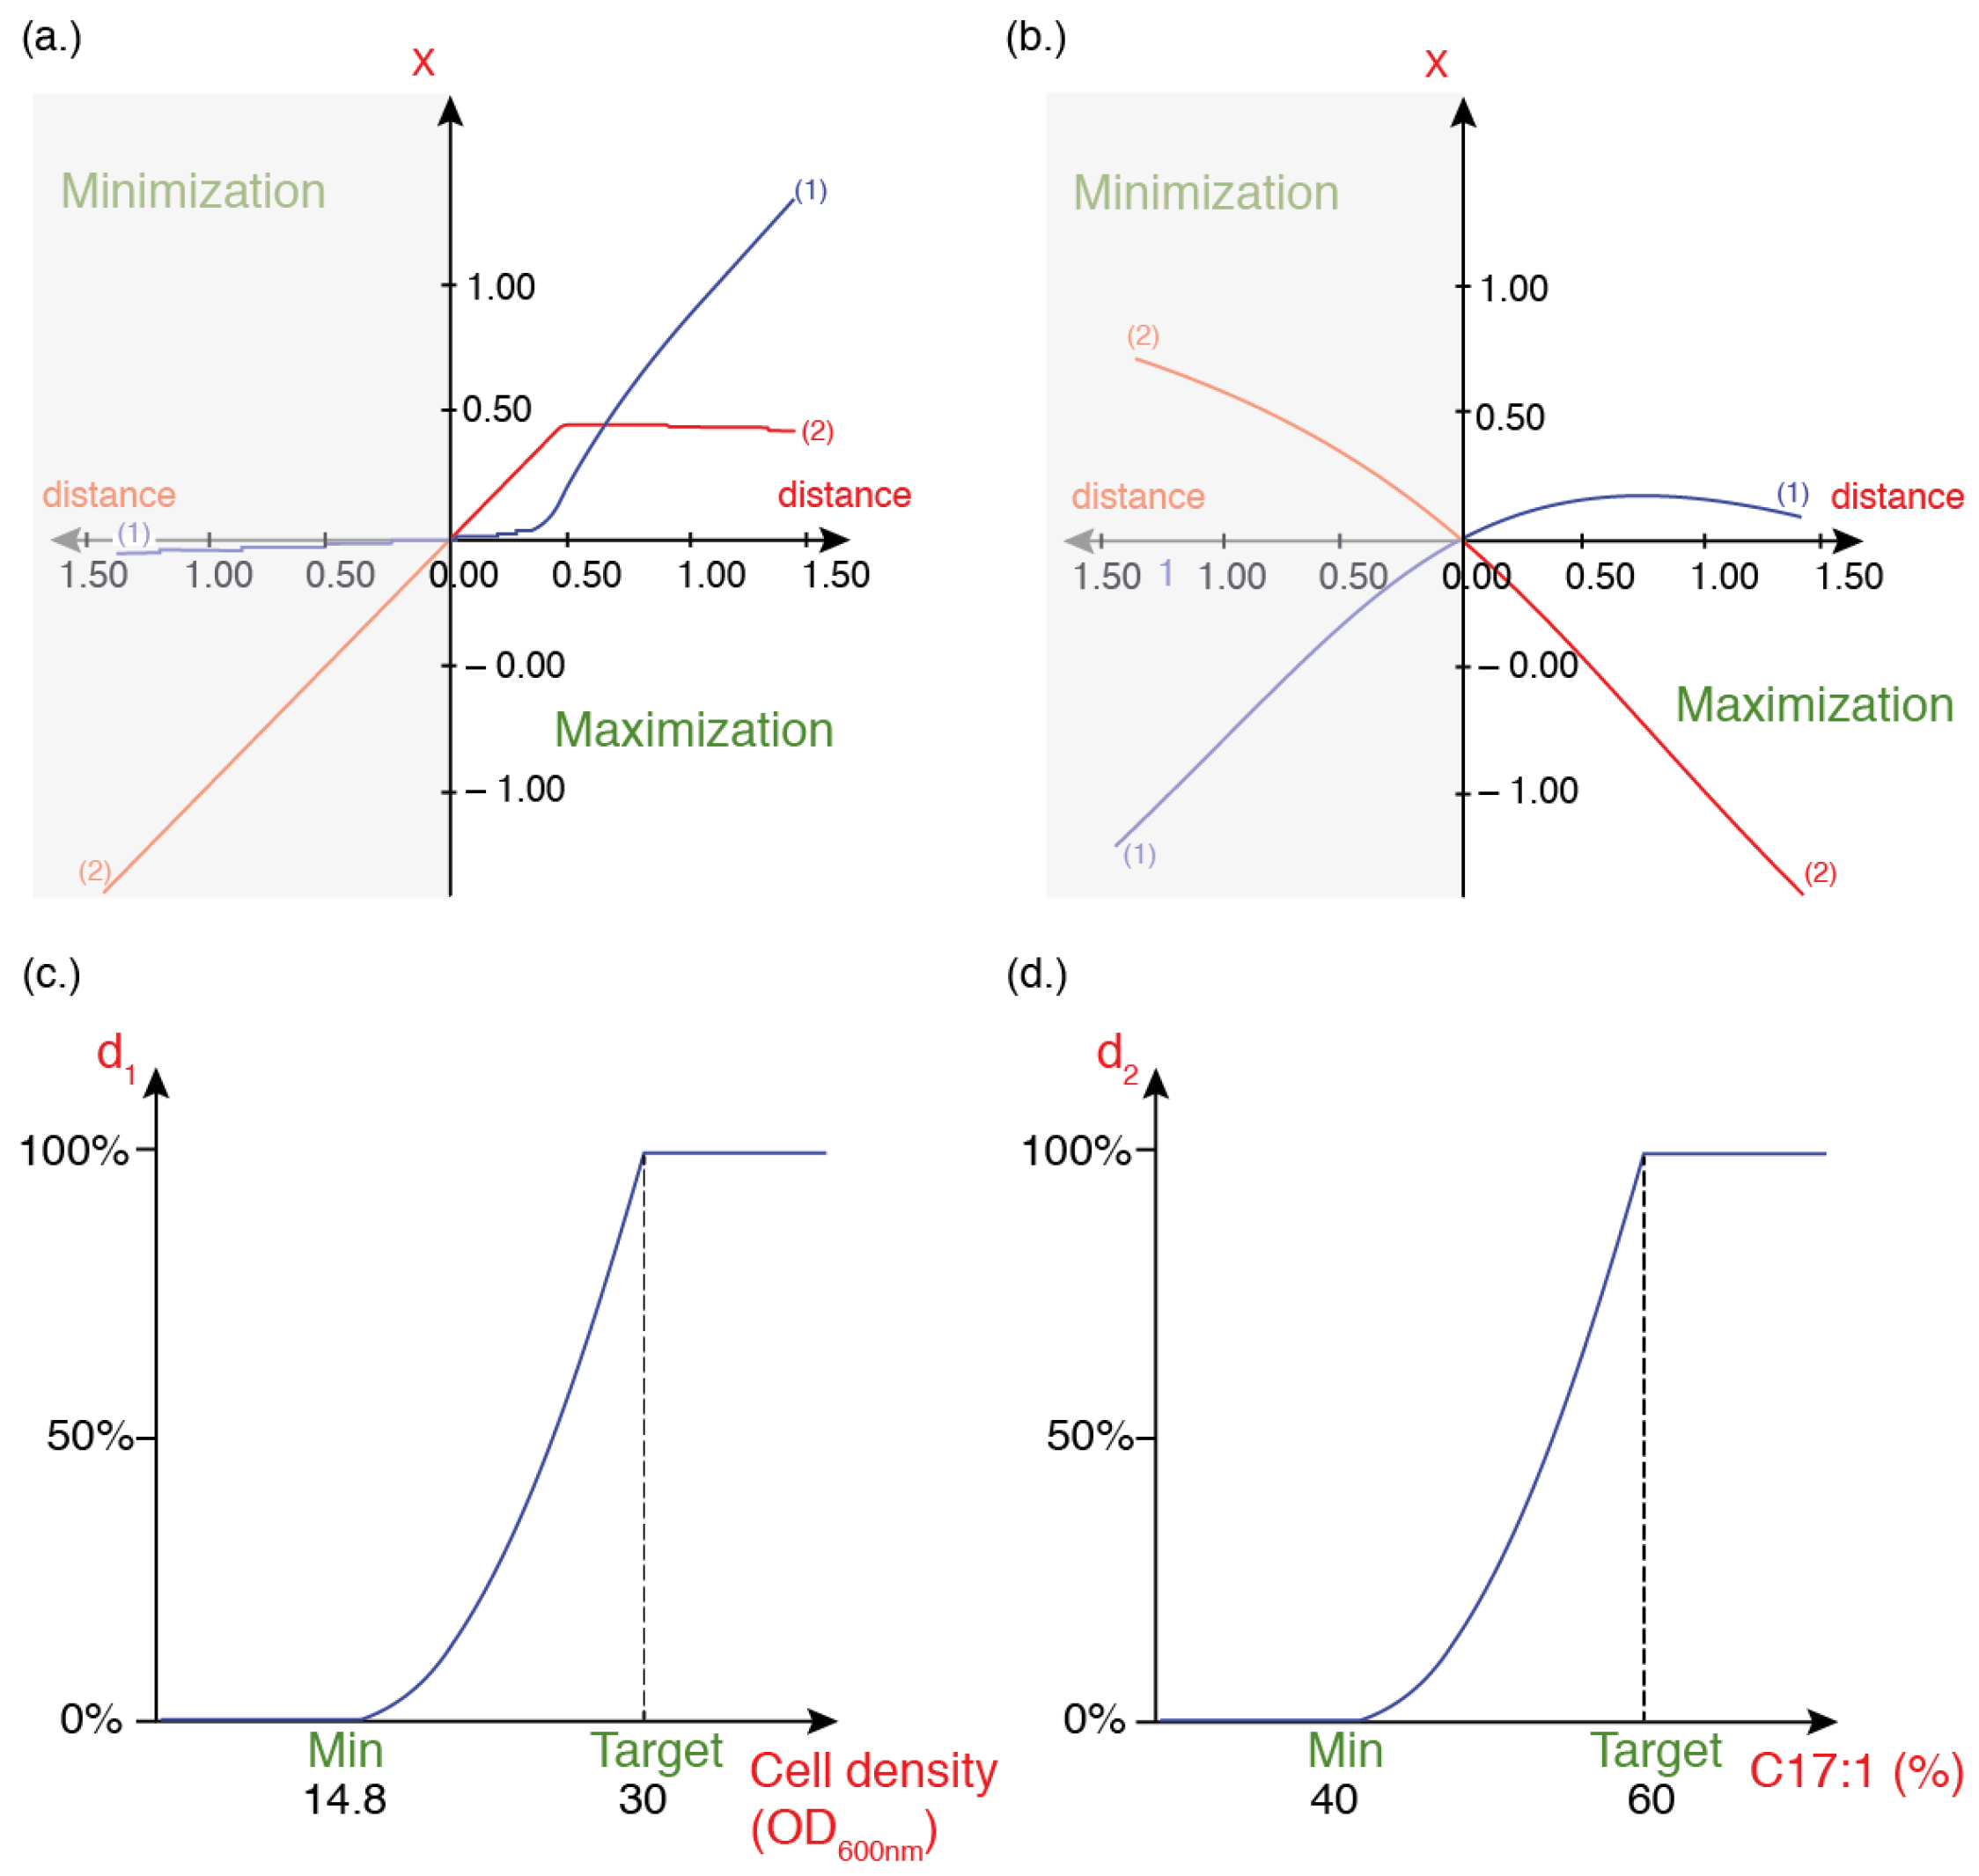
The optimal path refers to the trajectory within the experimental design space that leads to the best combination of factor levels to achieve the desired objectives, here maximizing the responses of cell density (OD600nm) and C17:1 content (%). These paths are derived from the mathematical models (Equations (3) and (4)) built from the experimental data and are used to guide decision-making toward the optimal conditions. Figure 4 illustrates the optimal path for each response provided by NemrodW software as well as the desirability functions, allowing us to find a compromise between the optimal conditions for each model.
Figure 4a illustrates that maximizing cell density requires an increase in the concentration of sodium acetate (factor 1). As more biomass accumulates, the overall lipid content also increases. Additionally, increasing the concentration of sodium propionate up to a certain point near the center value contributes to maximizing the cell density. Beyond a certain concentration of sodium propionate, a slight decrease in the cell density occurs. Conversely, to optimize the C17:1 content (%), an increase in the sodium propionate concentration (factor 2) and a decrease in the sodium acetate concentration (factor 1) is necessary (Figure 4b). As previously mentioned, sodium propionate and sodium acetate are precursors for the synthesis of propionyl-CoA and acetyl-CoA, respectively. Increasing the sodium acetate concentration reduces the OCFA content, despite its importance in constructing the fatty acid backbone and lipid synthesis in cell membranes. On the other hand, increasing the sodium propionate concentration enhances the OCFA content but impairs cell growth due to the toxicity of sodium propionate at higher concentrations. The results of the optimal paths for both responses concur with the conclusions made in Section 3.2.1 and Section 3.2.2.
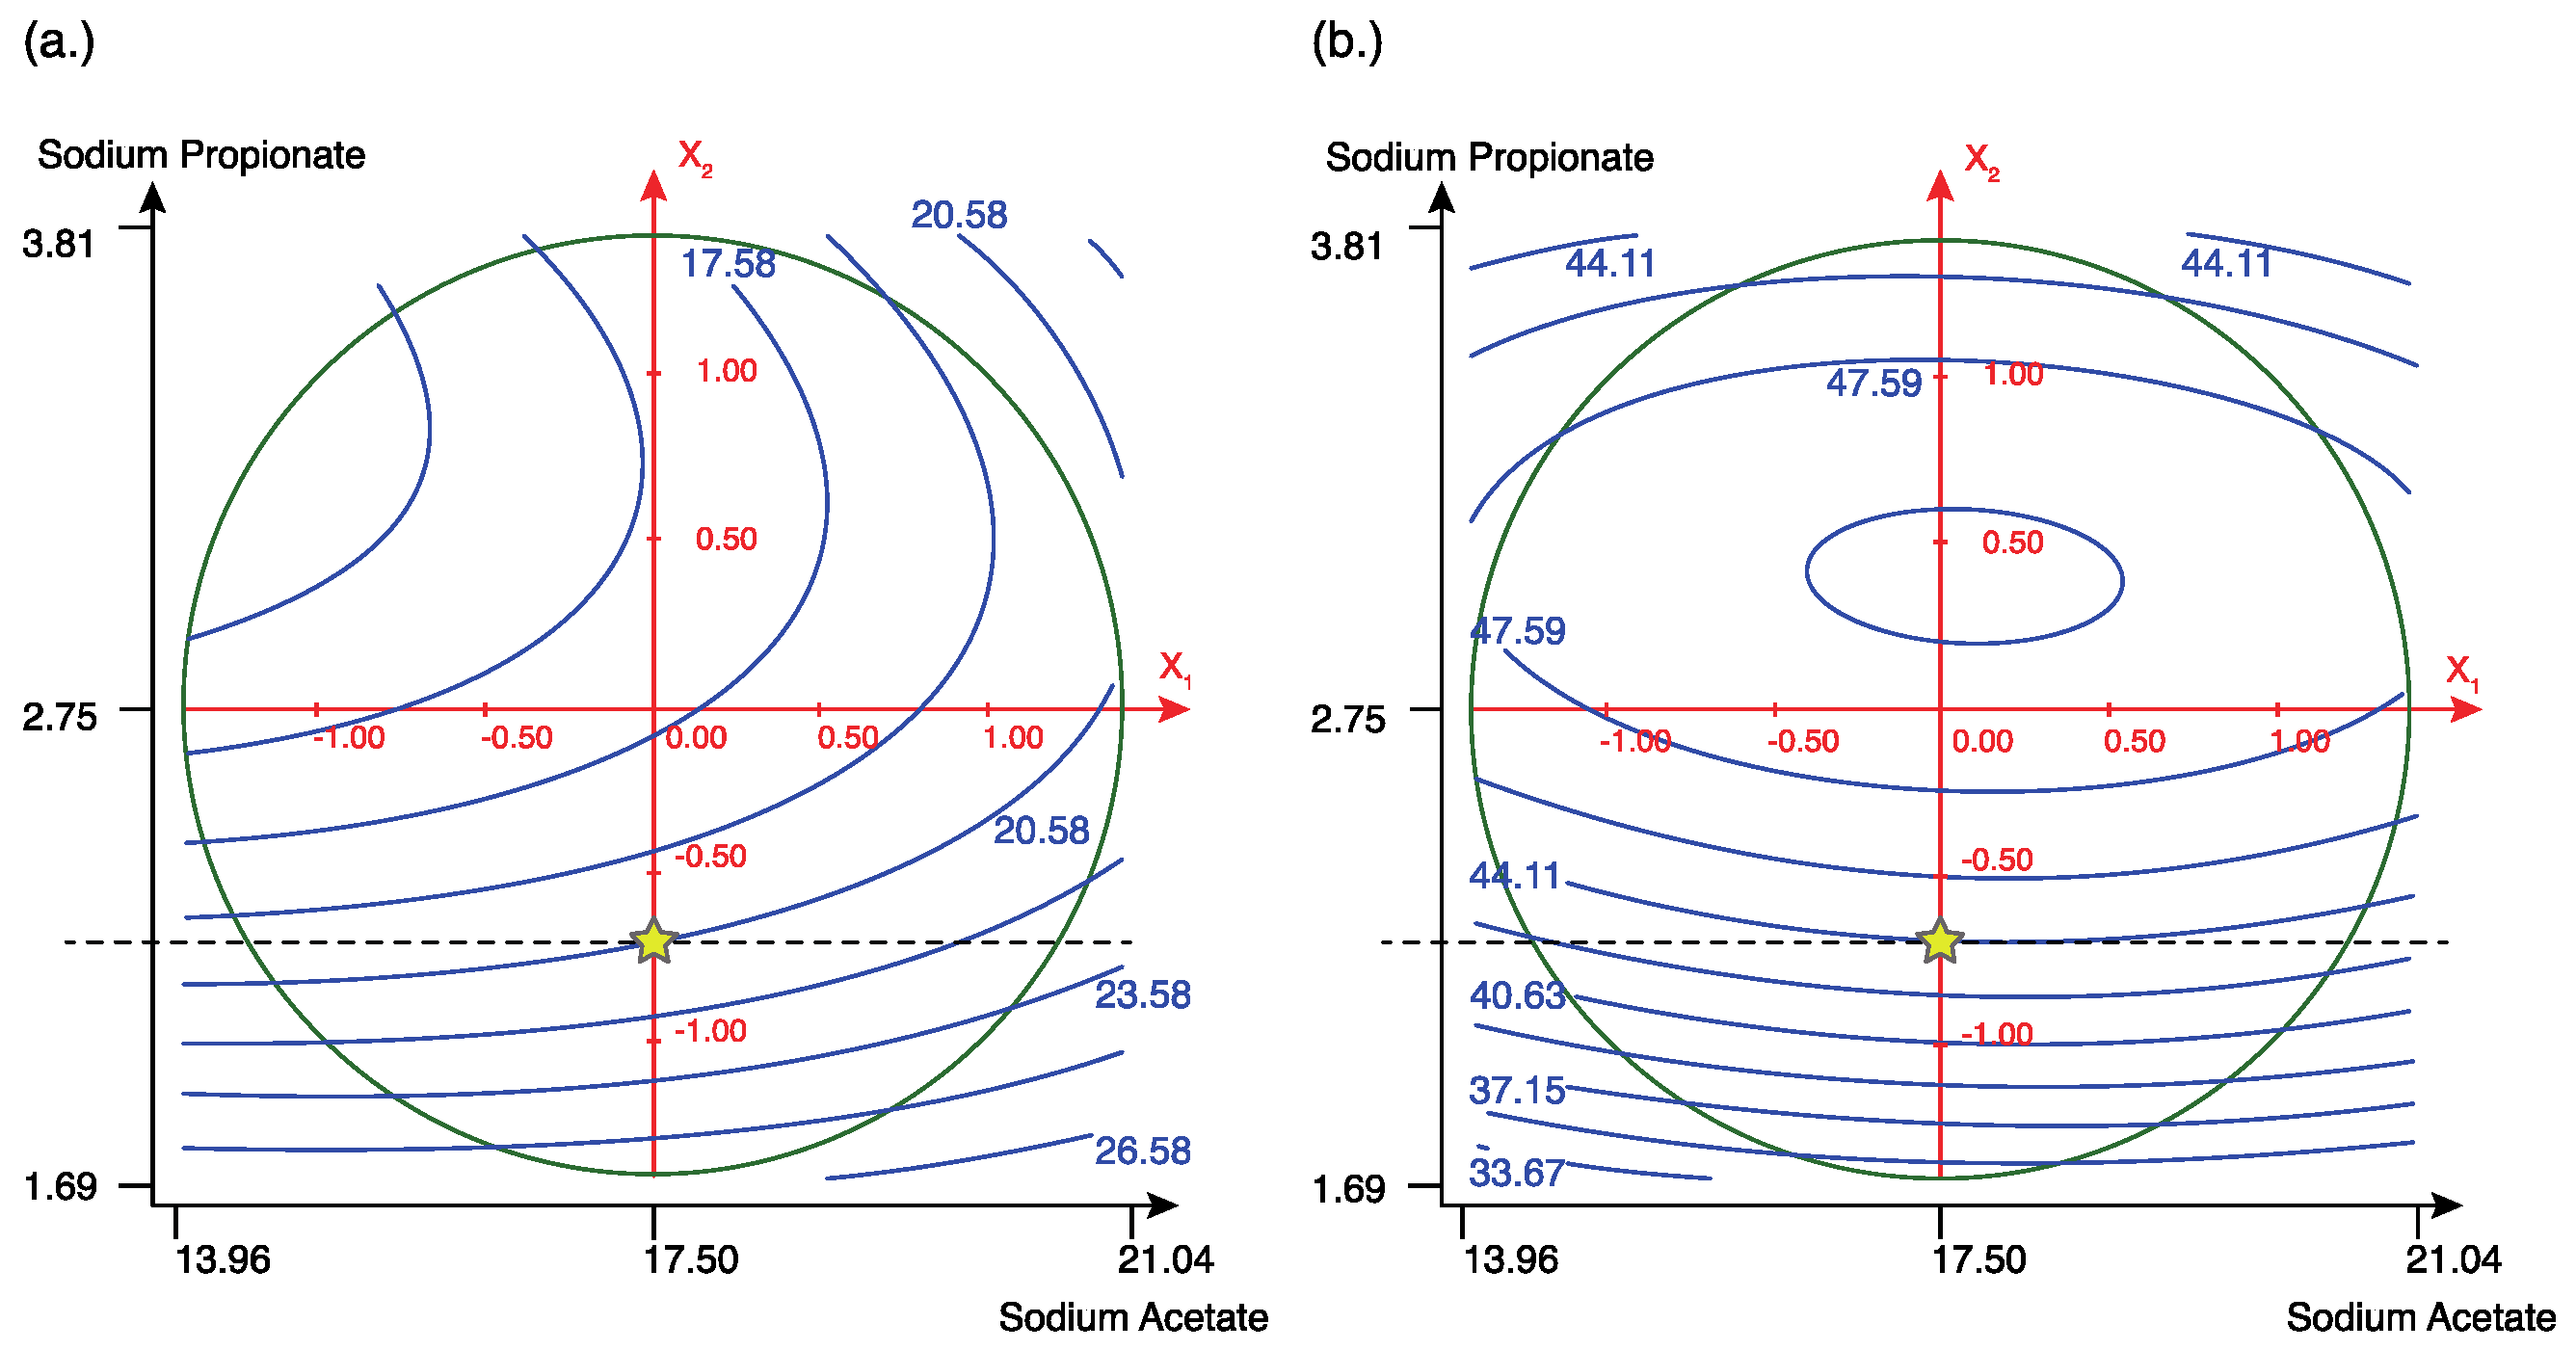
Based on the above-mentioned observations, a compromise must be made to determine the optimal concentrations of the various compounds in the culture medium. For this purpose, desirability functions were used in NemrodW software (Figure 4c,d) to find the optimal conditions that allow for maximizing both responses. According to NemrodW software, the optimal concentrations predicted for sodium acetate and sodium propionate were 21.02 g/L and 2.86 g/L, respectively. However, analyzing the isoresponse curves (contour plots) proved interesting, as they sometimes offer better insights than calculations alone. The results of the isoresponse curves are provided in Figure 5.
By analyzing Figure 5, it was more advantageous from economic considerations to select optimal concentrations better than those obtained through the desirability functions. The predicted concentrations for sodium acetate and sodium propionate from Figure 5 were 17.48 g/L (coded variable X1 = −0.01) and 2.23 g/L (coded variable X2 = −0.699), respectively. Under these conditions, the predicted responses were a cell density (OD600nm) of 20.54 ± 5.69 and a C17:1 content of 44.06% ± 3.64. These concentrations were then tested in Erlenmeyer flasks, yielding results of 19.5 ± 0.46 for cell density and 45.56% ± 1.29 for C17:1 content, which were not significantly different from the predicted values (p > 0.05).
Compared to our results reported previously [19], the optimization of sodium acetate and sodium propionate concentrations in the present study resulted in similar cell growth (19.5 ± 0.46 vs. 18.90 ± 0.23 in [19]) and no significant changes in the lipid content. Notably, the concentrations of sodium acetate and sodium propionate were previously found to be 20 g/L and 5 g/L [19], respectively, whereas they were optimized to 17.48 g/L and 2.23 g/L in the current work.
Furthermore, the overexpression of the YlOLE1 gene increased the C17:1 content from 36.45% ± 1.2 using the strain JMY7877 in [19] to 45.56% ± 1.29 in the present study with the strain JMY9178. This concentration of C17:1 is, to our knowledge, the highest reported so far in the literature using agro-industrial by-products (i.e., sugar beet molasses and crude glycerol) as low-cost substrates. These results not only led to improving cell growth and lipid production but also minimizing substrate consumption, thus contributing to a more cost-efficient process. A further improvement for better efficiency could involve using acetate and propionate—the main volatile fatty acids produced during the acidification step of the methanization process—as substrates for ECFA and OCFA synthesis, as recently reviewed [44].

4. Conclusions

In this study, the Y. lipolytica engineered strain JMY9178 led to an increase in OCFA accumulation. Additionally, the optimization of cell growth and the production of cis-9-heptadecenoic acid (C17:1) was achieved using a central composite design. This optimization focused on varying the concentrations of sodium acetate and sodium propionate, which were used as precursors for fatty acid synthesis. According to the results of the response methodology approach, cell growth corresponding to an OD600nm of 19.5 ± 0.46 and approximately 45.56% ± 1.29 of C17:1 was obtained, while the inhibitory effect of sodium propionate was reduced by lowering its concentration to 2.23 g/L, compared to 5 g/L used in the previous study. Furthermore, the sodium acetate concentration was reduced to 17.48 g/L, compared to 20 g/L in the earlier study. These findings provide valuable insights and support the industrial application of OCFAs, and especially C17:1, paving the way for its potential implementation in larger-scale production processes.

Author Contributions

Conceptualization, M.K. and J.-M.N.; methodology, N.T.C., C.P.D.S. and A.K.; software, N.L. and M.K.; validation, M.K. and N.L.; investigation, M.K., N.T.C. and N.L.; writing—original draft preparation, N.T.C., C.P.D.S. and M.K.; writing—review and editing, M.K., N.L., J.-M.N., E.D., S.E.K., A.K., C.P.D.S. and N.T.C.; supervision, M.K. and N.L.; funding acquisition, M.K. and J.-M.N. All authors have read and agreed to the published version of the manuscript.

Funding

This work was performed within the project YaLiOl supported by the ANR grant “ANR-20-CE43-0007” of the French National Research Agency (ANR) in France.

Institutional Review Board Statement

Not applicable.

Informed Consent Statement

Not applicable.

Data Availability Statement

The original contributions presented in the study are included in the article, further inquiries can be directed to the corresponding author.

Conflicts of Interest

The authors declare no conflicts of interest.

References

  1. El Kantar, S.; Khelfa, A.; Vorobiev, E.; Koubaa, M. Strategies for Increasing Lipid Accumulation and Recovery from Y. Lipolytica: A Review. OCL 2021, 28, 51. [Google Scholar] [CrossRef]
  2. Ratledge, C. Yeasts, Moulds, Algae and Bacteria as Sources of Lipids. In Technological Advances in Improved and Alternative Sources of Lipids; Kamel, B.S., Kakuda, Y., Eds.; Springer: Boston, MA, USA, 1994; pp. 235–291. ISBN 978-1-4615-2109-9. [Google Scholar]
  3. Cohen, Z.; Ratledge, C. Single Cell Oils: Microbial and Algal Oils; AOCS Press: Champaign, IL, USA, 2010; ISBN 978-1-893997-73-8. [Google Scholar]
  4. Ratledge, C. Single Cell Oils for 21st Century. In Single Cell Oils: Microbial and Algal Oils; Cohen, Z., Ratledge, C., Eds.; AOAC Press: Champaign, IL, USA, 2010. [Google Scholar]
  5. Ratledge, C. Microbial Oils: An Introductory Overview of Current Status and Future Prospects. OCL 2013, 20, D602. [Google Scholar] [CrossRef]
  6. Fabiszewska, A.U.; Kotyrba, D.; Nowak, D. Assortment of Carbon Sources in Medium for Yarrowia lipolytica Lipase Production: A Statistical Approach. Ann. Microbiol. 2015, 65, 1495–1503. [Google Scholar] [CrossRef] [PubMed]
  7. Rywińska, A.; Marcinkiewicz, M.; Cibis, E.; Rymowicz, W. Optimization of Medium Composition for Erythritol Production from Glycerol by Yarrowia lipolytica Using Response Surface Methodology. Prep. Biochem. Biotechnol. 2015, 45, 515–529. [Google Scholar] [CrossRef]
  8. Ma, Y.; Gao, Z.; Wang, Q.; Liu, Y. Biodiesels from Microbial Oils: Opportunity and Challenges. Bioresour. Technol. 2018, 263, 631–641. [Google Scholar] [CrossRef]
  9. Ratledge, C. Regulation of Lipid Accumulation in Oleaginous Micro-Organisms. Biochem. Soc. Trans. 2002, 30, 1047–1050. [Google Scholar] [CrossRef]
  10. Groenewald, M.; Boekhout, T.; Neuvéglise, C.; Gaillardin, C.; van Dijck, P.W.M.; Wyss, M. Yarrowia lipolytica: Safety Assessment of an Oleaginous Yeast with a Great Industrial Potential. Crit. Rev. Microbiol. 2014, 40, 187–206. [Google Scholar] [CrossRef]
  11. Park, Y.-K.; Ledesma-Amaro, R. What Makes Yarrowia lipolytica Well Suited for Industry? Trends Biotechnol. 2023, 41, 242–254. [Google Scholar] [CrossRef]
  12. Bao, W.; Li, Z.; Wang, X.; Gao, R.; Zhou, X.; Cheng, S.; Men, Y.; Zheng, L. Approaches to Improve the Lipid Synthesis of Oleaginous Yeast Yarrowia lipolytica: A Review. Renew. Sustain. Energy Rev. 2021, 149, 111386. [Google Scholar] [CrossRef]
  13. Mitri, S.; Louka, N.; Rossignol, T.; Maroun, R.G.; Koubaa, M. Bioproduction of 2-Phenylethanol by Yarrowia lipolytica on Sugar Beet Molasses as a Low-Cost Substrate. Fermentation 2024, 10, 290. [Google Scholar] [CrossRef]
  14. Nemer, G.; Louka, N.; Rabiller Blandin, P.; Maroun, R.G.; Vorobiev, E.; Rossignol, T.; Nicaud, J.-M.; Guénin, E.; Koubaa, M. Purification of Natural Pigments Violacein and Deoxyviolacein Produced by Fermentation Using Yarrowia lipolytica. Molecules 2023, 28, 4292. [Google Scholar] [CrossRef] [PubMed]
  15. Gottardi, D.; Siroli, L.; Vannini, L.; Patrignani, F.; Lanciotti, R. Recovery and Valorization of Agri-Food Wastes and by-Products Using the Non-Conventional Yeast Yarrowia lipolytica. Trends Food Sci. Technol. 2021, 115, 74–86. [Google Scholar] [CrossRef]
  16. Lazar, Z.; Walczak, E.; Robak, M. Simultaneous Production of Citric Acid and Invertase by Yarrowia lipolytica SUC+ Transformants. Bioresour. Technol. 2011, 102, 6982–6989. [Google Scholar] [CrossRef] [PubMed]
  17. Celińska, E.; Borkowska, M.; Białas, W. Enhanced Production of Insect Raw-Starch-Digesting Alpha-Amylase Accompanied by High Erythritol Synthesis in Recombinant Yarrowia lipolytica Fed-Batch Cultures at High-Cell-Densities. Process Biochem. 2017, 52, 78–85. [Google Scholar] [CrossRef]
  18. Rodriguez, G.M.; Hussain, M.S.; Gambill, L.; Gao, D.; Yaguchi, A.; Blenner, M. Engineering Xylose Utilization in Yarrowia lipolytica by Understanding Its Cryptic Xylose Pathway. Biotechnol. Biofuels 2016, 9, 149. [Google Scholar] [CrossRef]
  19. El Kantar, S.; Koubaa, M. Valorization of Low-Cost Substrates for the Production of Odd Chain Fatty Acids by the Oleaginous Yeast Yarrowia lipolytica. Fermentation 2022, 8, 284. [Google Scholar] [CrossRef]
  20. Park, Y.-K.; Dulermo, T.; Ledesma-Amaro, R.; Nicaud, J.-M. Optimization of Odd Chain Fatty Acid Production by Yarrowia lipolytica. Biotechnol. Biofuels 2018, 11, 158. [Google Scholar] [CrossRef]
  21. Žganjar, M.; Ogrizović, M.; Matul, M.; Čadež, N.; Gunde-Cimerman, N.; González-Fernández, C.; Gostinčar, C.; Tomás-Pejó, E.; Petrovič, U. High-Throughput Screening of Non-Conventional Yeasts for Conversion of Organic Waste to Microbial Oils via Carboxylate Platform. Sci. Rep. 2024, 14, 14233. [Google Scholar] [CrossRef]
  22. Degwert, J.; Jacob, J.; Steckel, F. Use of Cis-9-Heptadecenoic Acid for Treating Psoriasis and Allergies. U.S. Patent WO1994021247A1, 13 January 1998. [Google Scholar]
  23. Wu, H.; San, K.-Y. Engineering Escherichia Coli for Odd Straight Medium Chain Free Fatty Acid Production. Appl. Microbiol. Biotechnol. 2014, 98, 8145–8154. [Google Scholar] [CrossRef]
  24. Fontanille, P.; Kumar, V.; Christophe, G.; Nouaille, R.; Larroche, C. Bioconversion of Volatile Fatty Acids into Lipids by the Oleaginous Yeast Yarrowia lipolytica. Bioresour. Technol. 2012, 114, 443–449. [Google Scholar] [CrossRef]
  25. Park, Y.-K.; Nicaud, J.-M. Screening a Genomic Library for Genes Involved in Propionate Tolerance in Yarrowia lipolytica. Yeast 2020, 37, 131–140. [Google Scholar] [CrossRef] [PubMed]
  26. Stukey, J.E.; McDonough, V.M.; Martin, C.E. Isolation and Characterization of OLE1, a Gene Affecting Fatty Acid Desaturation from Saccharomyces Cerevisiae. J. Biol. Chem. 1989, 264, 16537–16544. [Google Scholar] [CrossRef] [PubMed]
  27. Konzock, O.; Matsushita, Y.; Zaghen, S.; Sako, A.; Norbeck, J. Altering the Fatty Acid Profile of Yarrowia lipolytica to Mimic Cocoa Butter by Genetic Engineering of Desaturases. Microb. Cell Factories 2022, 21, 25. [Google Scholar] [CrossRef] [PubMed]
  28. Tsai, Y.-Y.; Ohashi, T.; Wu, C.-C.; Bataa, D.; Misaki, R.; Limtong, S.; Fujiyama, K. Delta-9 Fatty Acid Desaturase Overexpression Enhanced Lipid Production and Oleic Acid Content in Rhodosporidium Toruloides for Preferable Yeast Lipid Production. J. Biosci. Bioeng. 2019, 127, 430–440. [Google Scholar] [CrossRef]
  29. Sambrook, J.; Russell, D.W. Molecular Cloning: A Laboratory Manual; CSHL Press: New York, NY, USA, 2001; Volume 1, ISBN 978-0-87969-576-7. [Google Scholar]
  30. Barth, G.; Gaillardin, C. Physiology and Genetics of the Dimorphic Fungus Yarrowia lipolytica. FEMS Microbiol. Rev. 1997, 19, 219–237. [Google Scholar] [CrossRef]
  31. Karatay, S.E.; Dönmez, G. Improving the Lipid Accumulation Properties of the Yeast Cells for Biodiesel Production Using Molasses. Bioresour. Technol. 2010, 101, 7988–7990. [Google Scholar] [CrossRef]
  32. Al Sahyouni, W.; El Kantar, S.; Khelfa, A.; Park, Y.-K.; Nicaud, J.-M.; Louka, N.; Koubaa, M. Optimization of Cis-9-Heptadecenoic Acid Production from the Oleaginous Yeast Yarrowia lipolytica. Fermentation 2022, 8, 245. [Google Scholar] [CrossRef]
  33. Park, Y.-K.; Bordes, F.; Letisse, F.; Nicaud, J.-M. Engineering Precursor Pools for Increasing Production of Odd-Chain Fatty Acids in Yarrowia lipolytica. Metab. Eng. Commun. 2021, 12, e00158. [Google Scholar] [CrossRef]
  34. Qiao, K.; Imam Abidi, S.H.; Liu, H.; Zhang, H.; Chakraborty, S.; Watson, N.; Kumaran Ajikumar, P.; Stephanopoulos, G. Engineering Lipid Overproduction in the Oleaginous Yeast Yarrowia lipolytica. Metab. Eng. 2015, 29, 56–65. [Google Scholar] [CrossRef]
  35. Friedlander, J.; Tsakraklides, V.; Kamineni, A.; Greenhagen, E.H.; Consiglio, A.L.; MacEwen, K.; Crabtree, D.V.; Afshar, J.; Nugent, R.L.; Hamilton, M.A.; et al. Engineering of a High Lipid Producing Yarrowia lipolytica Strain. Biotechnol. Biofuels 2016, 9, 77. [Google Scholar] [CrossRef]
  36. Wang, F.; Bi, Y.; Diao, J.; Lv, M.; Cui, J.; Chen, L.; Zhang, W. Metabolic Engineering to Enhance Biosynthesis of Both Docosahexaenoic Acid and Odd-Chain Fatty Acids in Schizochytrium Sp. S31. Biotechnol. Biofuels 2019, 12, 141. [Google Scholar] [CrossRef] [PubMed]
  37. Qin, N.; Li, L.; Wang, Z.; Shi, S. Microbial Production of Odd-Chain Fatty Acids. Biotechnol. Bioeng. 2023, 120, 917–931. [Google Scholar] [CrossRef] [PubMed]
  38. Řezanka, T.; Kolouchová, I.; Sigler, K. Precursor Directed Biosynthesis of Odd-Numbered Fatty Acids by Different Yeasts. Folia Microbiol. 2015, 60, 457–464. [Google Scholar] [CrossRef] [PubMed]
  39. Kolouchová, I.; Schreiberová, O.; Sigler, K.; Masák, J.; Řezanka, T. Biotransformation of Volatile Fatty Acids by Oleaginous and Non-Oleaginous Yeast Species. FEMS Yeast Res. 2015, 15, fov076. [Google Scholar] [CrossRef]
  40. Zhang, L.-S.; Xu, P.; Chu, M.-Y.; Zong, M.-H.; Yang, J.-G.; Lou, W.-Y. Using 1-Propanol to Significantly Enhance the Production of Valuable Odd-Chain Fatty Acids by Rhodococcus Opacus PD630. World J. Microbiol. Biotechnol. 2019, 35, 164. [Google Scholar] [CrossRef]
  41. Gao, R.; Li, Z.; Zhou, X.; Cheng, S.; Zheng, L. Oleaginous Yeast Yarrowia lipolytica Culture with Synthetic and Food Waste-Derived Volatile Fatty Acids for Lipid Production. Biotechnol. Biofuels 2017, 10, 247. [Google Scholar] [CrossRef]
  42. Zhang, L.-S.; Liang, S.; Zong, M.-H.; Yang, J.-G.; Lou, W.-Y. Microbial Synthesis of Functional Odd-Chain Fatty Acids: A Review. World J. Microbiol. Biotechnol. 2020, 36, 35. [Google Scholar] [CrossRef]
  43. Gao, R.; Li, Z.; Zhou, X.; Bao, W.; Cheng, S.; Zheng, L. Enhanced Lipid Production by Yarrowia lipolytica Cultured with Synthetic and Waste-Derived High-Content Volatile Fatty Acids under Alkaline Conditions. Biotechnol. Biofuels 2020, 13, 3. [Google Scholar] [CrossRef]
  44. Koubaa, M. Integrated Biorefinery for a Next-Generation Methanization Process Focusing on Volatile Fatty Acid Valorization: A Critical Review. Molecules 2024, 29, 2477. [Google Scholar] [CrossRef]
Figure 1. Schematic of strain construction to improve OCFA synthesis in Y. lipolytica. All strains were constructed from the JMY9031 auxotrophic strain derived from the JMY7877 strain.
Fermentation 10 00597 g001
Figure 2. Impact of sodium propionate concentration on cell density (OD600nm) during 168 h of fermentation. Error bars correspond to the standard deviation of duplicates.
Fermentation 10 00597 g002
Figure 3. Impact of sodium acetate concentration on cell density (OD600nm) during 168 h of fermentation. Error bars correspond to the standard deviation of duplicates.
Fermentation 10 00597 g003
Figure 4. (a) Optimal path for the response of cell density (OD600nm). (b) Optimal path for the response of C17:1 content (%). (c) Desirability function (d1) for the optimization of the response of cell density (OD600nm). (d) Desirability function (d2) for the optimization of the response to C17:1 content (%). Min and target denote the minimal value and the target value, respectively.
Fermentation 10 00597 g004
Figure 5. Contour plots of the isoresponses for the models (a) cell density (OD600nm) and (b) C17:1 content (%). The dashed line with the star indicates the optimal conditions selected for both responses.
Fermentation 10 00597 g005
Table 1. Plasmids and strains used in this study.
StrainDescriptionPlasmidAuxotrophy
JMY7877Po1d Δphd1 Δmfe1 Δtgl4 + pTEF-YlDGA2 + pTEF-YlGPD1 + hp4d-YlLDP1 + pTEF-RePCT + pTEF-ScSUC2-LEU2 ex + pTEF-YlHXK1-URA3 ex JME2103
JME2347
U+L+
JMY9031Y7877 − URA3LEU2JME547U−L−
JMY9112Y9031 + pTEF-YlDGA2-URA3 exJME1132U+L−
JMY9178Y9112 + pTEF-YlOLE1-LEU2 exJME5112U+L+
Table 2. Growth media composition.
ComponentConcentrations
Sugar beet molasses *20 gsucrose/L
Crude glycerol *30 g/L
Yeast extract1 g/L
NH4Cl0.5 g/L
Sodium acetate[0; 5; 10; 15; 20 g/L]
Sodium propionate[0; 0.5; 1; 2; 3.5; 5 g/L]
Na2HPO40.05 M
KH2PO40.05 M
Saline solution **1 mL/L
Distilled water-
* The concentration of sugar beet molasses was adjusted according to its sucrose content (≈800 gsucrose/Lmolasses). Crude glycerol, with a purity of approximately 80%, was used directly to prepare the culture media. The concentrations of sucrose in sugar beet molasses and glycerol in crude glycerol were determined by HPLC, as previously described [19]. ** The composition of the 1000× concentration saline solution with a final volume of 1 L was as follows: H3PO4 85% liquid (107 g), KCl (20 g), NaCl (20 g), MgSO4·7H2O (27 g), ZnSO4·7H2O (7.7 g), MnSO4·H2O (0.47 g), CoCl2·6H2O (0.3 g), CuSO4·5H2O (0.6 g), Na2MoO4·2H2O (0.094 g), H3BO3 (0.3 g), and water up to 1 L.
Table 3. Dry cell weight (DCW) and FAME (fatty acid methyl ester) profile of each medium containing different concentrations of sodium propionate. FAs denotes fatty acids.
Sodium Propionate (g/L)00.5123.55
DCW (g/L)19.42 ± 2.918.31 ± 2.417.0 ± 0.0715.6 ± 0.7111.3 ± 0.1410.5 ± 1.13
FAMEs (%)
C15:00.46 ± 0.071.67 ± 0.052.75 ± 0.154.07 ± 0.22.69 ± 0.342.07 ± 0.19
C16:025.25 ± 2.2224.36 ± 1.3919.77 ± 0.087.21 ± 0.443.2 ± 0.291.49 ± 0.46
C16:111.24 ± 0.1310.95 ± 0.917.87 ± 0.474.37 ± 0.043.05 ± 0.172.22 ± 0.11
C17:00.5 ± 0.072.27 ± 0.034.44 ± 0.526.01 ± 0.253.12 ± 0.041.63 ± 0.18
C17:13.67 ± 0.2511.83 ± 0.6620.31 ± 0.0546.17 ± 1.4751.78 ± 0.0850.4 ± 0.18
C18:06.15 ± 1.734.87 ± 0.944.05 ± 0.471.37 ± 0.320.69 ± 0.010.22 ± 0.31
C18:148.54 ± 3.3440.8 ± 0.6836.8 ± 0.4921.59 ± 0.3119.58 ± 0.0218.65 ± 1.36
C18:20.09 ± 0.060.42 ± 0.051.17 ± 0.013.77 ± 0/046.47 ± 0.786.9 ± 0.9
C19:04.08 ± 0.283.02 ± 0.392.79 ± 0.042.65 ± 0.013.37 ± 0.114.76 ± 0.13
C19:10002.73 ± 0.015.96 ± 0.138.51 ± 0.49
Saturated FAs36.44 ± 4.3636.21 ± 2.833.8 ± 1.2721.31 ± 6.0713.08 ± 0.6910.19 ± 1.27
Unsaturated FAs63.51 ± 3.8164.01 ± 2.366.16 ± 1.0378.64 ± 6.0586.86 ± 0.6986.69 ± 3.04
OCFAs8.71 ± 0.6718.8 ± 1.1230.3 ± 0.7661.63 ± 4.4566.94 ± 0.3567.39 ± 1.17
Table 4. Dry cell weight (DCW) and FAME profile of each media containing different concentrations of sodium acetate.
Sodium Acetate (g/L)05101520
DCW (g/L)6.30 ± 0.483.94 ± 0.174.92 ± 0.966.85 ± 0.0310.5 ± 1.13
FAMES (%)
C15:07.59 ± 0.336.93 ± 0.253.47 ± 0.101.81 ± 0.192.07 ± 0.19
C16:05.32 ± 0.373.83 ± 0.381.89 ± 0.141.24 ± 0.151.49 ± 0.46
C16:12.93 ± 0.063.52 ± 0.282.48 ± 0.061.94 ± 0.102.22 ± 0.11
C17:07.93 ± 0.902.32 ± 0.231.42 ± 0.271.29 ± 0.081.63 ± 0.18
C17:153.42 ± 0.6950.49 ± 0.8850.40 ± 1.7349.11 ± 0.0650.4 ± 0.18
C18:01.26 ± 0.010.71 ± 0.090.37 ± 0.000.44 ± 0.090.22 ± 0.31
C18:114.83 ± 0.1818.71 ± 0.5920.17 ± 1.2218.09 ± 1.3418.65 ± 1.36
C18:22.32 ± 0.072.20 ± 0.406.15 ± 0.499.93 ± 0.706.9 ± 0.9
C19:02.07 ± 0.275.83 ± 0.595.65 ± 0.014.83 ± 0.134.76 ± 0.13
C19:12.32 ± 0.375.44 ± 0.547.97 ± 0.6111.66 ± 1.768.51 ± 0.49
Saturated FAs24.1519.6112.809.5910.19
Unsaturated FAs75.8180.3587.1690.7286.69
OCFAs73.3171.0068.9168.6967.39
ECFAs26.692931.0931.3132.61
Table 5. Experimental conditions and the measured responses of the design of experiments. Coded variables are provided in parentheses.
FactorsMeasured ResponsesPredicted Responses
ExperimentSodium
Acetate (g/L)
Sodium
Propionate (g/L)
Cell Density (OD600nm)DCW (g/L)C17:1 (%)Cell Density (OD600nm)C17:1 (%)
115 (−1)2 (−1)21.8810.4441.0222.07039.260
215 (−1)2 (−1)20.999.9240.7122.07039.260
320 (+1)2 (−1)28.1211.1444.7424.04040.220
420 (+1)2 (−1)23.1712.0441.6824.04040.220
515 (−1)3.5 (+1)11.587.4741.1613.92547.011
615 (−1)3.5 (+1)17.428.1246.0613.92547.011
720 (+1)3.5 (+1)23.179.5243.4419.59946.906
820 (+1)3.5 (+1)21.889.6946.2319.59946.906
913.96 (−α)2.75 (0)15.749.3747.3515.39346.798
1013.96 (−α)2.75 (0)16.438.9748.1815.39346.798
1121.04 (+α)2.75 (0)17.829.8545.5620.79847.403
1221.04 (+α)2.75 (0)18.2210.2747.5620.79847.403
1317.5 (0)1.69 (−α)24.7513.7830.1926.17234.494
1417.5 (0)1.69 (−α)27.4213.5131.4826.17234.494
1517.5 (0)3.81 (+α)15.259.0948.3417.27244.702
1617.5 (0)3.81 (+α)15.059.2149.2817.27244.702
1717.5 (0)2.75 (0)20.599.4749.1917.26948.811
1817.5 (0)2.75 (0)16.349.7447.9617.26948.811
1917.5 (0)2.75 (0)15.949.5247.4617.26948.811
2015.97 (−0.612)2.48 (−0.36)16.539.8448.3817.84546.450
2119.03 (+0.612)2.48 (−0.36)19.59.7048.2519.78446.828
2217.5 (0)3.28 (+0.707)16.348.9948.1416.15749.060
Table 6. Analysis of variances for the responses (a) Y1: cell density (OD600nm) and (b) Y2: C17:1 (%). * indicates significant differences.
(a)
Source of VariationSum of SquaresDegrees of FreedomMean SquaresF-Ratiop-Value
Regression280.508556.1019.0590.0307 *
Residue99.088166.193
Lack of fit51.37268.5621.79419.7
Pure error47.716104.771
Total379.59621
(b)
Source of VariationSum of SquaresDegrees of FreedomMean SquaresF-Ratiop-Value
Regression428.727585.74533.195<0.01 *
Residue152.087169.505
Lack of fit126.257621.0428.1470.219 *
Pure error25.830102.583
Total5880.81521
Disclaimer/Publisher’s Note: The statements, opinions and data contained in all publications are solely those of the individual author(s) and contributor(s) and not of MDPI and/or the editor(s). MDPI and/or the editor(s) disclaim responsibility for any injury to people or property resulting from any ideas, methods, instructions or products referred to in the content.