Article

Ordered Changes in Methane Production Performance and Metabolic Pathway Transition of Methanogenic Archaea under Gradually Increasing Sodium Propionate Stress Intensity

1
Key Laboratory of Intelligent Equipment and New Energy Utilization of Livestock and Poultry Breeding, College of Mechanical and Electrical Engineering, Hebei Agricultural University, Baoding 071000, China
2
Biology Institute, Qilu University of Technology (Shandong Academy of Sciences), Jinan 250103, China
3
Hebei Animal Husbandry Station, Shijiazhuang 050035, China
4
Beijing Key Laboratory of Farmland Soil Pollution Prevention and Remediation, College of Resources and Environmental Sciences, China Agricultural University, Beijing 100193, China
*
Authors to whom correspondence should be addressed.
These authors contributed equally to this work.
Fermentation 2024, 10(4), 201; https://doi.org/10.3390/fermentation10040201
Submission received: 12 March 2024 / Revised: 4 April 2024 / Accepted: 5 April 2024 / Published: 8 April 2024
(This article belongs to the Special Issue Application and Research of Solid State Fermentation)

Abstract

:
This study examined the impact of sodium propionate concentration (0–40 g/L) on the methanogenic archaea in an inoculum which was cultured in basal nutrient medium, exploring its mechanisms and nonlinear stress intensity. The results indicated that at low concentrations, propionate-maintained homeostasis of the anaerobic digestion (AD) system and enriched Methanosaeta. However, when the concentration exceeded 16 g/L, the stability of the AD system was disrupted. The methanogenic pathway shifted towards a predominantly hydrogenotrophic pathway, resulting in a significant increase in methane yield. Below concentrations of 28 g/L, the AD system gradually enhanced its ability to utilize propionate in an orderly manner. At concentrations of 24–28 g/L, genera (e.g., Advenella and Methanosarcina) were enriched to adapt to the high-VFA environment. This was accompanied by a significant upregulation of genes related to the methylotrophic and hydrogenotrophic pathways, effectively mitigating propionate inhibition and enhancing methanogenesis. Conversely, excess concentrations (>30 g/L) suppressed methanogenesis-related genes and led to methane production arrest despite activating specialized propionate-metabolizing bacteria such as genus Pelotomaculum schinkii. As such, an increase in the stress intensity of propionate promotes a change in the metabolic pathways of methanogens and increases methane production; however, excessive sodium propionate was not conducive to maintaining the steady state of the system.

1. Introduction

With the continuous improvement in global urbanization, the generation of biodegradable domestic waste (including food waste, sewage sludge, etc.) has been increasing year by year. According to statistics, approximately 1.3 billion tons of food waste are generated annually globally, with per-capita food loss reaching 280–300 kg per year in highly urbanized regions such as North America and Europe, and with 120–170 kg per year in some relatively impoverished areas [1]. For biodegradable domestic waste treatment and resource use, anaerobic digestion (AD) is generally recognized as a potential technology, with the conversion of organic substances into biomethane for renewable energy [2,3].
However, during the AD process of perishable waste, problematic volatile fatty acids (VFAs) can easily accumulate, inhibiting metabolism. Among them, the accumulation of propionate is particularly toxic to AD systems as the methane production process is highly sensitive to the accumulation and metabolism of propionate [4], and is more difficult to convert into acetate compared to other VFA components. Usually, a propionate concentration of 6 g/L is considered dangerous. In fact, many researchers have reported that propionate inhibits anaerobic digestion systems at different concentrations. Yuan et al. [5] and Ma et al. [4] believe that methane production performance can be inhibited when the concentration of propionate reaches 4 g/L during the anaerobic digestion process of sludge, which is much lower than the 6 and 8 g/L of acetic acid and butyric acid. However, Wong et al. [6] found that methane production in the system was significantly inhibited when the concentration of propionate reached 20 g/L of COD. These contradictory results may be due to the combined action of other inhibitory factors in anaerobic digestion and propionate. Therefore, current research lacks insight into the level at which propionate stress on AD occurs, and it is necessary to explore the stress intensity of propionate on the AD system in a pure environment.
Furthermore, propionate is not only an inhibitory substance, but also a good carbon source to support methane production. The contribution of propionate to methane production can reach 35% in the presence of multiple nutrients [4]. This is because propionate can be converted into acryloyl CoA through the propionate and acetate metabolic pathways, and ultimately into methane through the hydrogen nutrient and acetate pathways. This propionic acid fermentation may gradually domesticate the structure of microbial communities, making the system more tolerant to propionate, thereby affecting the anaerobic digestion system’s tolerance to propionate. For example, anaerobes with thick capsules such as the Metanosarcina genus can survive in relatively harsh environments and fully mobilize hydrogen trophic methane production when facing relatively high propionate pressure. Hence, this provides a basis for microbial adaptation and many researchers have obtained AD systems with high tolerance to propionic acid pressure through adaptation. For example, Han et al. [7] reported that the inhibition of the anaerobic digestion system by propionate can achieve reversible recovery by domesticating microbial communities. Although there has been extensive research on domesticating microorganisms to tolerate propionate, most of them have focused on the relationship between microbial evolution patterns and gas production characteristics, with relatively little research on the mechanism of propionate tolerance. In particular, there is not much detailed research on the evolution and adaptation of methanogenic archaea and genes that are tolerant to propionic acid in the pure environment when facing gradual pressure from propionic acid, and clarifying the changes in the metabolic pathways of methanogenic archaea is crucial for AD systems.
Therefore, the aim of this article was to reveal the concentration level and mechanism of propionate stress on the AD system under controlled conditions. By adding different doses of sodium propionate to standardized basal nutrient medium, AD systems were constructed under different levels of propionate pressure. Then, the corresponding dynamics of system steady-state and methane production performance under sodium propionate stress were investigated. Through hydrolysis kinetics models and microbial community structure analysis, the threshold of stress on an AD system and the response relationship of the microbial community structure to different concentrations of propionate were revealed. In addition, the dynamic changes in key functional genes in the inhibition process of methane production were predicted to elucidate the potential mechanism of high-concentration propionate inhibition in methane production.

2. Materials and Methods

2.1. Medium and Inoculum

Different concentrations of sodium propionate were added to the mixtures of basal nutrient medium and inoculum which was rich in methanogenic archaea to obtain their inhibitory effect on methane production. The inoculum was obtained from a mesophilic anaerobic digestion biogas station using cow manure and corn stover as mixed feedstocks (Dingzhou, Hebei, China). The mixtures of manure and lignocellulose feedstocks were more commonly used as raw materials for biogas plants compared to other materials. And the inoculum contains a relatively rich and stable microbial composition. Hence, the inoculum was chosen in this study. The inoculum included a biogas slurry and residue, and the total solid (TS) content was 15%. The basal nutrient medium, as specified by Speece [8], included the following quantities [mg/L]: NH4Cl [400]; MgSO4·6H2O [250]; KCl [400]; CaCl2·2H2O [120]; (NH4)2HPO4 [80]; FeCl3·6H2O [55]; CoCl2·6H2O [10]; KI [10]; trace metal salts: MnCl2·4H2O, NH4VO3, CuCl2·2H2O, Zn(C2H3O2)2·2H2O, AlCl3·6H2O, Na2MoO4·2H2O, H3BO3, NiCl2·6H2O, NaWO4·2H2O, and Na2SeO3 [each at 0.5]; NaHCO3 [5000]; and resazurin.

2.2. Experimental System and Protocol

The inoculum was stored at room temperature for a period of 15 days to ensure that the VFAs it contained were consumed completely and did not spontaneously produce biogas. Then, to keep the inoculum at the same condition, the inoculum was stored at −20 °C for a short time. Before use, the inoculum was left at ambient temperature for 12 h in order to allow the gradual increase in inoculum temperature. Firstly, 200 g of the culture media was added to 500 g of the inoculum and completely mixed. Then, sodium propionate was added in the mixtures to final concentrations of 0, 1, 2, 3, 4, 5, 6, 8, 10, 12, 14, 16, 18, 20, 22, 24, 26, 28, 30, 35, and 40 g/L in each of the actual reactors. After that, the mixtures with added sodium propionate were fed into a sequence of anaerobic digestion reactors with no stirring. All the reactors were mixed only at the start of the experiment. An anaerobic environment was created before experiments began by flushing N2 into the reactors for 5 min. All treatments were carried out in triplicate.
Reactors were placed in a constant-temperature incubator at 35 °C for digestion for 30 days. After starting, biogas produced by each reactor was gathered using Tedlar bags every day, and the yield and composition were measured. In addition, during anaerobic digestion, a sample (50 g) was collected from the reactor each time for subsequent analysis of the physical and chemical properties, such as including daily methane yields, cumulative methane yields, pH, NH4+-N, VFA contents, and microbiological communities. In the first 10 days, samples were taken every two days. Through the end of the experiment, they were taken every five days.

2.3. Analytical Methods

2.3.1. Physicochemical Properties

Analyses of the inoculum’s TS were carried out according to standard methods (APHA, 2005). To determine the amount and composition of biogas yielded in the reactors, biogas measurement equipment (BIOGAS5000, Geotech, Warwickshire, UK) was used. After centrifuging the samples at 1720× g for 10 min, a pH meter was applied to measure the pH of liquid. In addition, the NH4+-N concentration of the liquid was analyzed by a flow injection analyzer (AA3, SEAL, Schleswig-Holstein, Germany). Based on Zheng et al. [9], the component and content of VFAs (including acetic acid, formic acid, butyric acid, and propionic acid) were analyzed using a gas chromatograph (GCMS-20/10, Shimadzu, Kyoto, Japan).

2.3.2. Microbial Community Structure and Functional Predictions

Due to different levels of propionate stress, there were significant differences in the methane production performance and stability of the system. Samples were selected for analyzing all microorganisms in each reactor at the midpoint time from methanogenesis initiation to peak, to represent active microbial communities. As the experiment is systematic and involved a large sample size (21) to ensure the credibility of the results. Samples from each treatment (not parallel) were selected for microbiological analysis. Due to the regularity of previous experimental results, microbial data were reliable. The samples went through four steps of DNA extraction, polymerase chain reaction (PCR) amplification, library construction, and sequencing. In detail, the FastDNA® SPIN Kit for soil (MP Biomedicals, Santa Ana, CA, USA) was used for DNA extraction. The primers used in PCR were 338F and 806R (5′-ACTCC TACGGGAGGCAGCA-3′ and 5′-GGACTACHVGGGTWTCTAAT-3′) for bacteria, and 344F and 806R (5′-ACGGGGYGCAGCAGGCGCGA-3′ and 5′-GGACTACVSGGGTATCTAAT-3′) for archaea. The amplicon sequencing of 16S was on an Illumina MiSeq® PE300 platform (Allwegene Technology, Beijing, China) to obtain raw fastq files for each reactor. The QIIME (v1.8.0) was used for sequence demultiplexing and quality-filtering. UPARSE (version 7.1 http://drive5.com/uparse/, accessed on 27 January 2022) was used to assign operational taxonomic units (OTUs) at 97% sequence similarity. UCHIME was used to identify and remove chimeric sequences. The RDP classifier (http://rdp.cme.msu.edu/, accessed on 27 January 2022) was used to analyze the taxonomy of each 16S rRNA gene sequence against the Silva (version 138 http://www.arb-silva.de, accessed on 27 January 2022) 16S rRNA database using a confidence threshold of 70% and to obtain the species classification information corresponding to each OTU.
On the Wekemo Bioincloud platform (http://www.bioincloud.tech/#/task-ui/cpd_color_map, accessed on 27 January 2022), Phylogenetic Investigation of Communities through Reconstruction of Unobserved States (PICRUSt2) was used for functional predictions.

2.4. Model Application

In order to validate the experimental data of methane production, a modified Gompert (GM) model and a first-order (FO) model were used. The GM model expressed in Equation (1) was developed by [10].
M = P × exp exp e × R max ( λ t ) P + 1
where M is the cumulative methane production (mL/g VS); P is the maximum methane potential (mL/g VS); e is Euler’s number (≈2.71828); Rmax is the maximum methane production rate (mL/d); λ is the lag phase (d); and t is time (d).
The first-order model shown in Equation (2) was applied to calculate the rate of the hydrolysis stage [11].
L n P M P = K h t
where P is the maximum methane potential (mL/g VS); M is the cumulative methane production (mL/g VS); Kh is the rate of the hydrolysis stage; and t is time (d).

2.5. Data Analysis

All experimental data were analyzed using Origin 8.6 and SPSS 19.0 software. A one-way analysis of variance and Duncan’s test were used for significance testing. Pearson’s correlation coefficient was used to test the relationship between the additive quantity of sodium propionate and the time delay period, and a p-value less than 0.05 was considered significantly significant.

3. Results and Discussion

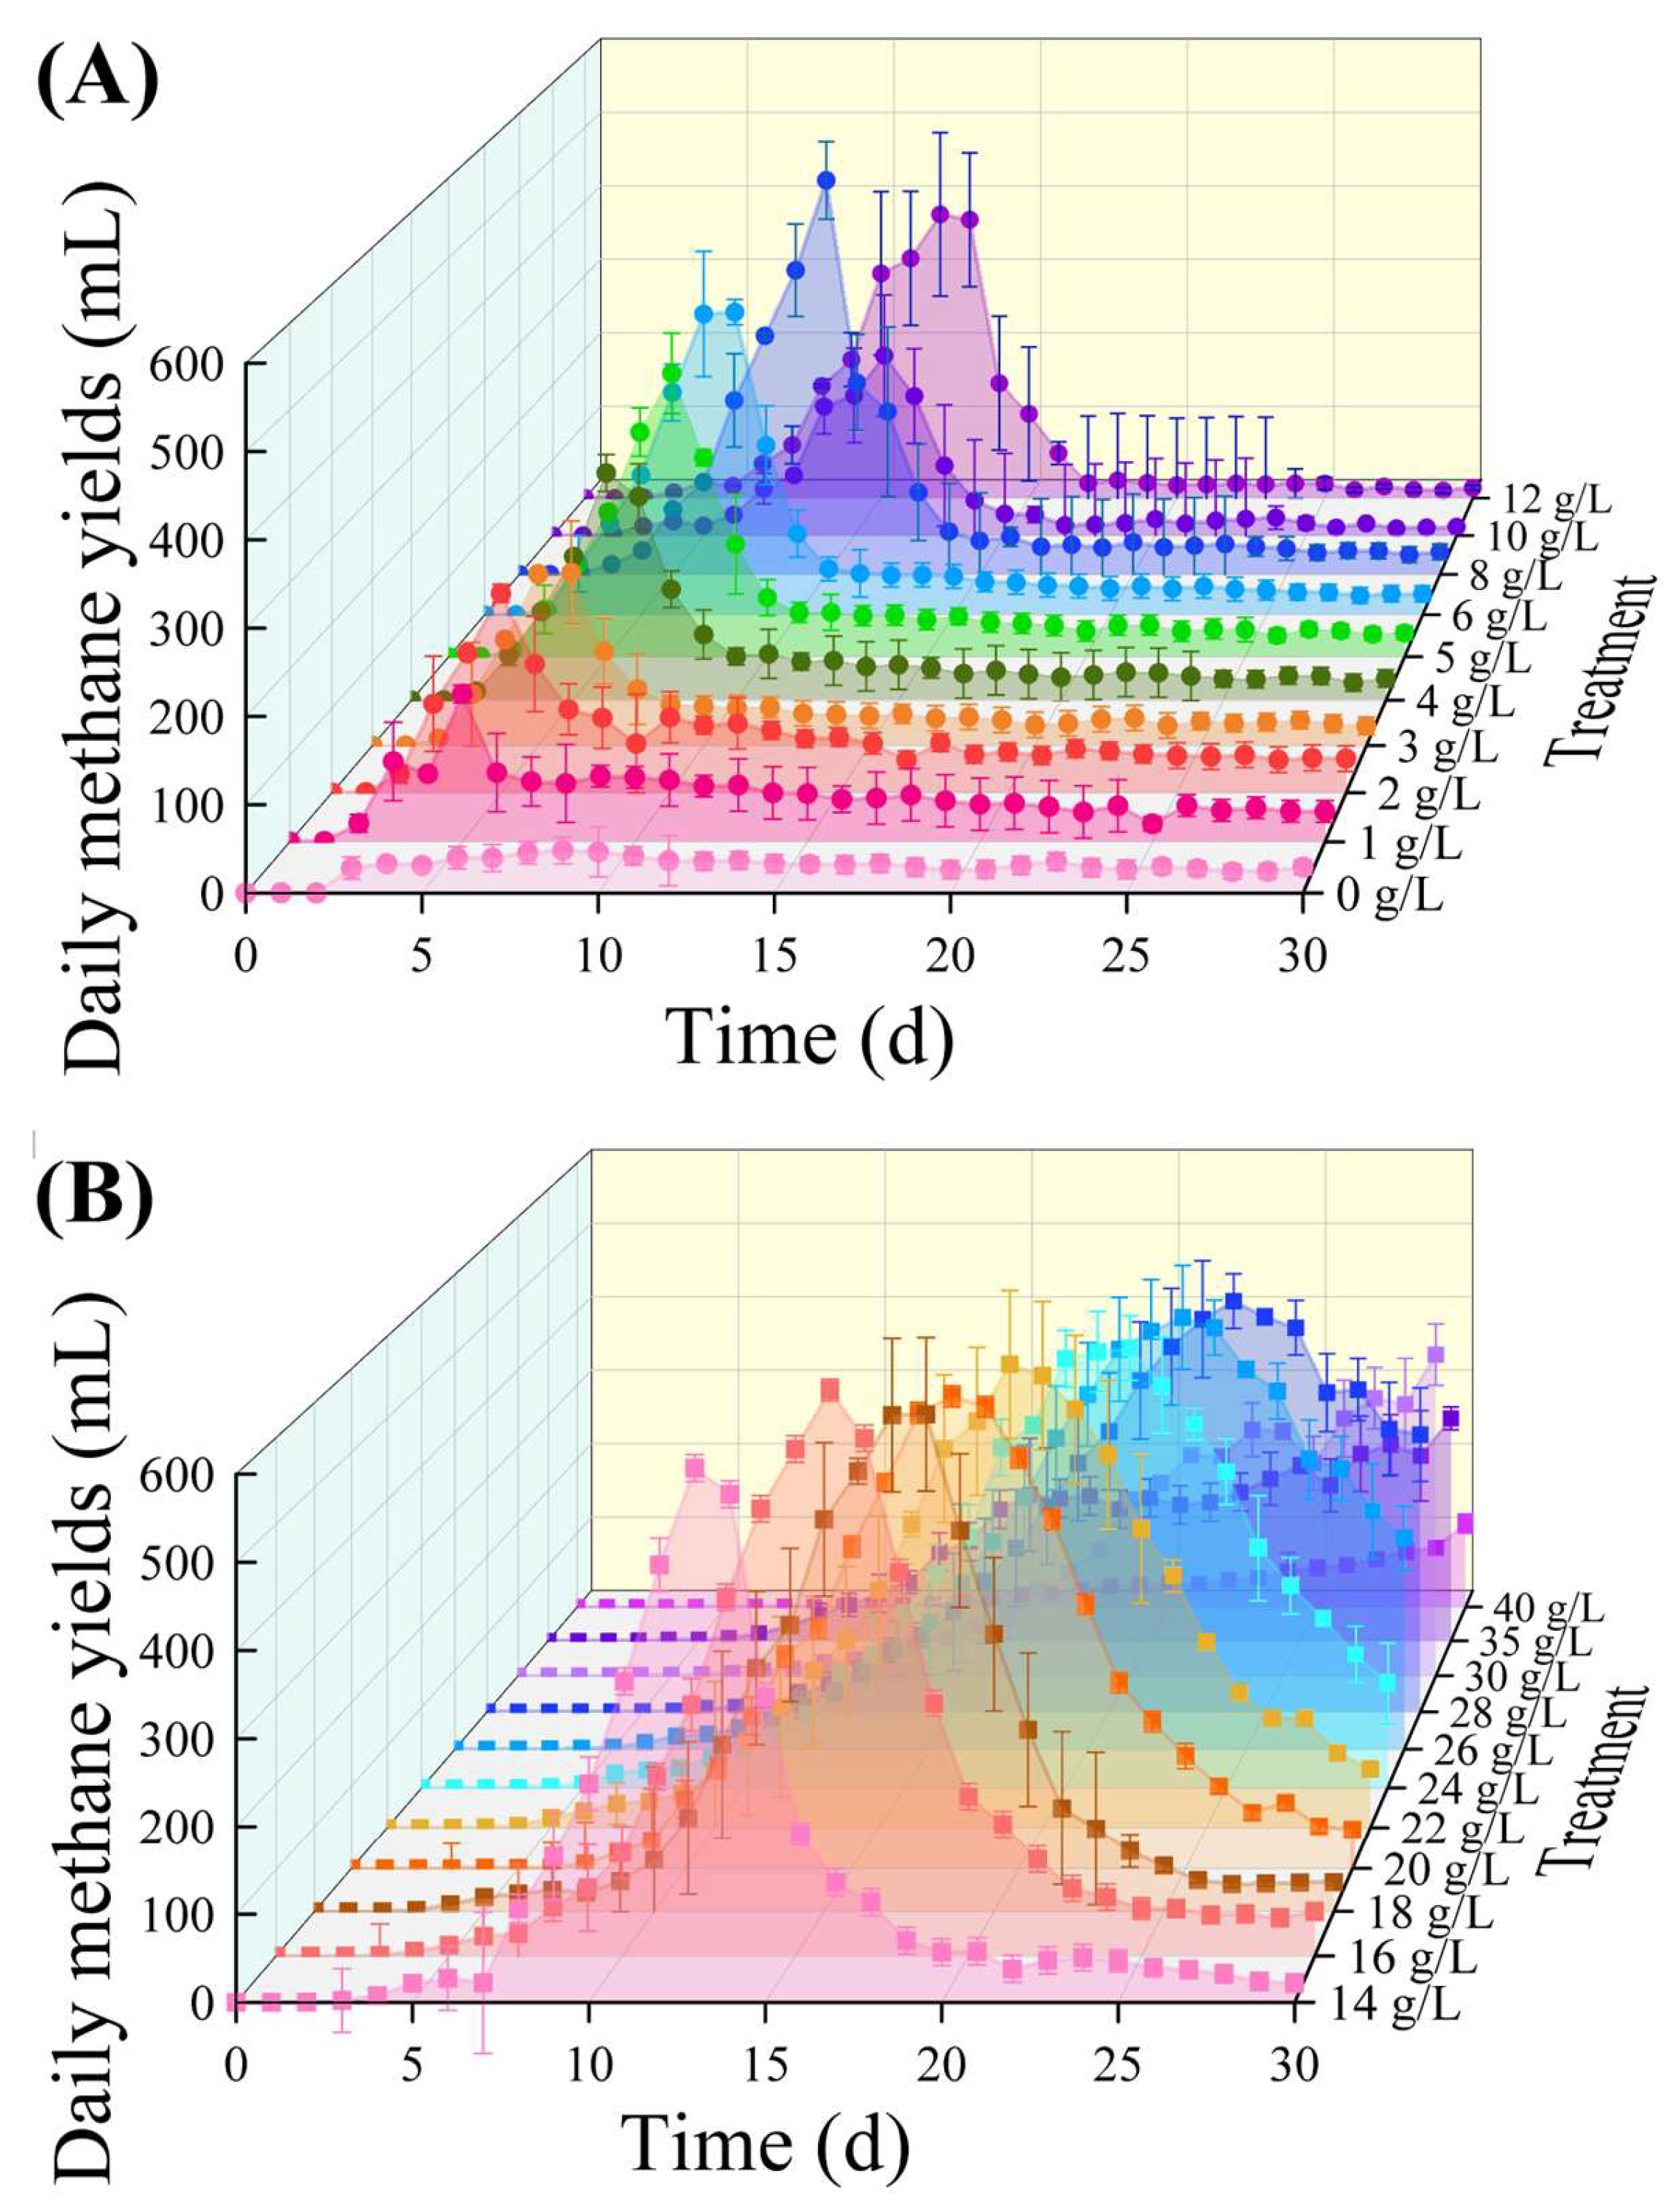
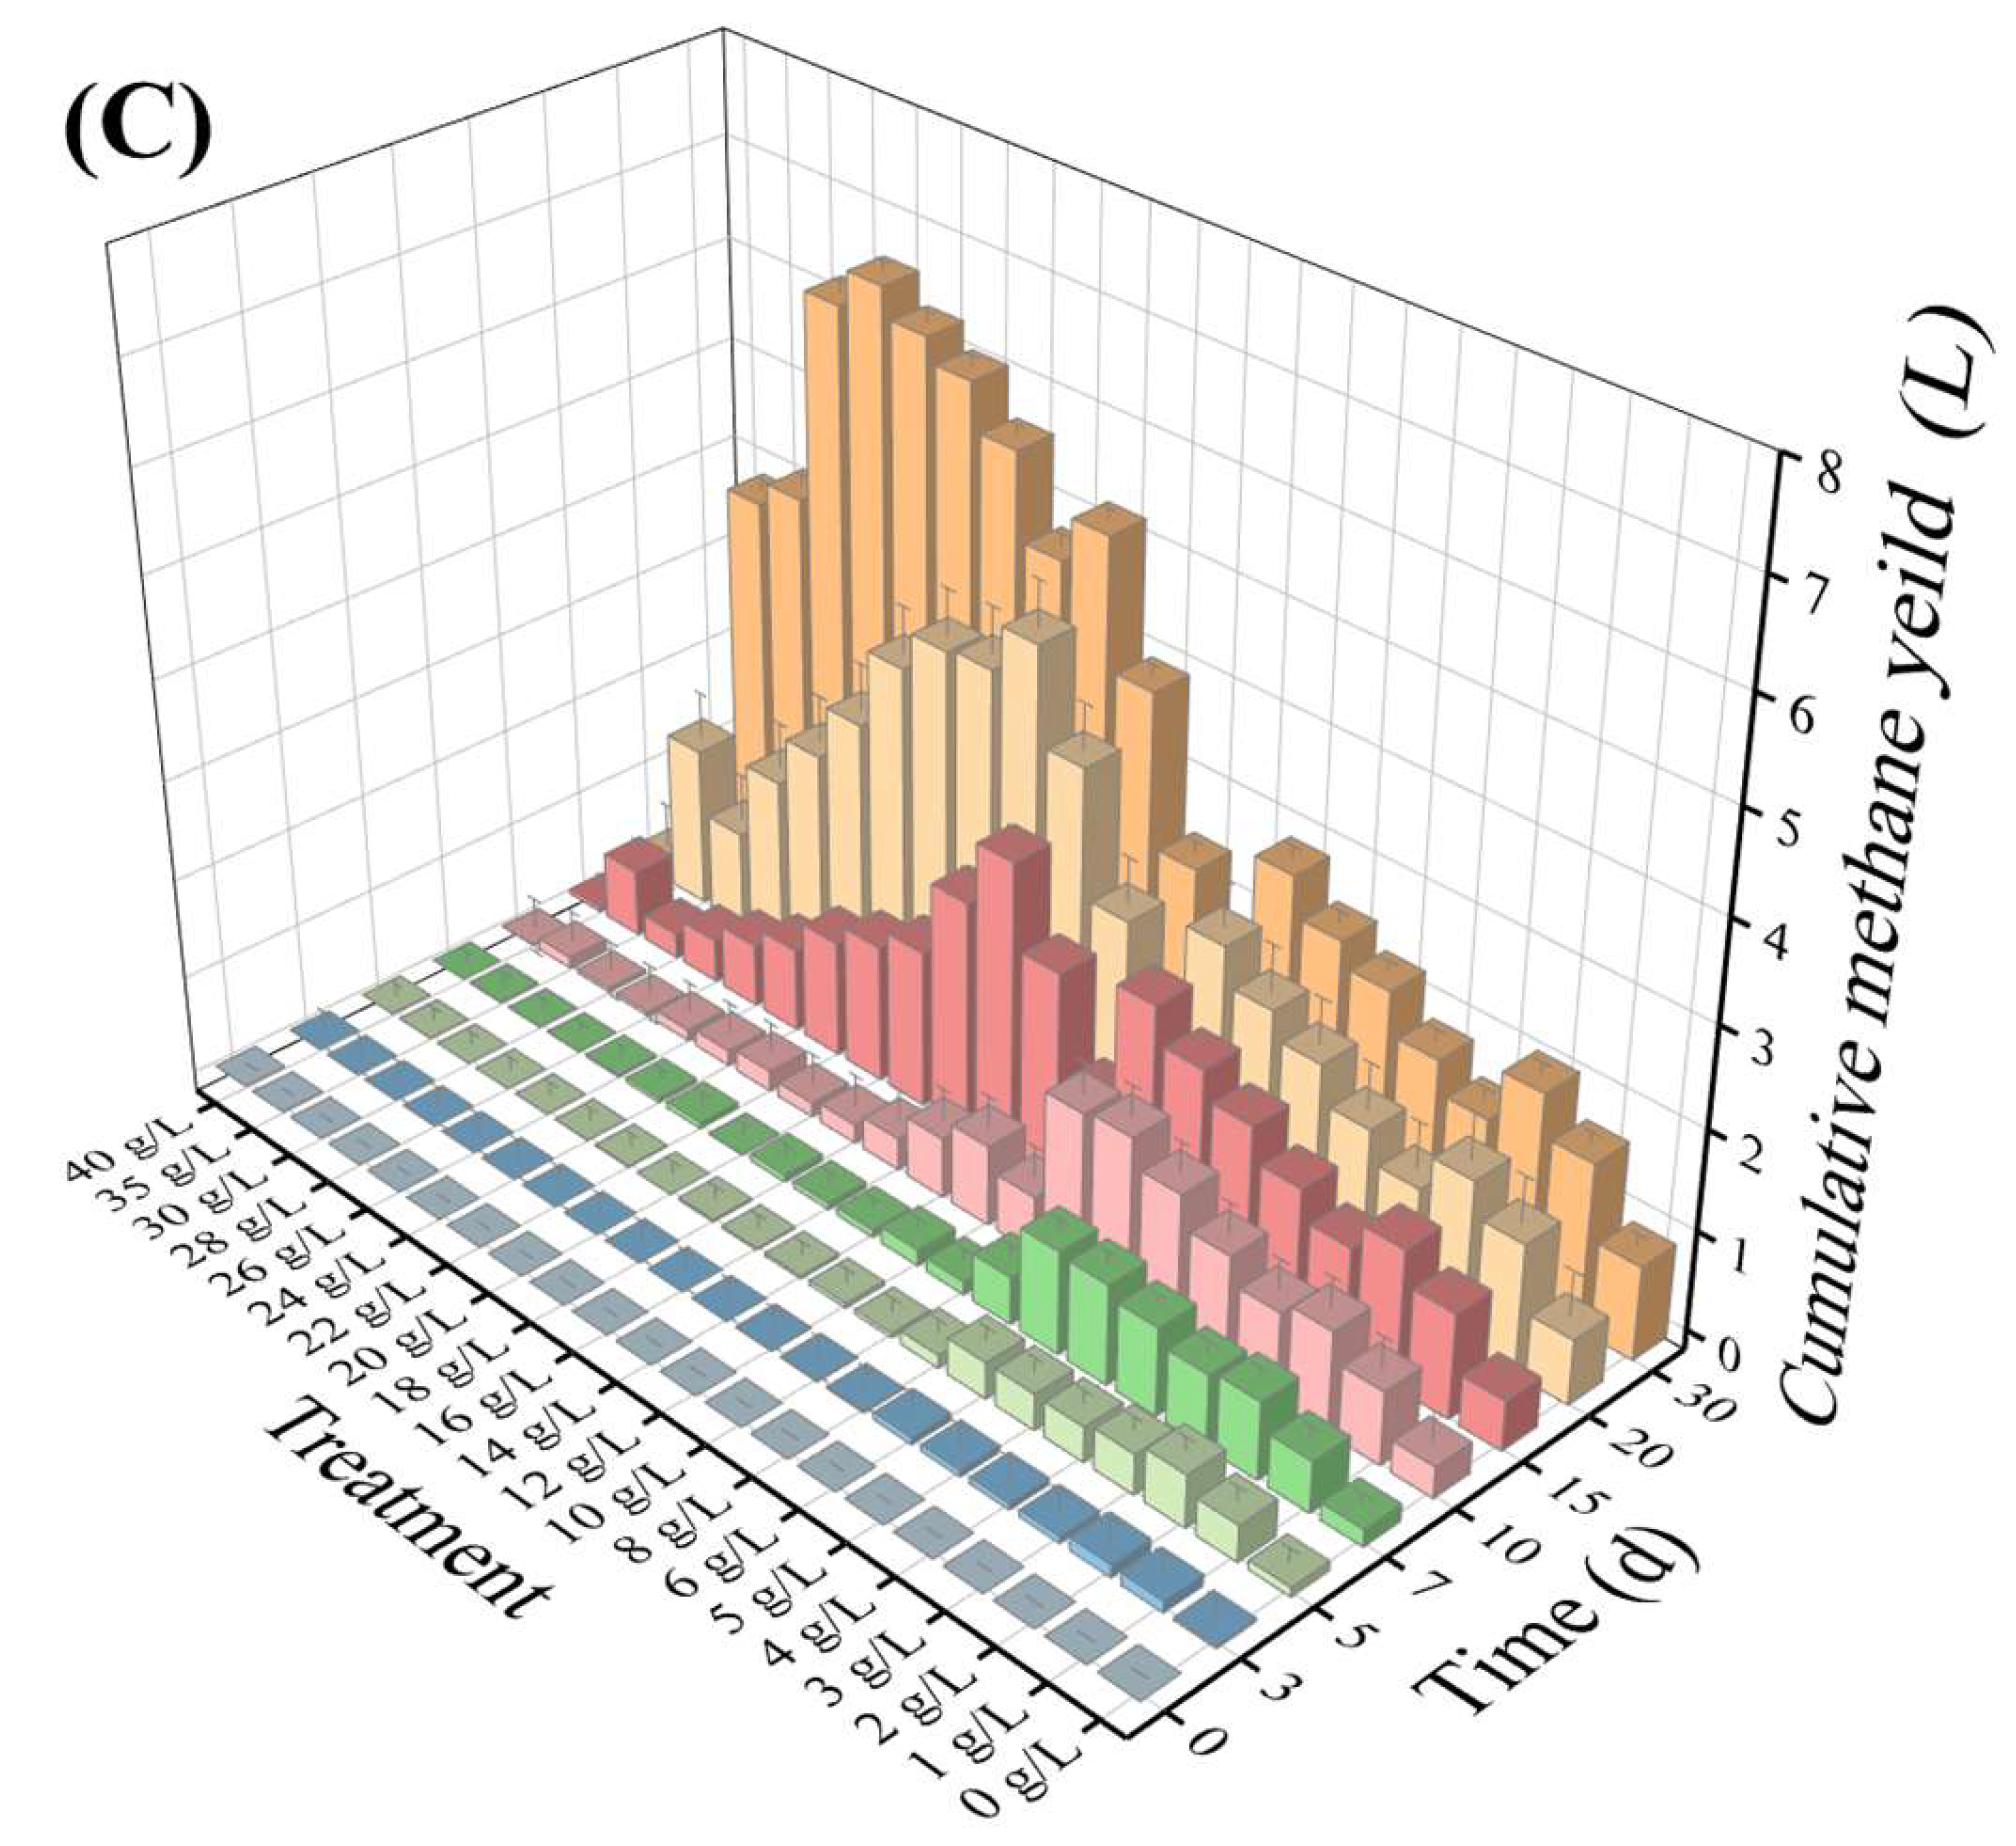
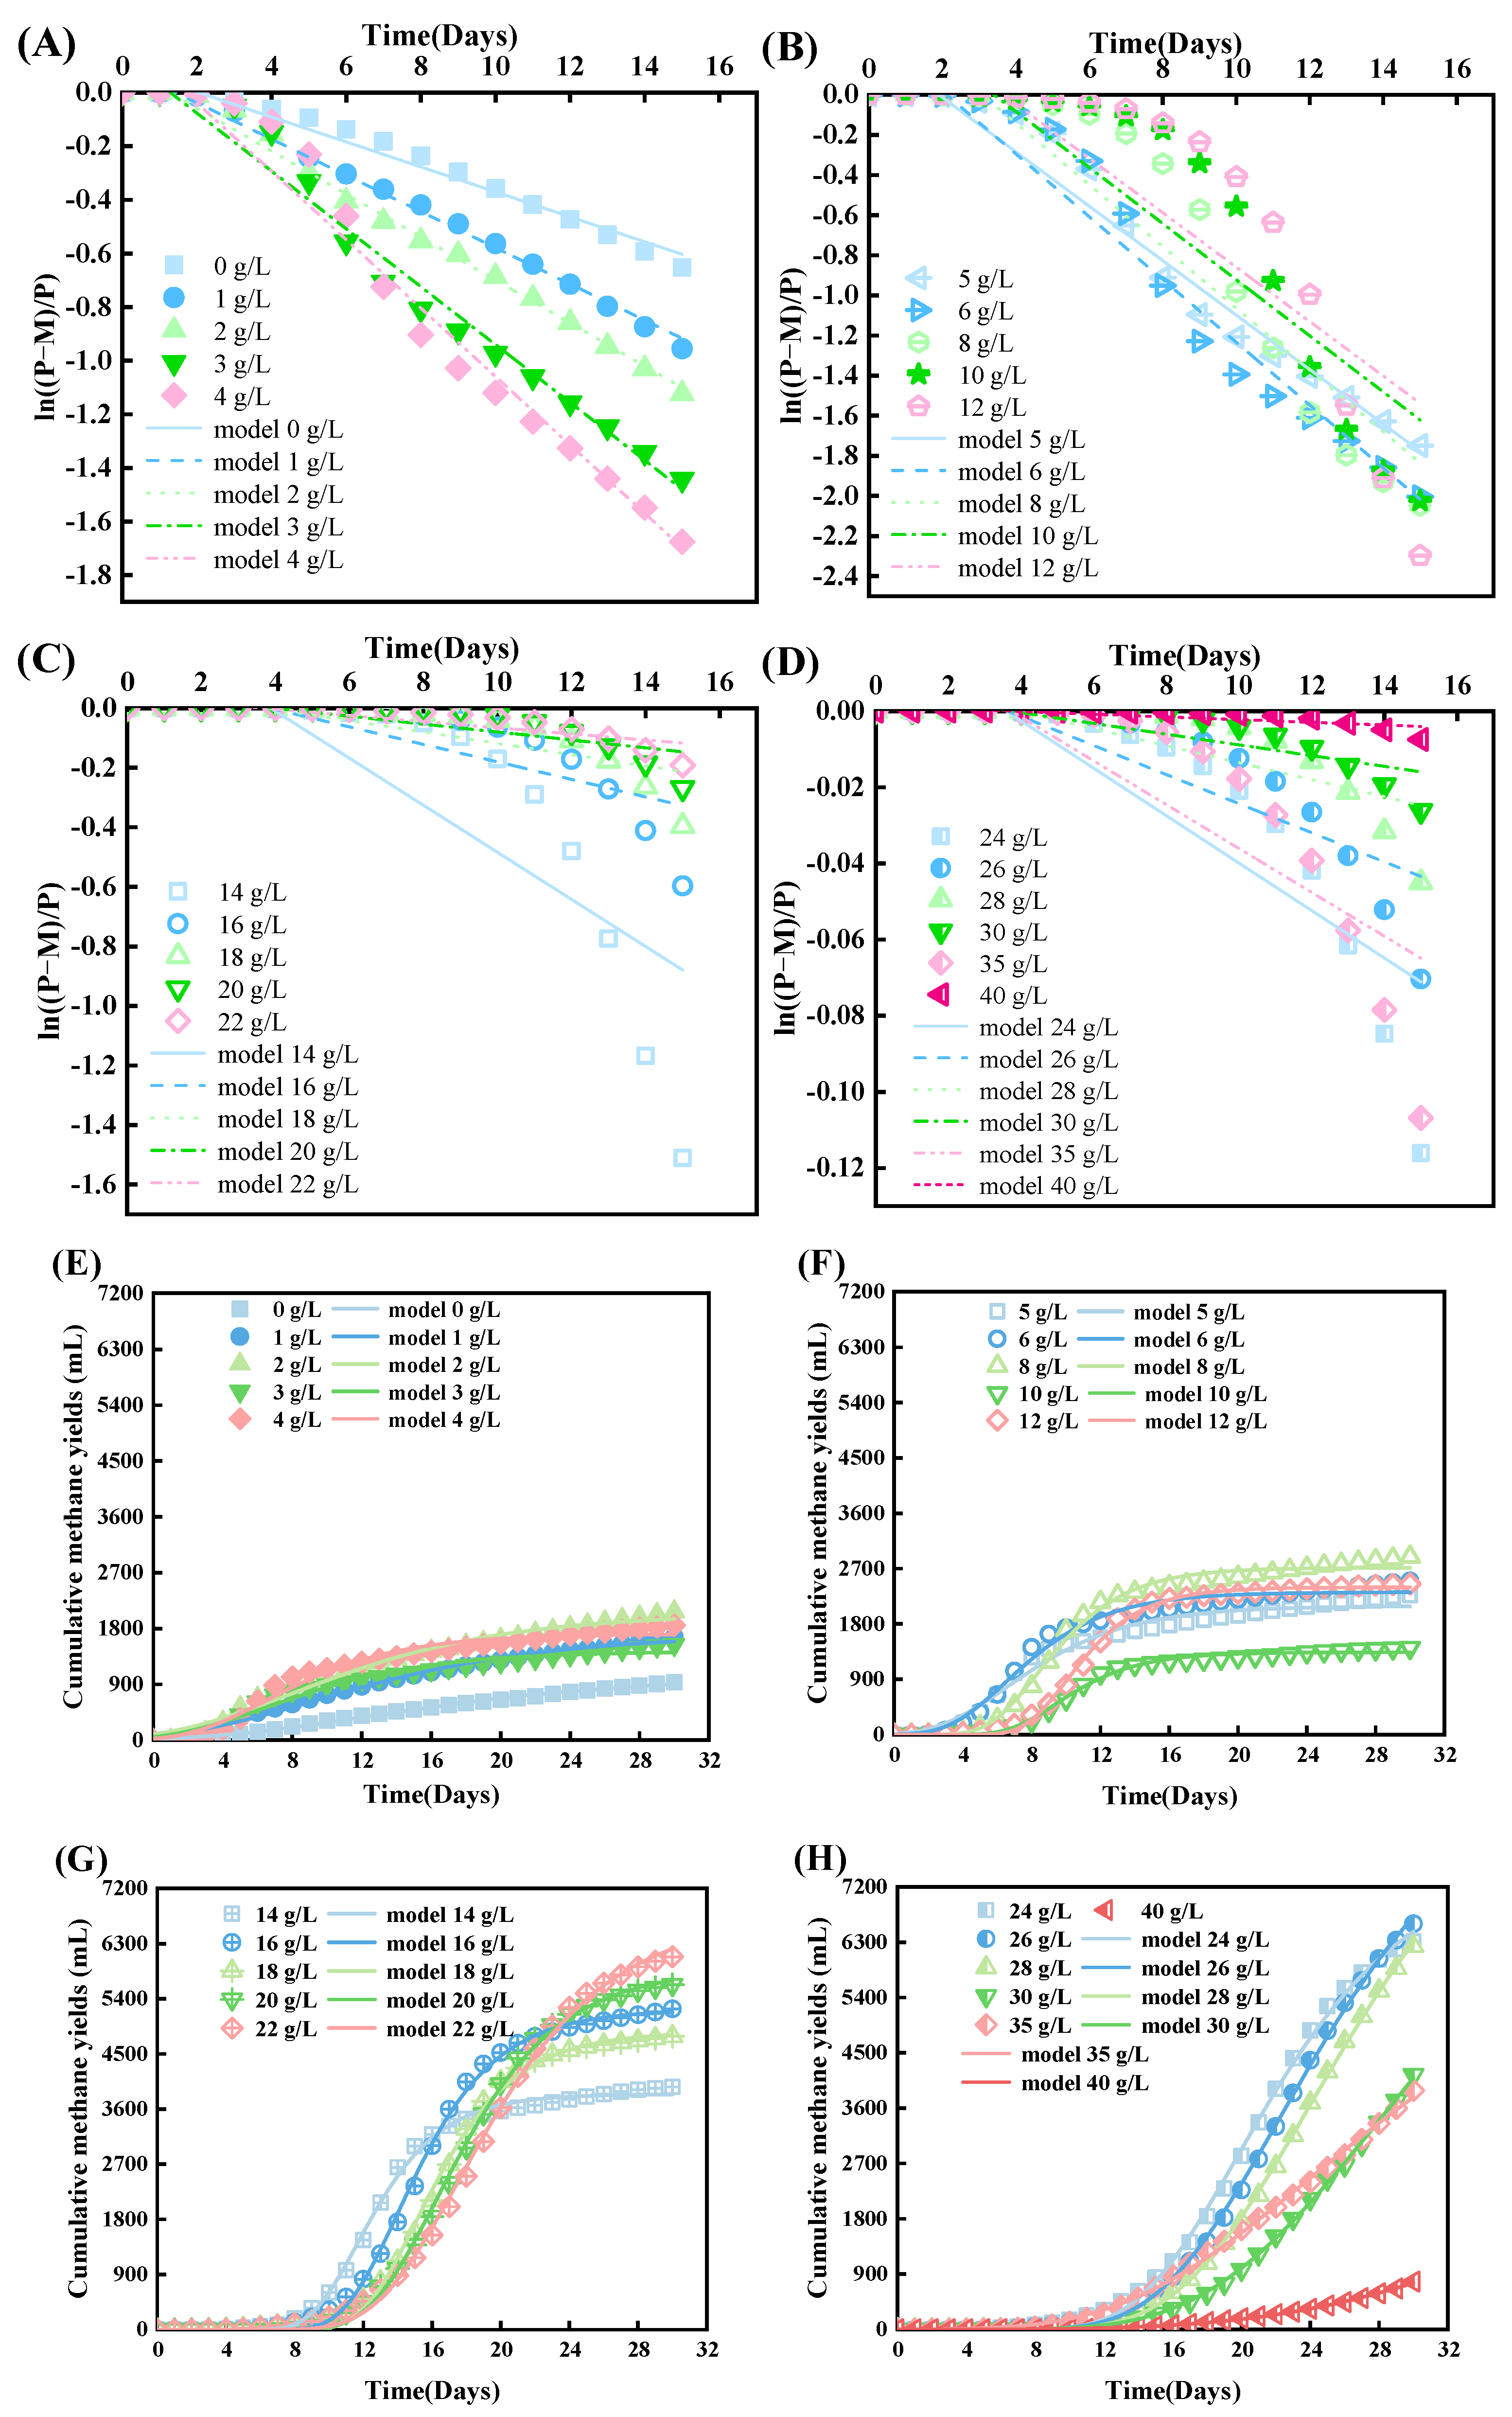
3.1. Batch Reactor’s Daily and Cumulative Methane Yields

The majority of treatments in the batch reactor’s daily methane yields exhibited similar trends, with a primary peak through the AD period (Figure 1). Unlike the system with fresh solid waste as the substrate, the treatments did not produce methane rapidly during the start-up phase of methanogenesis in AD, resulting in a lag period of varying duration. This could be related to the conversion that required the involvement of acidogenic bacteria, from sodium propionate to acetate, carbon dioxide, and hydrogen that could be utilized by methanogenic archaea. Meanwhile, excessive sodium propionate could do harm to the activity of methanogenic archaea as propionate was a key intermediate volatile fatty acid in AD and affects the efficiency and stability of anaerobic reactors [12]. Notably, there was a statistically significant positive relationship between the additive quantity of sodium propionate and the time delay period (Pearson correlation coefficient [r] = 0.960 and p = 0.000). This indicated that high levels of propionate significantly hindered the start-up of the methanogenesis in the AD system.
As AD was processed, these treatments started to generate more methane in the order of propionate content from low to high and reached the peaks of daily methane production quickly, which could be attributed to the decrease in VFAs in the substrate and the restoration of methanogenic activity, and suitable propionate was also recognized as a favorable carbon source [13]. It was obvious that these peaks were higher at first and then decreased with increasing additive quantity of sodium propionate. Actually, scanty sodium propionate could restrict the nutritional supply for methanogenesis, while excessive accumulation led to the destabilization of the system and then inhibited the production of methane [12]. The difference also resulted in the same trends of cumulative methane production as daily methane production in the batch reactor. Therefore, there was no doubt that the reactor’s cumulative methane production could reach its maximum when adding sodium propionate (22–28 g/L).

3.2. GM and FO Modeling

All fitting index (R2) values for the modified GM were above 97% (Figure 2E–H, Table 1). When sodium propionate was added at concentrations above 20 g/L, there was a relatively large difference between the experimental values of accumulated methane and the model predictions, implying that the modified GM model was not appropriate for describing digestion. In this case, more propionate contributed to a more complex relationship between the VFA output from substrate conversion and the consumption of VFAs, further affecting the regular metabolic process of microorganisms [14]. The relationship between Rmax and the concentrations of added sodium propionate showed a strong correlation and regularity, which had a highly linear positive correlation with the concentrations of added sodium propionate ranging from 0 to 18 g/L (R2 > 0.90) and a negative correlation ranging from 20 to 40 g/L (R2 > 0.90). This indicated that a moderate addition of sodium propionate could increase the Rmax of the system. Moreover, an increased additive amount caused the λ to be delayed and caused a highly linear positive correlation with the concentrations of added sodium propionate ranging from 0 to 40 g/L (R2 > 0.90), indicating an inhibition of the microbes which was in agreement with the methane production (Figure 1), as well as VFA accumulation (Figure 3).
The fitting index (R2) values for the FO model were found to be above 60% (Table 1 and Figure 2), suggesting a satisfactory level of performance. Kh exhibited a strong positive correlation (R2 > 0.90) with the inclusion of contents ranging from 0 to 8 g/L, while a negative correlation (R2 = 0.86) was observed with the inclusion of contents ranging from 10 to 40 g/L. Moreover, Kh increased with the added contents before 16 g/L and then decreased after this addition, implying that a low inclusion of contents was conducive to improving Kh, which was a result of the appropriate amount of sodium propionate as a substrate for microbial utilization, thereby increasing the rate of hydrolysis and acidification [13]. In addition, Kh increased quickly before 8 g/L and then remained around 0.2 (before 16 g/L). Similarly, Kh reduced rapidly after 16 g/L, indicating that adding excessive contents caused severe inhibitory effects on the microbes.

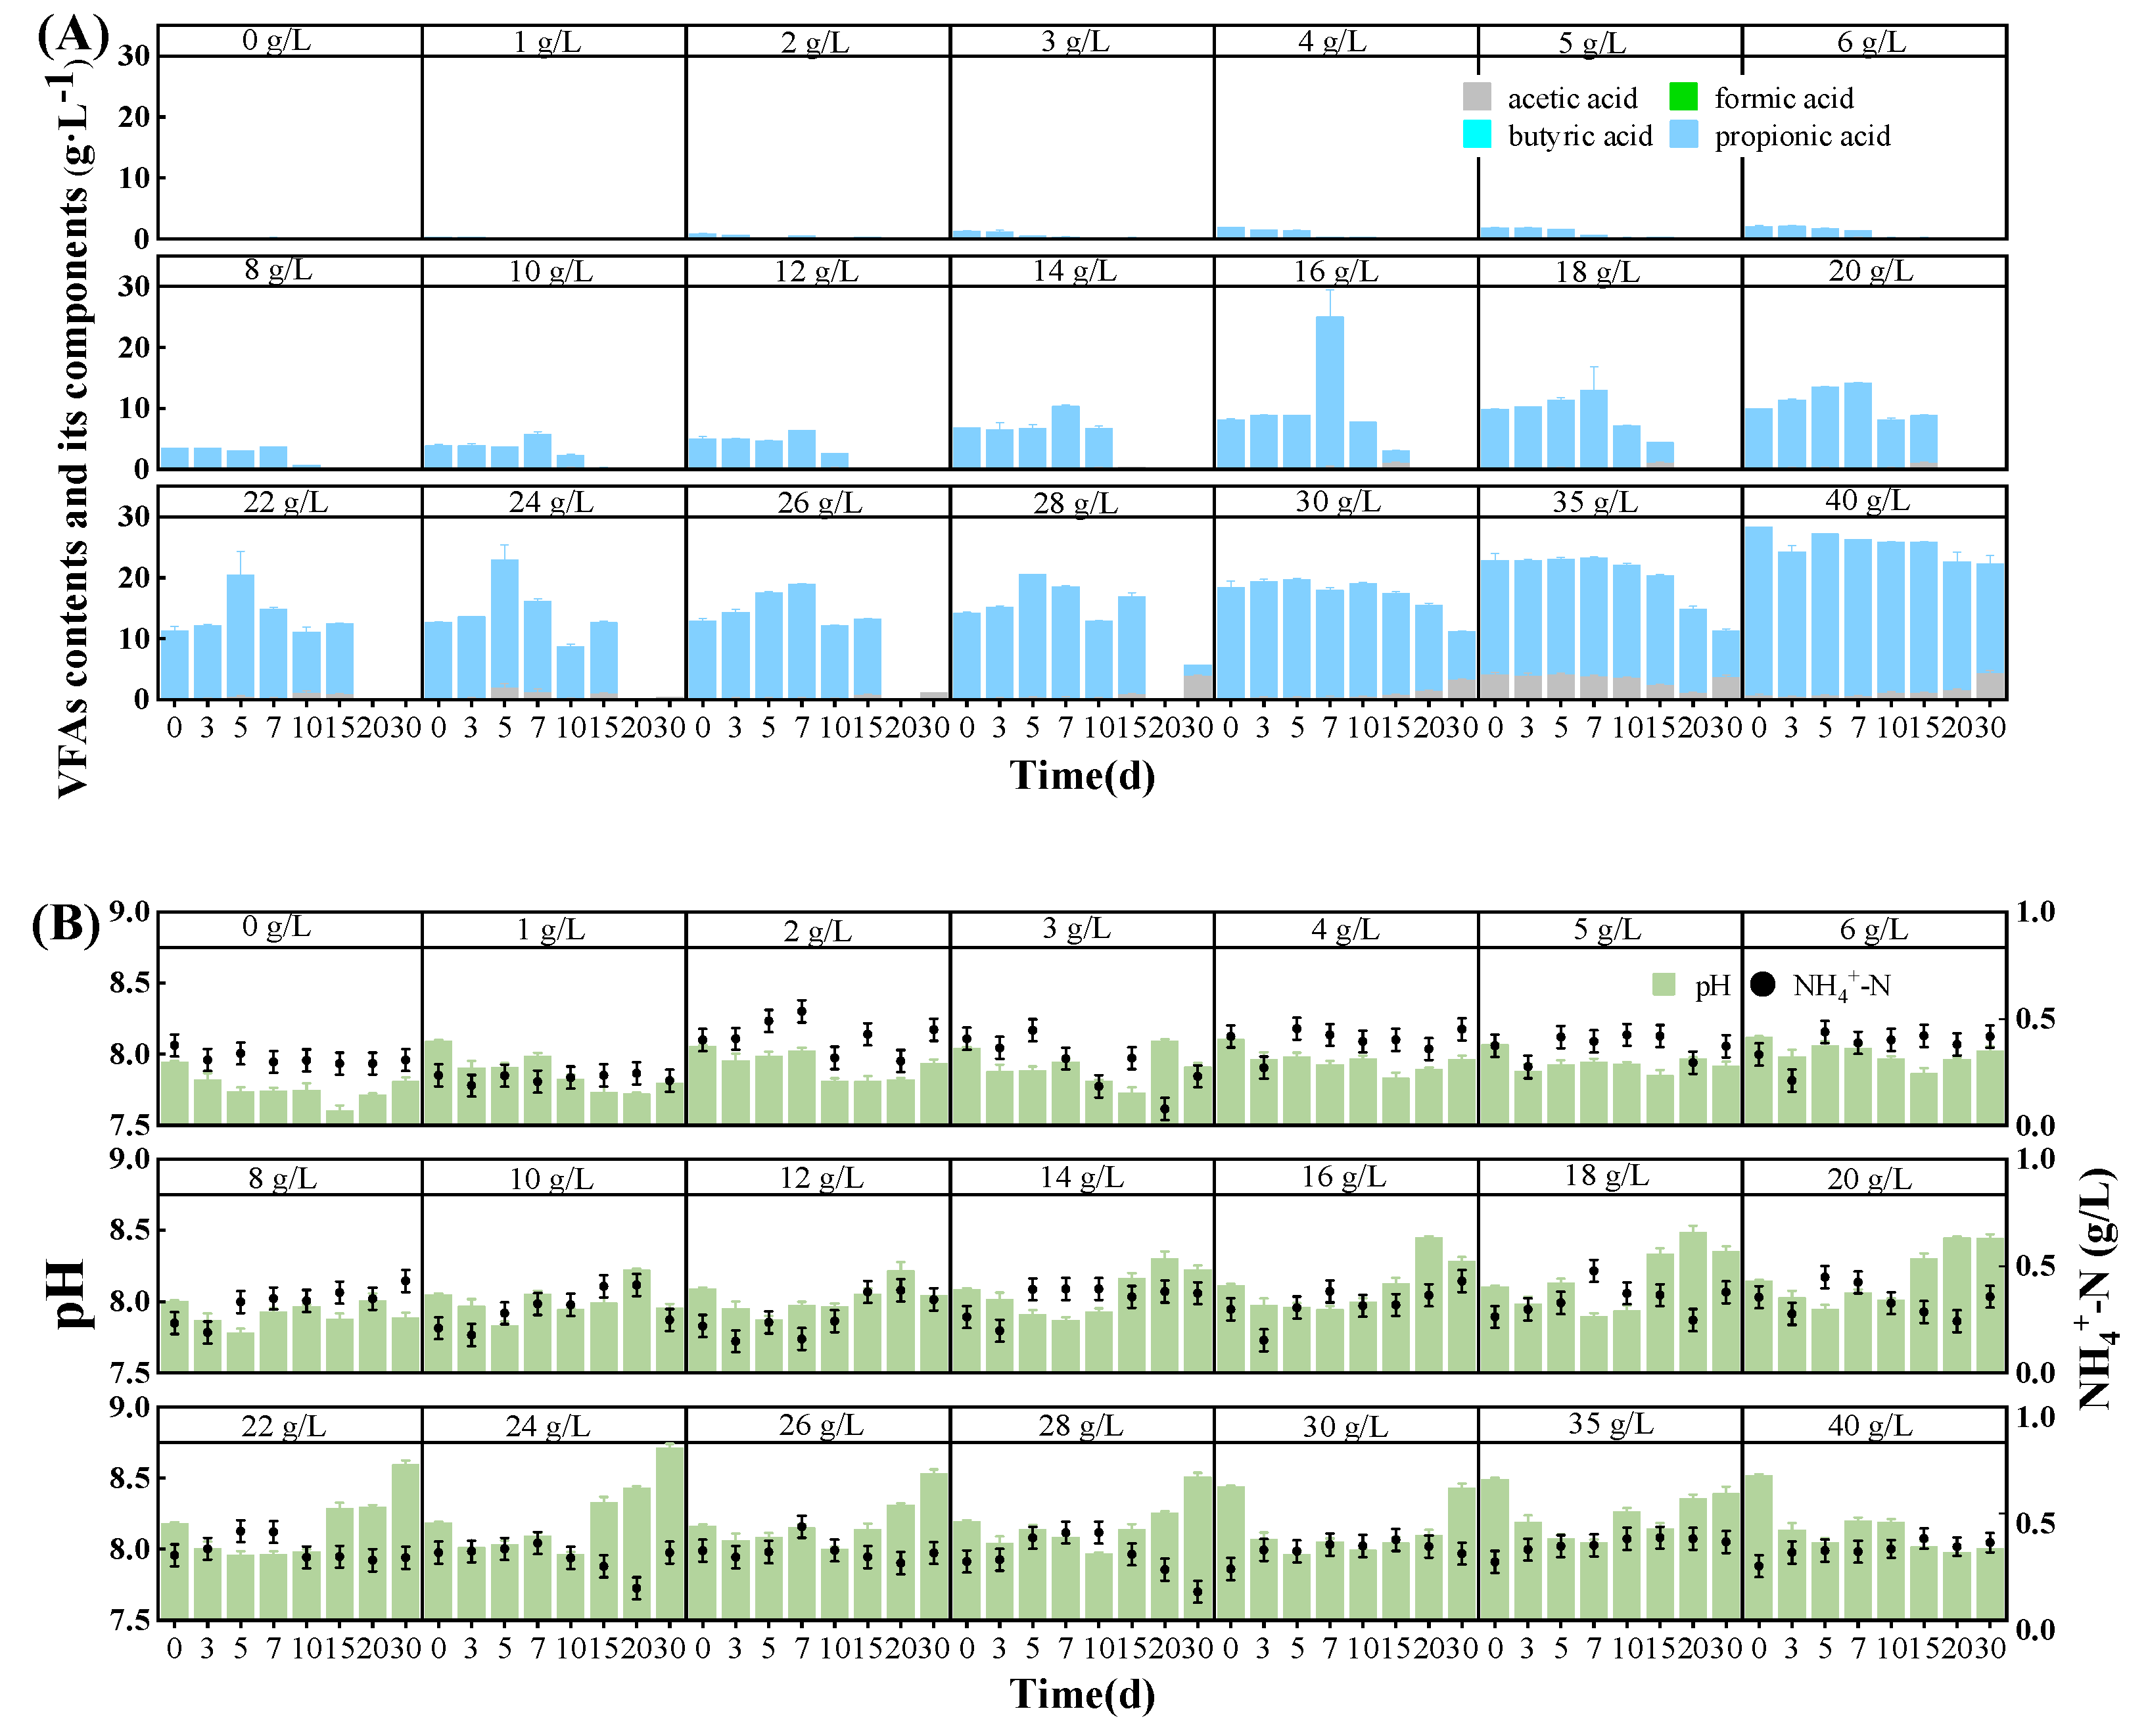
3.3. pH, NH4+-N, and VFA Contents

Three key characteristics of the widely used index indicating the stability of AD, including matrix pH, VFA contents, and NH4+-N contents, were monitored (Figure 3). It was clear that there was a strong regional characteristic between the VFA content and the additive quantity of sodium propionate. Briefly, when the concentration of sodium propionate ranged from 0 to 6 g/L, the VFA content declined throughout the AD process. That might be due to the limited carbon source in the substrate, such that propionate was quickly utilized for methanogenesis once added (Section 3.1) [13]. In contrast, the VFA content presented a slight increase followed by a rapid decrease (Figure 3A), when the concentration of sodium propionate was over 8 g/L. The initial increase in VFA concentration during AD might be explained by the fact that excessive sodium propionate inhibited the utilization of VFA methanogenesis [15,16]. In additon, carbon sources and microbial metabolites from the medium and inoculum could also be utilized to prompt the generation of VFAs [17].
The content of VFAs, especially for propionate, rose gradually with increasing sodium propionate content. As the addition of sodium propionate was above 16 g/L, the content of VFAs in the system would exceed 6 g/L. It was reported that this level of VFAs would disrupt the microbial activity and inhibit its function [18]. This might be the primary reason for the decline in hydrolysis and acidification rates with excessive sodium propionate (>16 g/L). The result indicated that the AD process was inhibited when the content of sodium propionate was over 16 g/L, and the degree of inhibition went up with more sodium propionate. Despite the suppression, a higher concentration of sodium propionate could still be taken as a carbon source and had the potential of methanogenesis. In addition, this was proof that there was little difference (<2%) between the theoretical methane production and experimental value when the addition of sodium propionate was less than 16 g/L. However, the gap between these two values rapidly expanded with the continued addition of sodium propionate. This revealed that superfluous sodium propionate (>16 g/L) was detrimental to the stability of the AD process.
The matrix pH of all treatments presented a trend of an initial decrease followed by fluctuant increases (Figure 3B). In the set-up stage, the decline in pH value might be attributed to the large-scale conversion from sodium propionate and other organic matter to acetic acid [13,19,20,21], while the matrix pH rose gradually with the generation of methane from VFAs [22]. Given that sodium propionate was an alkaline substance, the more additives that were added, the higher the matrix pH during the initial stage of AD. However, excessive sodium propionate resulted in the rapid decline in pH on the third day of AD, especially when the content exceeded 16 g/L. This proved that more VFAs accumulated under high sodium propionate concentration in AD. Despite slight fluctuations, the NH4+-N content (>0.6 g/L) remained relatively low, which indicated that these treatments were not inhibited by ammonium ions.

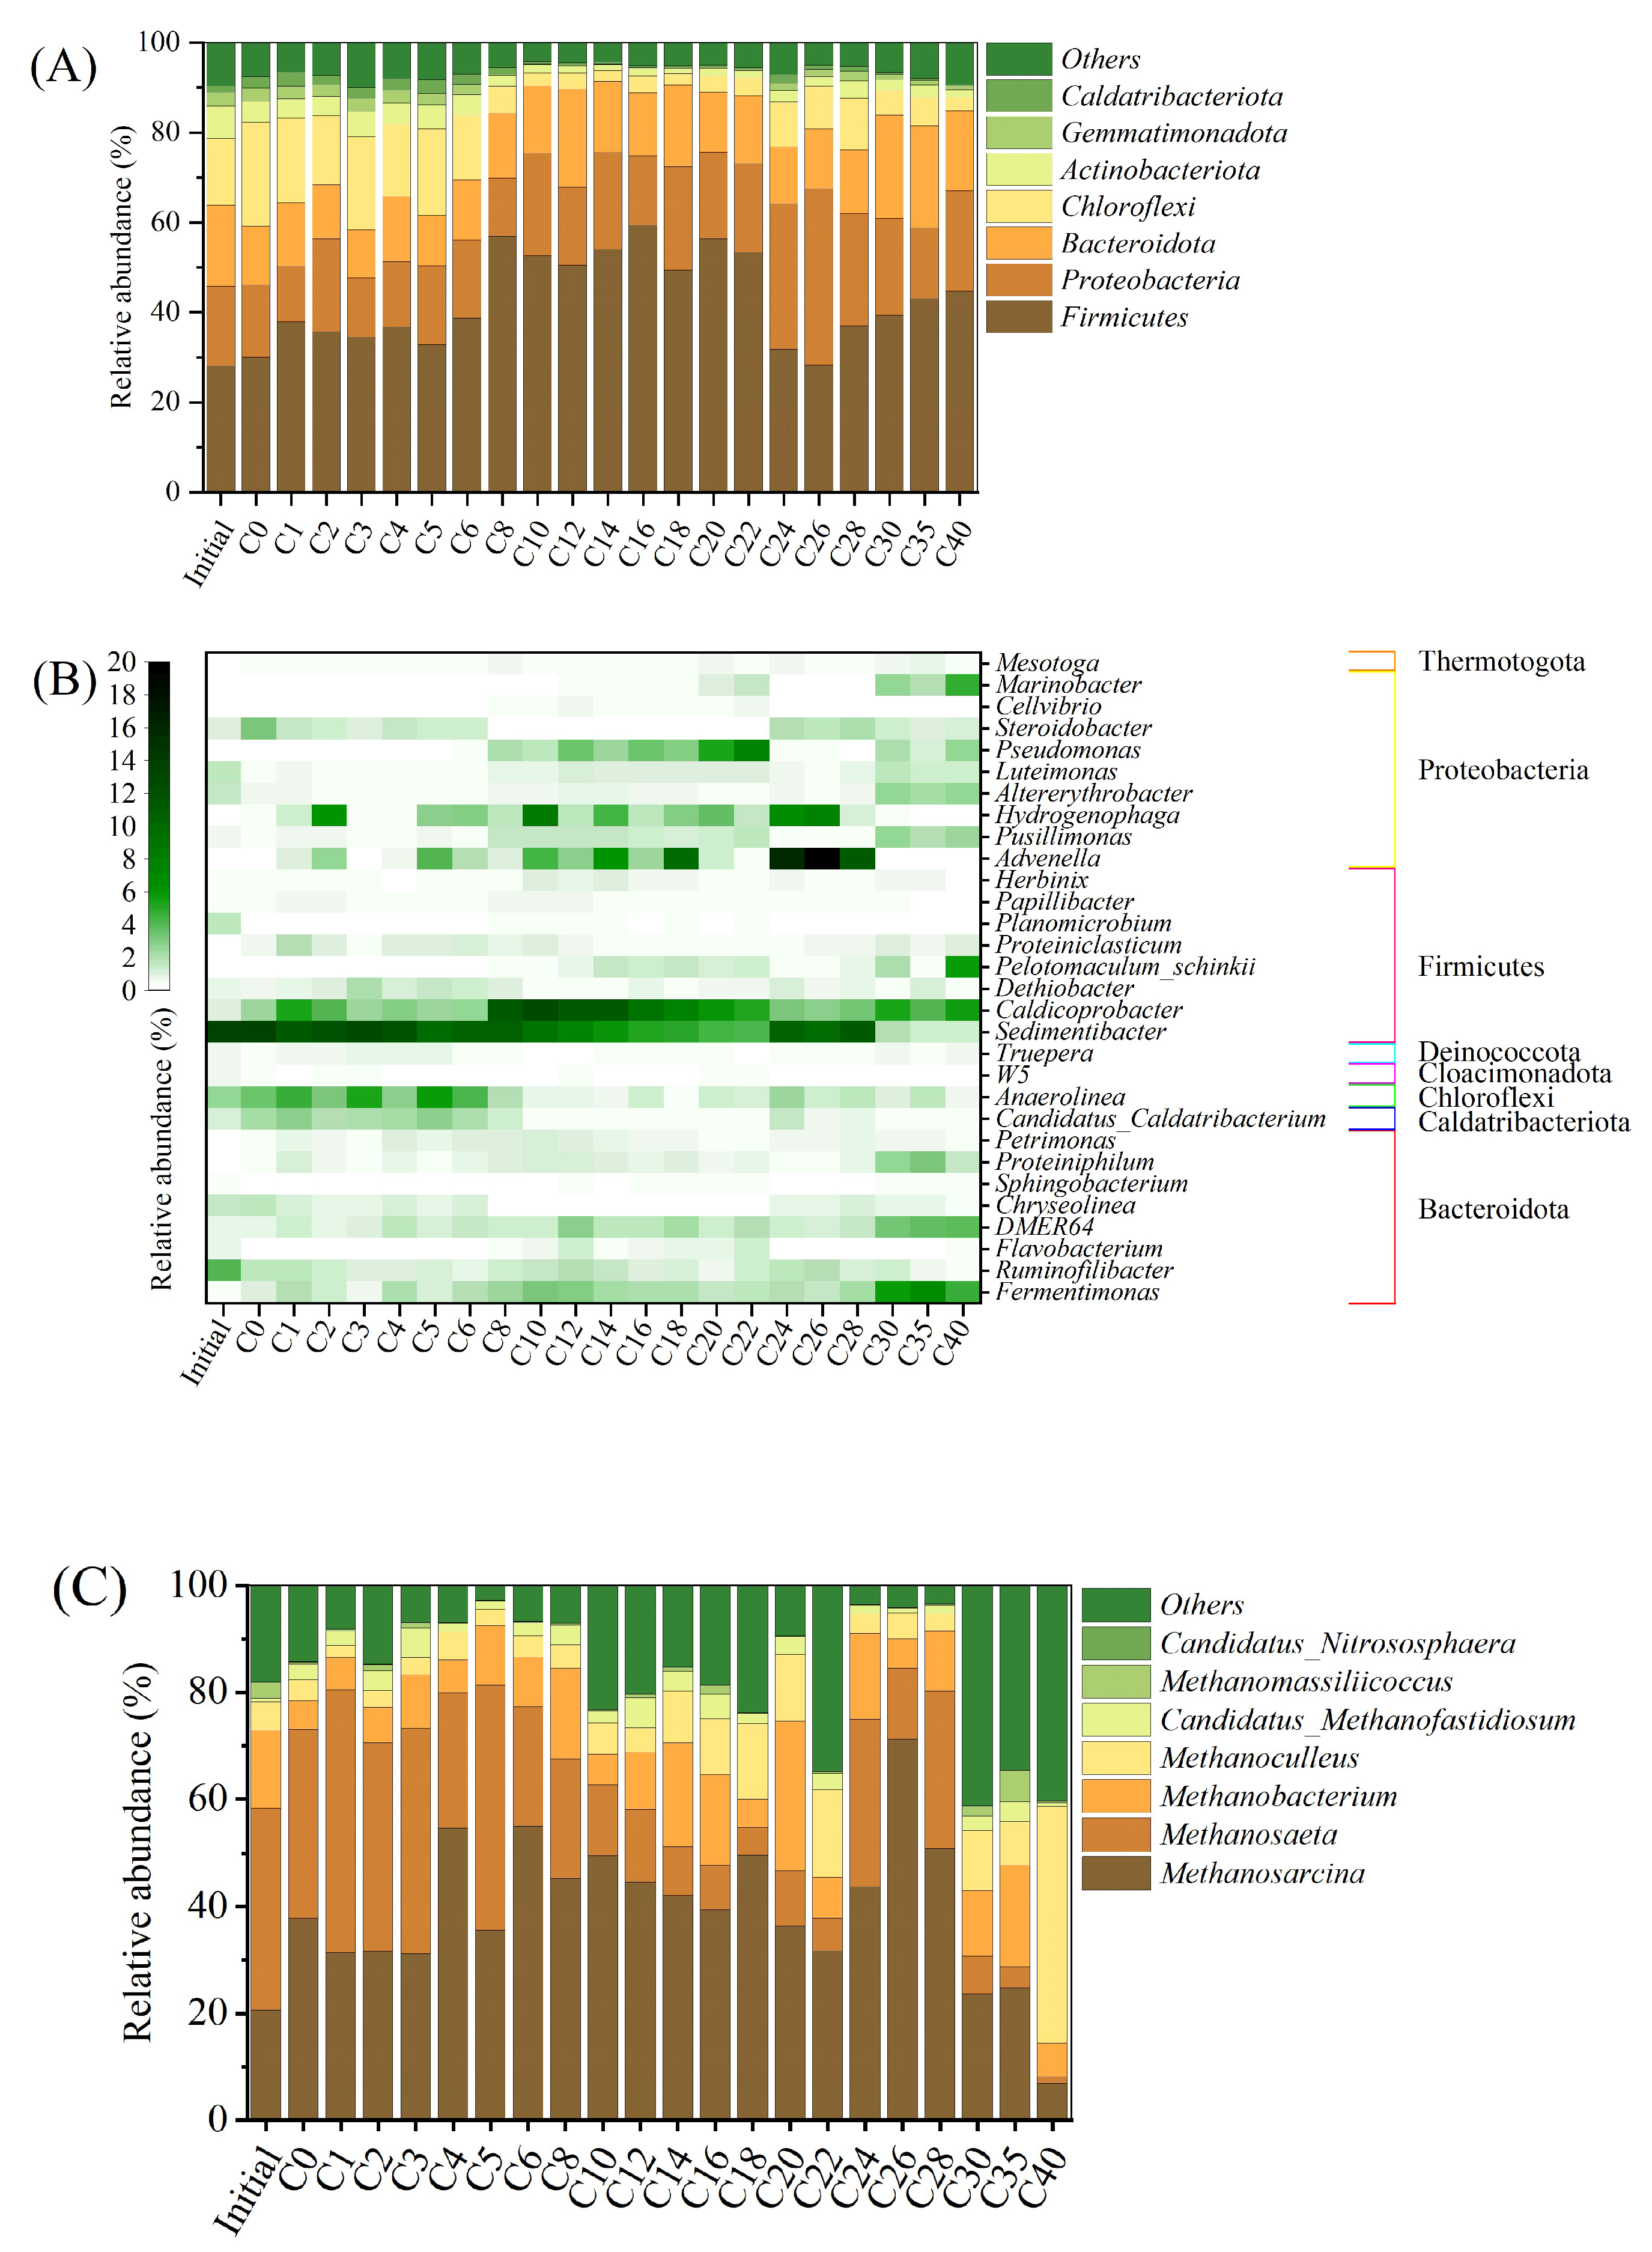
3.4. Microbiological Communities

All treatments showed the same dominant microorganisms, mainly including Firmicutes, Proteobacteria, Bacteroidota, and Chloroflexi (Figure 4A). The content of sodium propionate greatly influenced the stability and the methanogenic potential of AD, so these preponderant microorganisms changed a lot with the addition of more sodium propionate.
Firmicutes was the most advantageous phylum among all treatments (Figure 4A), consisting of Sedimentibacter, Caldicoprobacter, and Pelotomaculum schinkii (Figure 4B). It has been reported that Caldicoprobacter degraded recalcitrant organic matter to assist methanogenic archaea in methane production during the process of AD [23]. Sedimentibacter was able to utilize various organic materials and rarely consumed propionate [24,25,26]. It was obvious that the relative abundance of Sedimentibacter finally declined sharply after the initial increase and then decrease, while the relative abundance of Caldicoprobacte had the opposite trend. This suggests that when the content of sodium propionate was relatively low (<24 g/L), microbial communities sequentially enhanced their ability to consume VFAs with the addition of more sodium propionate during the acidification stage. However, with the continual enhancement in the sodium propionate content (after >30 g/L), the microbial community succession began to destabilize. Meanwhile, Pelotomaculum schinkii with an obligately syntrophic propionate-oxidizing function was activated [27], and it became enriched in the systems (Figure 1).
During the methanogenesis initiation to the peak, the relative abundance of Proteobacteria was the second dominant phylum only after that of Firmicutes, and it increased gradually with the rising concentration of sodium propionate ranging from 0 to 26 g/L, and then decreased. Further analysis demonstrated that these significant changes were mainly related to the genera such as Advenella, Hydrogenophaga, and Pseudomonas (Figure 4B). Sitthi et al. [12] reported that Advenella could convert long-chain organic matter into short-chain organic matter to promote methane production in the hydrogen and acetate acid metabolic pathway during AD. Hydrogenophaga was a typical hydrogen-based species, taking hydrogen as an electron donor and nitrate as an electron acceptor for autotrophic denitrification [28]. Therefore, there was nutritional competition between Hydrogenophaga and the typical denitrifying bacterium Pseudomonas [29,30]. In fact, there was only a small amount of nitrate in the substrate, which was from the inoculum and the transformation of NH4+-N in the culture medium. Notably, the relative abundance of Hydrogenophaga and Advenella went up with the addition of sodium propionate, but decreased quickly when the concentration exceeded 30 g/L. However, the relative abundance of Pseudomonas showed the opposite trend. Consequently, sodium propionate could be utilized and converted into methane efficiently within a certain range (<30 g/L), while superfluous addition restrained the activity of methanogenic archaea.
Bacteriodota showed a fluctuating increase with the addition of more sodium propionate, mainly including the genera with syntrophic function that were infrequent such as Fermentimonas, DMER64, and Proteiniphilum (Figure 4B) [31,32,33,34]. These genera usually had close syntropic relationships with other bacteria and then boosted the acidification rate. This phenomenon suggested that the accumulation of excessive VFAs prompted the emergence of syntropic relationships and resisted the negative environmental effects spontaneously. In addition, sodium propionate restrained some typical microorganisms that were remarkably beneficial to methane production, such as the genus Anaerolinea belonging to Chloroflexi. The data showed that the relative abundance of Chloroflexi dropped rapidly with the increase in sodium propionate concentration and proved that the accumulation of propionate limited the generation of methane. Nonetheless, the relative abundance of the phylum Chloroflexi exhibited a transient rebound as sodium propionate levels exceeded 22 g/L to accommodate the increasing methane production rates.
The results of the archaeal community showed that the relative abundance of the main acetotrophic methanogenic archaea, Methanosaeta, rapidly decreased with the addition of sodium propionate (Figure 4C) [35]. Among them, the relative abundance of Methanosaeta began to decline rapidly when the content of sodium propionate exceeded 6 g/L. In contrast, Methanosarcina showed a fluctuating upward trend when the content of sodium propionate was below 30 g/L, but it was quickly inhibited by higher concentrations of sodium propionate. It was reported that high concentrations of VFAs and NH4+-N environments could inhibit Methanosaeta, while Methanosarcina with thicker capsules could grow normally [3]. In addition, two hydrogenotrophic methanogenic archaeas, Methanobacterium and Methanoculleus, were enriched with the increase in sodium propionate concentration. These results indicated that in the AD process, due to the difference in tolerance of different archaea to sodium propionate, the nutritional structure of the archaeal community changed from acetotrophy to hydrogenotrophy.
The change in the structure of bacterial and archaeal communities showed that some microorganisms had different adaptabilities to sodium propionate content during anaerobic digestion processes. When the sodium propionate content exceeded 6 g/L, the anaerobic bacteria in the substrate began to show obvious successions, such as the abundance of Sedimentibacter, Caldicoprobacter, and Methanosaeta, indicating that these microorganisms may be most sensitive to sodium propionate content. As the sodium propionate content continued to rise to 24–28 g/L, some microorganisms that helped to reduce acid accumulation began to accumulate (e.g., Advenella and Methanosarcina) and then promoted methanation. However, when the sodium propionate content exceeded 30 g/L, most of the key anaerobic bacteria were rapidly inhibited, and obligately syntrophic propionate-oxidizing bacteria appeared in the microbial community structure, such as Pelotomaculum schinkii.
Therefore, the phenomenon that microorganisms changed with sodium propionate stress led to the gradient evolution of methane production. As mentioned earlier, when the sodium propionate content exceeded 16 g/L, the hydrolysis rate began to decrease, and the gap between the theoretical methane yield and the experimental value increased, indicating that the reaction process was limited. Lefse analyzed the effect of sodium propionate content on the microbial community when it exceeded 16 g/L. The results showed that low levels of sodium propionate addition contributed to the enrichment of Methanosaeta and Candidatus_Caldatribacterium. Candidatus_Caldatribacterium was an effective microorganism to promote acetic acid. Therefore, the presence of this microorganism contributed to the occurrence of acetate-trophic methanogenesis. On the contrary, high levels of sodium propionate contributed to the reproduction of Pelotomaculum schinkii which belongs to the genus with obligate propionate nutrition but lacked other functional microorganisms.

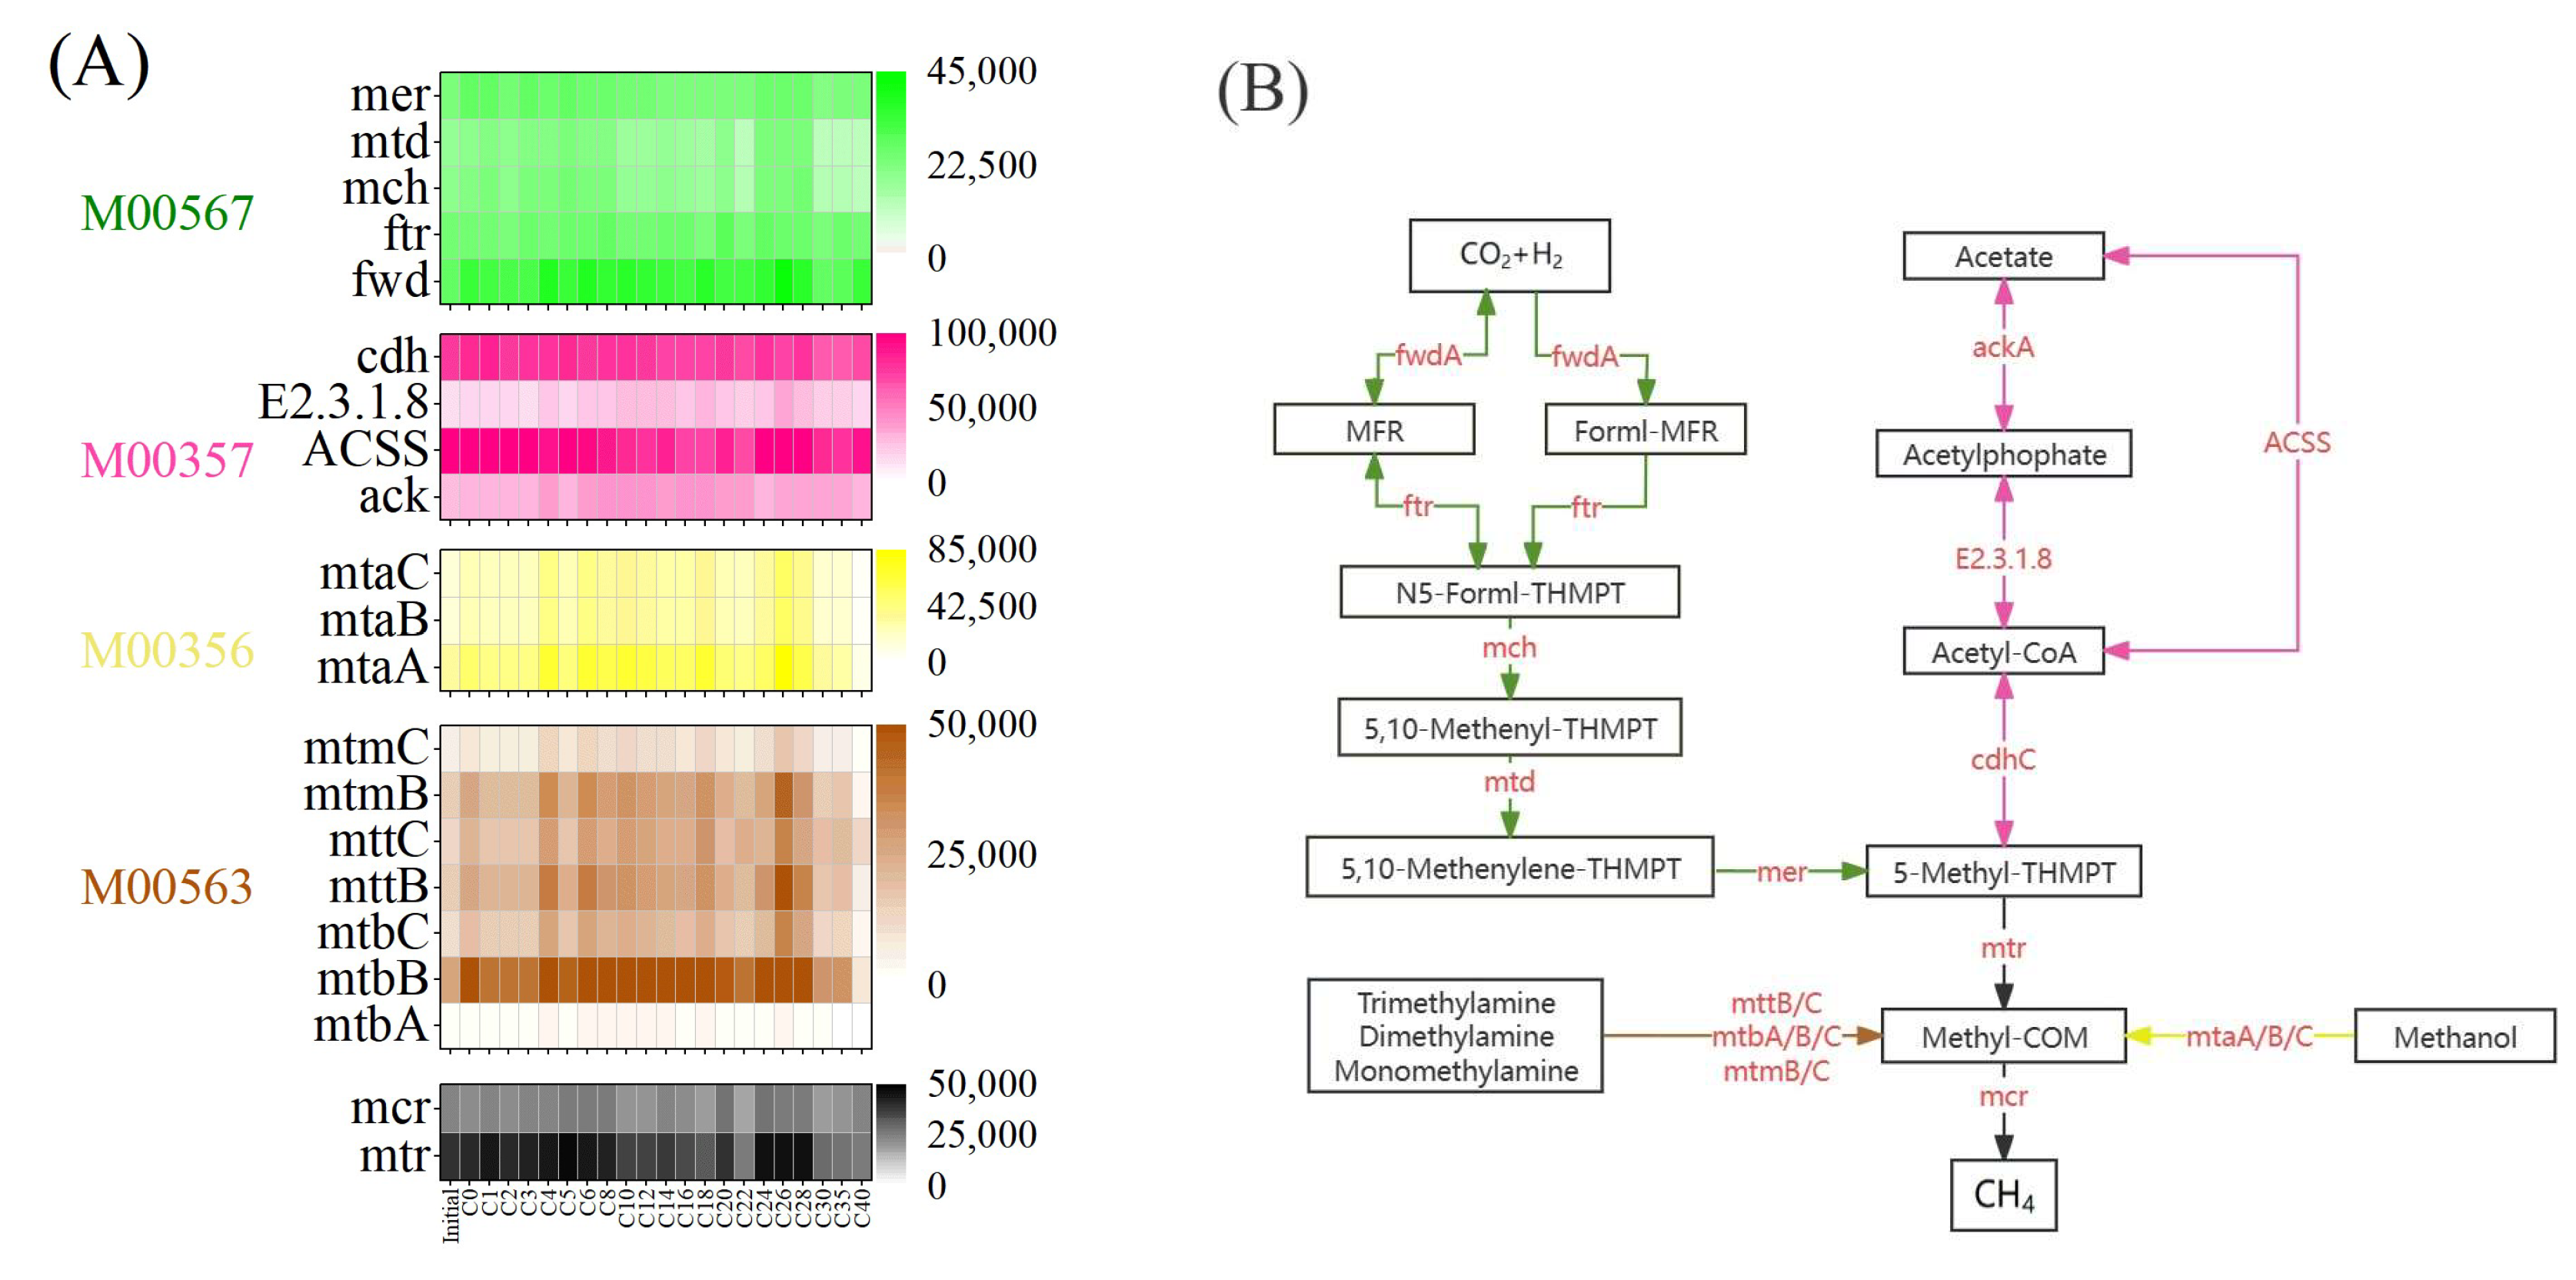
3.5. Microbial Functions for Methane Production

To further observe the stress of sodium propionate on anaerobic digestion, PICRUSt2 was used to characterize the dynamic succession of microbial functions (Figure 5). Obviously, the acetotrophic pathway (M00357) had the highest number of genes, followed by the hydrogenotrophic pathway (M00567) (Figure 5A). For example, in M00357, the conversion pathway from acetate to Methyl-COM was fluent and driven primarily by the acetyl-CoA synthetase (ACSS) and acetyl-CoA decarbonylase/synthase (cdh) genes (Figure 5B). Because the main nutrient in the substrate was derived from propionate, it was obvious that ACSS also assumes an important function in acetate synthesis.
It was noteworthy that the number of genes related to the acetotrophic pathway decreased after the addition of sodium propionate exceeded 16 g/L but was upregulated at 24–28 g/L. Furthermore, the number of genes associated with the hydrogenotrophic and methylotrophic (M00356 and M00563) pathways showed an oscillating upward trend with increasing sodium propionate addition, reaching a maximum at 24–28 g/L before declining. The key methyl-coenzyme M reductase (mcr) and tetrahydromethanopterin S-methyltransferase (mtr) gene numbers also peaked at 24–28 g/L of sodium propionate but exhibited an initial increase followed by a decrease at 0–22 g/L (Figure 5A). These results indicated differential responses of various methane production pathways to sodium propionate stress, possibly due to differences in the tolerance to high concentrations of VFAs by anaerobic bacteria and archaea. The sensitive Methanosaeta was gradually replaced by robust Methanosarcina with multiple nutrient requirements, adapting to the sodium propionate stress with increasing levels, resulting in intensified methane production. However, when the sodium propionate content exceeded 30 g/L, the functional genes were downregulated to the lowest level, limiting methane production (Figure 5A). This phenomenon could be attributed to the inability of the microbial community to adapt to the reactive oxygen species stress caused by high levels of propionate [36]. In addition, despite the activation of specialized metabolizing bacteria such as genus Pelotomaculum schinkii by high concentrations of sodium propionate, there was no advantage shown in the conversion pathway from propionate to acetate (Supplementary Figure S2). Therefore, high levels of propionate are difficult to alleviate by specialized microorganisms.

4. Conclusions

The microbial behavior exhibited interval characteristics in maintaining or enhancing methanogenesis as the concentration of sodium propionate changed. At lower concentrations, methanogenic archaea maintained the relative AD system stability and improved methane yield by sustaining the acetoclastic methanogenesis pathway or shifting to hydrogenotrophic methanogenesis. To adapt to higher propionate levels, acidogenic bacteria Advenella rapidly enriched to counter high VFA levels and Methanosarcina encouraged methane production through methylotrophic and hydrogenotrophic pathways. However, at even higher sodium propionate concentrations, specialized propionate-metabolizing bacteria such as Pelotomaculum schinkii rapidly proliferated, striving to avert system collapse, despite a significant reduction in methane yield by approximately 8.5 times. These results laid the groundwork for the future development of robust, propionate-degrading bacteria and complex microbial consortia, aimed at enhancing system tolerance and reducing the inhibition of propionate.

Supplementary Materials

The following supporting information can be downloaded at https://www.mdpi.com/article/10.3390/fermentation10040201/s1. Figure S1: Biomarkers of microorganisms at subordinate levels of high and low concentration levels of sodium propionate conditions during AD under relatively stringent conditions (LDA >4.0). Figure S2: (A) The networks of propionate metabolism and (B) absolute abundance of key genes during the operation of AD at different sodium propionate contents.

Author Contributions

Conceptualization, Z.Z.; data curation, Y.L. and S.L.; formal analysis, Y.L., L.L., J.H. and S.L.; investigation, M.L.; methodology, Z.Z.; resources, J.H.; software, J.H.; supervision, Y.W. and C.Q.; validation, L.L.; visualization, M.L.; writing—original draft preparation, M.L. and Y.L.; writing—review and editing, Z.Z., Y.W. and C.Q. All authors have read and agreed to the published version of the manuscript.

Funding

This work was financially supported by the Hebei Natural Science Foundation (Grant No. E2020204023), National Natural Science Foundation of China (Grant No. 32300092), and Talents Introduction Plan (Grant No. YJ201831) of the Hebei Agricultural University.

Institutional Review Board Statement

Not applicable.

Informed Consent Statement

Not applicable.

Data Availability Statement

The data presented in this study are available within the article and the Supplementary Materials.

Conflicts of Interest

The authors declare no conflicts of interest.

References

  1. Dahiya, S.; Kumar, A.N.; Shanthi Sravan, J.; Chatterjee, S.; Sarkar, O.; Mohan, S.V. Food Waste Biorefinery: Sustainable Strategy for Circular Bioeconomy. Bioresour. Technol. 2018, 248, 2–12. [Google Scholar] [CrossRef]
  2. Niknejad, P.; Azizi, S.M.M.; Hillier, K.; Gupta, R.; Dhar, B.R. Biodegradability and Transformation of Biodegradable Disposables in High-Solids Anaerobic Digestion Followed by Hydrothermal Liquefaction. Resour. Conserv. Recycl. 2023, 193, 106979. [Google Scholar] [CrossRef]
  3. Wang, W.; Lee, D.-J.; Lei, Z. Integrating Anaerobic Digestion with Microbial Electrolysis Cell for Performance Enhancement: A Review. Bioresour. Technol. 2022, 344, 126321. [Google Scholar] [CrossRef] [PubMed]
  4. Ma, Y.; Li, L.; Yang, P.; Peng, Y.; Peng, X. Exploring Instability Mechanisms of Overloaded Anaerobic Digestion Based on the Combination of Degradation Dynamics of Acetate and Propionate and Metagenomics Assay. Biochem. Eng. J. 2023, 198, 109032. [Google Scholar] [CrossRef]
  5. Yuan, H.; Zhu, N. Progress in Inhibition Mechanisms and Process Control of Intermediates and By-Products in Sewage Sludge Anaerobic Digestion. Renew. Sustain. Energy Rev. 2016, 58, 429–438. [Google Scholar] [CrossRef]
  6. Wong, B.-T.; Show, K.-Y.; Su, A.; Wong, R.; Lee, D.-J. Effect of Volatile Fatty Acid Composition on Upflow Anaerobic Sludge Blanket (UASB) Performance. Energy Fuels 2008, 22, 108–112. [Google Scholar] [CrossRef]
  7. Han, Y.; Green, H.; Tao, W. Reversibility of Propionic Acid Inhibition to Anaerobic Digestion: Inhibition Kinetics and Microbial Mechanism. Chemosphere 2020, 255, 126840. [Google Scholar] [CrossRef]
  8. Speece, R.E. Anaerobic Biotechnology and Odor/Corrosion Control for Municipalities and Industries; Archae Press: Nashville, TN, USA, 2008. [Google Scholar]
  9. Zheng, Z.; Liu, J.; Yuan, X.; Wang, X.; Zhu, W.; Yang, F.; Cui, Z. Effect of Dairy Manure to Switchgrass Co-Digestion Ratio on Methane Production and the Bacterial Community in Batch Anaerobic Digestion. Appl. Energy 2015, 151, 249–257. [Google Scholar] [CrossRef]
  10. Lay, J.; Li, Y.; Noike, T. Analysis of Environmental Factors Affecting Methane Production from High-Solids Organic Waste. Water Sci. Technol. 1997, 36, 493–500. [Google Scholar] [CrossRef]
  11. Zhang, W.; Wei, Q.; Wu, S.; Qi, D.; Li, W.; Zuo, Z.; Dong, R. Batch Anaerobic Co-Digestion of Pig Manure with Dewatered Sewage Sludge under Mesophilic Conditions. Appl. Energy 2014, 128, 175–183. [Google Scholar] [CrossRef]
  12. Sitthi, S.; Hatamoto, M.; Watari, T.; Yamaguchi, T. Accelerating Anaerobic Propionate Degradation and Studying Microbial Community Using Modified Polyvinyl Alcohol Beads during Anaerobic Digestion. Bioresour. Technol. Rep. 2022, 17, 100907. [Google Scholar] [CrossRef]
  13. Zhou, M.; Yan, B.; Wong, J.W.C.; Zhang, Y. Enhanced Volatile Fatty Acids Production from Anaerobic Fermentation of Food Waste: A Mini-Review Focusing on Acidogenic Metabolic Pathways. Bioresour. Technol. 2018, 248, 68–78. [Google Scholar] [CrossRef]
  14. Abbassi-Guendouz, A.; Trably, E.; Hamelin, J.; Dumas, C.; Steyer, J.P.; Delgenès, J.-P.; Escudié, R. Microbial Community Signature of High-Solid Content Methanogenic Ecosystems. Bioresour. Technol. 2013, 133, 256–262. [Google Scholar] [CrossRef]
  15. Wu, D.; Li, L.; Zhen, F.; Liu, H.; Xiao, F.; Sun, Y.; Peng, X.; Li, Y.; Wang, X. Thermodynamics of Volatile Fatty Acid Degradation during Anaerobic Digestion under Organic Overload Stress: The Potential to Better Identify Process Stability. Water Res. 2022, 214, 118187. [Google Scholar] [CrossRef] [PubMed]
  16. Singh, A.; Schnürer, A.; Westerholm, M. Enrichment and Description of Novel Bacteria Performing Syntrophic Propionate Oxidation at High Ammonia Level. Environ. Microbiol. 2021, 23, 1620–1637. [Google Scholar] [CrossRef] [PubMed]
  17. Holtzapple, M.T.; Wu, H.; Weimer, P.J.; Dalke, R.; Granda, C.B.; Mai, J.; Urgun-Demirtas, M. Microbial Communities for Valorizing Biomass Using the Carboxylate Platform to Produce Volatile Fatty Acids: A Review. Bioresour. Technol. 2022, 344, 126253. [Google Scholar] [CrossRef]
  18. Zhou, Y.; Li, C.; Nges, I.A.; Liu, J. The Effects of Pre-Aeration and Inoculation on Solid-State Anaerobic Digestion of Rice Straw. Bioresour. Technol. 2017, 224, 78–86. [Google Scholar] [CrossRef] [PubMed]
  19. Jin, Z.; Yang, S.-T. Extractive Fermentation for Enhanced Propionic Acid Production from Lactose by Propionibacterium Acidipropionici. Biotechnol. Prog. 1998, 14, 457–465. [Google Scholar] [CrossRef]
  20. Stams, A.J.M.; De Bok, F.A.M.; Plugge, C.M.; Van Eekert, M.H.A.; Dolfing, J.; Schraa, G. Exocellular Electron Transfer in Anaerobic Microbial Communities. Environ. Microbiol. 2006, 8, 371–382. [Google Scholar] [CrossRef]
  21. Yue, Y.; Wang, J.; Wu, X.; Zhang, J.; Chen, Z.; Kang, X.; Lv, Z. The Fate of Anaerobic Syntrophy in Anaerobic Digestion Facing Propionate and Acetate Accumulation. Waste Manag. 2021, 124, 128–135. [Google Scholar] [CrossRef]
  22. Li, Y.; Chen, Y.; Wu, J. Enhancement of Methane Production in Anaerobic Digestion Process: A Review. Appl. Energy 2019, 240, 120–137. [Google Scholar] [CrossRef]
  23. Widyasti, E.; Shikata, A.; Hashim, R.; Sulaiman, O.; Sudesh, K.; Wahjono, E.; Kosugi, A. Biodegradation of Fibrillated Oil Palm Trunk Fiber by a Novel Thermophilic, Anaerobic, Xylanolytic Bacterium Caldicoprobacter Sp. CL-2 Isolated from Compost. Enzyme Microb. Technol. 2018, 111, 21–28. [Google Scholar] [CrossRef] [PubMed]
  24. Zhao, Z.; Wang, J.; Li, Y.; Zhu, T.; Yu, Q.; Wang, T.; Liang, S.; Zhang, Y. Why Do DIETers like Drinking: Metagenomic Analysis for Methane and Energy Metabolism during Anaerobic Digestion with Ethanol. Water Res. 2020, 171, 115425. [Google Scholar] [CrossRef] [PubMed]
  25. Li, J.; Rui, J.; Pei, Z.; Sun, X.; Zhang, S.; Yan, Z.; Wang, Y.; Liu, X.; Zheng, T.; Li, X. Straw- and Slurry-Associated Prokaryotic Communities Differ during Co-Fermentation of Straw and Swine Manure. Appl. Microbiol. Biotechnol. 2014, 98, 4771–4780. [Google Scholar] [CrossRef] [PubMed]
  26. Imachi, H.; Sakai, S.; Kubota, T.; Miyazaki, M.; Saito, Y.; Takai, K. Sedimentibacter Acidaminivorans Sp. Nov., an Anaerobic, Amino-Acid-Utilizing Bacterium Isolated from Marine Subsurface Sediment. Int. J. Syst. Evol. Microbiol. 2016, 66, 1293–1300. [Google Scholar] [CrossRef] [PubMed]
  27. De Bok, F.A.M.; Harmsen, H.J.M.; Plugge, C.M.; De Vries, M.C.; Akkermans, A.D.L.; De Vos, W.M.; Stams, A.J.M. The First True Obligately Syntrophic Propionate-Oxidizing Bacterium, Pelotomaculum Schinkii Sp. Nov., Co-Cultured with Methanospirillum Hungatei, and Emended Description of the Genus Pelotomaculum. Int. J. Syst. Evol. Microbiol. 2005, 55, 1697–1703. [Google Scholar] [CrossRef] [PubMed]
  28. Sun, Q.; Zhu, G. Deciphering the Effects of Antibiotics on Nitrogen Removal and Bacterial Communities of Autotrophic Denitrification Systems in a Three-Dimensional Biofilm Electrode Reactor. Environ. Pollut. 2022, 315, 120476. [Google Scholar] [CrossRef] [PubMed]
  29. Li, Y.; Tang, Y.; Xiong, P.; Zhang, M.; Deng, Q.; Liang, D.; Zhao, Z.; Feng, Y.; Zhang, Y. High-Efficiency Methanogenesis via Kitchen Wastes Served as Ethanol Source to Establish Direct Interspecies Electron Transfer during Anaerobic Co-Digestion with Waste Activated Sludge. Water Res. 2020, 176, 115763. [Google Scholar] [CrossRef] [PubMed]
  30. Gieg, L.M.; Fowler, S.J.; Berdugo-Clavijo, C. Syntrophic Biodegradation of Hydrocarbon Contaminants. Curr. Opin. Biotechnol. 2014, 27, 21–29. [Google Scholar] [CrossRef]
  31. Basak, B.; Patil, S.M.; Kumar, R.; Ahn, Y.; Ha, G.-S.; Park, Y.-K.; Ali Khan, M.; Jin Chung, W.; Woong Chang, S.; Jeon, B.-H. Syntrophic Bacteria- and Methanosarcina-Rich Acclimatized Microbiota with Better Carbohydrate Metabolism Enhances Biomethanation of Fractionated Lignocellulosic Biocomponents. Bioresour. Technol. 2022, 360, 127602. [Google Scholar] [CrossRef]
  32. Zhang, Q.; Wu, L.; Huang, J.; Qu, Y.; Pan, Y.; Liu, L.; Zhu, H. Recovering Short-Chain Fatty Acids from Waste Sludge via Biocarriers and Microfiltration Enhanced Anaerobic Fermentation. Resour. Conserv. Recycl. 2022, 182, 106342. [Google Scholar] [CrossRef]
  33. Xie, Z.; Huang, S.; Wan, Y.; Deng, F.; Cao, Q.; Liu, X.; Li, D. Power to Biogas Upgrading: Effects of Different H2/CO2 Ratios on Products and Microbial Communities in Anaerobic Fermentation System. Sci. Total Environ. 2023, 865, 161305. [Google Scholar] [CrossRef] [PubMed]
  34. Lei, Z.; Zhi, L.; Jiang, H.; Chen, R.; Wang, X.; Li, Y.-Y. Characterization of Microbial Evolution in High-Solids Methanogenic Co-Digestion of Canned Coffee Processing Wastewater and Waste Activated Sludge by an Anaerobic Membrane Bioreactor. J. Clean. Prod. 2019, 232, 1442–1451. [Google Scholar] [CrossRef]
  35. Tuncay, S.; Akcakaya, M.; Icgen, B. Ozonation of Sewage Sludge Prior to Anaerobic Digestion Led to Methanosaeta Dominated Biomethanation. Fuel 2022, 313, 122690. [Google Scholar] [CrossRef]
  36. Yan, M.; Hu, Z.; Duan, Z.; Sun, Y.; Dong, T.; Sun, X.; Zhen, F.; Li, Y. Microbiome Re-Assembly Boosts Anaerobic Digestion under Volatile Fatty Acid Inhibition: Focusing on Reactive Oxygen Species Metabolism. Water Res. 2023, 246, 120711. [Google Scholar] [CrossRef]
Figure 1. (A,B) Daily and (C) accumulative CH4 yield during the operation of AD at different sodium propionate contents. (A) The sodium propionate content from 0 to 12 g/L in AD; (B) the sodium propionate content from 14 to 40 g/L in AD.
Fermentation 10 00201 g001aFermentation 10 00201 g001b
Figure 2. (AD) GM model and (EH) FO model of main stages of propionate utilization during the operation of AD at different sodium propionate contents. (A) Sodium propionate content from 0 to 4 g/L in AD; (B) 5 to 12 g/L; (C) 14 to 22 g/L; (D) 24 to 40 g/L. The same concentration sequence of sodium propionate content appears in (EH).
Fermentation 10 00201 g002
Figure 3. (A) VFAs and their component content, and (B) pH and NH4+-N content during the operation of AD at different sodium propionate contents.
Fermentation 10 00201 g003
Figure 4. (A,B) Relative abundance of bacteria at phylum and genus levels, respectively, and (C) relative abundance of archaea at genus level during the operation of AD at different sodium propionate contents. C0 and C40 represent sodium propionate concentrations ranging from 0 to 40 g/L.
Fermentation 10 00201 g004
Figure 5. (A) Absolute abundance of key genes during the operation of AD at different sodium propionate contents and (B) Methanogenic metabolic pathway. C0 and C40 represent sodium propionate concentrations ranging from 0 to 40 g/L.
Fermentation 10 00201 g005
Table 1. GM and FO model results under different sodium propionate concentrations.
FOGM
Sodium
Propionate
Contents (g/L)
Hydrolytic Acidification Rate KhFitting Index R2Predicted Value
P (mL)
Experimental Value M (mL)Maximum
Methane Yield Rate Rmax (mL/d)
Delay Period λ (d)Fitting Index R2
00.07200.941037.713935.8042.180513.320.995
10.10320.911701.911663.6480.861.420.992
20.12420.842041.612069.91106.110.890.984
30.15050.841434.071538.0797.951.120.972
40.15400.931711.891851.66143.602.030.977
50.17190.902090.422264.60192.852.550.980
60.18620.922314.772501.21257.103.180.985
80.22100.772713.412891.18349.415.500.993
100.20820.801339.281412.67181.806.670.994
120.22440.882394.502452.58359.137.580.998
140.22450.663844.983959.53516.598.930.998
160.16020.855215.395234.62599.7210.840.999
180.14640.854855.224786.56561.3611.940.998
200.10960.835884.025629.49545.0912.370.999
220.08090.826723.586084.24507.1512.760.998
240.05640.787678.986314.10488.2114.000.998
260.03750.769361.126601.25488.8315.190.999
280.02900.739921.926233.15479.9116.390.999
300.01510.739908.194141.75348.0818.240.999
350.02620.846747.833891.21228.8713.240.999
400.00350.756473.39777.07127.2425.580.999
Disclaimer/Publisher’s Note: The statements, opinions and data contained in all publications are solely those of the individual author(s) and contributor(s) and not of MDPI and/or the editor(s). MDPI and/or the editor(s) disclaim responsibility for any injury to people or property resulting from any ideas, methods, instructions or products referred to in the content.

