

The Effect of Different Medium Compositions and LAB Strains on Fermentation Volatile Organic Compounds (VOCs) Analysed by Proton Transfer Reaction-Time of Flight-Mass Spectrometry (PTR-ToF-MS)

 ,
,  , ,
, ,  and
and
Abstract
1. Introduction
2. Materials and Methods
2.1. LAB Strains
2.2. Medium Compositions
2.3. Fermentation
2.4. Determination of VOCs
2.4.1. PTR-ToF-MS
2.4.2. HS-SPME-GC-MS
2.4.3. FastGC-PTR-ToF-MS
2.5. Statistical Analysis
3. Results and Discussion
3.1. Physicochemical Properties after Fermentation
3.2. VOCs Produced during Fermentation
3.2.1. Ethanol
3.2.2. Thr-Derived VOCs
3.2.3. Met-Derived VOCs
3.2.4. Ile-Derived VOCs
3.2.5. Other VOCs
4. Conclusions
Supplementary Materials
Author Contributions
Funding
Institutional Review Board Statement
Informed Consent Statement
Data Availability Statement
Acknowledgments
Conflicts of Interest
References
- Clem, J.; Barthel, B. A look at plant-based diets. Mo. Med. 2021, 118, 233–238. [Google Scholar]
- Lea, E.J.; Crawford, D.; Worsley, A. Consumers’ readiness to eat a plant-based diet. Eur. J. Clin. Nutr. 2006, 60, 342–351. [Google Scholar] [CrossRef]
- Pointke, M.; Pawelzik, E. Plant-based alternative products: Are they healthy alternatives? Micro- and macronutrients and nutritional scoring. Nutrients 2022, 14, 601. [Google Scholar] [CrossRef] [PubMed]
- Michel, F.; Hartmann, C.; Siegrist, M. Consumers’ associations, perceptions and acceptance of meat and plant-based meat alternatives. Food Qual. Prefer. 2021, 87, 104063. [Google Scholar] [CrossRef]
- Aschemann-Witzel, J.; Gantriis, R.F.; Fraga, P.; Perez-Cueto, F.J.A. Plant-based food and protein trend from a business perspective: Markets, consumers, and the challenges and opportunities in the future. Crit. Rev. Food Sci. Nutr. 2021, 61, 3119–3128. [Google Scholar] [CrossRef]
- Szenderak, J.; Frona, D.; Rakos, M. Consumer acceptance of plant-based meat substitutes: A narrative review. Foods 2022, 11, 1274. [Google Scholar] [CrossRef] [PubMed]
- Alcorta, A.; Porta, A.; Tarrega, A.; Alvarez, M.D.; Vaquero, M.P. Foods for plant-based diets: Challenges and innovations. Foods 2021, 10, 293. [Google Scholar] [CrossRef] [PubMed]
- Reineccius, G. Flavor Chemistry and Technology, 2nd ed.; Taylor & Francis Group: Boca Raton, FL, USA, 2006. [Google Scholar]
- van Ruth, S.M.; Roozen, J.P. Delivery of flavours from food matrices. In Food Flavour Technology, 2nd ed.; Blackwell Publishing: Hoboken, NJ, USA, 2010; pp. 190–206. [Google Scholar] [CrossRef]
- Astray, G.; García-Río, L.; Mejuto, J.C.; Pastrana, L. Chemistry in food: Flavours. Electron. J. Environ. Agric. Food Chem. 2007, 6, 1742–1763. [Google Scholar]
- Lawless, H. The sense of smell in food quality and sensory evaluation. J. Food Qual. 1991, 14, 33–60. [Google Scholar] [CrossRef]
- Petrovici, A.R.; Ciolacu, D.E. Natural flavours obtained by microbiological pathway. In Generation of Aromas and Flavours; InTech: London, UK, 2018; pp. 33–52. [Google Scholar] [CrossRef]
- Longo, M.A.; Sanromán, M.A. Production of food aroma compounds: Microbial and enzymatic methodologies. Food Technol. Biotechnol. 2006, 44, 335–353. [Google Scholar] [CrossRef]
- Szutowska, J. Functional properties of lactic acid bacteria in fermented fruit and vegetable juices: A systematic literature review. Eur. Food Res. Technol. 2020, 246, 357–372. [Google Scholar] [CrossRef]
- Tangyu, M.; Fritz, M.; Tan, J.P.; Ye, L.; Bolten, C.J.; Bogicevic, B.; Wittmann, C. Flavour by design: Food-grade lactic acid bacteria improve the volatile aroma spectrum of oat milk, sunflower seed milk, pea milk, and faba milk towards improved flavour and sensory perception. Microb. Cell Factories 2023, 22, 133–154. [Google Scholar] [CrossRef] [PubMed]
- Bamforth, C.W.; Cook, D.J. Food, Fermentation, and Micro—Organisms, 2nd ed.; Wiley: Hoboken, NJ, USA, 2019; pp. 1–245. [Google Scholar] [CrossRef]
- Hayek, S.A.; Gyawali, R.; Aljaloud, S.O.; Krastanov, A.; Ibrahim, S.A. Cultivation media for lactic acid bacteria used in dairy products. J. Dairy Res. 2019, 86, 490–502. [Google Scholar] [CrossRef]
- Teusink, B.; Molenaar, D. Systems biology of lactic acid bacteria: For food and thought. Curr. Opin. Syst. Biol. 2017, 6, 7–13. [Google Scholar] [CrossRef] [PubMed]
- van Niel, E.W.J.; Hahn-Hägerdal, B. Nutrient requirements of lactococci in defined growth media. Appl. Microbiol. Biotechnol. 1999, 52, 617–627. [Google Scholar] [CrossRef]
- Wegkamp, A.; Teusink, B.; de Vos, W.M.; Smid, E.J. Development of a minimal growth medium for Lactobacillus plantarum. Lett. Appl. Microbiol. 2010, 50, 57–64. [Google Scholar] [CrossRef]
- Niven, C.F. Nutrition of Streptococcus lactis. J. Bacteriol. 1944, 47, 343–350. [Google Scholar] [CrossRef]
- Kwoji, I.D.; Okpeku, M.; Adeleke, M.A.; Aiyegoro, O.A. Formulation of chemically defined media and growth evaluation of Ligilactobacillus salivarius ZJ614 and Limosilactobacillus reuteri ZJ625. Front. Microbiol. 2022, 13, 865493. [Google Scholar] [CrossRef]
- Cocaign-Bousquet, M.; Garrigues, C.; Novak, L.; Lindley, N.D.; Loublere, P. Rational development of a simple synthetic medium for the sustained growth of Lactococcus lactis. J. Appl. Bacteriol. 1995, 79, 108–116. [Google Scholar] [CrossRef]
- Zacharof, M.-P.; Lovitt, R.W. Partially chemically defined liquid medium development for intensive propagation of industrial fermentation lactobacilli strains. Ann. Microbiol. 2012, 63, 1235–1245. [Google Scholar] [CrossRef]
- Pastink, M.I.; Teusink, B.; Hols, P.; Visser, S.; de Vos, W.M.; Hugenholtz, J. Genome-scale model of Streptococcus thermophilus LMG18311 for metabolic comparison of lactic acid bacteria. Appl. Environ. Microbiol. 2009, 75, 3627–3633. [Google Scholar] [CrossRef] [PubMed]
- Canon, F.; Maillard, M.B.; Henry, G.; Thierry, A.; Gagnaire, V. Positive interactions between lactic acid bacteria promoted by nitrogen-based nutritional dependencies. Appl. Environ. Microbiol. 2021, 87, e0105521. [Google Scholar] [CrossRef] [PubMed]
- Rajendran, S.; Silcock, P.; Bremer, P. Volatile organic compounds (VOCs) produced by Levilactobacillus brevis WLP672 fermentation in defined media supplemented with different amino acids. Molecules 2024, 29, 753. [Google Scholar] [CrossRef] [PubMed]
- Kranenburg, R.V.; Kleerebezem, M.; van Hylckama Vlieg, J.; Ursing, B.M.; Boekhorst, J.; Smit, B.A.; Ayad, E.H.E.; Smit, G.; Siezen, R.J. Flavour formation from amino acids by lactic acid bacteria: Predictions from genome sequence analysis. Int. Dairy J. 2002, 12, 111–121. [Google Scholar] [CrossRef]
- Christensen, J.E.; Dudley, E.G.; Pederson, J.A.; Steele, J.L. Peptidases and amino acid catabolism in lactic acid bacteria. Antonie Van Leeuwenhoek 1999, 76, 217–246. [Google Scholar] [CrossRef]
- Fernandez, M.; Zuniga, M. Amino acid catabolic pathways of lactic acid bacteria. Crit. Rev. Microbiol. 2006, 32, 155–183. [Google Scholar] [CrossRef] [PubMed]
- Pastink, M.I.; Sieuwerts, S.; de Bok, F.A.M.; Janssen, P.W.M.; Teusink, B.; van Hylckama Vlieg, J.E.T.; Hugenholtz, J. Genomics and high-throughput screening approaches for optimal flavour production in dairy fermentation. Int. Dairy J. 2008, 18, 781–789. [Google Scholar] [CrossRef]
- Yvon, M.; Rijnen, L. Cheese flavour formation by amino acid catabolism. Int. Dairy J. 2001, 11, 185–201. [Google Scholar] [CrossRef]
- Lindinger, W.; Hansel, A.; Jordan, A. Proton-transfer-reaction mass spectrometry (PTR-MS): On-line monitoring of volatile organic compounds at pptv levels. Chem. Soc. Rev. 1998, 27, 347–354. [Google Scholar] [CrossRef]
- Blake, R.S.; Monks, P.S.; Ellis, A.M. Proton transfer reaction-mass spectrometry. Chem. Rev. 2009, 109, 861–896. [Google Scholar] [CrossRef]
- Biasioli, F.; Yeretzian, C.; Märk, T.D.; Dewulf, J.; Van Langenhove, H. Direct-injection mass spectrometry adds the time dimension to (B)VOC analysis. Trends Anal. Chem. 2011, 30, 1003–1017. [Google Scholar] [CrossRef]
- Biasioli, F.; Gasperi, F.; Yeretzian, C.; Märk, T.D. PTR-MS monitoring of VOCs and BVOCs in food science and technology. Trends Anal. Chem. 2011, 30, 968–977. [Google Scholar] [CrossRef]
- Wang, Y.; Shen, C.; Li, J.; Jiang, H.; Chu, Y. Proton transfer reaction-mass spectrometry (PTR-MS). In Mass Spectrometry Handbook; Wiley: Hoboken, NJ, USA, 2012; pp. 605–630. [Google Scholar] [CrossRef]
- Pallozzi, E.; Guidolotti, G.; Ciccioli, P.; Brilli, F.; Feil, S.; Calfapietra, C. Does the novel fast-GC coupled with PTR-TOF-MS allow a significant advancement in detecting VOC emissions from plants? Agric. For. Meteorol. 2016, 216, 232–240. [Google Scholar] [CrossRef]
- De Man, J.C.; Rogosa, M.; Sharpe, M.E. A medium for the cultivation of lactobacilli. J. Appl. Bacteriol. 1960, 23, 130–135. [Google Scholar] [CrossRef]
- Henderson, L.M.; Snell, E.E. A uniform medium for determination of amino acids with various microorganisms. J. Biol. Chem. 1948, 172, 15–29. [Google Scholar] [CrossRef]
- MacLeod, R.A.; Snell, E.E. Some mineral requirements of the lactic acid bacteria. J. Biol. Chem. 1947, 170, 351–365. [Google Scholar] [CrossRef]
- Russell, C.; Bhandari, R.R.; Walker, T.K. Vitamin requirements of thirty-four lactic acid bacteria associated with brewery products. J. Gen. Microbiol. 1954, 10, 371–376. [Google Scholar] [CrossRef]
- Di Pierro, E.A.; Franceschi, P.; Endrizzi, I.; Farneti, B.; Poles, L.; Masuero, D.; Khomenko, I.; Trenti, F.; Marrano, A.; Vrhovsek, U.; et al. Valorization of traditional Italian walnut (Juglans regia L.) production: Genetic, nutritional and sensory characterization of locally grown varieties in the Trentino region. Plants 2022, 11, 1986. [Google Scholar] [CrossRef]
- Cappellin, L.; Biasioli, F.; Fabris, A.; Schuhfried, E.; Soukoulis, C.; Märk, T.D.; Gasperi, F. Improved mass accuracy in PTR-ToF-MS: Another step towards better compound identification in PTR-MS. Int. J. Mass Spectrom. 2010, 290, 60–63. [Google Scholar] [CrossRef]
- Cappellin, L.; Biasioli, F.; Granitto, P.M.; Schuhfried, E.; Soukoulis, C.; Costa, F.; Märk, T.D.; Gasperi, F. On data analysis in PTR-ToF-MS: From raw spectra to data mining. Sens. Actuators B Chem. 2011, 155, 183–190. [Google Scholar] [CrossRef]
- Lindinger, W.; Hansel, A.; Jordan, A. On-line monitoring of volatile organic compounds at pptv levels by means of proton-transfer-reaction mass spectrometry (PTR-MS) medical applications, food control and environmental research. Int. J. Mass Spectrom. Ion Process. 1998, 173, 191–241. [Google Scholar] [CrossRef]
- Pico, J.; Khomenko, I.; Capozzi, V.; Navarini, L.; Bernal, J.; Gomez, M.; Biasioli, F. Analysis of volatile organic compounds in crumb and crust of different baked and toasted gluten-free breads by direct PTR-ToF-MS and fast-GC-PTR-ToF-MS. J. Mass Spectrom. 2018, 53, 893–902. [Google Scholar] [CrossRef] [PubMed]
- Alboukadel, K.; Fabian, M. Package ‘factoextra’. 2019. Available online: http://www.sthda.com/english/rpkgs/factoextra (accessed on 29 April 2024).
- Li, T.; Jiang, T.; Liu, N.; Wu, C.; Xu, H.; Lei, H. Biotransformation of phenolic profiles and improvement of antioxidant capacities in jujube juice by select lactic acid bacteria. Food Chem. 2021, 339, 127859. [Google Scholar] [CrossRef] [PubMed]
- Zaunmuller, T.; Eichert, M.; Richter, H.; Unden, G. Variations in the energy metabolism of biotechnologically relevant heterofermentative lactic acid bacteria during growth on sugars and organic acids. Appl. Microbiol. Biotechnol. 2006, 72, 421–429. [Google Scholar] [CrossRef] [PubMed]
- Felis, G.E.; Dellaglio, F. Taxonomy of lactobacilli and bifidobacteria. Curr. Issues Intest. Microbiol. 2007, 8, 44–61. [Google Scholar] [PubMed]
- Pieterse, B.; Leer, R.J.; Schuren, F.H.J.; van der Werf, M.J. Unravelling the multiple effects of lactic acid stress on Lactobacillus plantarum by transcription profiling. Microbiology 2005, 151, 3881–3894. [Google Scholar] [CrossRef] [PubMed]
- Ardö, Y. Flavour formation by amino acid catabolism. Biotechnol. Adv. 2006, 24, 238–242. [Google Scholar] [CrossRef] [PubMed]
- Marsili, R. Flavors and off-flavors in dairy foods. In Encyclopedia of Dairy Sciences, 3rd ed.; Elsevier: Amsterdam, The Netherlands, 2022; Volume 3, pp. 560–578. [Google Scholar] [CrossRef]
- McSweeney, P.L.H.; Sousa, M.J. Biochemical pathways for the production of flavour compounds in cheeses during ripening: A review. Le Lait 2000, 80, 293–324. [Google Scholar] [CrossRef]
- Marilley, L.; Casey, M.G. Flavours of cheese products: Metabolic pathways, analytical tools and identification of producing strains. Int. J. Food Microbiol. 2004, 90, 139–159. [Google Scholar] [CrossRef]
- Resconi, V.C.; Escudero, A.; Campo, M.M. The development of aromas in ruminant meat. Molecules 2013, 18, 6748–6781. [Google Scholar] [CrossRef]
- Smit, G.; Smit, B.A.; Engels, W.J. Flavour formation by lactic acid bacteria and biochemical flavour profiling of cheese products. FEMS Microbiol. Rev. 2005, 29, 591–610. [Google Scholar] [CrossRef] [PubMed]
- Curioni, P.M.G.; Bosset, J.O. Key odorants in various cheese types as determined by gas chromatography–olfactometry. Int. Dairy J. 2002, 12, 959–984. [Google Scholar] [CrossRef]
- Liu, M.; Nauta, A.; Francke, C.; Siezen, R.J. Comparative genomics of enzymes in flavor-forming pathways from amino acids in lactic acid bacteria. Appl. Environ. Microbiol. 2008, 74, 4590–4600. [Google Scholar] [CrossRef]
- Gonda, I.; Lev, S.; Bar, E.; Sikron, N.; Portnoy, V.; Davidovich-Rikanati, R.; Burger, J.; Schaffer, A.A.; Tadmor, Y.; Giovannonni, J.J.; et al. Catabolism of L-methionine in the formation of sulfur and other volatiles in melon (Cucumis melo L.) fruit. Plant J. 2013, 74, 458–472. [Google Scholar] [CrossRef] [PubMed]
- Hébert, E.M.; Raya, R.R.; Savoy de Giori, G. Evaluation of minimal nutritional requirements of lactic acid bacteria used in functional foods. In Methods in Biotechnology: Environmental Microbiology: Methods and Protocols; Humana Press: Totowa, NJ, USA, 2004; pp. 139–148. [Google Scholar] [CrossRef]
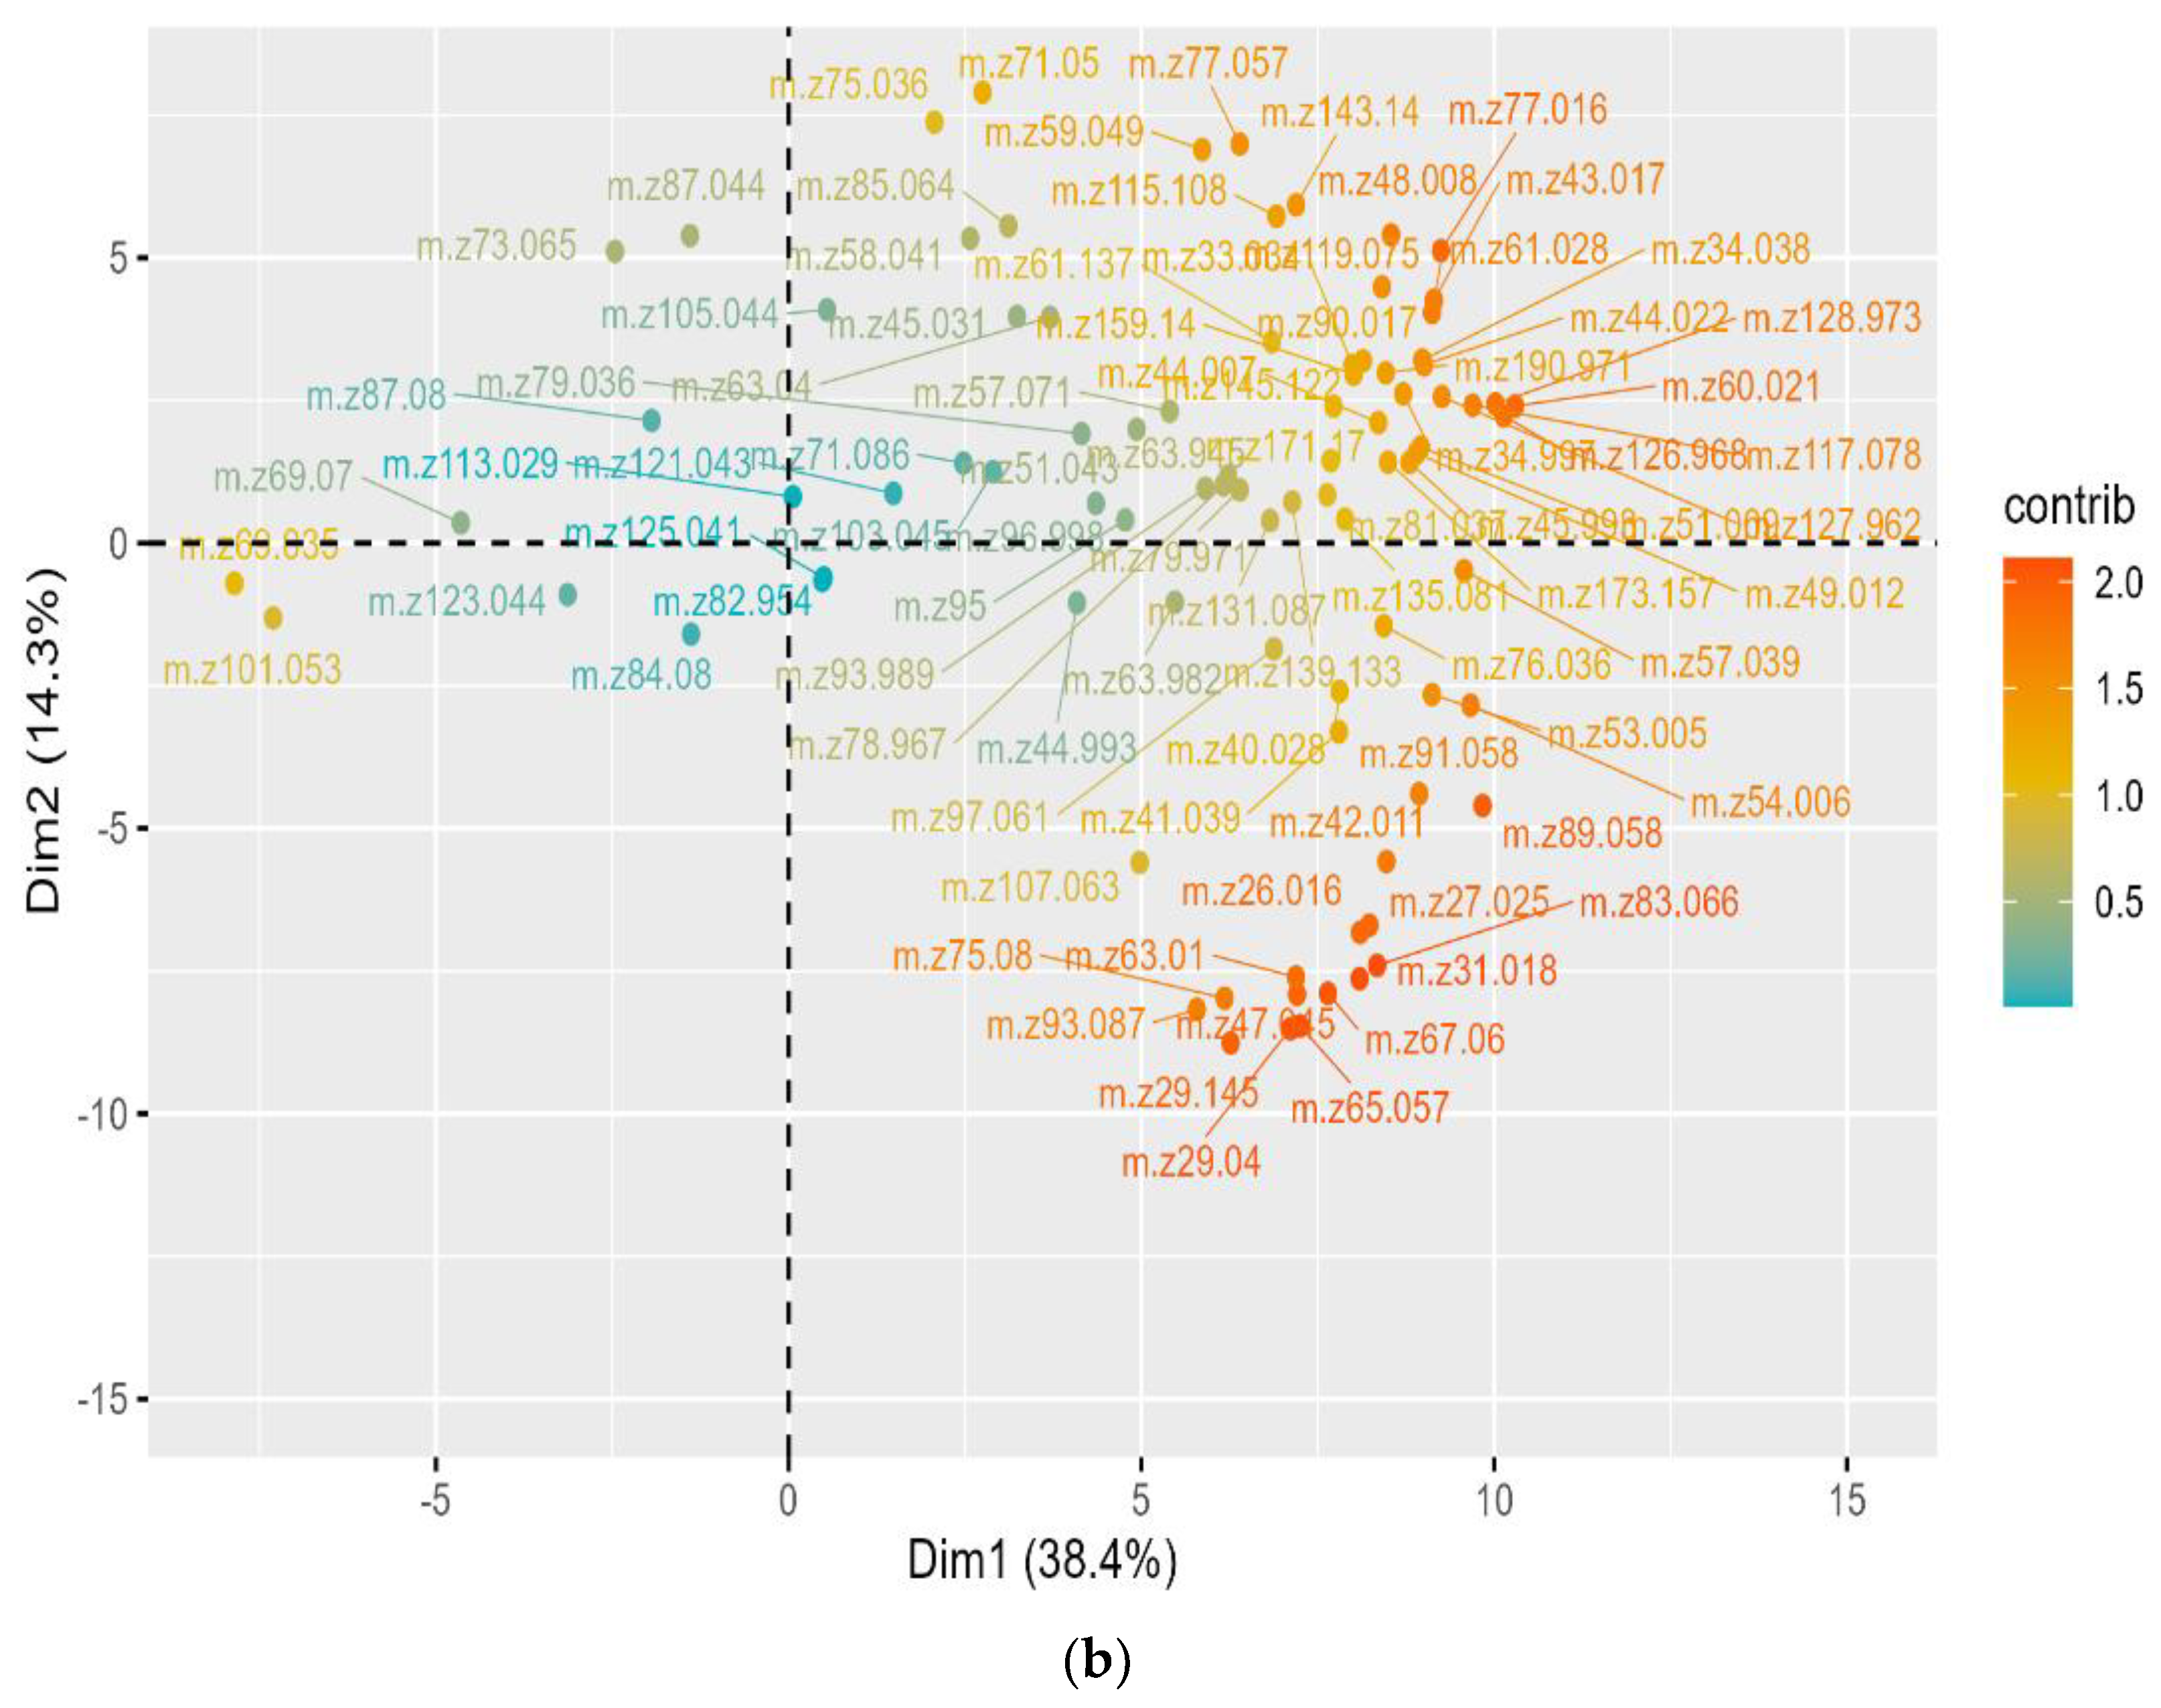
 ), LP100 (
 ), and PP100 (
 )) across different medium compositions (DM
  , DMA
, DMA  , DMG
, DMG  , DMI
, DMI  , DML
, DML  , DMM
, DMM  , DMP
, DMP  , and DMT
  ) at 0 (
 ) and 7 (
 ) days of fermentation at 25 °C based on the concentrations (ppbV) of finalized 88 m/z from PTR-ToF-MS. The first and second components represented for 38.4% and 14.3% of total variance.
), LP100 (), and PP100 ()) across different medium compositions (DM , DMA , DMG , DMI , DML , DMM , DMP , and DMT ) at 0 () and 7 () days of fermentation at 25 °C based on the concentrations (ppbV) of finalized 88 m/z from PTR-ToF-MS. The first and second components represented for 38.4% and 14.3% of total variance.
) days of fermentation at 25 °C based on the concentrations (ppbV) of finalized 88 m/z from PTR-ToF-MS. The first and second components represented for 38.4% and 14.3% of total variance.
), LP100 (), and PP100 ()) across different medium compositions (DM , DMA , DMG , DMI , DML , DMM , DMP , and DMT ) at 0 () and 7 () days of fermentation at 25 °C based on the concentrations (ppbV) of finalized 88 m/z from PTR-ToF-MS. The first and second components represented for 38.4% and 14.3% of total variance.
 ), LP100 (
 ), and PP100 (
 ) at 25 °C. Values are presented as mean ± standard error (n = 3). Different superscript lowercase letters represent significant differences between different medium compositions fermented by different LAB strains according to Tukey’s test at p < 0.05.
), LP100 (), and PP100 () at 25 °C. Values are presented as mean ± standard error (n = 3). Different superscript lowercase letters represent significant differences between different medium compositions fermented by different LAB strains according to Tukey’s test at p < 0.05.
) at 25 °C. Values are presented as mean ± standard error (n = 3). Different superscript lowercase letters represent significant differences between different medium compositions fermented by different LAB strains according to Tukey’s test at p < 0.05.
), LP100 (), and PP100 () at 25 °C. Values are presented as mean ± standard error (n = 3). Different superscript lowercase letters represent significant differences between different medium compositions fermented by different LAB strains according to Tukey’s test at p < 0.05. ), LP100 (), and PP100 () at 25 °C. Values are presented as mean ± standard error (n = 3). Different superscript lowercase letters represent significant differences between different medium compositions fermented by different LAB strains according to Tukey’s test at p < 0.05.
), LP100 (), and PP100 () at 25 °C. Values are presented as mean ± standard error (n = 3). Different superscript lowercase letters represent significant differences between different medium compositions fermented by different LAB strains according to Tukey’s test at p < 0.05.
), LP100 (), and PP100 () at 25 °C. Values are presented as mean ± standard error (n = 3). Different superscript lowercase letters represent significant differences between different medium compositions fermented by different LAB strains according to Tukey’s test at p < 0.05.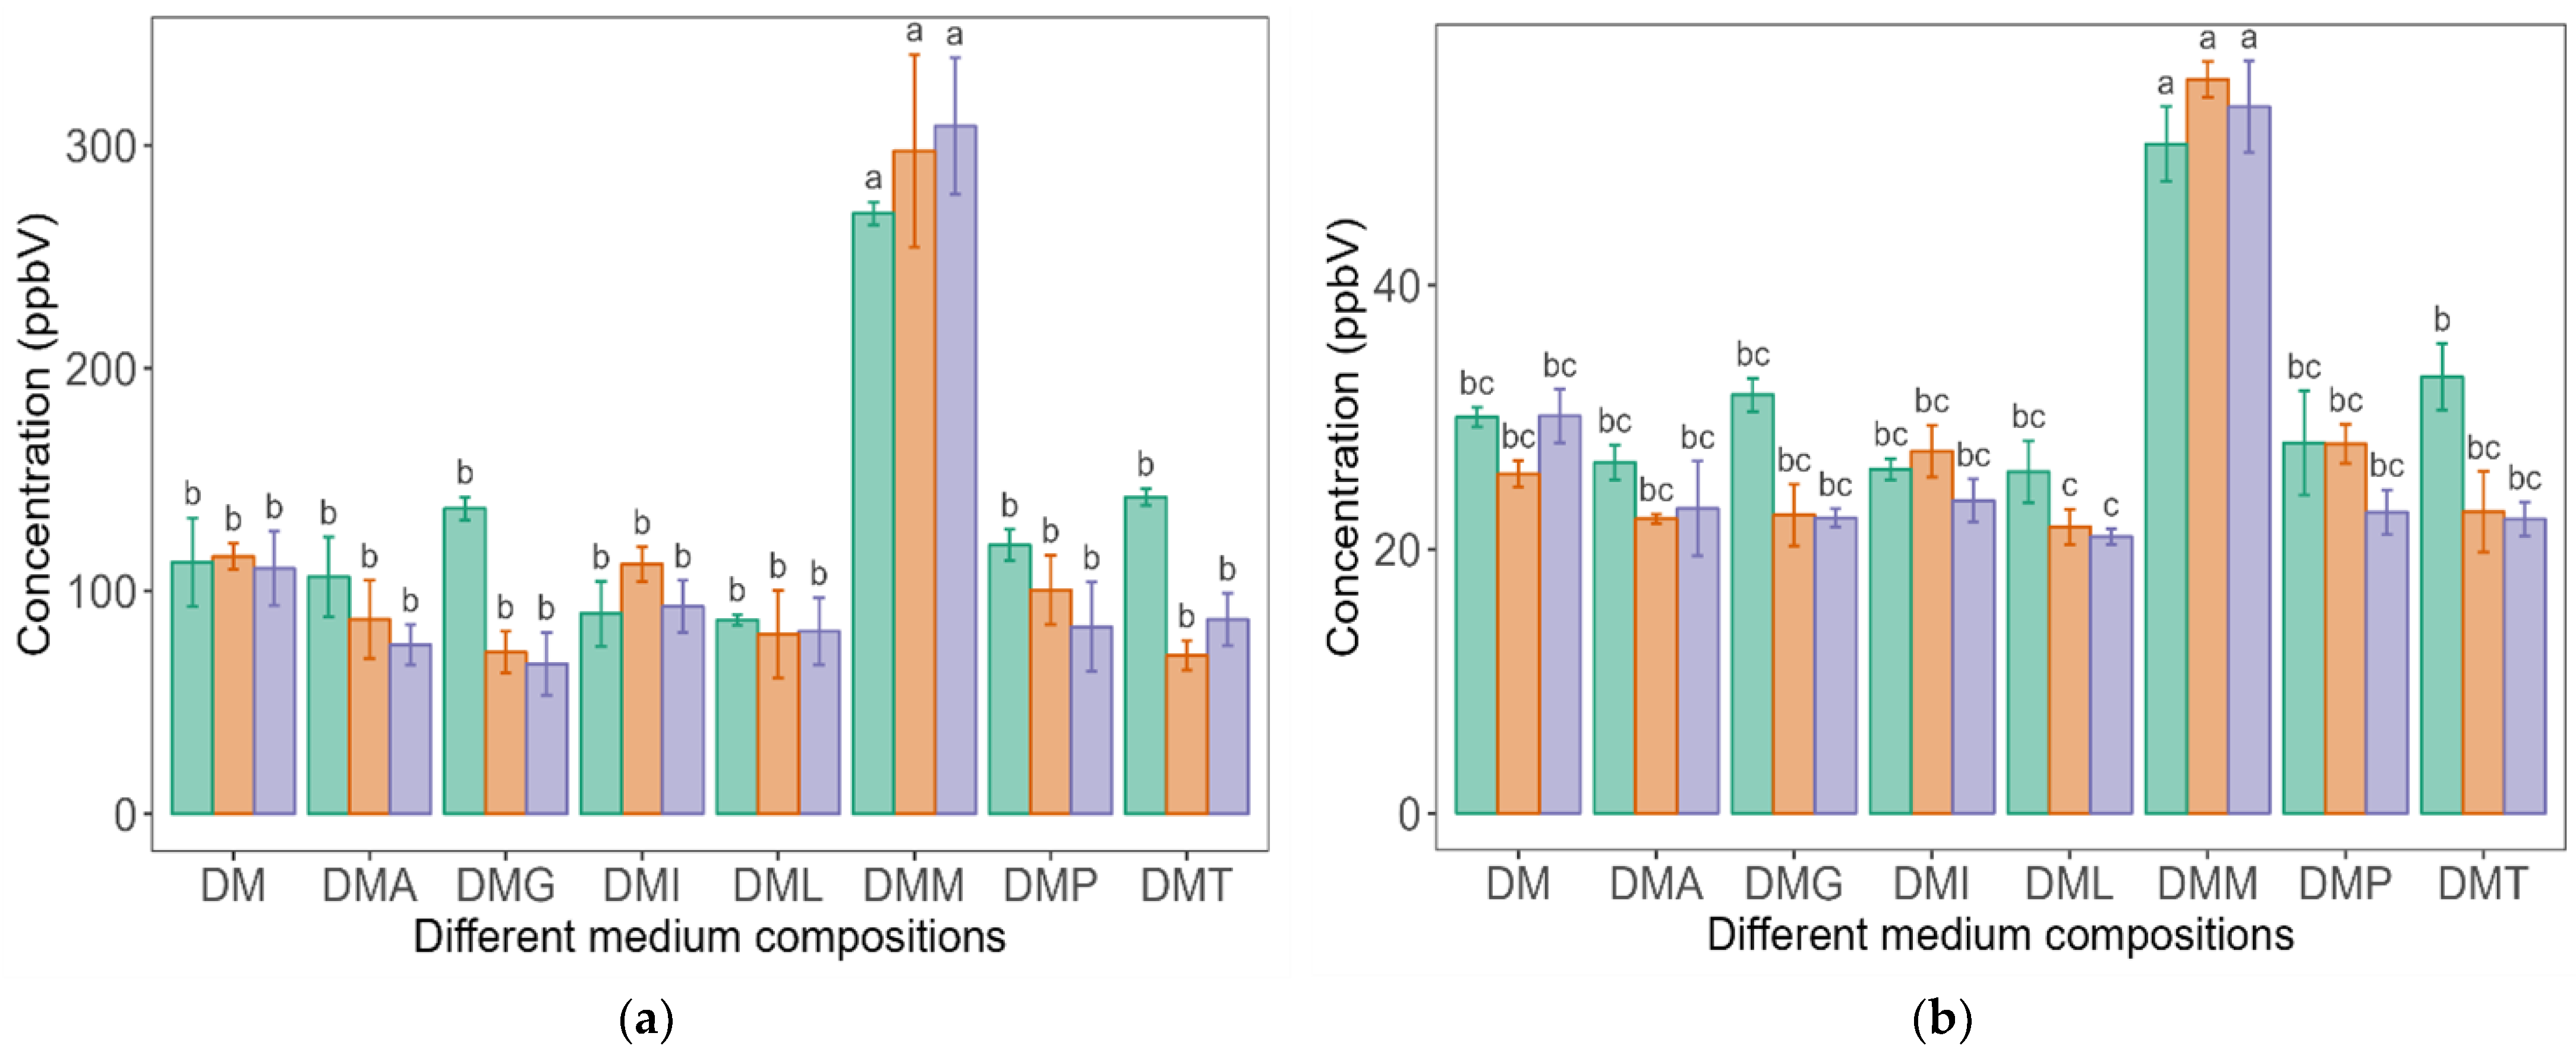 ), LP100 (), and PP100 () at 25 °C. Values are presented as mean ± standard error (n = 3). Different l superscript lowercase letters represent significant differences between different medium compositions fermented by different LAB strains according to Tukey’s test at p < 0.05.
), LP100 (), and PP100 () at 25 °C. Values are presented as mean ± standard error (n = 3). Different l superscript lowercase letters represent significant differences between different medium compositions fermented by different LAB strains according to Tukey’s test at p < 0.05.
), LP100 (), and PP100 () at 25 °C. Values are presented as mean ± standard error (n = 3). Different l superscript lowercase letters represent significant differences between different medium compositions fermented by different LAB strains according to Tukey’s test at p < 0.05. ), LP100 (), and PP100 () at 25 °C. Values are presented as mean ± standard error (n = 3). Different superscript lowercase letters represent significant differences between different medium compositions fermented by different LAB strains according to Tukey’s test at p < 0.05.
), LP100 (), and PP100 () at 25 °C. Values are presented as mean ± standard error (n = 3). Different superscript lowercase letters represent significant differences between different medium compositions fermented by different LAB strains according to Tukey’s test at p < 0.05.
), LP100 (), and PP100 () at 25 °C. Values are presented as mean ± standard error (n = 3). Different superscript lowercase letters represent significant differences between different medium compositions fermented by different LAB strains according to Tukey’s test at p < 0.05.

| Media | Glucose | Peptone | Vitamins | Mineral Salts | Sodium Acetate | AA Mixture | Glu | Asp | Leu | Ile | Thr | Phe | Met |
|---|---|---|---|---|---|---|---|---|---|---|---|---|---|
| DM | 2% | 0.5% | √ | √ | 1.2% | 0.04% | - | - | - | - | - | - | - |
| DMG | 2% | 0.5% | √ | √ | 1.2% | 0.04% | 0.2% | - | - | - | - | - | - |
| DMA | 2% | 0.5% | √ | √ | 1.2% | 0.04% | - | 0.2% | - | - | - | - | - |
| DML | 2% | 0.5% | √ | √ | 1.2% | 0.04% | - | - | 0.2% | - | - | - | - |
| DMI | 2% | 0.5% | √ | √ | 1.2% | 0.04% | - | - | - | 0.2% | - | - | - |
| DMT | 2% | 0.5% | √ | √ | 1.2% | 0.04% | - | - | - | - | 0.2% | - | - |
| DMP | 2% | 0.5% | √ | √ | 1.2% | 0.04% | - | - | - | - | - | 0.2% | - |
| DMM | 2% | 0.5% | √ | √ | 1.2% | 0.04% | - | - | - | - | - | - | 0.2% |
| No. | Flavour Standards | Molecular Formula | Molecular Weight | RI | RT (s) | Main/Fragment Ions Checked |
|---|---|---|---|---|---|---|
| 1 | Ethyl acetate | C4H8O2 | 88 | 888 | 58 | 89.060, 61.028, 43.018 |
| 2 | 2-Butanone | C4H8O | 72 | 918 | 60 | 73.065 |
| 3 | Ethanol | C2H6O | 46 | 932 | 59 | 47.049 |
| 4 | Ethyl butanoate | C6H12O2 | 116 | 1023 | 68 | 117.091, 89.060, 43.054 |
| 5 | 2-Methyl propanol | C4H10O | 74 | 1092 | 69 | 57.07 |
| 6 | 2-Hexanone | C6H12O | 100 | 1100 | 78 | 101.096 |
| 7 | 2-Heptanone | C7H14O | 114 | 1182 | 84.5 | 115.112 |
| 8 | 3-Methyl butanol | C5H12O | 88 | 1209 | 82.2 | 71.086 |
| 9 | Ethyl hexanoate | C8H16O2 | 144 | 1233 | 89 | 145.122, 117.091 |
| 10 | 2-Nonanone | C9H18O | 142 | 1390 | 109 | 143.143 |
| 11 | Ethyl octanoate | C10H20O2 | 172 | 1435 | 111.5 | 127.112, 145.122 |
| 12 | Acetic acid | C2H4O2 | 60 | 1449 | 112.5 | 61.028, 43.018 |
| 13 | Benzaldehyde | C7H6O | 106 | 1520 | 115.5 | 107.049 |
| 14 | Ethyl decanoate | C12H24O2 | 200 | 1638 | 146 | 201.233, 155.107 |
| 15 | Phenylethyl alcohol | C8H10O | 122 | 1906 | 218 | 105.070 |
| No. | Medium | Initial pH | LAB Fermentation | pH after 14 Days | OD600 after 14 Days |
|---|---|---|---|---|---|
| 1 | DM | 5.70 | LB672 | 4.30 ± 0.05 a | 0.95 ± 0.033 c |
| LP100 | 4.12 ± 0.008 b | 1.26 ± 0.01 b | |||
| PP100 | 4.05 ± 0.01 b | 1.48 ± 0.005 a | |||
| 2 | DMG | 5.16 | LB672 | 4.15 ± 0.05 a | 1.15 ± 0.05 a |
| LP100 | 3.94 ± 0.008 b | 0.61 ± 0.025 b | |||
| PP100 | 4.02 ± 0.02 ab | 0.63 ± 0.02 b | |||
| 3 | DMA | 5.34 | LB672 | 4.22 ± 0.005 a | 0.84 ± 0.013 c |
| LP100 | 4.06 ± 0.06 a | 1.86 ± 0.015 a | |||
| PP100 | 4.17 ± 0.005 a | 1.00 ± 0.005 b | |||
| 4 | DML | 5.49 | LB672 | 4.09 ± 0.005 a | 1.64 ± 0.04 a |
| LP100 | 4.05 ± 0.005 a | 1.40 ± 0.013 b | |||
| PP100 | 4.07 ± 0.02 a | 1.38 ± 0.015 b | |||
| 5 | DMI | 5.52 | LB672 | 4.23 ± 0.005 a | 1.48 ± 0.003 c |
| LP100 | 4.18 ± 0.002 a | 2.21 ± 0.01 a | |||
| PP100 | 4.24 ± 0.025 a | 1.65 ± 0.025 b | |||
| 6 | DMT | 5.60 | LB672 | 4.20 ± 0.003 a | 1.80 ± 0.045 a |
| LP100 | 4.08 ± 0.005 b | 1.26 ± 0.015 b | |||
| PP100 | 4.08 ± 0.002 b | 0.96 ± 0.03 c | |||
| 7 | DMP | 5.53 | LB672 | 4.22 ± 0.02 a | 1.28 ± 0.005 b |
| LP100 | 4.08 ± 0.002 b | 2.11 ± 0.006 a | |||
| PP100 | 4.17 ± 0.01 a | 1.07 ± 0.001 c | |||
| 8 | DMM | 5.53 | LB672 | 4.26 ± 0.005 a | 0.86 ± 0.04 b |
| LP100 | 4.11 ± 0.005 b | 2.13 ± 0.08 a | |||
| PP100 | 4.14 ± 0.003 b | 0.65 ± 0.005 c |
| No. | Name | RT (min) | RI. Cal | RI. Lit | LAB Strains Used | ||
|---|---|---|---|---|---|---|---|
| LB672 | LP 100 | PP100 | |||||
| Acids | |||||||
| 1 | Acetic acid | 15.29 | 1467 | 1449 | √ | √ | √ |
| 2 | Butyric acid | 19.63 | 1646 | 1625 | √ | √ | √ |
| 3 | Hexanoic acid | 24.44 | 1862 | 1846 | √ | √ | √ |
| 4 | Octanoic acid | 28.76 | 2035 | 2060 | √ | √ | √ |
| 5 | Decanoic acid | 32.70 | 2154 | 2276 | √ | √ | √ |
| Alcohols | |||||||
| 6 | 2-Propanol | 3.07 | 934 | 927 | √ | × | × |
| 7 | Ethanol | 3.16 | 941 | 932 | √ | √ | √ |
| 8 | 2-Pentanol | 6.69 | 1134 | 1119 | √ | × | × |
| 9 | 1-Butanol | 7.27 | 1158 | 1142 | √ | √ | √ |
| 10 | 2/3-Methyl-1-butanol | 8.86 | 1220 | 1208/1209 | √ | √ | √ |
| 11 | 3-Methyl-3-buten-1-ol | 9.99 | 1263 | 1248 | √ | √ | √ |
| 12 | 2-Heptanol | 11.78 | 1332 | 1320 | √ | √ | √ |
| 13 | 1,6-Heptadien-4-ol | 11.89 | 1335 | 1330 | √ | √ | √ |
| 14 | Hexanol | 12.67 | 1365 | 1355 | √ | √ | √ |
| 15 | 2-Ethyl-1-hexanol | 16.16 | 1501 | 1491 | √ | √ | √ |
| 16 | 2,3-Butanediol | 17.44 | 1554 | 1543 | √ | × | × |
| 17 | Menthol | 19.81 | 1653 | 1637 | √ | √ | √ |
| 18 | 2-Undecanol | 21.59 | 1731 | 1717 | √ | √ | √ |
| 19 | Benzyl alcohol | 25.14 | 1895 | 1870 | √ | √ | √ |
| 20 | Phenylethyl alcohol | 25.85 | 1930 | 1906 | √ | √ | √ |
| 21 | 2-Tridecanol | 25.90 | 1933 | 1903 | √ | √ | √ |
| 22 | P-cresol | 29.45 | 2051 | 2080 | √ | √ | √ |
| 23 | 2-Tetradecanol | 29.88 | 2062 | 2013 | √ | √ | √ |
| Aldehydes | |||||||
| 24 | Butanal | 2.75 | 911 | 877 | √ | √ | √ |
| 25 | 2-Methyl butanal | 2.90 | 922 | 914 | √ | √ | √ |
| 26 | 3-Methyl butanal | 2.96 | 926 | 918 | √ | √ | √ |
| 27 | 2-Methyl-2-butenal | 6.17 | 1114 | 1095 | √ | √ | √ |
| 28 | 3-Methyl-2-butenal | 8.77 | 1216 | 1215 | √ | √ | √ |
| 29 | 2-Methyl pentanal | 13.66 | 1403 | √ | √ | √ | |
| 30 | Benzaldehyde | 17.15 | 1542 | 1520 | √ | √ | √ |
| 31 | Benzeneacetaldehyde | 20.03 | 1663 | 1640 | √ | √ | √ |
| Esters | |||||||
| 32 | Ethyl acetate | 2.61 | 901 | 888 | √ | √ | √ |
| 33 | Isoamyl acetate | 6.81 | 1139 | 1122 | √ | × | × |
| Furans | |||||||
| 34 | Furfural | 15.72 | 1484 | 1461 | × | √ | × |
| 35 | 2-Furanmethanol | 20.40 | 1679 | 1660 | √ | √ | √ |
| Ketones | |||||||
| 36 | Acetone | 1.97 | 823 | 819 | √ | √ | √ |
| 37 | 2,3-Butanedione (Diacetyl) | 3.84 | 989 | 979 | √ | √ | √ |
| 38 | 2-Pentanone | 3.91 | 994 | 981 | √ | √ | √ |
| 39 | 3-Penten-2-one | 6.92 | 1144 | 1128 | √ | √ | √ |
| 40 | 2-Heptanone | 8.29 | 1198 | 1182 | √ | √ | √ |
| 41 | Acetoin | 11.00 | 1302 | 1284 | √ | √ | √ |
| 42 | 2-Tridecanone | 23.60 | 1822 | 1809 | √ | √ | √ |
| Pyrazines | |||||||
| 43 | Pyrazine | 9.08 | 1228 | 1212 | √ | √ | √ |
| Sulphur compounds | |||||||
| 44 | Dimethyl disulfide | 5.73 | 1095 | 1077 | √ | √ | √ |
| 45 | Methional | 15.47 | 1474 | 1454 | √ | √ | √ |
| 46 | Cyclohexyl isothiocyanate | 20.61 | 1687 | 1667 | √ | √ | √ |
| 47 | 3-(methylthio)-1-propanol (methionol) | 21.64 | 1734 | 1719 | √ | √ | √ |
| Unknown compounds | |||||||
| 48 | Unknown 1 | 11.89 | × | √ | √ | ||
| 49 | Unknown 2 | 12.53 | √ | √ | × | ||
| 50 | Unknown 3 | 26.61 | √ | √ | √ | ||
| No. | m/z | Sum Formula | Identification | Media | Strain | T | M × S | M × T | S × T | M × S × T |
|---|---|---|---|---|---|---|---|---|---|---|
| 1 | 26.016 | C2H2+ | Common fragment | <0.0001 | <0.0001 | <0.0001 | <0.0001 | <0.0001 | <0.0001 | <0.0001 |
| 2 | 27.025 | C2H3+ | <0.0001 | <0.0001 | <0.0001 | <0.0001 | <0.0001 | <0.0001 | <0.0001 | |
| 3 | 29.04 | C2H5+ | Ethanol fragment | <0.0001 | <0.0001 | <0.0001 | <0.0001 | <0.0001 | <0.0001 | <0.0001 |
| 4 | 29.145 | <0.0001 | <0.0001 | <0.0001 | <0.0001 | <0.0001 | <0.0001 | <0.0001 | ||
| 5 | 31.018 | CH2OH+ | Formaldehyde | <0.0001 | <0.0001 | <0.0001 | <0.0001 | <0.0001 | <0.0001 | <0.0001 |
| 6 | 34.997 | H2SH+ | Hydrogen sulfide | 0.843 | 0.263 | <0.0001 | 0.033 | 0.828 | 0.256 | 0.031 |
| 7 | 40.028 | 0.039 | <0.0001 | <0.0001 | <0.0001 | 0.004 | <0.0001 | 0.003 | ||
| 8 | 41.039 | C3H5+ | Common fragment | 0.003 | <0.0001 | <0.0001 | <0.0001 | 0.001 | <0.0001 | <0.0001 |
| 9 | 42.011 | C2HOH+ | <0.0001 | <0.0001 | <0.0001 | <0.0001 | <0.0001 | <0.0001 | <0.0001 | |
| 10 | 43.017 | C2H3O+ | Common fragment | 0.015 | 0.158 | <0.0001 | 0.238 | 0.152 | 0.221 | 0.023 |
| 11 | 44.022 | 0.007 | 0.169 | <0.0001 | 0.656 | 0.346 | 0.111 | 0.933 | ||
| 12 | 44.993 | CO2H+ | Carbon dioxide | <0.0001 | 0.034 | <0.0001 | <0.0001 | <0.0001 | 0.100 | <0.0001 |
| 13 | 45.031 | C2H4OH+ | Acetaldehyde | <0.0001 | <0.0001 | <0.0001 | 0.002 | <0.0001 | 0.015 | <0.0001 |
| 14 | 47.045 | C2H6OH+ | Ethanol 1 | <0.0001 | <0.0001 | <0.0001 | <0.0001 | <0.0001 | <0.0001 | <0.0001 |
| 15 | 48.008 | <0.0001 | <0.0001 | <0.0001 | 0.208 | <0.0001 | 0.016 | 0.167 | ||
| 16 | 49.012 | CH4SH+ | Methanethiol | <0.0001 | 0.092 | <0.0001 | 0.785 | <0.0001 | 0.092 | 0.786 |
| 17 | 51.009 | <0.0001 | 0.136 | <0.0001 | 0.811 | <0.0001 | 0.095 | 0.809 | ||
| 18 | 53.005 | 0.043 | <0.0001 | <0.0001 | 0.099 | 0.021 | <0.0001 | 0.456 | ||
| 19 | 54.006 | 0.001 | <0.0001 | <0.0001 | 0.860 | 0.002 | <0.0001 | 0.910 | ||
| 20 | 57.039 | C3H4OH+ | 0.193 | <0.0001 | <0.0001 | <0.0001 | 0.023 | <0.0001 | 0.002 | |
| 21 | 59.049 | C3H6OH+ | Acetone 1 | <0.0001 | <0.0001 | <0.0001 | <0.0001 | <0.0001 | <0.0001 | <0.0001 |
| 22 | 60.021 | <0.0001 | 0.014 | <0.0001 | 0.921 | 0.112 | 0.006 | 0.663 | ||
| 23 | 63.01 | CO2*H3O | Carbon dioxide-water cluster | <0.0001 | <0.0001 | <0.0001 | <0.0001 | <0.0001 | <0.0001 | <0.0001 |
| 24 | 63.04 | C2H6O2H+ | Acetaldehyde hydrate cluster | <0.0001 | <0.0001 | <0.0001 | <0.0001 | <0.0001 | <0.0001 | <0.0001 |
| 25 | 65.057 | Ethanol hydrate cluster | <0.0001 | <0.0001 | <0.0001 | <0.0001 | <0.0001 | <0.0001 | <0.0001 | |
| 26 | 67.06 | C5H7+ | <0.0001 | <0.0001 | <0.0001 | <0.0001 | <0.0001 | <0.0001 | <0.0001 | |
| 27 | 71.05 | <0.0001 | <0.0001 | <0.0001 | 0.412 | <0.0001 | <0.0001 | 0.178 | ||
| 28 | 75.08 | C2H5+[C2H5OH] | Ethanol cluster | <0.0001 | <0.0001 | <0.0001 | <0.0001 | <0.0001 | <0.0001 | <0.0001 |
| 29 | 77.016 | 0.058 | <0.0001 | <0.0001 | 0.058 | 0.030 | 0.055 | 0.512 | ||
| 30 | 77.057 | <0.0001 | <0.0001 | <0.0001 | <0.0001 | <0.0001 | <0.0001 | <0.0001 | ||
| 31 | 83.066 | <0.0001 | <0.0001 | <0.0001 | <0.0001 | <0.0001 | <0.0001 | <0.0001 | ||
| 32 | 85.064 | C5H8OH+ | 2-Methyl-2-butenal 1,2,3 and3-Methyl-2-butenal 1,2,3 | <0.0001 | <0.0001 | <0.0001 | <0.0001 | <0.0001 | <0.0001 | <0.0001 |
| 33 | 89.058 | C4H8O2H+ | Ethyl acetate 1,2,4, Acetoin 1,2,4 and Butyric acid 1,2,4 | <0.0001 | <0.0001 | <0.0001 | <0.0001 | <0.0001 | <0.0001 | <0.0001 |
| 34 | 91.058 | C4H10SH+ | <0.0001 | <0.0001 | <0.0001 | <0.0001 | <0.0001 | <0.0001 | <0.0001 | |
| 35 | 93.087 | C7H8H+ | Toluene | <0.0001 | <0.0001 | <0.0001 | <0.0001 | <0.0001 | <0.0001 | <0.0001 |
| 36 | 95.000 | C2H6S2H+ | Dimethyl disulfide 1 | 0.008 | 0.790 | 0.007 | 0.899 | 0.018 | 0.064 | 0.886 |
| 37 | 97.061 | C6H8OH+ | 2,5-Dimethylfuran/Cyclohexen-2-one | <0.0001 | <0.0001 | <0.0001 | 0.076 | <0.0001 | <0.0001 | 0.018 |
| 38 | 107.063 | C4H10OSH+ | Methionol 1 | 0.299 | <0.0001 | <0.0001 | 0.161 | 0.357 | <0.0001 | 0.387 |
| 39 | 115.108 | C7H14OH+ | 2-Heptanone 1,2 | <0.0001 | <0.0001 | <0.0001 | <0.0001 | <0.0001 | <0.0001 | <0.0001 |
| 40 | 117.078 | 0.031 | 0.032 | <0.0001 | 0.328 | 0.021 | 0.001 | 0.151 | ||
| 41 | 119.075 | 0.016 | <0.0001 | <0.0001 | 0.244 | 0.014 | 0.001 | 0.089 | ||
| 42 | 143.14 | C9H18OH+ | Nonanal/Nonanone | 0.002 | <0.0001 | <0.0001 | <0.0001 | 0.028 | <0.0001 | <0.0001 |
| 43 | 171.17 | C11H22OH+ | Undecanal/Undecanone | <0.0001 | <0.0001 | <0.0001 | <0.0001 | 0.002 | <0.0001 | <0.0001 |
Disclaimer/Publisher’s Note: The statements, opinions and data contained in all publications are solely those of the individual author(s) and contributor(s) and not of MDPI and/or the editor(s). MDPI and/or the editor(s) disclaim responsibility for any injury to people or property resulting from any ideas, methods, instructions or products referred to in the content. |
© 2024 by the authors. Licensee MDPI, Basel, Switzerland. This article is an open access article distributed under the terms and conditions of the Creative Commons Attribution (CC BY) license (https://creativecommons.org/licenses/by/4.0/).
Share and Cite
Rajendran, S.; Khomenko, I.; Silcock, P.; Betta, E.; Pedrotti, M.; Biasioli, F.; Bremer, P. The Effect of Different Medium Compositions and LAB Strains on Fermentation Volatile Organic Compounds (VOCs) Analysed by Proton Transfer Reaction-Time of Flight-Mass Spectrometry (PTR-ToF-MS). Fermentation 2024, 10, 317. https://doi.org/10.3390/fermentation10060317
Rajendran S, Khomenko I, Silcock P, Betta E, Pedrotti M, Biasioli F, Bremer P. The Effect of Different Medium Compositions and LAB Strains on Fermentation Volatile Organic Compounds (VOCs) Analysed by Proton Transfer Reaction-Time of Flight-Mass Spectrometry (PTR-ToF-MS). Fermentation. 2024; 10(6):317. https://doi.org/10.3390/fermentation10060317
Chicago/Turabian StyleRajendran, Sarathadevi, Iuliia Khomenko, Patrick Silcock, Emanuela Betta, Michele Pedrotti, Franco Biasioli, and Phil Bremer. 2024. "The Effect of Different Medium Compositions and LAB Strains on Fermentation Volatile Organic Compounds (VOCs) Analysed by Proton Transfer Reaction-Time of Flight-Mass Spectrometry (PTR-ToF-MS)" Fermentation 10, no. 6: 317. https://doi.org/10.3390/fermentation10060317
APA StyleRajendran, S., Khomenko, I., Silcock, P., Betta, E., Pedrotti, M., Biasioli, F., & Bremer, P. (2024). The Effect of Different Medium Compositions and LAB Strains on Fermentation Volatile Organic Compounds (VOCs) Analysed by Proton Transfer Reaction-Time of Flight-Mass Spectrometry (PTR-ToF-MS). Fermentation, 10(6), 317. https://doi.org/10.3390/fermentation10060317