Article

Improvement in Ethylene Glycol Bioconversion to Glycolic Acid by Gluconobacter oxydans Using Central Composite Experimental Design and Bioreactor Fed-Batch Strategies

by
Isabella Maria Tenório Soares Santos
1,
Evanildo F. de Souza, Jr.
1,
Ricardo Gonzalo Ramirez Brenes
1,
Maria Angela Bernardes Grieco
1,
Ninoska Isabel Bojorge Ramirez
2 and
Nei Pereira, Jr.
1,*
1
Center of Biofuels, Oil and Derivatives, School of Chemistry, Federal University of Rio de Janeiro, Rio de Janeiro 21941-972, Brazil
2
Department of Chemical and Petroleum Engineering, Fluminense Federal University, Niterói 24210-140, Brazil
*
Author to whom correspondence should be addressed.
Fermentation 2024, 10(6), 320; https://doi.org/10.3390/fermentation10060320
Submission received: 13 May 2024 / Revised: 3 June 2024 / Accepted: 11 June 2024 / Published: 18 June 2024
(This article belongs to the Special Issue Recent Advances in Bioconversion of Biomass to Value-Added Products)

Abstract

:
This study focuses on optimizing the medium composition for cellular biomass production and bioconversion of ethylene glycol (EG) to glycolic acid (GA) using Gluconobacter oxydans CCT 0552. The improvement in cellular growth in the presence of yeast extract and peptone led to a 35.7% and 32.7% increase, respectively, compared to the medium with each of these carbon sources separately. Negligible growth was produced when (NH4)2SO4 and urea were used. Optimal bioconversion results were very similar for both the stirred tank and bubble column bioreactors, with GA concentrations reaching 49.4 g/L and 47.7 g/L, volumetric productivities of 0.35 g/L∙h and 0.33 g/L∙h, and product yield factors of 1.08 g/g and 0.94 g/g, respectively. An extended fed-batch strategy using a STR-type bioreactor achieved a concentration of glycolic acid of 94.2 g/L, corresponding to a volumetric productivity of 0.41 g/L∙h and a yield factor of 1.19 g/g. The resulting efficiency of this biological transformation process achieved a remarkable value of 97.3%, simultaneously with a significant decrease in the substrate amount by 90.5%. This study demonstrates the efficiency of G. oxydans in producing GA, offering a cost-effective and environmentally sustainable production method.

1. Introduction

Glycolic acid (GA) is utilized in various industries such as food, textile, pharmaceutical, and manufacturing. It serves as a dyeing and tanning agent in the food industry, a skincare agent in the pharmaceutical industry, and a dye and tanner in the textile industry. Additionally, it is used in the synthesis of disposable packaging, emulsion polymers, solvents, paint additives, industrial and household cleaners, and adhesives to enhance flow and gloss properties [1,2,3]. It belongs to the alpha-hydroxy acid (AHA) group, which is chemically characterized by a hydroxyl group on the α carbon, the adjacent carbon of the carboxyl group. GA comprises two carbon atoms, being the smallest and simplest member of the AHA group [4]. The main pathway to produce GA is from petrochemical resources by chemical transformation, carried out by the catalytic reaction of carbonylation of the toxic formaldehyde with synthesis gas at high-pressure temperature [4,5]. This context combined with the necessity to develop economically viable and environmentally sustainable solutions have brought closer attention to the production of GA by microorganisms [5,6].
The bioproduction of GA from ethylene glycol (EG) has become a promised sustainable alternative to enable the obtainment of this organic acid since it is independent of the widely used petrochemical routes. The production of EG comes predominantly from ethylene from the petrochemical industry, but there is the possibility of producing it from bioethanol [7] and from glycerol, an abundant byproduct of the biodiesel industry [8], or directly from cellulosic biomass [7], making the whole process of obtaining glycolic acid even more sustainable.
Obtaining GA by oxidation of EG has been widely studied over the years [9,10,11,12,13,14,15], especially for dermatological uses and more recently for medical applications in its polymeric form (poly glycolic acid) as a filler material for tissue engineering applications such as bone, cartilage, tooth, and spinal regeneration [3,16,17].
Various naturally occurring yeast and acetic bacteria can produce GA by oxidation of EG [10]. In a complementary manner, synthetic metabolic pathways have been studied for GA production using genetically modified microorganisms, such as Escherichia coli, Corynebacterium glutamicum, Saccharomyces cerevisiae or Kluyveromyces lactis, enabling the synthesis of simpler and more abundant carbon sources, such as glucose [1,10].
Response surface methodology is a valuable technique employed to enhance production levels while keeping costs in check and optimizing system performance. Given the promising results of the bioconversion of EG to GA by Gluconobacter oxydans, some improvements should be made to optimize the production of this organic acid, which is the subject of this investigation. This study focuses on aspects of bioreactor aeration, process temperature and pH, equipment type and cell concentration effect, aiming for greater consumption of ethylene glycol, higher final product concentration, productivity, and yield.
We have developed and optimized a process bioreactor system to find more effective, long-lasting methods of producing GA through the bioconversion of EG. Our research identifies the operational variables, pH, and supplement concentrations that enable the acetic acid bacteria Gluconobacter oxydans CCT 0552 to convert EG to GA in the best possible way.

2. Materials and Methods

2.1. Microbial Growth and Maintenance

Gluconobacter oxydans CCT 0552 was cultivated in a liquid medium containing 25 g/L D-mannitol, 5 g/L yeast extract and 3 g/L peptone and stored at −20 °C in 20% (v/v) glycerol. All media were sterilized by autoclaving at 121 °C for 15 min. Microbial growth was performed in 500 mL Erlenmeyer flasks containing 150 mL of culture medium. The flasks were mechanically stirred in an incubator shaker (New BrunswickTM Innova® 44, Santa Clara, CA, USA) at 28 °C and 200 rpm until the final exponential growth phase reached (16 h). After the growth step, cell biomass was separated by centrifugation at 10,000 rpm for 10 min. Then, it was suspended in the GA production medium in concentrations indicated in the following sections.

2.2. Selection of Culture Medium for Cell Propagation

Six growth media with different compositions were selected from the literature, as shown in Table 1. The carbon sources selected for this study were sorbitol, mannitol, glucose, glycerol, and fructose.
After identifying the medium with the highest cell concentration, seven different carbon sources were employed for investigation. The carbon source that induced the highest growth rate was chosen as the standard and maintained constant, while the remaining compounds were varied (Table 2(a)). Following this selection process, experiments were carried out to examine cell growth using various nitrogen sources, including yeast extract (YE), peptone (PEP), ammonium sulfate, casein, and urea, with or without the addition of PEP (3 g/L), as detailed in Table 2(b).

2.3. Optimization of Cell Growth Medium

Optimization of the selected medium was designed with a carbon source (20–100 g/L), YE (5–20 g/L) and PEP (2–10 g/L). The experiment was performed via design of experiments (DOE) using central composite Design (CCD) with cell concentration (g/L) as a response parameter and 5% significance level. Statistical data were evaluated by Statistic Software, version 13.0 (Statsoft Inc., Tulsa, OK, USA). The experimental design matrix, with the evaluated and coded parameters, is shown in Table 3.

2.4. Bioconversion of Ethylene Glycol to Glycolic Acid in STR and Bubble Column Bioreactor

Biotransformation experiments were performed in a bubble column bioreactor with total volume of 8 L operated with 4 L working volume, containing the biotransformation medium which was composed of 0.5 g/L MgSO4, 1 g/L KH2PO4, 2 g/L K2HPO4, 5 g/L (NH4)2SO4, 5 g/L YE, 1 g/L mannitol. The medium was inoculated with 6 g/L of cells grown previously for 16 h in the same bioreactor with 8 L working volume, containing 30 g/L of EG as substrate. The pH was maintained between 5.5 and 6.5 by adding 4.5 M NaOH. The temperature was adjusted at 28 °C, and the aeration rate was controlled at 2.5 vvm. Two process strategies were established: S1, with 16 h grown cells centrifuged and resuspended in the bioconversion medium (two separate steps), and S2, with EG and micronutrients added to the growth medium after 16 h of cultivation (in the same bioreaction system). Samples were taken at regular intervals to quantify substrate and product by high-performance liquid chromatography (HPLC) and cells by turbidimetry.
Fed-batch bioconversion of ethylene glycol was carried out in an 8 L bubble column (BCB) with a 4 L working volume and a 5 L stirred tank (STR) with a 4 L working volume. The pH was maintained between 5.5 and 6.5 by adding 4.5 M NaOH. The impeller speed of the STR bioreactor was adjusted at 500 rpm, and the aeration rate was controlled at 2.5 vvm. The fed-batch mode of operation was carried out by adding 10 g/L EG as the substrate was consumed. Samples were taken and analyzed at time intervals of 2–10 h.
Bioconversion was also performed utilizing an extended fed-batch strategy with ethylene glycol as the substrate. The substrate concentration was maintained in a range of 10–20 g/L throughout the entire process, achieved by precise manipulation of the feeding rate, which oscillated between 0.1 and 0.3 mL/min. Adjustments to the feeding rates were made at regular intervals upon observing substrate accumulation, ensuring the substrate concentration remained within the desired range. The remaining parameters, including pH, temperature, aeration, and agitation, were maintained at the same levels as in the preceding stages. This was performed to facilitate the comparison of the various substrate-feeding methods aimed at enhancing bioconversion performance.

2.5. Analytical Methods

During experiments, samples were periodically withdrawn and centrifuged for 10 min at 10,000 rpm. Sugars, polyols, GA and EG concentrations were determined by high performance liquid chromatography (HPLC). Sugars and polyols were analyzed in waters and the GA and EG concentrations were in Shimadzu liquid chromatography. Analytes were separated by Aminex HPX-87H column (300 × 7.8 mm, Bio-Rad, Hercules, CA, USA) and quantified by a refractive index detector (RID) for sugars and polyols and (UV) for GA and EG. The column was heated to 55 °C, and the mobile phase used was 5 mM H2SO4 at a flow rate of 0.6 mL/min. The concentrations of all the analytes were calculated based on a standard curve.
Turbidimetry analyzed the samples’ cell concentration and linearly correlated with the absorbance measured in a spectrophotometer (BioTek Epoch 2 microplate spectrophotometer, Winooski, VT, USA) at 600 nm.
For each experiment, the parameters evaluated during the process of GA production from EG were the final concentration of GA, yield factor (YP/S), volumetric productivity (QP), percent substrate reduction (PSR) and bioconversion efficiency (BE). A metabolic stoichiometry of 1 mole of EG per 1 mole of GA was used to calculate the bioconversion efficiency.

3. Results and Discussion

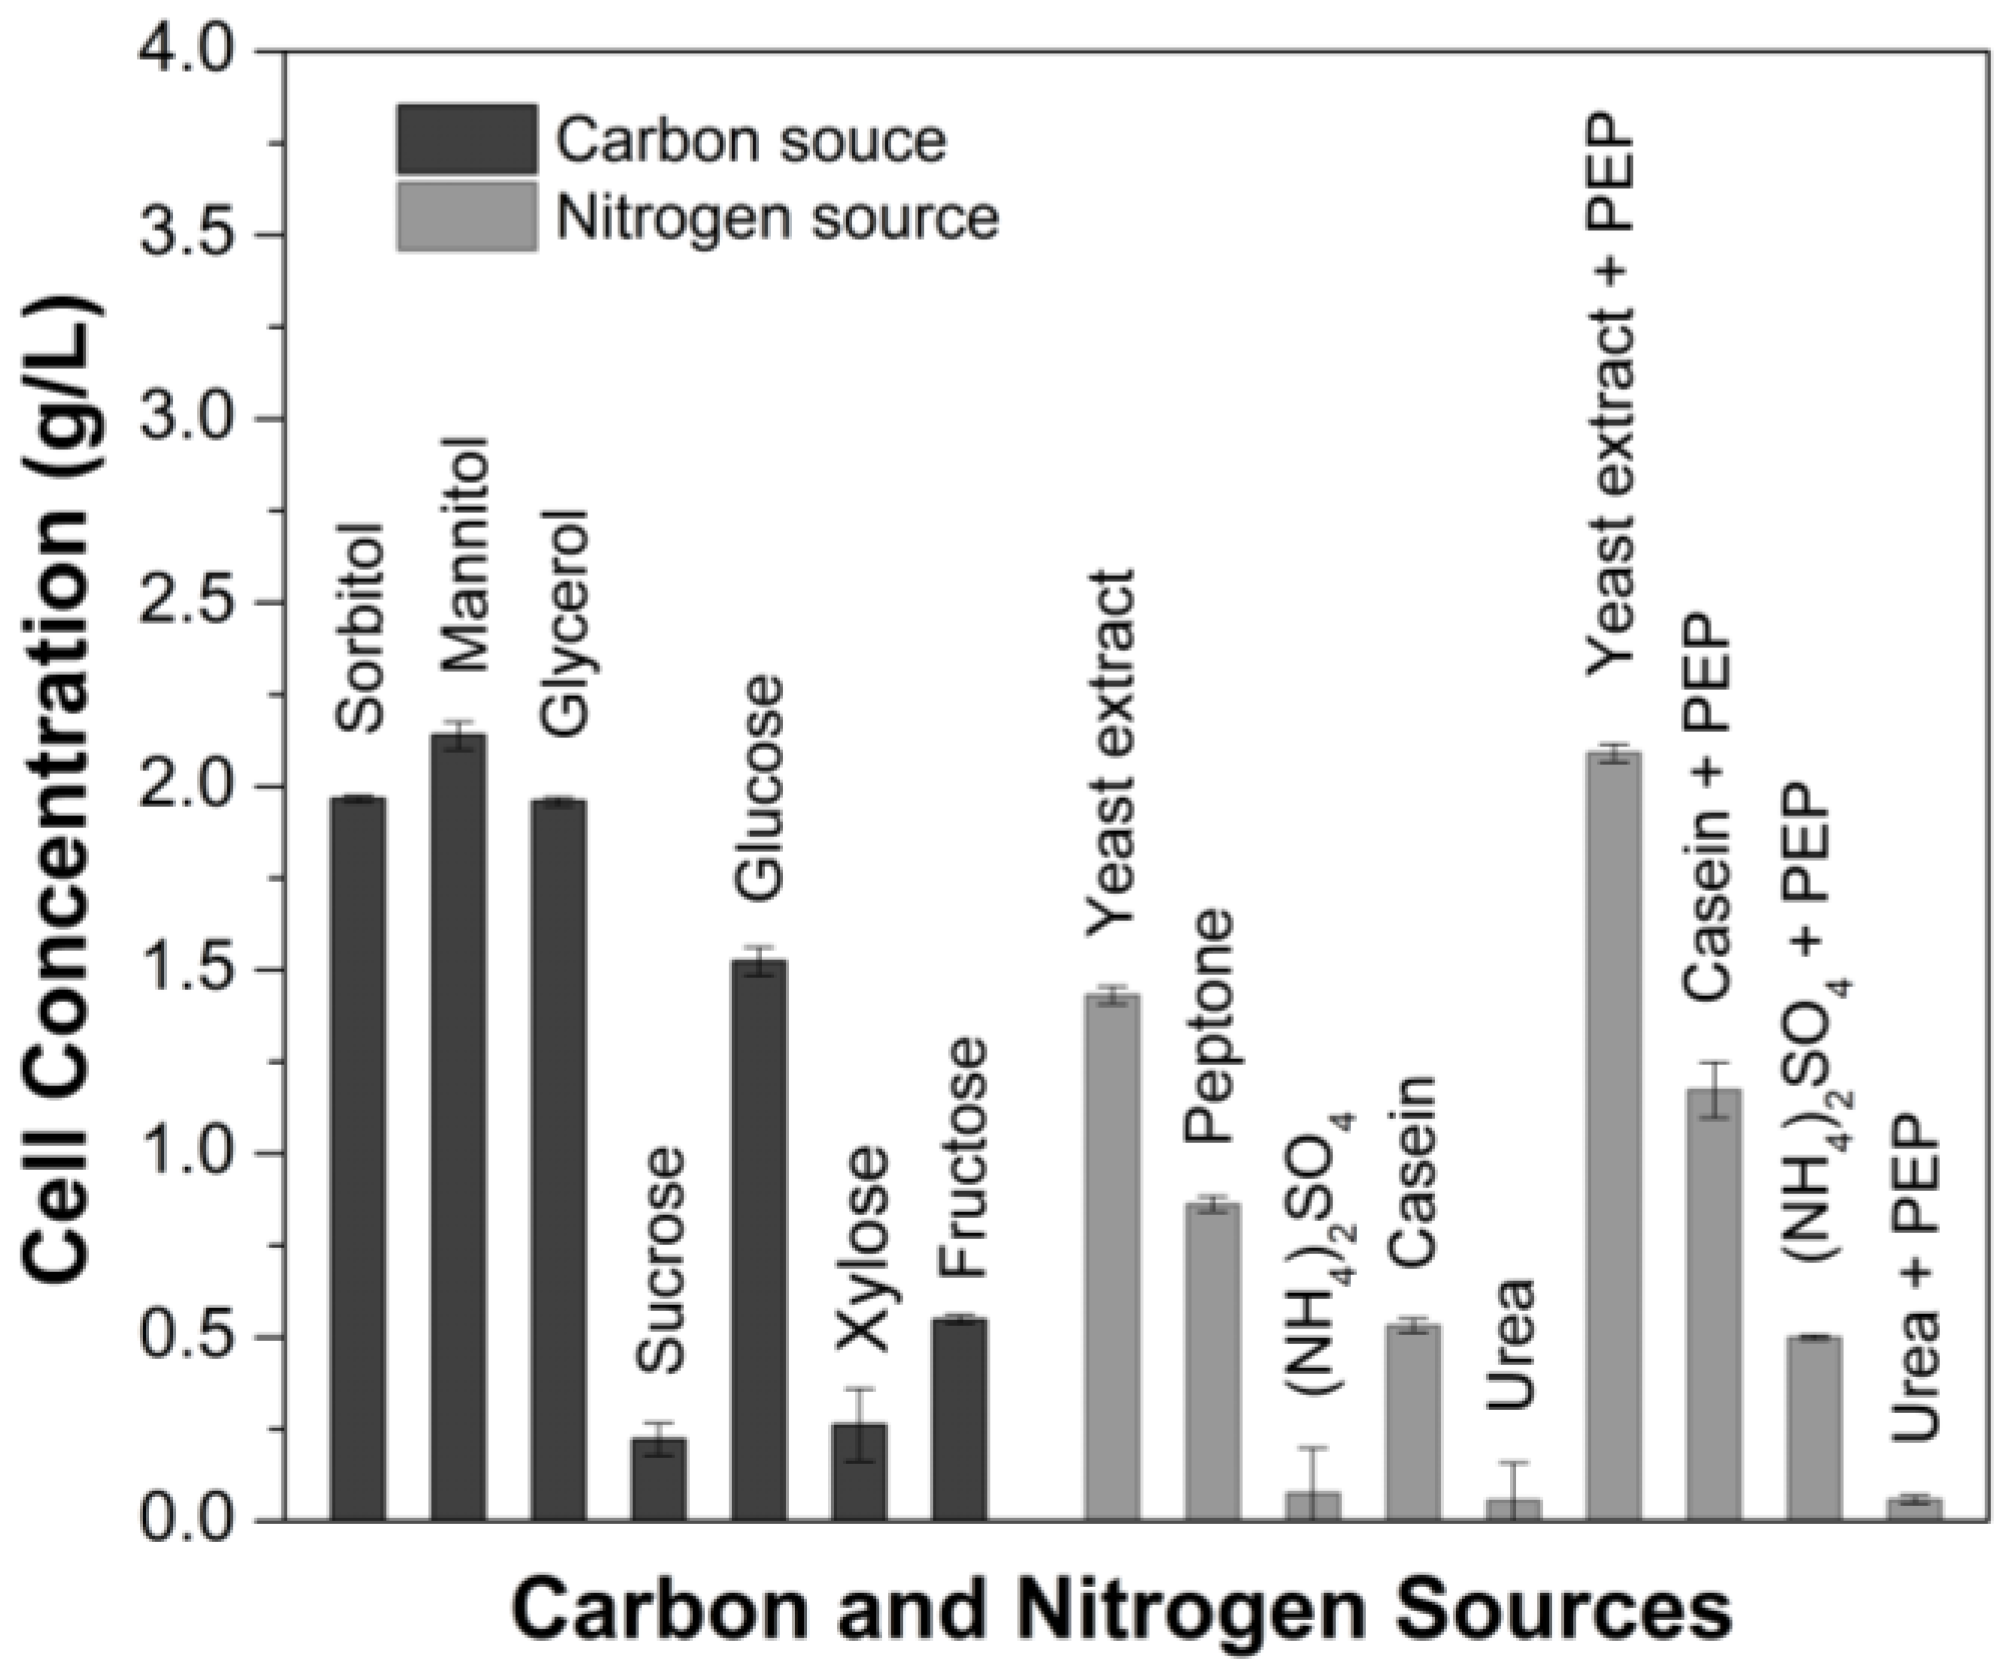
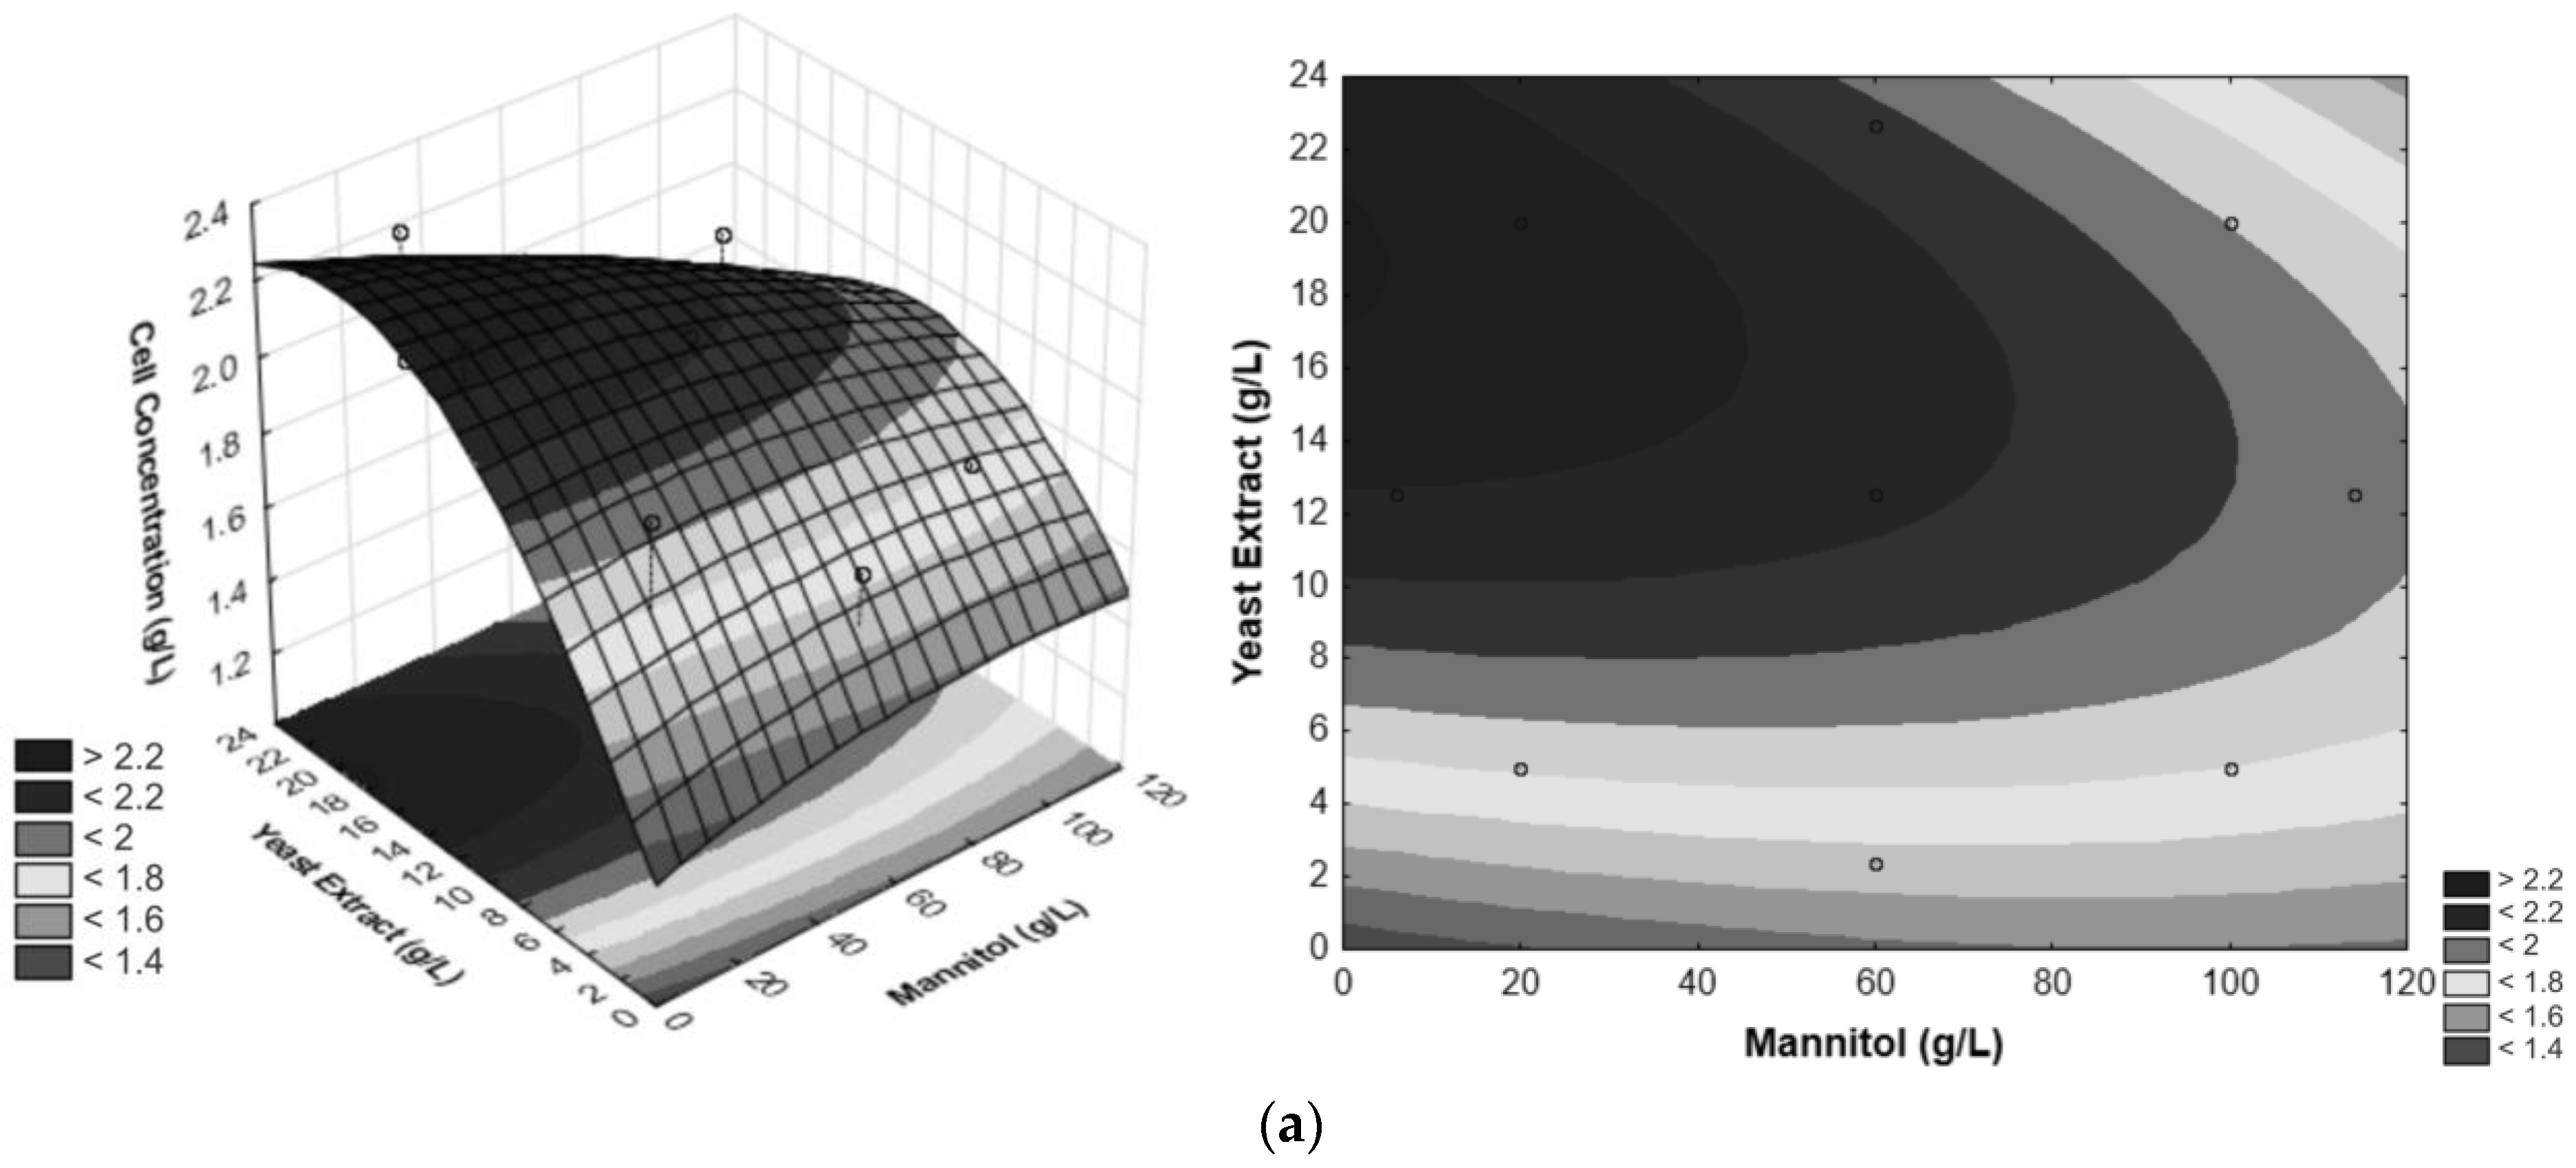
3.1. Optimization of the Growth Medium for G. oxydans

The highest cell growth was achieved using medium B, followed by medium C, with values of approximately 2.2 and 1.9 g/L, respectively, among six cultures media studied (Table 1). In this context, medium B, composed of mannitol, yeast extract (YE), and peptone (PEP), was selected as the base medium for cell growth optimization. In the optimization process, the first step entailed the selection of the carbon and nitrogen source (Table 2), which was followed by the implementation of experimental planning through DOE.
The use of polyalcohols (sorbitol, mannitol, and glycerol) as a carbon source led to better assimilation by G. oxydans, with no significant differences between them (Figure 1). Similar results were observed with Gluconobacter japonicus cultivation [21]. Concerning the fermentable sugars, compared to the polyols and except for glucose, sucrose, fructose and xylose did not promote high cell concentrations, with sucrose being the carbon source with the lowest assimilation by the bacterium. Zahid and co-workers [22] reported that G. oxydans could not use sucrose as carbon source, being not used even as energy source. The small variation in cell growth with this carbon source likely arises from the yeast extract. The results indicate that all polyalcohols investigated here can be used to carry on the next step of growth medium optimization. It is well known that polyalcohols, differently from sugars, act as a non-repressing carbon source, being a process strategy when high cell densities are targeted.
Considering that mannitol presented the highest cell growth (2.2 g/L), it was selected as the carbon source for performing the design of experiments. This carbon source was also used in the activation and propagation to avoid lag phase during cell growth. Another carbon source that was shown to be suitable for the bacterium cell growth was its isomer sorbitol (1.9 g/L), which could be used as a substitute for mannitol.
The impact on cell growth involved various nitrogen sources, such as YE, PEP, ammonium sulfate (NH4)2SO4, casein (CA), and urea (U), the last two were investigated with and without addition of PEP. YE was the nitrogen source that promoted the highest cell growth (1.4 g/L), followed by PEP (0.9 g/L) and CA (0.5 g/L). Cell growth improvement in the presence of YE resulted in a 35.7% increase compared to PEP. However, when (NH4)2SO4 and U were used with or without PEP, negligible growth was produced. In contrast, adding PEP (3 g/L) to YE or CA increased cell concentration when used alone. The combination of YE-PEP had the greatest impact on cell growth. The literature data, as reported by Moghadami and co-workers [21], supported these findings, indicating that the utilization of organic nitrogen sources and lower peptone concentrations leads to a significant increase in bacterial concentration. Results obtained in the present study show that organic nitrogen sources with or without PEP promote rapid growth and high cell yields of G. oxydans.
The literature widely suggests YE as a substrate for many microorganisms since it presents a rich composition of amino acids, peptides, water-soluble vitamins, and carbohydrates. Our results confirm these studies, and mannitol and yeast extract–peptone (YE + PEP) were selected as the optimal carbon and nitrogen sources. In searching for the optimal cell concentration, measurements were taken using varied concentrations of mannitol (20–100 g/L), YE (5–20 g/L), and PEP (2–10 g/L), all optimized through DOE. The statistical significance of the model for the response variable (cell concentration, g/L) was evaluated by the F-test (Fisher’s test) of variance analysis, when the p-value was higher than 0.05, indicating that the model terms were insignificant.
Pareto chart was used to determine the magnitude and importance of the factors (Figure 2). All the main factors (YE, PEP, and D-mannitol), and L and Q interactions of these effects were statistically significant for the model at a significance level of p ≤ 0.05. It can be observed that the factors YE (L), YE and PEP interaction (2Lby3L), YE (Q), and D-mannitol (L) were the factors that most significantly influenced cell concentration, reaching estimated effects of approximately +78.31, −77.86, −66.46, and −53.56, respectively. Positive sign indicates that increasing the YE concentration increases the planning response variable (cell concentration). On the other hand, the negative sign indicates that decreasing the concentration of mannitol increases cell concentration.
Response surfaces and contour plots corresponding to each pair of independent variables were constructed as a function of cell concentration (g/L). Contour plots show the binary combination region between the variables YE and mannitol (Figure 3a). Based on the results, it is observed that the optimal region that allows higher cell concentration of G. oxydans lies near the maximum for YE concentration and minimum for mannitol concentration. The optimal values for YE and mannitol are 20 g/L for both medium components.
Binary combinations of the factors PEP and YE, as depicted in the response surface and contour plot (Figure 3b) shows that the increase in YE concentration and the decrease in PEP concentration exhibits values higher than 2.2 g/L for cell growth of G. oxydans. Figure 3c illustrates the response surface and contour surface of cell concentration as a function of the two significant factors—PEP and mannitol (g/L), with the value of YE concentration fixed at 12.5 g/L. The region with the most favorable conditions for the statistically significant interaction is characterized by a low mannitol concentration and high PEP concentration, resulting in G. oxydans cell concentrations exceeding 2.2 g/L. Based on the response surfaces and contour curves depicted in Figure 3, it can be concluded that the optimal values for the three independent variables—mannitol, YE, and PEP concentration—are 20 g/L, 20 g/L, and 2 g/L, respectively.
Liu and co-workers [23] studied the cell growth of G. oxydans WSH-004 with different concentrations of D-sorbitol (50 g/L at 30 and 35 °C and 300 g/L at 30 and 35 °C) and determined that the OD values in the stationary phase can reach 2.7 in 50 g/L of D-sorbitol medium. In the present study, the OD values were close to those found by Liu and co-workers [23], with a 2.5-fold reduction in the carbon source concentration optimized here in the present work with D-mannitol as a carbon source. Wei and co-workers [18] also reinforce the data found here. The authors, in a non-optimized medium containing 80 g/L of sorbitol, 20 g/L of YE, 5 g/L of (NH4)2SO4, 2 g/L of KH2PO4, and 5 g/L of MgSO4·7H2O, achieved 6 g/L of Gluconobacter oxydans DSM 2003 cells in STR after 22 h. In the present work, using 20 g/L of mannitol, 20 g/L of YE, and 2 g/L of PEP, it was possible to reach 6 g/L of cells in 16 h (Figure 4) in an instrumented bioreactor. These data demonstrate that the optimized medium is promising for the growth of Gluconobacter oxydans.

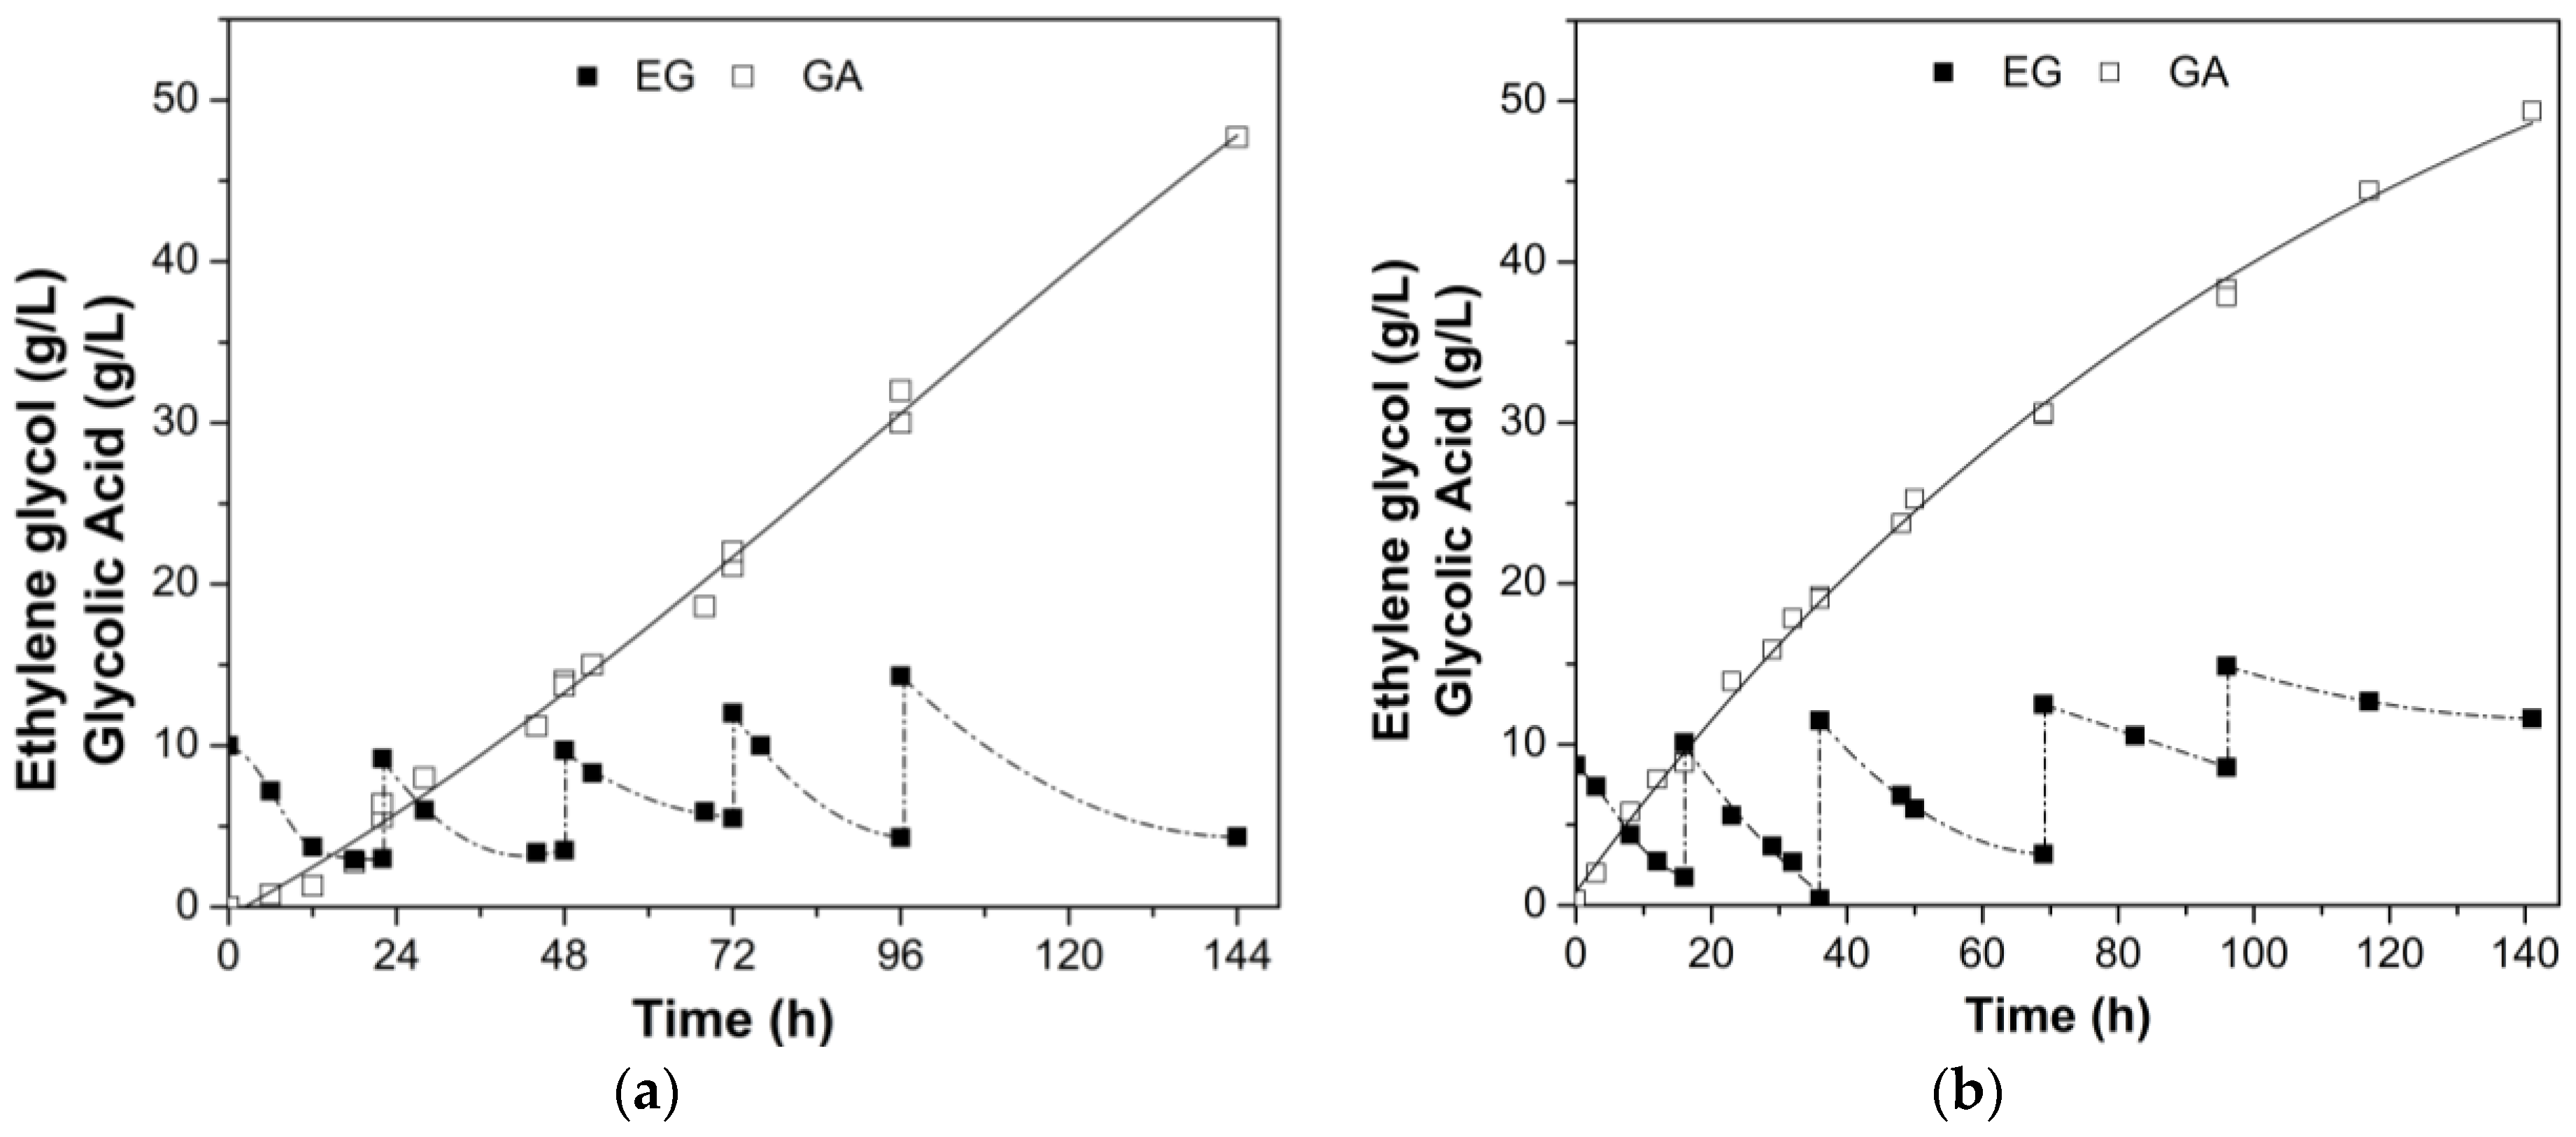
3.2. Fed-Batch Bioconversion of Ethylene Glycol to Glycolic Acid

Given that concentrations of EG above 20 g/L have been reported to inhibit G. oxydans [24,25], the bioconversion process was conducted via fed-batch operation in two bioreactor configurations (bubble column and mechanically stirred). To enhance cell viability, 1 g/L of mannitol was supplemented as a cofactor to mitigate the toxic effects of EG and AG on cellular activity, since it is a compatible solute. Fed-batch with pulsed feeding profile of the bioconversion of EG to GA is given in Figure 5.
G. oxydans, as an obligate aerobic bacterium, relies on oxygen as the final electron acceptor in its respiratory chain, localized within mesosomes (membrane regions akin to mitochondrial cristae in eukaryotes), to catalyze a series of oxidation reactions. Therefore, oxygen availability stands as a critical factor for optimizing G. oxydans’ metabolic performance. Thus, a comprehensive strategy for oxygen delivery is crucial [25]. Consequently, the stirred-tank reactor (STR) model was chosen to enhance oxygen transfer and utilization. This involved augmenting gas holdup to retain air bubbles, subdividing gas bubbles, and ensuring their even distribution within the liquid medium to reduce bubble coalescence.
Both bioreactor configurations (Figure 5) showed a similar performance, nevertheless, the STR bioreactor exhibits a higher GA concentration (3.6% higher) and bioconversion efficiency (15% higher) when compared to the bubble column bioreactor. Regarding substrate consumption, the bubble column bioreactor resulted in a much higher substrate reduction within 144 h, which might be an advantage over the STR bioreactor; however, EG was likely used for other purposes since product yield and bioconversion efficiency were lower in this pneumatic bioreactor.
Cellular activity remained consistent in both bioreactors, but the STR stood out with a noteworthy 15% higher bioconversion efficiency and product/substrate yield than the bubble column reactor (Table 4). Nevertheless, the bubble column bioreactor exhibited an 11.5% higher substrate consumption rate. Although small differences in the production and productivity of glycolic acid were observed when comparing both bioreactors, the selection was based on the other parameters. Therefore, the STR-type bioreactor demonstrated a slightly higher performance in the bioproduction of glycolic acid under specific operating conditions used in this study. Interestingly, the bacterium was able to convert the substrate with appreciable response variables in both types of bioreactors, which brings attractiveness to the process object of this study.
Thus, bioconversion was carried out utilizing an extended fed-batch strategy with ethylene glycol as the substrate, as shown in Figure 6. The substrate concentration was maintained in the range of 10–20 g/L throughout the entire process, attained by manipulating the feeding rate, which oscillated between 0.1 and 0.3 mL/min. Over 214 h, this strategy led to a final concentration of glycolic acid of 94.2 g/L (GA), corresponding to a volumetric productivity of 0.41 g/L∙h, and a yield factor YP/S of 1.19 g/g. The bioconversion efficiency of this process reached an impressive 97.3%, concurrently with a substantial reduction in the substrate content by 90.5%. This outcome underscores a notable 47.5% augmentation in the ultimate glycolic acid concentration compared to the precedent experiment involving pulse fed-batch conversion strategies.
The bioconversion process described herein involves the utilization of an extended fed-batch strategy with ethylene glycol as substrate. Fed-batch processes are commonly used in biotechnology to allow controlling substrate feeding while maintaining optimal conditions for microbial growth and product formation. By adjusting the feeding rate in response to the substrate consumption rate, the concentration of ethylene glycol in the medium could be effectively controlled. Maintaining the substrate concentration within the desired range is crucial for optimizing the bioconversion process. Too low substrate concentrations limit microbial growth and productivity, while too high substrate concentrations could lead to inhibition or other undesirable effects. The use of an extended fed-batch strategy allows for sustained production over a longer period compared to traditional batch processes, thereby maximizing the yield of the desired product.
Oxidation reactions occurring during the bioconversion of ethylene glycol (EG) to glycolic acid (GA) are catalyzed by numerous membrane-bound dehydrogenases, situated on the periplasmic side of the cytoplasmic membrane and linked to the respiratory chain. The assimilation of ethylene glycol is immediate, as the enzymes responsible for its incorporation are nonspecific and constitutive, capable of acting on a wide range of substrates [26]. The high oxidation rate typically induces a significant oxygen demand, with the oxidation products accumulating in the culture medium, often resulting in its acidification. Membrane-bound alcohol dehydrogenase (mADH) stands as one of the principal dehydrogenases in G. oxydans, catalyzing the oxidation of primary alcohols and diols into the corresponding acids or hydroxy acids [27].
The initial step is catalyzed by the enzyme alcohol dehydrogenase (ADH). ADH is responsible for the oxidation of EG to glycolaldehyde (GLA), utilizing NAD+ as a cofactor. The activity of ADH is crucial for beginning the metabolic pathway, providing the initial oxidation of the substrate and generating the first intermediate product, GLA. Subsequently, GLA is converted into glycolic acid (GA) by the enzyme aldehyde dehydrogenase (ALDH). ALDH utilizes NAD+ as a cofactor and completes the bioconversion of EG into GA, yielding the desired final product of the metabolic pathway.
Despite controlling process variables, including pH, substrate accumulation due to glycolic acid buildup reduces the bioconversion capacity of G. oxydans cells. Weak organic acids, when protonated at low extracellular pH, can diffuse into the cellular cytoplasm, leading to acidification and ion accumulation inside the cell. Bacteria capable of maintaining internal pH without impairing metabolic processes are more resistant to organic acid effects. Thus, the organism’s response to glycolic acid inhibition likely aims to sustain essential activities.
The glycolic acid concentrations obtained with the extended feeding strategy are consistent with values reported in previous studies. Table 5 shows the results achieved using bioreactors with mechanical agitation and oxygen supply systems for glycolic acid production with different microorganisms and substrates.
Using Burkholderia sp. EG13, Gao et al. [30] achieved 60 g/L of glycolic acid using the fed-batch feeding method with an integrated biotechnological process for glycolic acid production, involving in situ product removal after the fourth feeding, with a yield of 98.8%. Product removal is an important step to minimize product inhibition by glycolic acid due to medium acidification. However, the present study demonstrates that, even without the use of product removal technologies, it is possible to achieve higher glycolic acid yields simply by maintaining the optimal pH for bioconversion, thus reducing process costs.
Hua et al. [25] investigated the impact of oxygen availability on bioconversion efficiency. They carried out the bioconversion processes in two settings: one with air and the other with pure oxygen feeding. Operating in a stirred-tank reactor at 500 rpm, air and pure oxygen were supplied at rates of 3 vvm and 0.5 vvm, respectively. Results showed that while the air-fed bioreactor achieved 76.5 g/L of glycolic acid with a 97.4% yield, the pure oxygen-fed bioreactor reached 93.5 g/L of glycolic acid with a 94.2% yield. The study demonstrated that pure oxygen injection significantly enhances cellular efficiency compared to air supply, suggesting its potential for achieving higher product concentrations and improving process parameters. Nevertheless, in the present study, higher final concentrations of glycolic acid were achieved by utilizing just compressed air for oxygen feeding.
Regarding genetic modification, Zhang et al. [27] investigated the overexpression of the mADH enzyme in Gluconobacter oxydans DSM 2003 and its effects on cell growth and glycolic acid production. Transcription levels of two oxidases were enhanced, effectively boosting oxygen absorption rates, resulting in increased acid resistance. Activities of other membrane-bound dehydrogenases also showed some increase, particularly the aldehyde dehydrogenase (mALDH), which catalyzes the oxidative conversion of aldehydes to corresponding acids. The G. oxydans-adhABS strain was capable of producing 73.3 g/L with a molar yield of 93.5%. Although these findings underscore the significance of investing in genetically modified cell research, the achieved results surpassed expectations in terms of glycolic acid concentration and bioconversion efficiency.
The study by Hua et al. [34] achieved a final GA concentration of 224.71 g/L, with a yield of 98.3% after 240 h by replacing manual and intermittent substrate feeding and by a continuous automatic feeding using a peristaltic pump. Although their results, as far as product concentration, were superior to those of our study, it is important to note that Hua et al. did not take into account the remaining EG at the end of the process. The increasing concentration of EG leads to unused accumulation, which represents significant inefficiency in terms of operational costs and sustainability. The residual substrate and the additional costs for waste treatment and disposal reduce the economic and environmental viability of the process and limit its applicability in industrial contexts where efficiency and waste minimization are essential for economic and environmental sustainability.
Of particular significance is the emphasis placed in this study on pursuing complete substrate bioconversion, an aspect that lacks empirical support in prior accounts. Specifically, throughout the process, it was observed that ethylene glycol was nearly entirely consumed, reaching a utilization level greater than 90%. This observation is particularly important as comprehensive references are conspicuously absent in related papers. These findings substantiate the robustness of the adopted system, as minor residues stemming from the substrate’s bioconversion were left unutilized.
The next step of this work involves the recovery of GA, which can be achieved through various methods. One of the most used techniques is adsorption [24], in which materials such as ion exchange resins [30], activated carbon or zeolites are used to separate GA from solution. This method is known for its high efficiency and continuous operation capability but requires regeneration of adsorbents, potentially increasing operating costs. Electrodialysis [35,36] uses a selective membrane and an electric field to separate ions, remove impurities and obtain a purer GA. This method is efficient and sustainable, but can be expensive due to the cost of membranes and the energy required.
Another subsequent step of this biotransformation process would involve the use of the cell immobilization process [37] in a 3D-printed polymer matrix, a technique that is ongoing in our laboratories (natural absorption and/or immobilization on functionalized supports, such as PEI, glutaraldehyde etc.), to be used in a fluidized bioreactor. The process of adsorption on solid supports is well known [25,38], in which cells are fixed on the surface of materials such as activated carbon or lignocellulosic residues. This method is straightforward and allows cells to be recovered and reused, although weak chemical bonds can result in biomass loss during the process. Entrapment in a polymer matrix [39], such as polyurethane or calcium alginate, provides high mechanical stability and protection from adverse medium conditions, although restricted diffusion of nutrients and products may be a limitation. Adsorption in a polymer matrix such as PVA [25,39] or ABS offers advantages in term of mechanical stability, environmental sustainability, cell protection, and ease of handling, making it a promising choice for biotechnological applications.

4. Conclusions

Optimization assays for cell growth media composition produced promising results, guiding subsequent experiments, and achieving increased bacterial biomass and bioconversion yields. Bioconversion of EG to GA revealed that cell concentration, aeration, and medium pH exert influence on GA production in bioreactors. Control over these factors proved crucial for enhancing process yields, otherwise they may impact the control of the enzymes responsible for glycolic acid synthesis. Furthermore, the bioconversion of ethylene glycol into glycolic acid by this bacterium resulted in response variables that signal possible industrial production of this organic acid, whose market is booming. Although there are gaps in the transposition of this process from the bench scale to the industrial scale, the present work fills some technical bottlenecks to create a sustainable and economical production of glycolic acid. Additionally, the biotransformation process is connected to the petrochemical industry, as it uses a substrate that is currently produced mainly through the petrochemical route, thus incorporating renewability in the matrix of fossil feedstock.

Author Contributions

Conceptualization, N.P.J., I.M.T.S.S. and N.I.B.R.; Methodology, I.M.T.S.S.; Formal analysis, I.M.T.S.S.; Investigation, I.M.T.S.S., E.F.d.S.J., R.G.R.B., M.A.B.G., N.I.B.R. and N.P.J.; Resources, N.P.J.; Data curation, I.M.T.S.S.; Writing—original draft, I.M.T.S.S., E.F.d.S.J., R.G.R.B. and M.A.B.G.; Visualization, E.F.d.S.J., R.G.R.B. and M.A.B.G.; Supervision, N.P.J. and N.I.B.R. All authors have read and agreed to the published version of the manuscript.

Funding

This research was financially supported by SinoChem International, to which we are sincerely grateful.

Institutional Review Board Statement

Not applicable.

Informed Consent Statement

Not applicable.

Data Availability Statement

The original contributions presented in the study are included in the article, further inquiries can be directed to the corresponding author.

Conflicts of Interest

The authors declare no conflict of interest.

References

  1. Salusjärvi, L.; Havukainen, S.; Koivistoinen, O.; Toivari, M. Biotechnological production of glycolic acid and ethylene glycol: Current state and perspectives. Appl. Microbiol. Biotechnol. 2019, 103, 2525–2535. [Google Scholar] [CrossRef]
  2. Cabulong, R.B.; Lee, W.-K.; Bañares, A.B.; Ramos, K.R.M.; Nisola, G.M.; Valdehuesa, K.N.G.; Chung, W.-J. Engineering Escherichia coli for glycolic acid production from D-xylose through the Dahms pathway and glyoxylate bypass. Appl. Microbiol. Biotechnol. 2018, 102, 2179–2189. [Google Scholar] [CrossRef] [PubMed]
  3. Jem, K.J.; Tan, B. The development and challenges of poly (lactic acid) and poly (glycolic acid). Adv. Ind. Eng. Polym. Res. 2020, 3, 60–70. [Google Scholar] [CrossRef]
  4. Davy, J.M. Process for the Production of Glycolic Acid. U.S. Patent 10,640,443, 5 May 2020. [Google Scholar]
  5. Becker, J.; Lange, A.; Fabarius, J.; Wittmann, C. Top value platform chemicals: Bio-based production of organic acids. Curr. Opin. Biotechnol. 2015, 36, 168–175. [Google Scholar] [CrossRef] [PubMed]
  6. Zhou, X.; Zha, M.; Cao, J.; Yan, H.; Feng, X.; Chen, D.; Yang, C. Glycolic Acid Production from Ethylene Glycol via Sustainable Biomass Energy: Integrated Conceptual Process Design and Comparative Techno-economic–Society–Environment Analysis. ACS Sustain. Chem. Eng. 2021, 9, 10948–10962. [Google Scholar] [CrossRef]
  7. Van Uytvanck, P.P.; Hallmark, B.; Haire, G.; Marshall, P.J.; Dennis, J.S. Impact of Biomass on Industry: Using Ethylene Derived from Bioethanol within the Polyester Value Chain. ACS Sustain. Chem. Eng. 2014, 2, 1098–1105. [Google Scholar] [CrossRef]
  8. Kandasamy, S.; Samudrala, S.P.; Bhattacharya, S. The route towards sustainable production of ethylene glycol from a renewable resource, biodiesel waste: A review. Catal. Sci. Technol. 2019, 9, 567–577. [Google Scholar] [CrossRef]
  9. Hua, X.; Cao, R.; Zhou, X.; Xu, Y. Integrated process for scalable bioproduction of glycolic acid from cell catalysis of ethylene glycol. Bioresour. Technol. 2018, 268, 402–407. [Google Scholar] [CrossRef] [PubMed]
  10. Kataoka, M.; Sasaki, M.; Hidalgo, A.-R.G.D.; Nakano, M.; Shimizu, S. Glycolic Acid Production Using Ethylene Glycol-Oxidizing Microorganisms. Biosci. Biotechnol. Biochem. 2001, 65, 2265–2270. [Google Scholar] [CrossRef]
  11. Loder, D.J. Process for Manufacture of Glycolic Acid. U.S. Patent 2,152,852, 4 April 1939. [Google Scholar]
  12. Häberlein, H.H.; Häberlein, J.T.; Haberlein, M.C.; Ebmeyer, F.; Häberlein, H.; Mohn, H. 54 Process for Preparing a Particularly Pure Glycolic Acid 30 Foreign Application Priority Data. U.S. Patent US5723662A, 18 June 1997. [Google Scholar]
  13. Kobetz, P.; Lindsay, K. 440 1 Process for the Preparation: Of Glycolic Acid Background of the Invention 1. Field of the Invention. U.S. Patent 3,867,440, 18 February 1975. [Google Scholar]
  14. Chauhan, S.; DiCosimo, R.; Fallon, R.; Gavagan, J.; Payne, M. Method for Producing Glycolic Acid from Glycolonitrile Using Nitrilase. U.S. Patent USOO641 698OB1, 9 July 2002. [Google Scholar]
  15. DiCosimo, R.; Panova, A.; O’Keefe, D.; Thompson, J.S.; Payne, M. Enzymatic Production of Glycolic Acid. U.S. Patent US7198927B2, 3 April 2007. [Google Scholar]
  16. Cotellessa, C.; Peris, K.; Chimenti, S. Glycolic acid and its use in dermatology. J. Eur. Acad. Dermatol. Venereol. 1995, 5, 215–217. [Google Scholar] [CrossRef]
  17. Ginjupalli, K.; Shavi, G.V.; Averineni, R.K.; Bhat, M.; Udupa, N.; Upadhya, P.N. Poly(α-hydroxy acid) based polymers: A review on material and degradation aspects. Polym. Degrad. Stab. 2017, 144, 520–535. [Google Scholar] [CrossRef]
  18. Wei, G.; Yang, X.; Gan, T.; Zhou, W.; Lin, J.; Wei, D. High cell density fermentation of Gluconobacter oxydans DSM 2003 for glycolic acid production. J. Ind. Microbiol. Biotechnol. 2009, 36, 1029–1034. [Google Scholar] [CrossRef] [PubMed]
  19. Zhou, X.; Hua, X.; Zhou, X.; Xu, Y.; Zhang, W. Continuous co-production of biomass and bio-oxidized metabolite (sorbose) using Gluconobacter oxydans in a high-oxygen tension bioreactor. Bioresour. Technol. 2019, 277, 221–224. [Google Scholar] [CrossRef] [PubMed]
  20. Nguyen, T.M.; Goto, M.; Noda, S.; Matsutani, M.; Hodoya, Y.; Kataoka, N.; Adachi, O.; Matsushita, K.; Yakushi, T. The 5-Ketofructose Reductase of Gluconobacter sp. Strain CHM43 Is a Novel Class in the Shikimate Dehydrogenase Family. J. Bacteriol. 2021, 203, e0055820. [Google Scholar] [CrossRef] [PubMed]
  21. Moghadami, F.; Fooladi, J.; Hosseini, R. Introducing a thermotolerant Gluconobacter japonicus strain, potentially useful for coenzyme Q10 production. Folia Microbiol. 2019, 64, 471–479. [Google Scholar] [CrossRef] [PubMed]
  22. Zahid, N.; Schweiger, P.; Galinski, E.; Deppenmeier, U. Identification of mannitol as compatible solute in Gluconobacter oxydans. Appl. Microbiol. Biotechnol. 2015, 99, 5511–5521. [Google Scholar] [CrossRef] [PubMed]
  23. Liu, L.; Zeng, W.; Yu, S.; Li, J.; Zhou, J. Rapid Enabling of Gluconobacter oxydans Resistance to High D-Sorbitol Concentration and High Temperature by Microdroplet-Aided Adaptive Evolution. Front. Bioeng. Biotechnol. 2021, 9, 731247. [Google Scholar] [CrossRef] [PubMed]
  24. Wei, G.; Yang, X.; Zhou, W.; Lin, J.; Wei, D. Adsorptive bioconversion of ethylene glycol to glycolic acid by Gluconobacter oxydans DSM 2003. Biochem. Eng. J. 2009, 47, 127–131. [Google Scholar] [CrossRef]
  25. Hua, X.; Du, G.; Xu, Y. Cost-practical of glycolic acid bioproduction by immobilized whole-cell catalysis accompanied with compressed oxygen supplied to enhance mass transfer. Bioresour. Technol. 2019, 283, 326–331. [Google Scholar] [CrossRef] [PubMed]
  26. Wei, L.-J.; Zhou, J.; Zhu, D.; Cai, B.; Lin, J.-P.; Hua, Q.; Wei, D.-Z. Functions of membrane-bound alcohol dehydrogenase and aldehyde dehydrogenase in the bio-oxidation of alcohols in Gluconobacter oxydans DSM 2003. Biotechnol. Bioprocess Eng. 2012, 17, 1156–1164. [Google Scholar] [CrossRef]
  27. Zhang, H.; Shi, L.; Mao, X.; Lin, J.; Wei, D. Enhancement of cell growth and glycolic acid production by overexpression of membrane-bound alcohol dehydrogenase in Gluconobacter oxydans DSM 2003. J. Biotechnol. 2016, 237, 18–24. [Google Scholar] [CrossRef] [PubMed]
  28. Zhang, Z.; Yang, Y.; Wang, Y.; Gu, J.; Lu, X.; Liao, X.; Shi, J.; Kim, C.H.; Lye, G.; Baganz, F.; et al. Ethylene glycol and glycolic acid production from xylonic acid by Enterobacter cloacae. Microb. Cell Fact. 2020, 19, 89. [Google Scholar] [CrossRef] [PubMed]
  29. Lu, X.; Yao, Y.; Yang, Y.; Zhang, Z.; Gu, J.; Mojovic, L.; Knezevic-Jugovic, Z.; Baganz, F.; Lye, G.; Shi, J.; et al. Ethylene glycol and glycolic acid production by wild-type Escherichia coli. Biotechnol. Appl. Biochem. 2021, 68, 744–755. [Google Scholar] [CrossRef] [PubMed]
  30. Gao, X.; Ma, Z.; Yang, L.; Ma, J. Enhanced Bioconversion of Ethylene Glycol to Glycolic Acid by a Newly Isolated Burkholderia sp. EG13. Appl. Biochem. Biotechnol. 2014, 174, 1572–1580. [Google Scholar] [CrossRef] [PubMed]
  31. Deng, Y.; Mao, Y.; Zhang, X. Metabolic engineering of E. coli for efficient production of glycolic acid from glucose. Biochem. Eng. J. 2015, 103, 256–262. [Google Scholar] [CrossRef]
  32. Pereira, B.; Li, Z.-J.; De Mey, M.; Lim, C.G.; Zhang, H.; Hoeltgen, C.; Stephanopoulos, G. Efficient utilization of pentoses for bioproduction of the renewable two-carbon compounds ethylene glycol and glycolate. Metab. Eng. 2016, 34, 80–87. [Google Scholar] [CrossRef] [PubMed]
  33. Deng, Y.; Ma, N.; Zhu, K.; Mao, Y.; Wei, X.; Zhao, Y. Balancing the carbon flux distributions between the TCA cycle and glyoxylate shunt to produce glycolate at high yield and titer in Escherichia coli. Metab. Eng. 2018, 46, 28–34. [Google Scholar] [CrossRef]
  34. Hua, X.; Zhou, X.; Xu, Y. Improving techno-economics of bioproduct glycolic acid by successive recycled-cell catalysis of ethylene glycol with Gluconobacter oxydans. Bioprocess. Biosyst. Eng. 2018, 41, 1555–1559. [Google Scholar] [CrossRef] [PubMed]
  35. Yu, Q.; Hua, X.; Zhou, X.; Xu, B.; Wang, H.; Xu, Y. A roundabout strategy for high-purity glycolic acid biopreparation via a resting cell bio-oxidation catalysis of ethylene glycol. Green Chem. 2022, 24, 5142–5150. [Google Scholar] [CrossRef]
  36. Handojo, L.; Wardani, A.K.; Regina, D.; Bella, C.; Kresnowati, M.T.A.P.; Wenten, I.G. Electro-membrane processes for organic acid recovery. RSC Adv. 2019, 9, 7854–7869. [Google Scholar] [CrossRef] [PubMed]
  37. Lapponi, M.J.; Méndez, M.B.; Trelles, J.A.; Rivero, C.W. Cell immobilization strategies for biotransformations. Curr. Opin. Green Sustain. Chem. 2022, 33, 100565. [Google Scholar] [CrossRef]
  38. He, Y.-C.; Xu, J.-H.; Su, J.-H.; Zhou, L. Bioproduction of Glycolic Acid from Glycolonitrile with a New Bacterial Isolate of Alcaligenes sp. ECU0401. Appl. Biochem. Biotechnol. 2010, 160, 1428–1440. [Google Scholar] [CrossRef] [PubMed]
  39. Zhou, X.; Han, J.; Xu, Y. Electrodialytic bioproduction of xylonic acid in a bioreactor of supplied-oxygen intensification by using immobilized whole-cell Gluconobacter oxydans as biocatalyst. Bioresour. Technol. 2019, 282, 378–383. [Google Scholar] [CrossRef] [PubMed]
Figure 1. Evaluation of Gluconobacter oxydans CCT 0552 growth under different carbon sources and nitrogen sources.
Fermentation 10 00320 g001
Figure 2. Pareto chart showing the absolute values of the standardized effects from the largest effect to the smallest effect for the CCD experimental design.
Fermentation 10 00320 g002
Figure 3. Optimization of YE, PEP and D-mannitol from CCD. (a) Surface response and contour plot for evaluating the effect of YE and D-mannitol vs. cell concentration, (b) surface response and contour plot for evaluating the effect of PEP and YE vs. cell concentration, (c) surface response and contour plot for evaluating the effect of YE and PEP vs. cell concentration. The circles inform where the responses are for the points analyzed in the experimental design within the space of the generated response surface.
Fermentation 10 00320 g003aFermentation 10 00320 g003b
Figure 4. Kinetic growth profile of G. oxydans CCT 0552 in an instrumented bioreactor using optimized culture medium 20 g/L of mannitol, 20 g/L of YE, and 2 g/L of PEP.
Fermentation 10 00320 g004
Figure 5. Kinetic profile of bioconversion of glycolic acid by G. oxydans CCT 0552 in a pulse fed-batch system in (a) bubble column bioreactor and (b) stirred tank bioreactor (STR). Culture medium composed of 0.5 g/L MgSO4, 1 g/L KH2PO4, 2 g/L K2HPO4, 5 g/L (NH4)2SO4, 5 g/L YE, 1 g/L mannitol. Initial cell concentration of 6 g/L, at 28 °C, pH 5.5–6.5, 2.5 vvm specific aeration rate, and 500 rpm agitation (STR) for 140 h.
Fermentation 10 00320 g005
Figure 6. Kinetic profile of extended fed-batch bioconversion of ethylene glycol to glycolic acid by G. oxydans CCT 0552. The initial ethylene glycol concentration was 20 g/L. Bioconversion was carried out in a 4 L stirred tank bioreactor (STR) at 28 °C, initial cell concentration of 6 g/L, pH 5.5–6.5, 2.5 vvm aeration rate, 500 rpm agitation and feeding rate ranging from 0.1 to 0.3 mL/min.
Fermentation 10 00320 g006
Table 1. Growth media with different compositions selected from the literature.
Culture MediumComposition (g/L)Reference
ASorbitol—80
Yeast Extract—20
(NH4)2SO4—5
KH2PO4—2
MgSO4·7H2O—5
Wei et al. [18]
BMannitol—25
Yeast Extract—5
Peptone—3
CCT (mannitol medium)
CMannitol—25
Yeast Extract—5
Peptone—3
(NH4)2SO4—5
KH2PO4—2
MgSO4·7H2O—5
modified mannitol medium
DGlucose—50
Yeast Extract—5
(NH4)2SO4—5
KH2PO4—1
K2HPO4—2
MgSO4·7H2O—0.5
Zhou et al. [19]
EGlycerol—20
Glucose—5
Yeast Extract—10
Nguyen et al. [20]
FFructose—40
Yeast Extract—3
Peptone—3
Table 2. Growth media for the evaluation of carbon (a) and nitrogen (b) sources.
ab
Carbon SourcesGrowing Medium with Best ResultNitrogen SourcesMedium with Best Carbon Source
Sorbitol
Mannitol
Glycerol
Sucrose
Glucose
Xylose
Fructose
Carbon source
(25 g/L)
+
Yeast Extract (5 g/L)
Peptone (3 g/L)
Yeast Extract (YE)
Peptone (PEP)
Ammonium Sulfate (NH)
Casein (C)
Urea (U)
C + PEP
YE + PEP
NH + PEP
U + PEP
Nitrogen source
(5 g/L)
+
Mannitol (25 g/L)
Table 3. Experimental matrix with factors analyzed by CCD.
ExperimentsIndependent Variables
Mannitol (g/L)YE (g/L)PEP (g/L)
120 (−1)5 (−1)2 (−1)
220 (−1)5 (−1)10 (1)
320 (−1)20 (−1)2 (−1)
420 (−1)20 (1)10 (1)
5100 (1)5 (−1)2 (−1)
6100 (1)5 (−1)10 (1)
7100 (1)20 (1)2 (−1)
8100 (1)20 (1)10 (1)
95.87 (−1.35)12.5 (0)6 (0)
10114.12 (1.35)12.5 (0)6 (0)
1160 (0)2.35 (−1.35)6 (0)
1260 (0)22.65 (1.35)6 (0)
1360 (0)12.5 (0)0.59 (−1.35)
1460 (0)12.5 (0)11.41 (1.35)
15 (C)60 (0)12.5 (0)6 (0)
16 (C)60 (0)12.5 (0)6 (0)
17 (C)60 (0)12.5 (0)6 (0)
Table 4. Bioconversion parameters of ethylene glycol to glycolic acid by G. oxydans in bubble column bioreactor (BCB) and stirred tank bioreactor (STR).
Bioreactor TypeTime
(h)
GA
(g/L)
QP
(g/L∙h)
YP/S
(g/g)
PSR
(%)
BE
(%)
BC14447.70.330.93892.176.6
STR14049.40.351.07881.588.0
GA: glycolic acid; QP: volumetric productivity; YP/S: product yield factor; PSR: percent substrate reduction; BE: bioconversion efficiency.
Table 5. Glycolic acid production using different substrates and microorganisms.
MicroorganismSubstrateGA
(g/L)
QP
(g/L∙h)
YP/SBE
(%)
Reference
Enterobacter cloacae *xylonic acid130.90.99 mol/mol-Zhang et al. [28]
Escherichia coli W3110xylonic acid10.30.70.5 mol/mol-Lu et al. [29]
Gluconobacter oxydans NL71ethylene glycol93.520.94 g/g94.2%Hua et al. [25]
Burkholderia sp. EG13ethylene glycol600.5-98.8%Gao et al. [30]
Escherichia coli BW25113 *glucose56.40.470.52 g/g61.2%Deng et al. [31]
Gluconobacter oxydans DSM 2003 *ethylene glycol73.31.63-93.5%Zhang et al. [27]
Escherichia coli K-12 MG1655xylose400.580.63 g/g-Pereira et al. [32]
Escherichia coli MG1655 *glucose65.50.850.76 g/g92.9%Deng et al. [33]
Gluconobacter oxydans CCT 0552ethylene glycol94.20.411.19 g/g97.3%This work
* Genetically modified microorganism. GA—glycolic acid concentration; QP—volumetric productivity; YP/S—yield factor of glycolic acid production relative to substrate consumption.
Disclaimer/Publisher’s Note: The statements, opinions and data contained in all publications are solely those of the individual author(s) and contributor(s) and not of MDPI and/or the editor(s). MDPI and/or the editor(s) disclaim responsibility for any injury to people or property resulting from any ideas, methods, instructions or products referred to in the content.

