Article

Optimization of the Process of Chinese Hamster Ovary (CHO) Cell Fed-Batch Culture to Stabilize Monoclonal Antibody Production and Overall Quality: Effect of pH Control Strategies

1
Key Laboratory of Industrial Biotechnology, Ministry of Education, School of Biotechnology, Jiangnan University, Wuxi 214122, China
2
School of Life Science and Food Engineering, Huaiyin Institute of Technology, Huaian 223003, China
*
Author to whom correspondence should be addressed.
Fermentation 2024, 10(7), 352; https://doi.org/10.3390/fermentation10070352
Submission received: 8 May 2024 / Revised: 9 July 2024 / Accepted: 10 July 2024 / Published: 12 July 2024

Abstract

:
Monoclonal antibodies (mAbs) used in biomedical research and therapeutic applications are primarily produced by Chinese hamster ovary (CHO) cells via fed-batch culture. The growing need for elevated quantities of biologics mandates the continual optimization of the mAb production process. The development of an effective process control method is indispensable for the production of specified mAbs by CHO cells. In this study, the effects of the pH control strategy on CHO cell fed-batch culture to produce an antibody (EA5) were first investigated in a 3 L bioreactor. The results indicate that controlling the culture pH at 7.2 during the fed-batch stage could produce a higher EA5 titer of 6.1 g/L with a lower Man5 ratio of 2.2% by day 14. Based on this, an optimized CHO cell fed-batch culture was conducted in a 15 L bioreactor to verify its effectiveness and stability. In this case, on day 14, an EA5 titer of 6.5 g/L was achieved with productivity of 0.46 g/L/day, which was 1.07-fold higher compared to that of the culture in the 3 L bioreactor. Furthermore, regarding the product quality, a monomer abundance of 96.0%, a main peak of 55.0%, and a Man5 proportion of 2.4% were maintained in the 15 L bioreactor. In addition, different cell clarification processes were evaluated using the CHO cell culture broth from the 3 L and 15 L bioreactors to further improve productivity and economic performance. Overall, this study provides some directions for process intensification and improving the quality of mAbs produced by CHO cells in the biopharmaceutical industry.

1. Introduction

Monoclonal antibodies (mAbs), which are characterized by intricate structural modifications and spatial configurations, constitute a crucial category within therapeutic protein drugs [1,2]. Due to their high affinity, specificity, and minimal adverse effects, these protein molecules stand as one of the rapidly advancing biopharmaceuticals and have demonstrated remarkable efficacy in treating human diseases such as cardiovascular disorders, cancers, and autoimmune diseases [3,4,5]. With the escalating clinical demand, enterprises involved in mAb production are increasingly compelled to enhance both the yield and quality of pharmaceuticals. Over 120 recombinant antibodies have been confirmed by the EMA and FDA, collectively representing a market revenue exceeding several billion US dollars [6]. It is estimated that the market for mAbs will reach up to USD 300 billion by 2025 [7].
Chinese hamster ovary (CHO) cells are the predominant host for mAb expression [2]. Compared with those from other expression systems, mAbs produced in CHO cells exhibit glycosylation structures that more closely resemble those in humans, thereby reducing the risk of immune reactions [8]. Additionally, CHO cells possess the capability to integrate exogenous genes, exhibit robust adaptability to culture environments, and promote stable antibody expression [9]. Approximately 80% of human therapeutic antibodies that have received approval are synthesized utilizing CHO cells [10]. In general, mAb production via CHO cell culture technology typically encompasses the construction of cell lines, optimization of culture media and process parameters, and scale-up of cell cultures [11,12,13]. The conditions for CHO cell cultures involved in mAb production are stringent, and variations in the extracellular environment (such as pH, temperature, dissolved oxygen, osmolality, and pCO2) pose a direct impact on the antibody structure [14,15,16]. This, in turn, can influence the effectiveness and safety of mAb drugs.
The CHO cell culture modes employed for mAb production are generally categorized into four types, namely, batch, continuous, perfusion, and fed-batch culture [17,18,19]. In batch culture, the final product is harvested at one time after adding the media, which often results in unsatisfactory cell density and productivity [10,20]. The cells and products are removed from the bioreactor in a continuous culture; thus, this cell culture mode is not implemented for productive processes [19]. A perfusion culture involves the continuous removal of the cell supernatant from the bioreactor, and due to the large volume of perfusion media, it enables high cell density and elevated protein productivity [21]. Schwarz et al. (2023) developed a process intensification mode based on a microbioreactor (MBR) system to enhance the CHO cell density by up to 60 × 106 cells/mL in the perfusion mode [22]. Recently, our study reported that higher titers of 8.7–9.8 g/L of anti-PD-1 mAb were produced from CHO cells under perfusion culture conditions in a 3 L bioreactor [17]. Besides the above cultures, the fed-batch mode involves the incremental addition of nutrients at different time points, aiming to enhance cell density, maintain cell viability, and prolong the cultivation duration. To date, the predominant production process for mAbs in large-scale bioreactors is the fed-batch mode [23,24]. In recent years, mAb titers obtained with fed-batch cultures have reached more than 10 g/L [10]. For example, Mahé et al. (2022) developed an intensified fed-batch process that produced 11.4 g/L of human monoclonal IgG1 antibody [25]. In general, a fed-batch culture could enhance the expression and production of mAbs, while traditional substrate-feeding strategies might also cause the accumulation of metabolic by-products such as lactate [10]. Therefore, to achieve efficient mAb manufacturing, an effective and robust fed-batch control strategy is essential to maintain high protein titers and ensure that the critical quality attributes (CQAs) remain within permissible limits.
Paroxysmal nocturnal hemoglobinuria (PNH) is a rare and life-threatening clonal hematopoietic stem cell disorder [26]. Clinically, PNH is characterized by hemolytic anemia, venous thrombosis, and smooth muscle dysfunction. The main treatment modalities for PNH include complement inhibitors, glucocorticoids, etc. [27]. The development of a cost-effective complement C5 inhibitor with clear therapeutic efficacy and affordability is of great significance for PNH patients in developing countries such as China. An antibody named EA5, which acts against complement C5, has been produced from recombinant CHO-K1 cells for the treatment of PNH by EA Therapeutics, China. EA5 specifically binds to complement C5 with high affinity and a longer half-life period compared with Eculizumab, preventing complement C5’s cleavage into C5a and C5b, thereby inhibiting the formation of the membrane attack complex (MAC). From an industrial perspective, it is still important to increase the production performance of EA5 with higher titers and stabilized quality via process optimization technologies.
In this study, to enhance and stabilize EA5 production by CHO cells, two clones (Clone 605 and Clone 448) derived from the CHO-K1 cell line were used. Firstly, a fed-batch culture was performed in a 3 L bioreactor under different pH control strategies to select the most suitable clone and pH control method. Based on this, the effectiveness of the proposed CHO cell fed-batch culture on EA5 biosynthesis and the overall product quality, including aggregation, charge variation, and glycosylation, was carefully investigated in a 15 L bioreactor. Subsequently, the loading capacity of the primary membrane during the clarification process based on the CHO cell fed-batch cultures of the 3 L and 15 L bioreactors was analyzed. Overall, the results provide some guidance for highly efficient mAb production by CHO cells through process optimization.

2. Materials and Methods

2.1. Cell line and Media

A monoclonal antibody named EA5 was produced by two CHO suspension cell clones (Clone 605 and Clone 448) derived from CHO-K1 cells, which were stored and maintained by EA Therapeutics, China. The two clones originated from an identical parental cell line through the same transfection and generation protocols. Some culture media, including CD04 medium, Feed02A, and FeedB02, purchased from QuaCell Biotechnology Co., Ltd. (Zhongshan, China), were used. All other chemicals were obtained from Sigma-Aldrich (Shanghai, China).
The cells were thawed in a 125 mL shake flask with a 30 mL working volume containing the CD04 medium (QuaCell® CHO CD04 Medium) supplemented with 50 mg/L dextran sulfate sodium salt (DS). The cells were maintained at 37 °C in a 6% CO2 incubator (IS-RDS6C5, Crystal Technology & Industries, Inc., Dallas, TX, USA) at 130 rpm with a shaking diameter of 50 mm for 3 days. Afterward, the inoculum was expanded in six 250 mL shake flasks. The working volume of each shake flask was 60 mL of CD04 medium and 50 mg/L DS addition at an initial cell density of 0.3 × 10⁶ cells/mL. It was cultivated at 37 °C in a 6% CO2 incubator at 130 rpm with a shaking diameter of 50 mm for 3 days.

2.2. Fed-Batch Culture Conditions and pH Control Strategies

In this study, every fed-batch process was conducted in triplicate in the bioreactors (Applikon Biotechnology, Delft, The Netherlands). The four fed-batch processes (batches #1–#4) were conducted in a 3 L bioreactor with a 1.5 L working volume to investigate the effects of pH control strategies on the EA5 titer and quality produced by Clone 605 (batches #1–#2) and Clone 448 (batches #3–#4). One fed-batch culture (batch #5) was carried out in a 15 L bioreactor with an 8 L working volume to verify the effectiveness of the process control strategy using Clone 448. The CD04 medium supplemented with 50 mg/L DS and 25 mM L-methionine sulfoximine (MSX) was used as the basal medium for the cell cultures in different bioreactors (batches #1–#5). At the beginning of the CHO cell culture, the initial cell density was controlled at ~0.8 × 10⁶ cells/mL. According to a previous study [17], pH was not controlled during days 1–3. Afterwards, two pH control strategies were used. For batches #1 and #3, the pH was automatically controlled at 7.2 ± 0.1 during the fed-batch stage by adding either CO2 or a NaHCO3 solution (days 3–14). For batches #2 and #4, the pH level was controlled at 6.8 ± 0.1 during the fed-batch stage by sparging CO2 or adding the NaHCO3 solution (days 3–14). During the cell culture processes, the temperature was maintained at 36.5 °C during days 1–6, and then it was decreased to 33.0 °C. The DO level was controlled at 40% during the whole culture process by sparging air at a rate of 10–50 mL/min in the 3 L bioreactor and at a rate of 100–500 mL/min in the 15 L bioreactor. The agitation speed was kept at 280 rpm in the 3 L bioreactor and 180 rpm in the 15 L bioreactor. In batch #5, the pH level was controlled at 7.2 ± 0.1 during the fed-batch stage. The initial glucose in the basal medium was consumed by CHO cells, and its concentration was reduced gradually. When the glucose concentration in the culture broth was below 3.0–4.0 g/L, feeding medium (4.5% of Feed02A and 0.45% of FeedB02) containing 50 g/L glucose was fed into the bioreactor to control the glucose concentration within the range ~4.0–5.0 g/L during the fed-batch stage. The CHO cell fed-batch cultures were ended on day 14.

2.3. Clarification of Bioreactor Cell Cultures

The final step in the upstream process of CHO cell culture was clarification filtration, which aimed to separate EA5, CHO cells, and cell fragments from the culture broth. Generally, clarification can be achieved through a combination of depth filtration. In this study, a two-stage depth filtration membrane assembly, consisting of a primary membrane (4070PC) and a secondary membrane (H0HPPC) purchased from Hangzhou Cobetter Filtration Equipment Co., Ltd. (Hangzhou, China), was selected for evaluation. The total filtration area ratio of the primary and secondary membranes was 3:1. The 4070PC membrane has a pore size range of 4–18 μm, which is suitable for primary filtration to remove larger particle impurities such as cell fragments. The H0HPPC membrane, with a pore size range of 0.02–0.2 μm, is suitable for secondary filtration to further eliminate smaller particles and reduce the turbidity of the filtrate. The clarification filtration operation was finished when the filtration pressure was above 1.0 bar or when the instantaneous turbidity of the clarified filtrate behind the secondary membrane assembly was higher than 30 NTU.

2.4. Analytical Methods

CHO cell cultures were sampled from the bioreactors every 24 h, and the viable cell density (VCD) and viability were determined using a cell counter (Vi-Cell XR, Beckham Coulter, Brea, CA, USA). The osmolality of the CHO cell cultures was determined using a freezing point depression osmometer (Osmo210, YASN Lab Technologies, London, UK). A blood gas analyzer (RAPID Lab348 EX, Siemens, Munich, Germany) was used to measure the pCO2 in the CHO cell cultures. Analyses of glucose and lactate were performed using the Cedex Bio HT Analyzer (Roche Diagnostics International AG, Basel, Switzerland). The EA5 titer and critical quality attributes were measured on day 14 for batches #1-#4 and days 12–14 for batch #5. The EA5 titer was measured via an HPLC system (Agilent 1260 Infinity II) equipped with a POROS™ A20 column (Thermo Fisher Scientific, Waltham, MA, USA). Cation-exchange chromatography (CEX-HPLC) was used to determine the acidic, basic, and main peaks [17]. The determination of EA5 purity and the aggregation analysis were performed with the same methods reported in our previous study [17]. The oligosaccharide profiles were measured for the quantitative assessment of EA5 using an HPLC system [28]. Turbidity was measured using a turbidity meter (2100Q, Hach, Loveland, CO, USA). Significant differences between the CHO cell fed-batch cultures were confirmed via Student’s t-test using Microsoft Excel 2016. Statistical significance was considered as p < 0.05.

3. Results and Discussion

3.1. Effects of Different CHO Cell Fed-Batch Cultures on EA5 Production and Product Quality in the 3 L Bioreactor

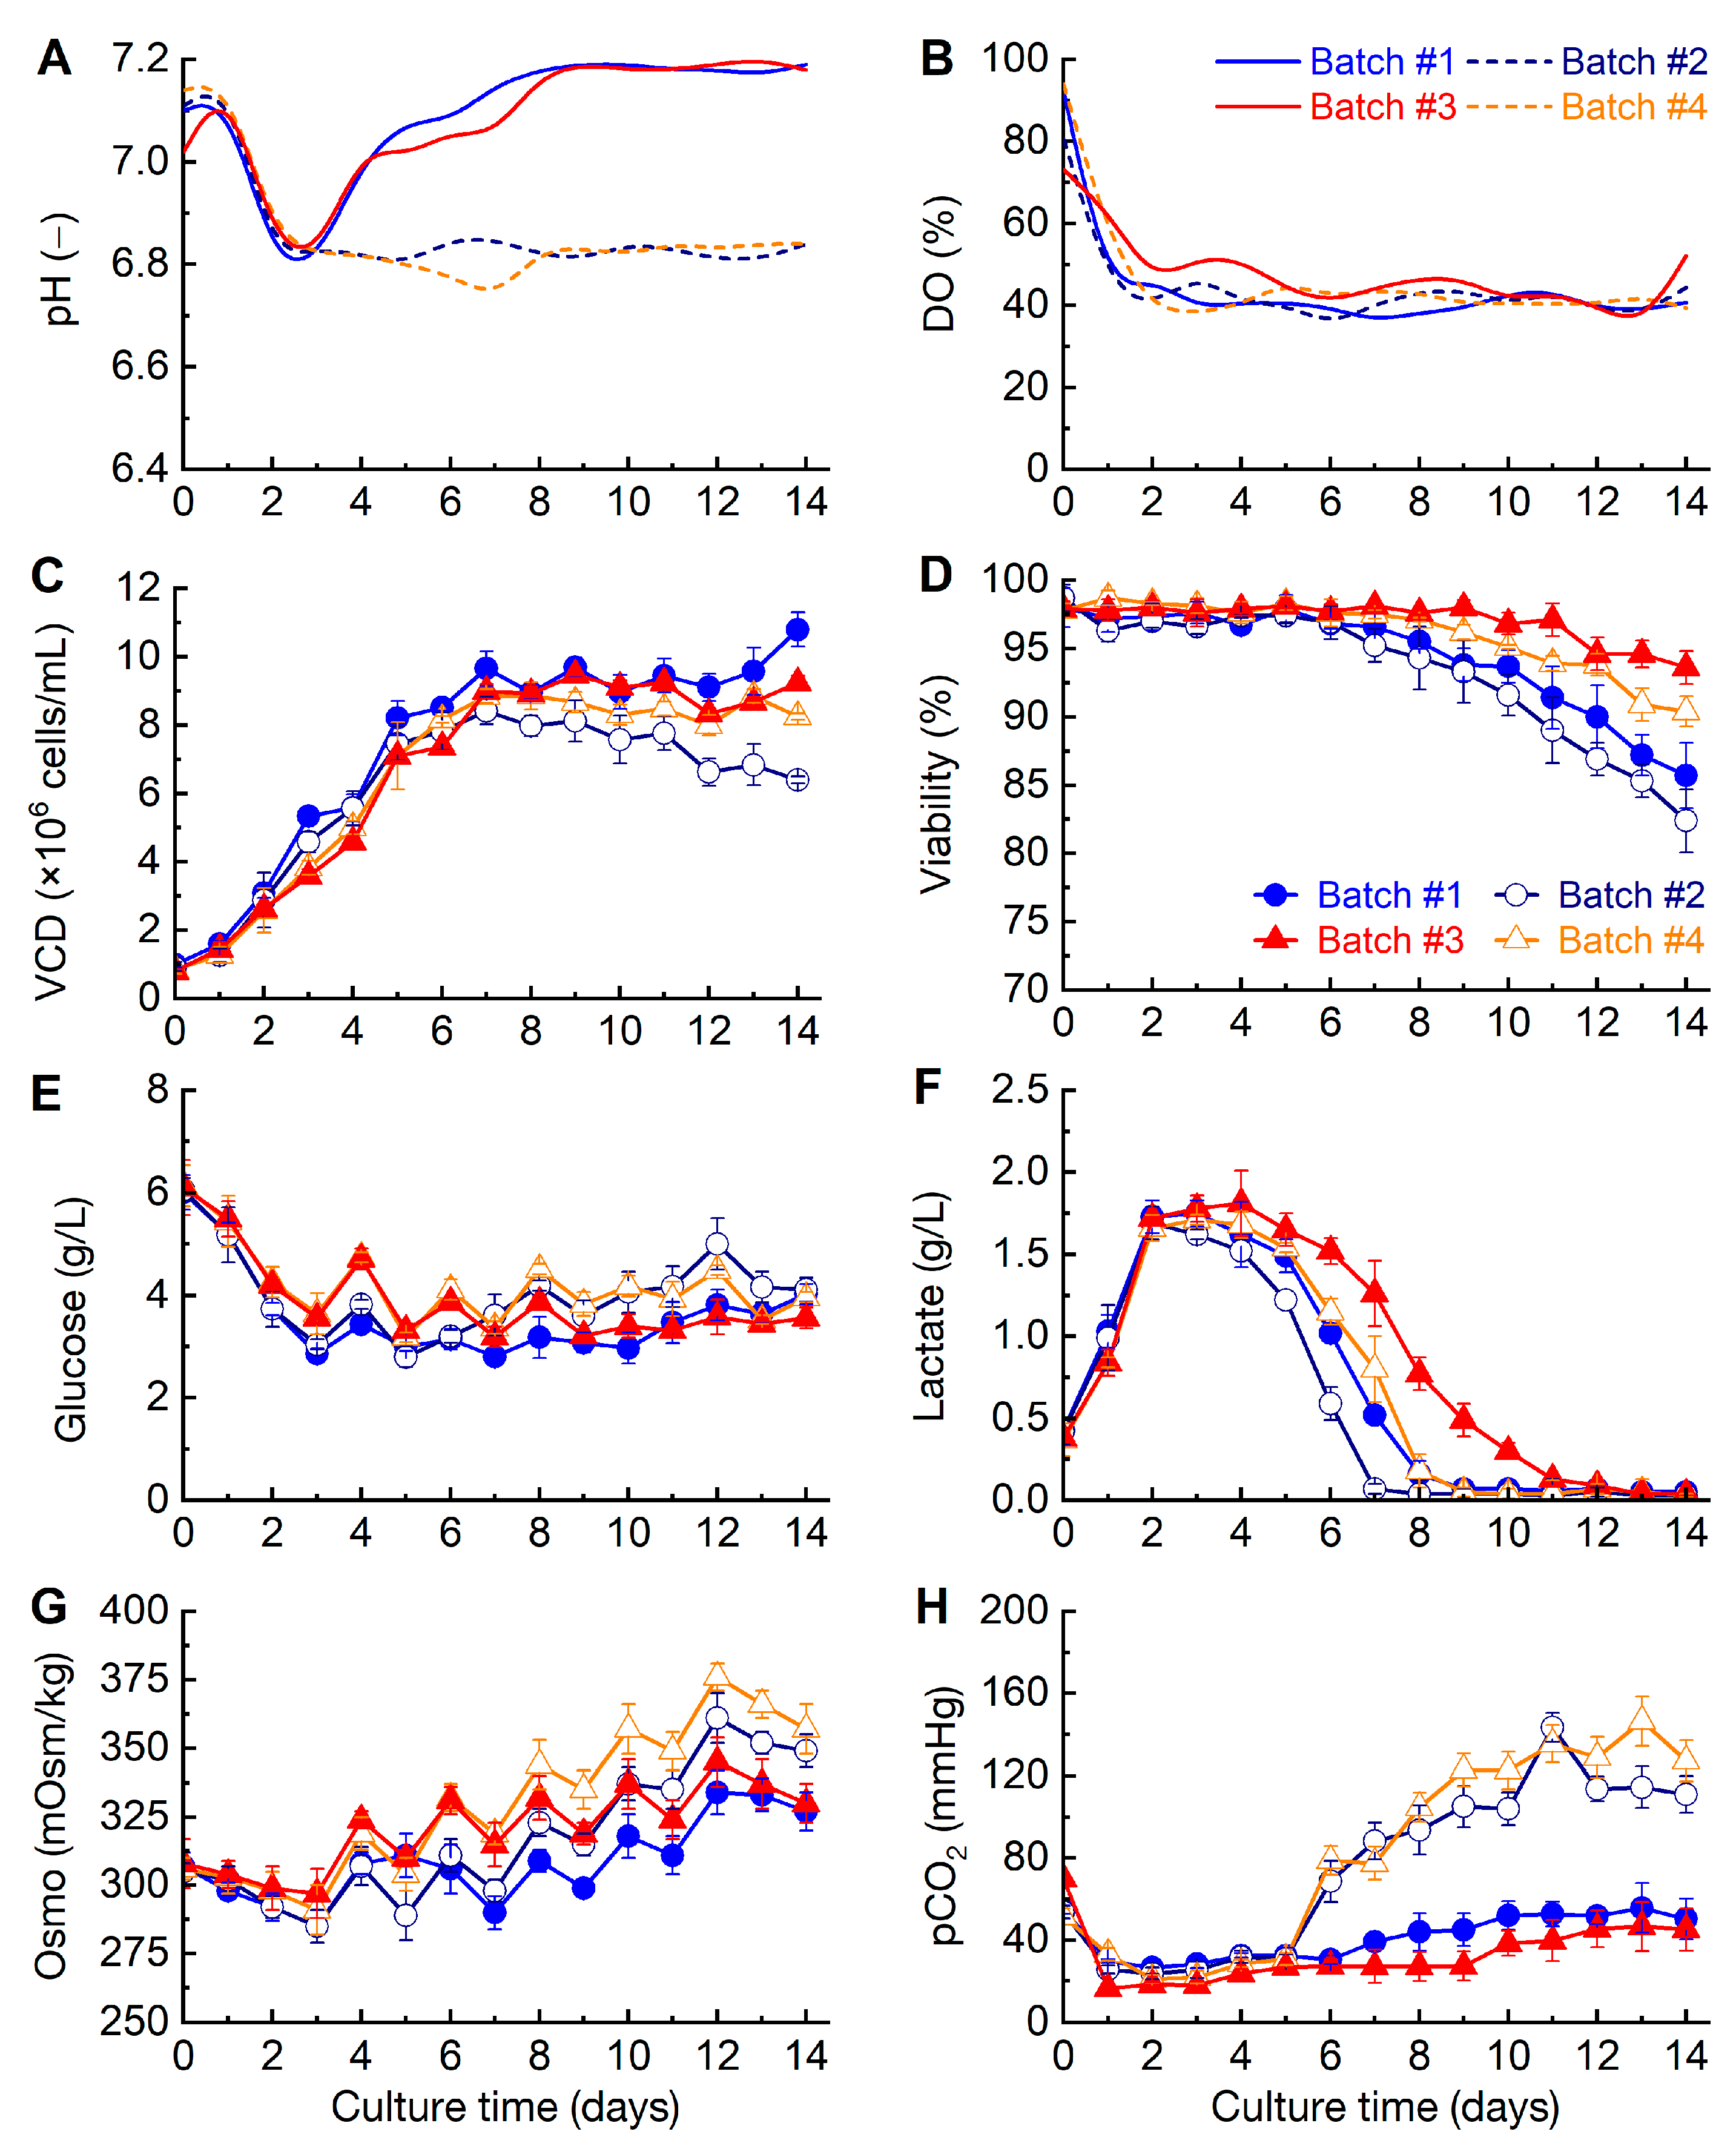
3.1.1. Changing Patterns of Process Parameters under Different CHO Cell Cultures

Due to the short culture time and unsatisfactory VCD at the end of sample collection, mAb production under batch cultures is generally not ideal [10]. Currently, the fed-batch mode is the most widely used industrial process for CHO cell cultures, mainly attributed to the ease of process operation and flexibility [29]. The mAb titers in fed-batch cultures reached 10 g/L [10,30,31]. For mAb production by a CHO cell culture, besides increasing the mAb titer, product quality such as aggregation, charge variation, and glycosylation is also an essential factor to evaluate its overall production performance [11,32]. Therefore, the ongoing challenge lies in maintaining both high cell productivity and optimal protein quality. The focus of research on fed-batch cultures has transitioned beyond solely achieving a high titer of mAbs to the dual objectives of achieving both a high titer and superior product quality [10,11]. Researchers have continued to vary cell cultures’ environmental parameters such as pH and DO in CHO cell fed-batch processes [11]. It has been reported that the pH of a cell culture significantly influences various aspects, including cell growth, cellular metabolism, and the titer and quality of mAbs in CHO cells [28,33,34]. Lee et al. (2008) found that pH significantly influences the expression rate and glycosylation of a recombinant chimeric antibody in CHO cells [34]. In addition, the metabolism of amino acids, the intermediates of the TCA cycle, and nucleosides in CHO cells are largely influenced by pH change [35]. It should be noted that the culture conditions of different CHO cell lines for producing mAbs generally need to be confirmed. To the best of our knowledge, the effects of culture pH on recombinant CHO cell growth (Clone 605 and Clone 448) and EA5 quality still remain unclear.
In this study, we analyzed the effects of different pH control strategies on the production of EA5 in two clones under fed-batch processes. The variation curves of the process parameters are depicted in Figure 1. The pH change trends during the first three days (batch stage) were similar among the four batches; afterward, pH was adjusted to 7.2 (batches #1 and #3) and 6.8 (batches #2 and #4) in the fed-batch stage. Additionally, the changes in DO for the four cell cultures are illustrated in Figure 1B. At the beginning of the CHO cell culture, due to the lower cell density, the oxygen consumption rate was relatively low, resulting in DO levels above 70%. Since the cell density increased during the culture process, the oxygen consumption rate gradually decreased. The DO level was maintained around 40% by the online controller equipped with the 3 L bioreactor.
From the variation trends of VCD in the four fed-batch cultures (Figure 1C), it could be observed that a VCD of 5.3 × 10⁶ cells/mL was achieved by Clone 605 after 3 days of culture. By applying the pH 7.2 control strategy at the fed-batch stage, it exhibited a faster average cell growth rate compared to the other three batches during the same period (days 3–14). On day 14, the VCD reached up to 10.8 × 10⁶ cells/mL in batch #1. When utilizing Clone 605 to culture under the pH 6.8 control strategy (batch #2), the overall level of VCD was lower than that of batch #1. In this case, the highest VCD of 8.4 × 10⁶ cells/mL was reached on day 7, and VCD showed a gradual decline to only 6.4 × 10⁶ cells/mL by day 14. The VCD of batch #2 at the end of the culture period was only 59.3% of batch #1. These results indicate that a lower pH environment is unfavorable for the rapid proliferation of Clone 605 cells. For Clone 448, different pH control strategies had a less pronounced effect on VCD. The VCDs on day 14 in batch #3 and batch #4 were 9.2 × 10⁶ cells/mL and 8.3 × 10⁶ cells/mL, respectively. An examination of the viability of Clone 605 and Clone 448 under different pH control strategies revealed that, within the first 7 days, the viability among the four batches generally remained above 95%. However, viability gradually decreased with prolonged culture time. The viability of the two batches of Clone 605 was lower in the later stages of culture compared to those of Clone 448 (Figure 1D). On day 14, the viability of batches #1 and #2 was in the range of 82.4–85.7%, while batches #3 and #4 maintained high levels of 90.4–93.6%. These results indicate that Clone 448 can maintain higher viability than Clone 605 under different pH control strategies, which is beneficial for the expression of EA5. Several studies have reported that a high proportion of cell death significantly impacts the glycosylation of mAbs [1,36], suggesting that batches #1 and #2 might have undesirable EA5 quality.
When the glucose in the basal medium was consumed to approximately 3 g/L by CHO cells, the feeding medium was introduced into the bioreactor to provide the necessary nutrients and glucose for cell growth and EA5 biosynthesis. Figure 1E shows the glucose variation curves in the four batches using Clone 605 and Clone 448. Some metabolic by-products, such as lactate, are generated through cellular metabolism, which could affect cell growth and product titer and quality [37]. In this study, the changing patterns of lactate are shown in Figure 1F. During the batch stage (days 1–3), lactate concentration increased from 0.4 g/L to 1.7 g/L. When entering the fed-batch stage, the lactate concentration in all four batches gradually decreased after day 4 and approached nearly zero on day 14 (0.03–0.05 g/L). These results indicate that when a glucose-feeding strategy is reasonably implemented, it can avoid excessive accumulation of lactate.
The changing profiles of osmolality and pCO2 during CHO cell fed-batch culture are depicted in Figure 1G,H. In this study, the culture pH was adjusted by sparging CO2 or adding NaHCO3 solution during the fed-batch stage. The added Na+ in cell cultures might affect the osmolality [10]. Observing the characteristics of osmolality changes showed that the feeding operations led to an increase in osmolality and a decreasing trend of glucose consumption (Figure 1E,G). Simultaneously, when the pH was maintained at 6.8 (batches #2 and #4), the osmolality in the late period of fed-batch culture was significantly higher than that in the two batches controlled at a pH of 7.2. CO2 is the inevitable by-product produced during CHO cellular respiration [38,39]. Thus, it is a significant concern in large-scale CHO cell culture. An analysis of pCO2 changes (Figure 1H) revealed that a low-pH control strategy resulted in CO2 accumulation (>100 mmHg), while a high-pH control strategy did not accumulate CO2 (~40 mmHg). Brunner et al. (2017) reported that CO2 accumulation could reduce cell growth and affect amino acid metabolism [33], which might have negative effects on mAb biosynthesis. Therefore, the results indicate that a pH of 6.8 is disadvantageous for fed-batch culture using CHO cells, and Clone 448 outperforms Clone 605 in some process indicators such as VCD and viability.

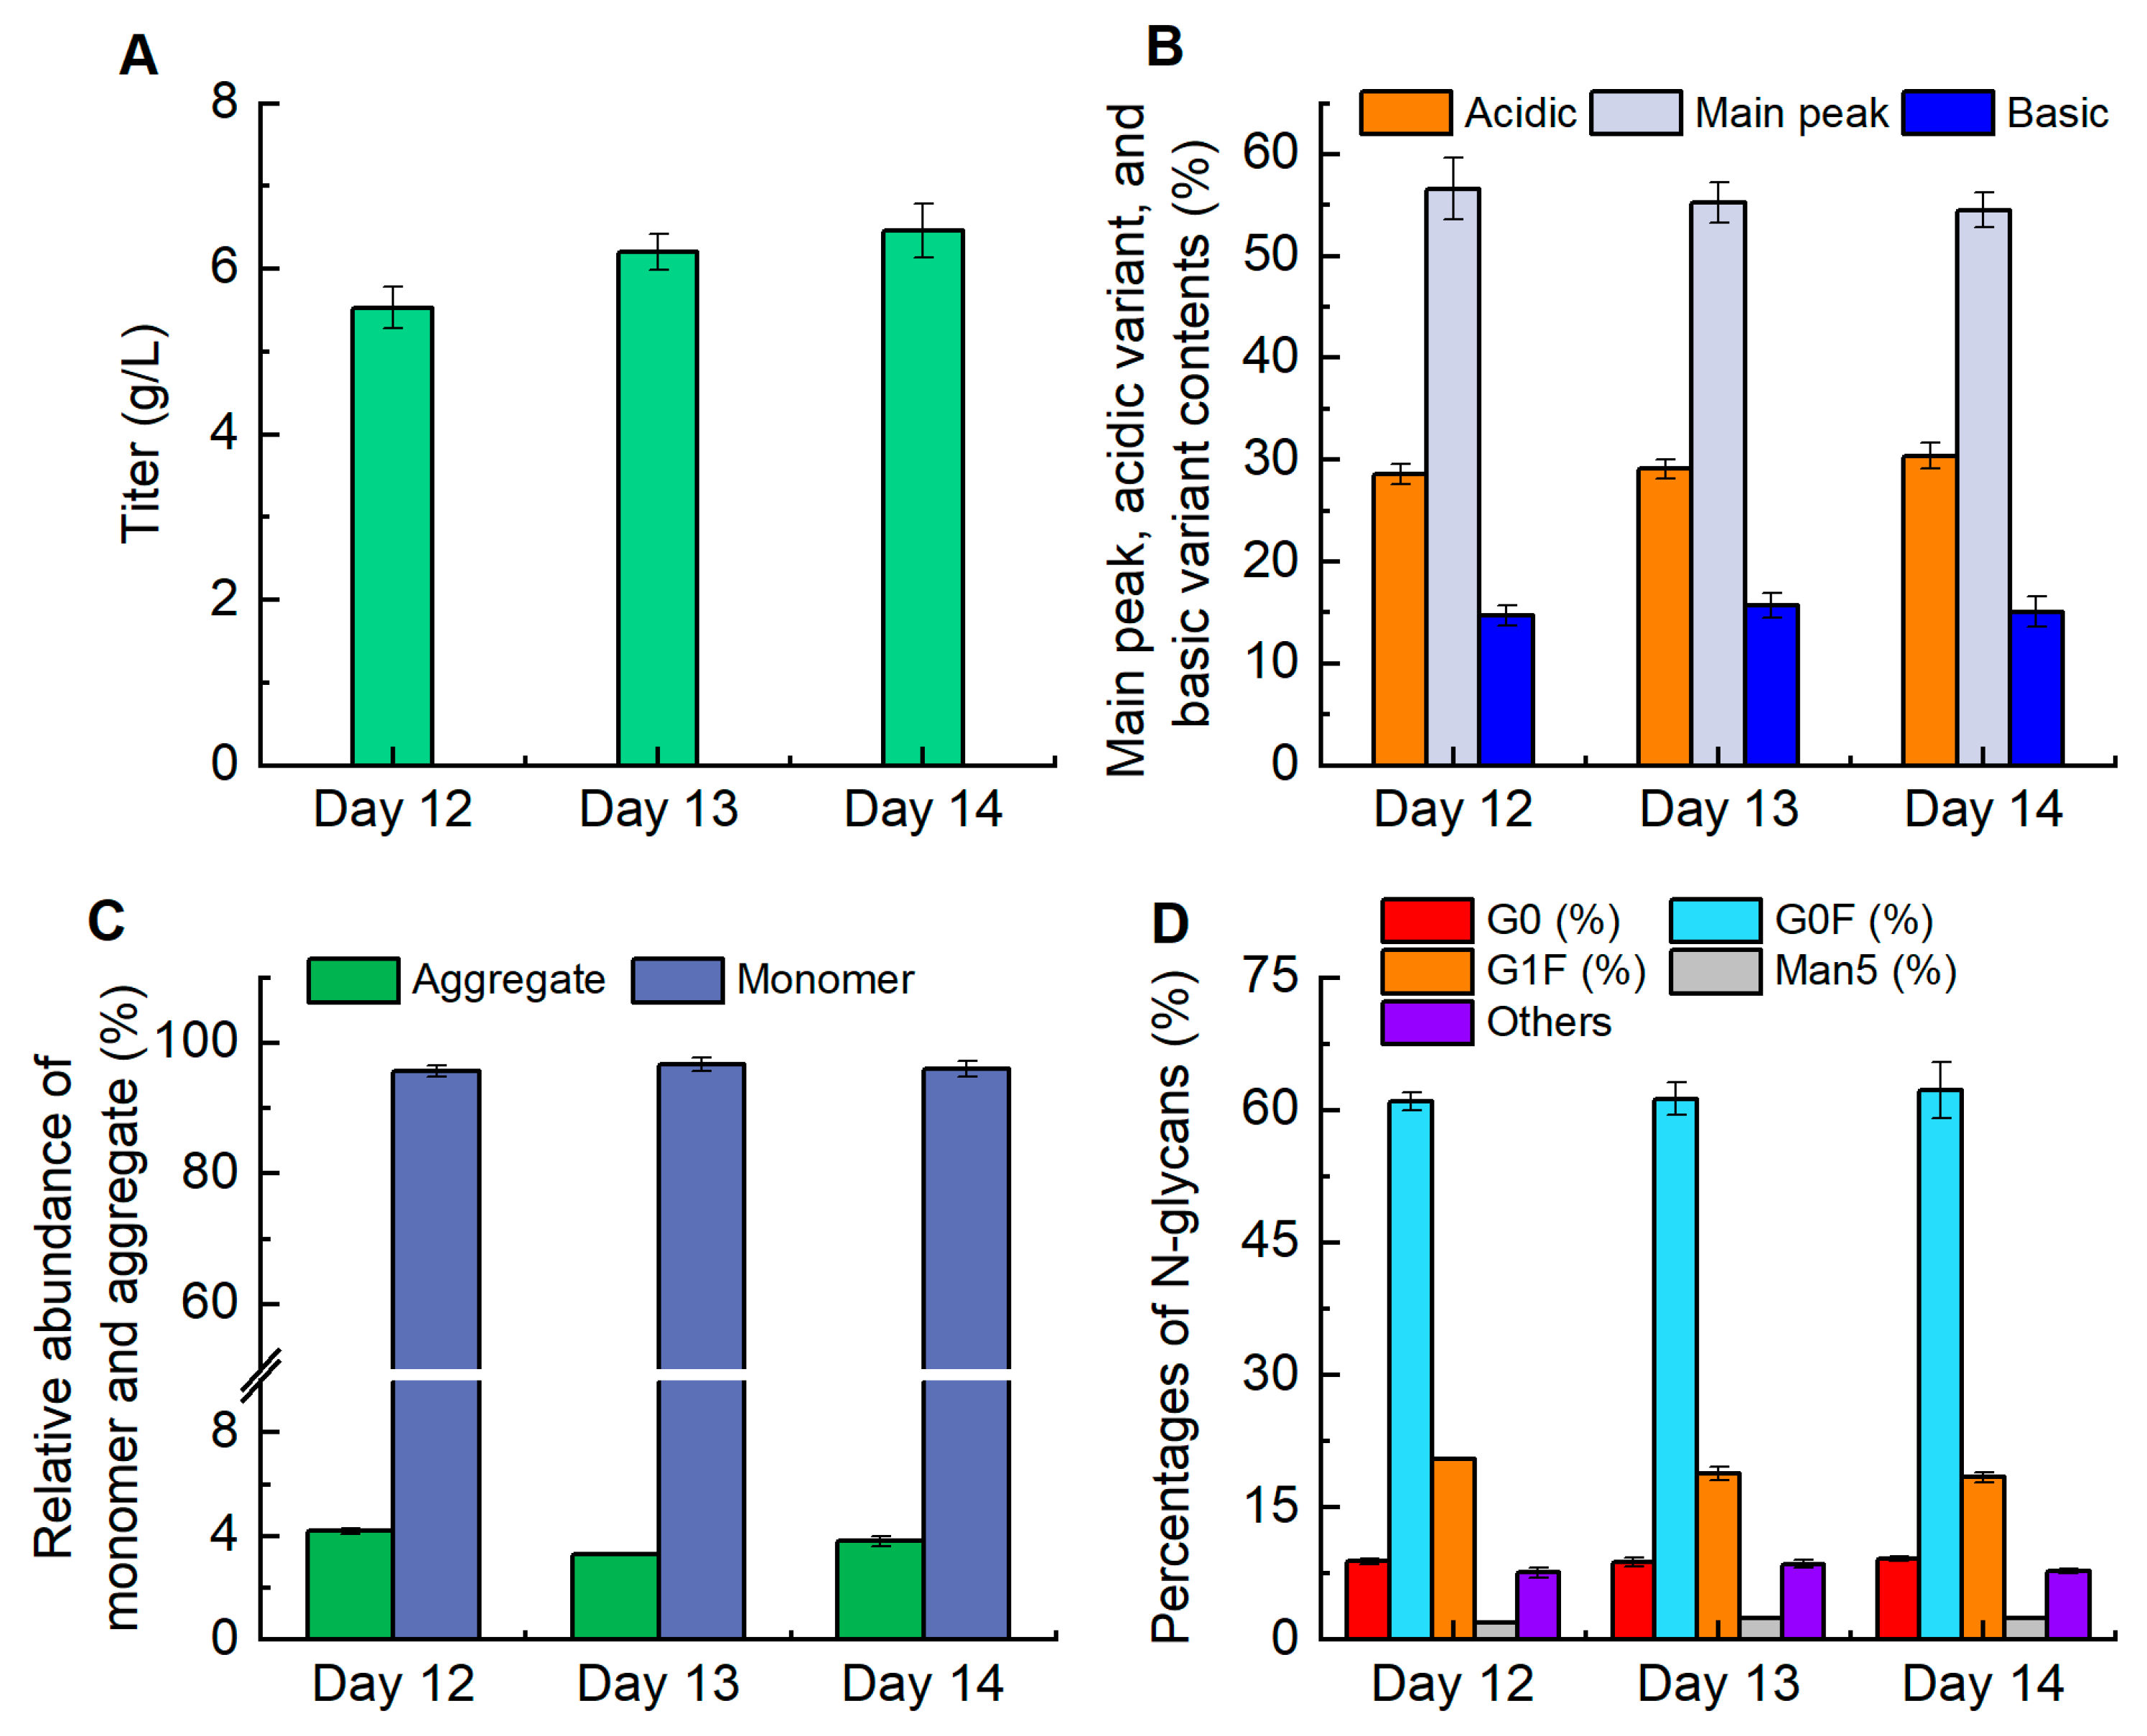
3.1.2. Product Quality Analysis under Different Fed-Batch Cultures

The EA5 titer and product quality on day 14 of the four batches are summarized in Figure 2. As depicted in Figure 2A, the EA5 titer for the two batches of Clone 605 was 6.1 g/L (batch #1) and 5.0 g/L (batch #2). For the two batches of Clone 448, the EA5 titer was 6.1 g/L (batch #3) and 5.4 g/L (batch #4). These results indicate that the pH 7.2 control strategy significantly enhances EA5 production during fed-batch culture for the two clones. It has been reported that the aggregation of recombinant therapeutic antibodies significantly affects product quality, and only 10% of polymers in an antibody may elicit an immune response, potentially leading to adverse outcomes [40,41]. The proportions of aggregates and monomers in the CHO cell fed-batch cultures are illustrated in Figure 2B. Under the high-pH control strategy, the aggregate proportions were 3.4% (Clone 605, batch #1) and 4.2% (Clone 448, batch #3), while they were 3.5% (batch #2) and 4.6% (batch #4) under the low-pH control strategy. Although the aggregate proportions of Clone 605 under the low-pH control strategy were lower compared to Clone 448 (p < 0.05), in the four batches, they were all below 5.0%, indicating that EA5 production in CHO cells can achieve monomer purity of over 95.0% under different pH control strategies (Figure 2B).
Due to the variations in isoelectric point (pI) values and structural differences, alterations in charge can significantly affect the in vitro and in vivo properties of mAbs, potentially affecting the bioactivity and safety of the drug under study [11,42]. Horvath et al. (2010) found that culture pH and temperature influence acidic species and a decrease in temperature could reduce the kinetics of degradation reactions [43]. As illustrated in Figure 2C, the acidic peaks for the two batches of Clone 605 exceeded 30% (31.9–32.8%), while those for the batches of Clone 448 remained below 28.0% (27.6–28.0%, p < 0.05). The basic peak ratios of EA5 for batches #1–#4 were 8.6%, 5.6%, 9.3%, and 8.4%, respectively. Simultaneously, the main peak proportions of EA5 under different control modes were in the range of 58.6–63.7% (Figure 2C). These results suggest that the acidic peak proportion of EA5 produced by Clone 605 is relatively high, which might affect its quality.
Glycosylation primarily refers to the enzymatic process of attaching complex oligosaccharides (i.e., glycans) to proteins. The glycosylation analysis results for the different batches are presented in Figure 2D. There were no significant differences (p > 0.05) observed in G0 (5.7–6.1%) and G0F (60.4–65.1%) among batches #1–#3. The highest proportion of G1F (21.6%) was achieved in Clone 448 under the high-pH control strategy, which was significantly higher than the other three batches (15.2–16.8%, p < 0.05). Previous studies indicate that antibodies bearing elevated levels of N-linked mannose-5 glycan (Man5) demonstrate heightened antibody-dependent cell-mediated cytotoxicity compared to those with a fucosylated complex or hybrid glycans [44]. As shown in Figure 2D, the Man5 proportion of EA5 for batch #3 was only 2.2%, which was significantly lower than the other three batches (3.7–5.3%, p < 0.05). In summary, considering the variations in fed-batch process parameters and the quality analysis under different fed-batch culture conditions in the 3 L bioreactor, Clone 448 and the optimized pH control strategy (pH at 7.2 during the fed-batch stage) were chosen for further investigation.

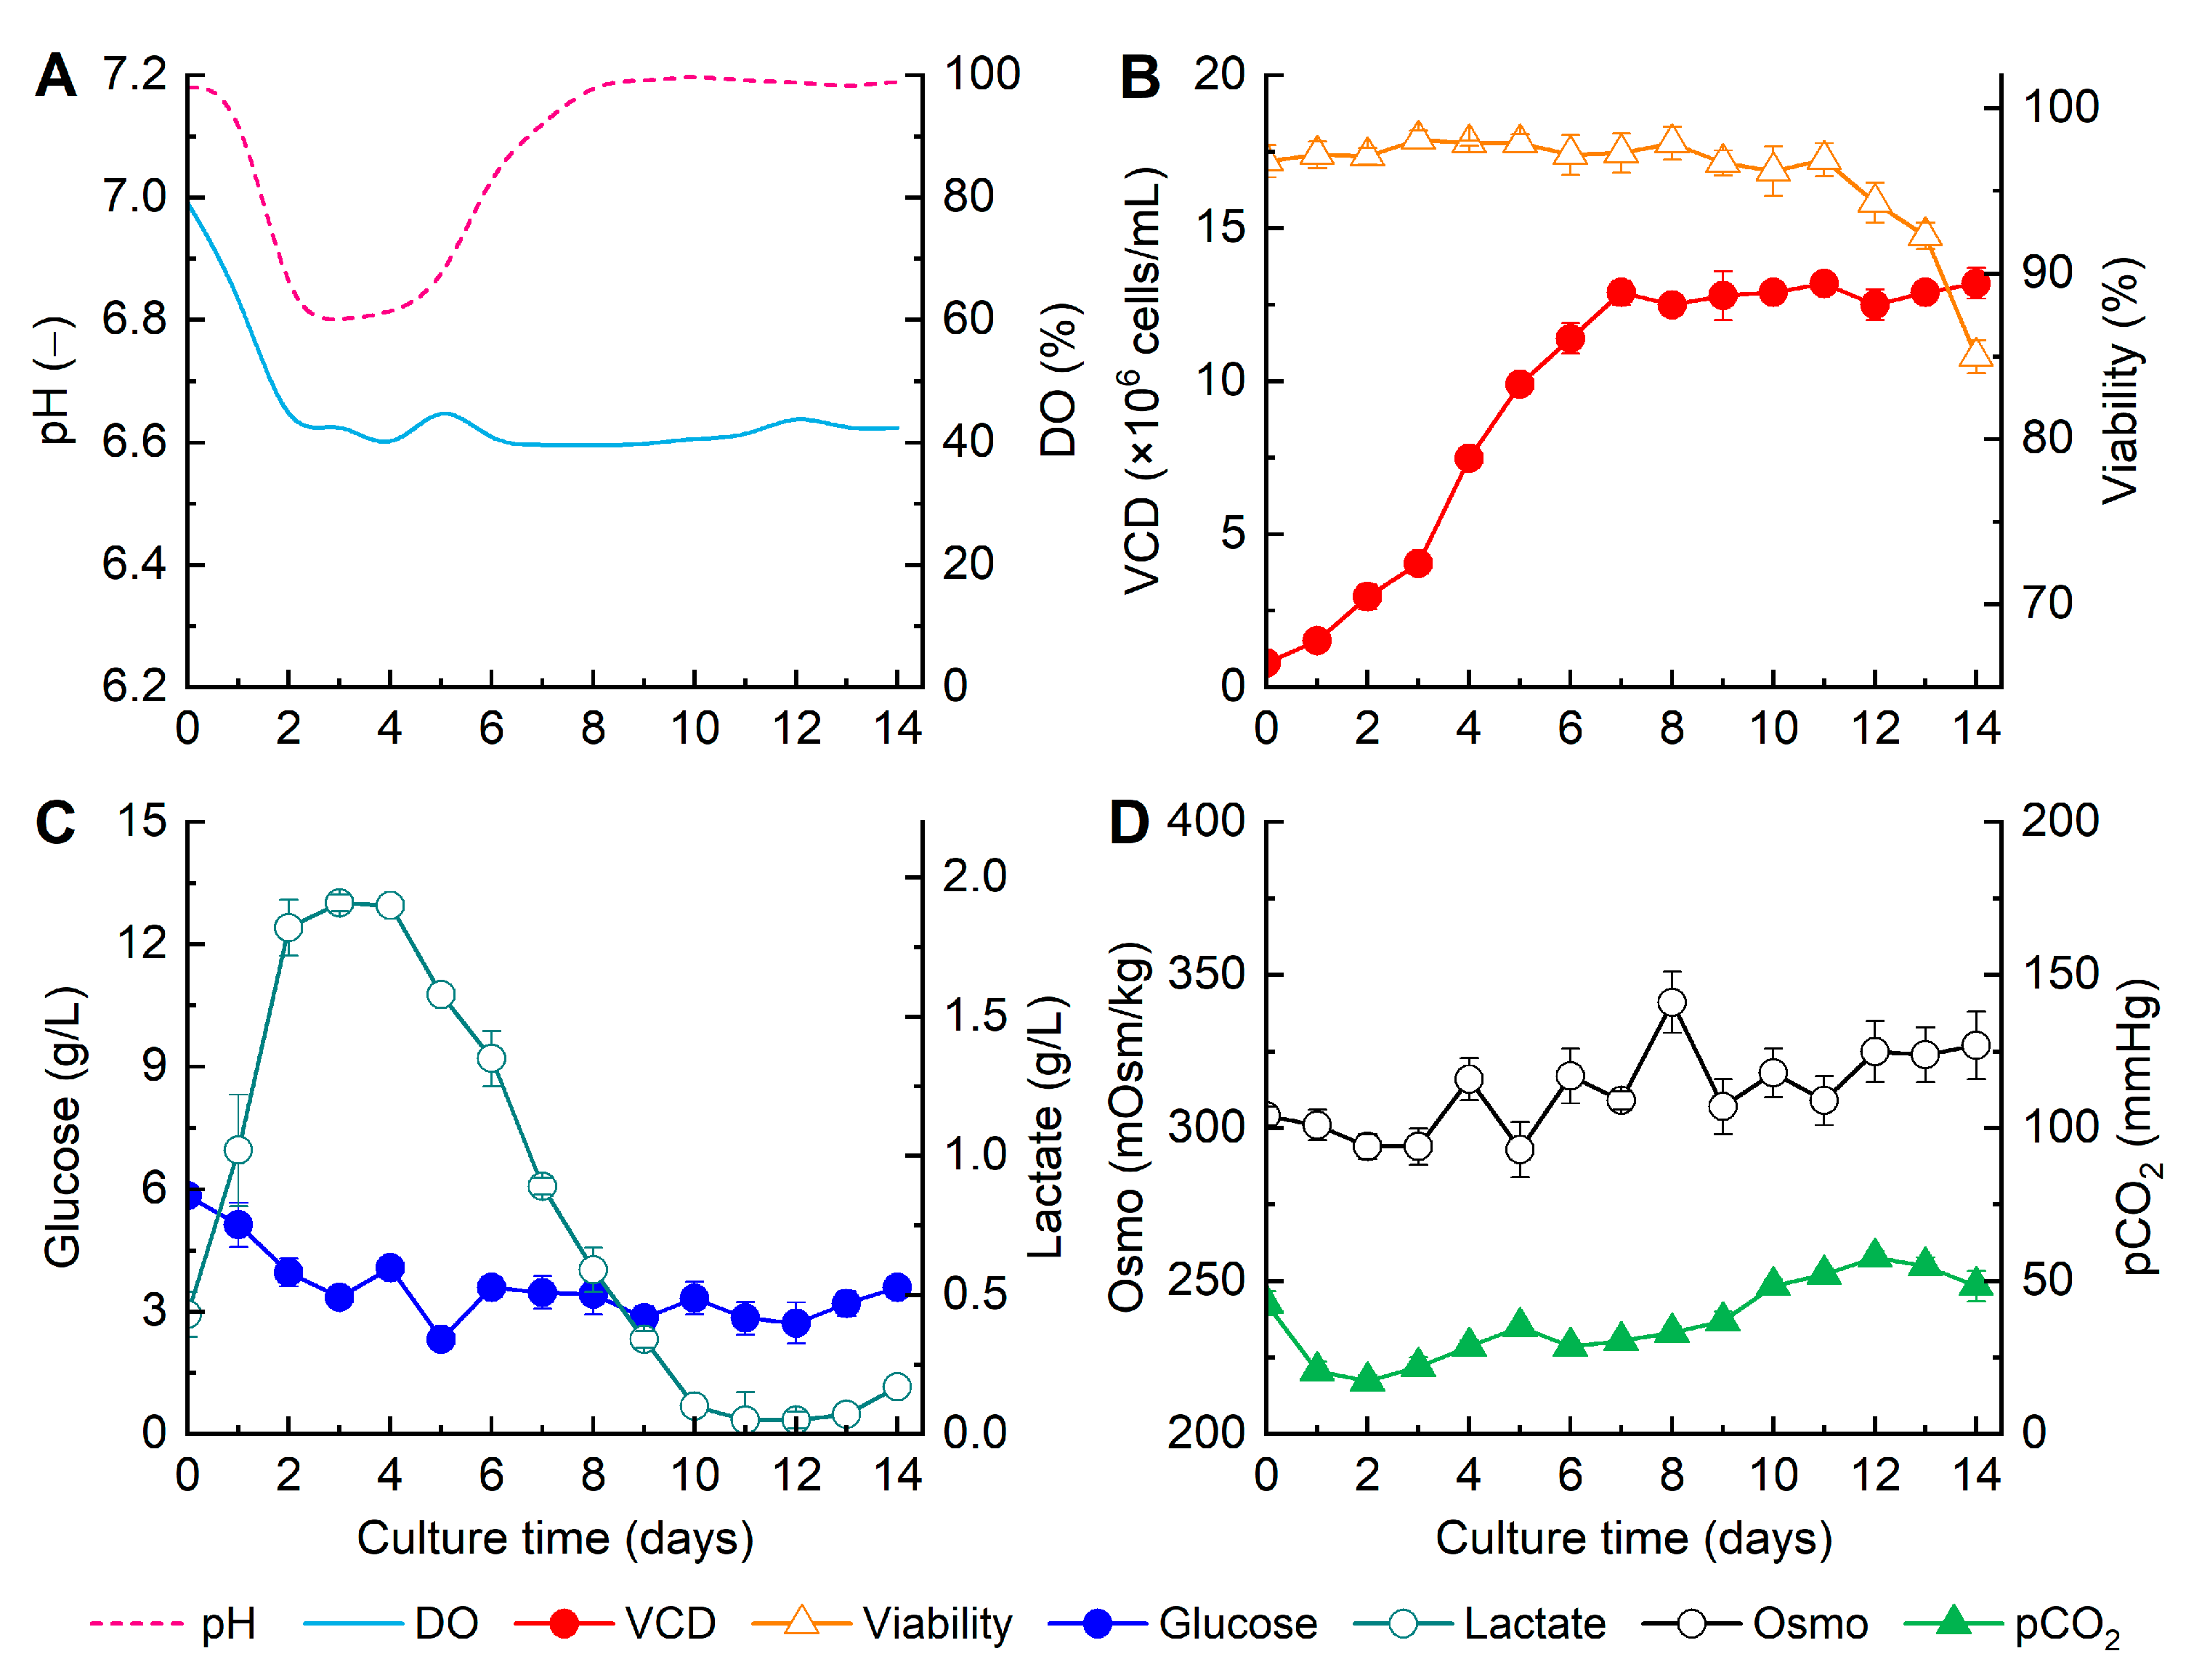
3.2. Effectiveness of Fed-Batch Culture for Stabilizing EA5 Production in the 15 L Bioreactor

The large-scale production of mAbs relies on the product yield and an industrial-scale cell culture [45,46]. Hence, a robust cell culture process is a crucial requirement for large-scale production of mAbs [47]. However, due to the lower VCD, viability, and productivity, the performance of mAb production in large-scale bioreactors should be carefully investigated and optimized. In this study, the proposed pH-controlled fed-batch culture was conducted in a 15 L bioreactor to analyze the product quality of EA5 from Clone 448 (batch #5). As depicted in Figure 3A, the pH gradually decreased from 7.2 to 6.8 in the first three days of the culture process. This decline was primarily attributed to the generation of by-products such as lactate during CHO cellular metabolism. Meanwhile, the increase in cellular metabolic activity also resulted in a decrease in DO (Figure 3A). The decline in pH and DO could reflect that the cells were maintained with a relatively high level of metabolic activity. As shown in Figure 3B, the VCD increased from 0.8 × 10⁶ cells/mL on day 1 to 12.9 × 10⁶ cells/mL on day 7, which was higher than the level obtained in the 3 L bioreactor (9.7 × 10⁶ cells/mL, Figure 1C). On day 14, the VCD reached up to 13.2 × 10⁶ cells/mL. The viability remained at over 96.0% during days 1–11, and it was still maintained at above 85% at the end of the culture period (Figure 3B). The VCD and viability results indicate that the proposed fed-batch process can also sustain high cell numbers and activity in the 15 L bioreactor.
The glucose concentration in the culture broth remained at 3–4 g/L throughout the whole fed-batch stage (Figure 3C). The concentration of lactate decreased rapidly during the fed-batch stage and approached zero after day 10. These results show that the glucose-feeding strategy can prevent the accumulation of lactate in the later stages of CHO cell culture. As shown in Figure 3D, in the 15 L bioreactor, the osmolality and pCO2 were maintained at 300–350 mOsm/kg and 20–60 mmHg, respectively. These parameters did not exhibit inhibitory effects on CHO cellular metabolism (Figure 3B). Therefore, based on the preliminary analysis of the characteristics of process parameters, the optimized pH control strategy shows good adaptability in the 15 L bioreactor to produce EA5.
The EA5 titer, charge variants, aggregate abundance, and glycosylation on days 12, 13, and 14 are shown in Figure 4. From day 12 to day 14, the EA5 titer increased from 5.5 g/L to 6.5 g/L with a productivity of 0.5 g/L/day. The overall EA5 productivity throughout the entire culture stage reached up to 0.46 g/L/day (Figure 4A). The titer was higher than that achieved in the 3 L bioreactor (6.1 g/L, Figure 2A). An analysis of the trend of charge variants (Figure 4B) revealed that there were no significant differences in the acidic peak (28.6–30.4%), main peak (54.5–56.6%), and basic peak (14.7–15.7%) during the period from day 12 to day 14. The results indicate that the proportions of aggregates and monomers on day 12 were 4.2% and 95.7%, respectively. At the end of the CHO cell culture, these parameters changed to 3.8% and 96.0% (Figure 4C). Furthermore, the results shown in Figure 4D demonstrate that the culture could maintain Man5 at a relatively low level of <2.5%. Therefore, it could be concluded that the effectiveness of the optimized pH control strategy was successfully verified in the 15 L bioreactor for high titer production of EA5 with superior quality.

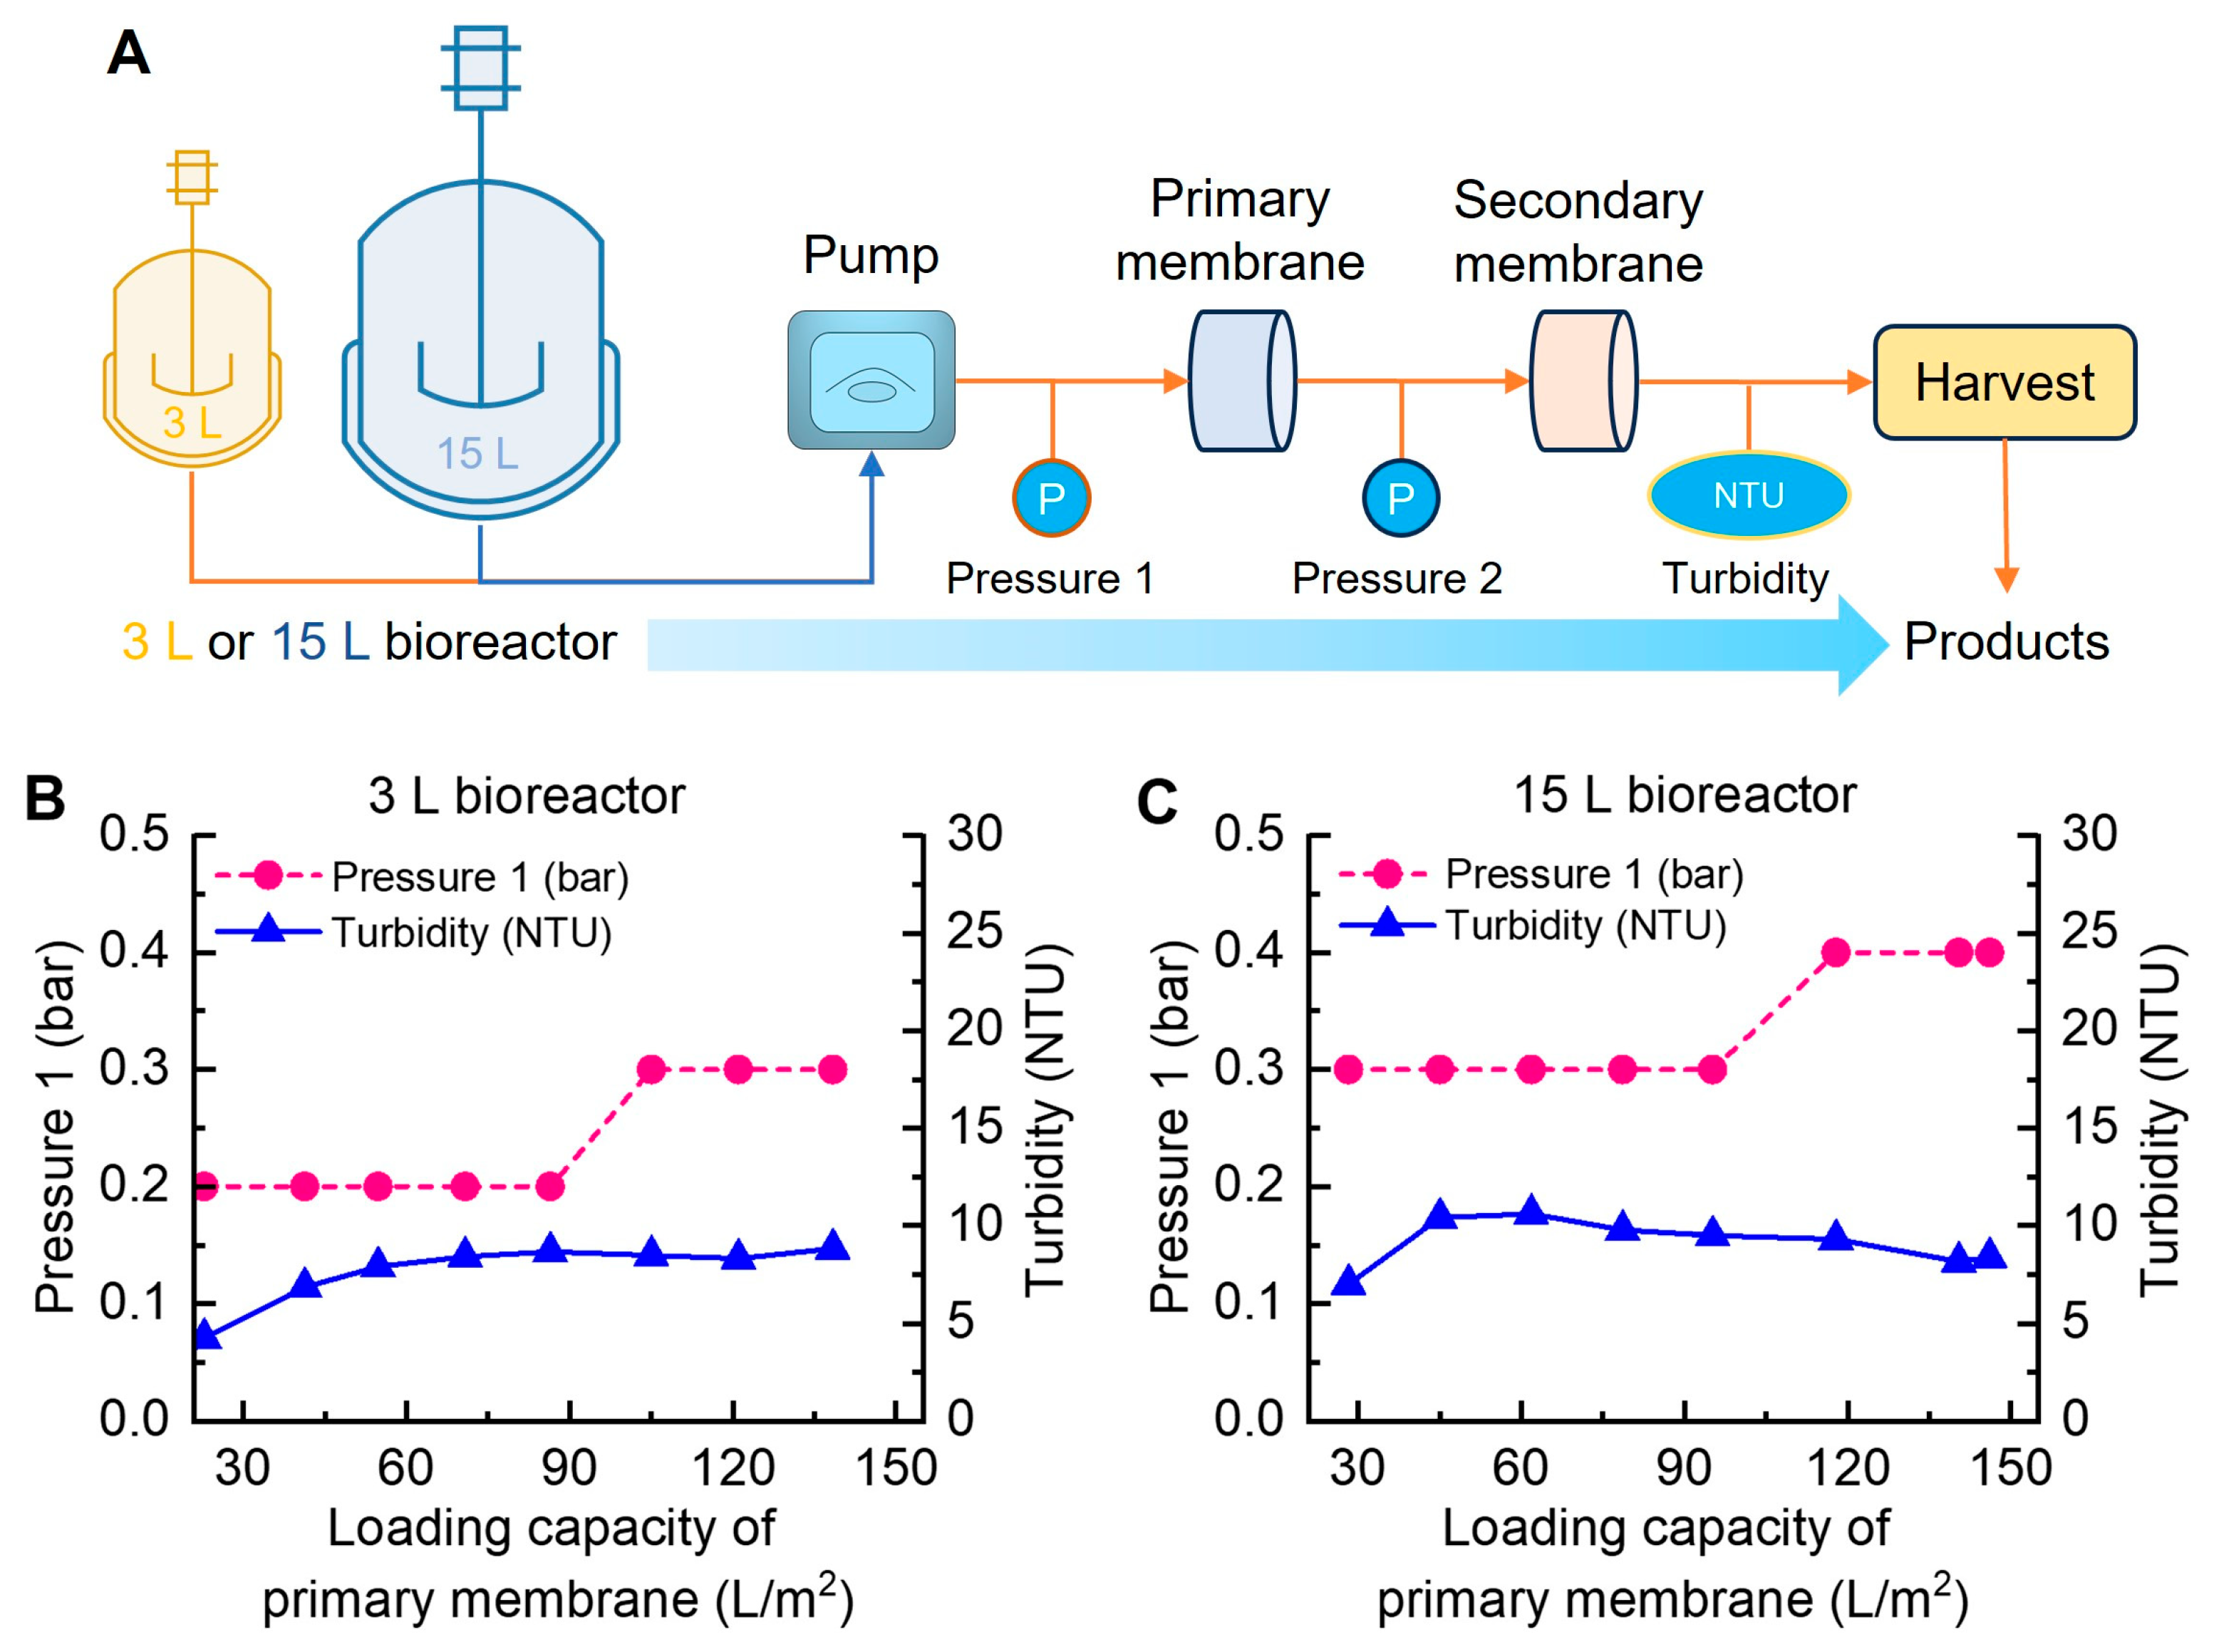
3.3. Performance of Clarification Process Based on CHO Cell Fed-Batch Culture for EA5 Production

In general, a standard mAb biomanufacturing process encompasses cell culture steps for the production of the final product. Afterward, the clarification process is implemented to separate the protein-rich supernatant from the CHO cell culture. Subsequently, a combination of chromatographic and membrane purification operations is employed to attain the desired drug formulation [48,49]. The initial phase in the recovery and purification of mAbs is cell clarification, which has historically received less attention in terms of productivity improvement and economic considerations. To this end, the performance of the clarification process based on CHO cell fed-batch cultures for EA5 production was carefully studied (Figure 5).
Figure 5A shows a schematic diagram of the clarification process for the CHO cell fed-batch cultures. We selected the culture broth of Clone 448 obtained in the 3 L bioreactor (batch #3) and 15 L bioreactor (batch #5) for further study. The purpose of the clarification process is to investigate the filtration capacity of the membrane on the harvested cell culture through small-scale filtration experiments. In filtration experiments, filtrate turbidity, filtration pressure, filtration time, and other parameters are used as indicators to determine the filtration endpoint. Then, the maximum loading capacity is calculated while the actual loading capacity of the process is determined, considering a certain safety factor. When using the culture broth from batch #3 (the 3 L bioreactor) for the clarification experiments, the primary membrane’s final loading capacity was 138.5 L/m2 and the secondary membrane’s loading capacity was 415.4 L/m2. In this case, the overall clarification filtration yield reached a level of 98.6%. In the clarification experiments using the culture broth from batch #5 (the 15 L bioreactor), the final loading capacity of the primary membrane was 141.5 L/m2 and the secondary membrane’s loading was 424.4 L/m2, with an overall clarification filtration yield of 95.5%. In this study, to ensure that the membranes did not experience overload in EA5 production, a safety factor of 1.5 was applied. Thus, in the clarification experiments, the primary membrane’s filtration capacity for batch #3 was set at 92.3 L/m2, and the secondary membrane’s filtration capacity was 276.9 L/m2. Similarly, for the clarification experiments with batch #5, the primary membrane’s filtration capacity was set at 94.3 L/m2, and the secondary membrane’s filtration capacity was 282.9 L/m2.
In summary, this study comprehensively analyzed the effects of different control strategies on EA5 production by CHO cells and product quality under fed-batch culture in both the 3 L and 15 L bioreactors. Furthermore, the validation of the clarification experiments was conducted. The obtained results could be used to effectively avoid risks in the CHO cell culture process for EA5 production and to provide the basic conditions for the process intensification of industrial production through CHO cell fed-batch cultures.

4. Conclusions

In this study, a CHO cell fed-batch culture was optimized for the highly efficient production of an mAb (EA5) that could act against complement C5 for the treatment of PNH. The two CHO cell lines, Clone 605 and Clone 448, were selected for analysis. Different pH control strategies were performed during the fed-batch stage in a 3 L bioreactor. The results indicate that controlling the pH at 7.2 during the fed-batch stage could maintain the VCD at a higher level of ~10 × 106 cells/mL with a viability of above 85%. Under the optimized pH control strategy, compared to Clone 605, Clone 448 exhibited preferable performance in terms of the lower acidic peaks proportion (27.6%) and Man5 ratio in N-glycans (2.2%) with an EA5 titer of 6.1 g/L. Subsequently, the optimized pH-controlled fed-batch culture process was further conducted in a 15 L bioreactor to verify its effectiveness. As a result, a higher E5A titer of 6.5 g/L and a lower Man5 ratio (2.4%) were achieved by day 14, which would be beneficial for large-scale EA5 production. Finally, we also evaluated the clarification process by using the CHO cell culture broth from the 3 L and 15 L bioreactors under the optimized process to facilitate the subsequent EA5 purification process. Overall, our results show the relationship between bioprocess parameters and EA5 production performance, and they could also provide guidance for the effective biomanufacturing process of other mAbs using CHO cells.

Author Contributions

Conceptualization, K.L. and Q.L.; Data curation, K.L.; Formal analysis, K.L.; Investigation, K.L. and H.L.; Methodology, K.L.; Resources, K.L.; Software, K.L. and H.L.; Supervision, Q.L.; Validation, K.L.; Visualization, K.L.; Writing—original draft, K.L.; Writing—review and editing, H.L. and Q.L. All authors have read and agreed to the published version of the manuscript.

Funding

This research received no external funding.

Institutional Review Board Statement

Not applicable.

Informed Consent Statement

Not applicable.

Data Availability Statement

The original contributions presented in the study are included in the article, further inquiries can be directed to the corresponding author.

Conflicts of Interest

The authors declare no conflicts of interest.

References

  1. Kunert, R.; Reinhart, D. Advances in recombinant antibody manufacturing. Appl. Microbiol. Biotechnol. 2016, 100, 3451–3461. [Google Scholar] [CrossRef] [PubMed]
  2. Dahodwala, H.; Lee, K.H. The fickle CHO: A review of the causes, implications, and potential alleviation of the CHO cell line instability problem. Curr. Opin. Biotechnol. 2019, 60, 128–137. [Google Scholar] [CrossRef] [PubMed]
  3. Shepard, H.M.; Phillips, G.L.; Thanos, C.D.; Feldmann, M. Developments in therapy with monoclonal antibodies and related proteins. Clin. Med. 2017, 17, 220–232. [Google Scholar] [CrossRef] [PubMed]
  4. Ecker, D.M.; Jones, S.D.; Levine, H.L. The therapeutic monoclonal antibody market. mAbs 2015, 7, 9–14. [Google Scholar] [CrossRef] [PubMed]
  5. Alejandra, W.-P.; Miriam Irene, J.-P.; Fabio Antonio, G.-S.; Patricia, R.-G.R.; Elizabeth, T.-A.; Aleman-Aguilar, J.P.; Rebeca, G.-V. Production of monoclonal antibodies for therapeutic purposes: A review. Int. Immunopharmacol. 2023, 120, 110376. [Google Scholar] [CrossRef]
  6. Kaplon, H.; Muralidharan, M.; Schneider, Z.; Reichert, J.M. Antibodies to watch in 2020. mAbs 2020, 12, 1703531. [Google Scholar] [CrossRef] [PubMed]
  7. Lu, R.-M.; Hwang, Y.-C.; Liu, I.J.; Lee, C.-C.; Tsai, H.-Z.; Li, H.-J.; Wu, H.-C. Development of therapeutic antibodies for the treatment of diseases. J. Biomed. Sci. 2020, 27, 1. [Google Scholar] [CrossRef] [PubMed]
  8. Kotidis, P.; Donini, R.; Arnsdorf, J.; Hansen, A.H.; Voldborg, B.G.R.; Chiang, A.W.T.; Haslam, S.M.; Betenbaugh, M.; Jimenez del Val, I.; Lewis, N.E.; et al. CHOGlycoNET: Comprehensive glycosylation reaction network for CHO cells. Metab. Eng. 2023, 76, 87–96. [Google Scholar] [CrossRef] [PubMed]
  9. Zhang, J.-H.; Shan, L.-L.; Liang, F.; Du, C.-Y.; Li, J.-J. Strategies and considerations for improving recombinant antibody production and quality in Chinese Hamster Ovary Cells. Front. Bioeng. Biotechnol. 2022, 10, 856049. [Google Scholar] [CrossRef]
  10. Xu, W.-J.; Lin, Y.; Mi, C.-L.; Pang, J.-Y.; Wang, T.-Y. Progress in fed-batch culture for recombinant protein production in CHO cells. Appl. Microbiol. Biotechnol. 2023, 107, 1063–1075. [Google Scholar] [CrossRef]
  11. Ha, T.K.; Kim, D.; Kim, C.L.; Grav, L.M.; Lee, G.M. Factors affecting the quality of therapeutic proteins in recombinant Chinese hamster ovary cell culture. Biotechnol. Adv. 2022, 54, 107831. [Google Scholar] [CrossRef] [PubMed]
  12. Ritacco, F.V.; Wu, Y.; Khetan, A. Cell culture media for recombinant protein expression in Chinese hamster ovary (CHO) cells: History, key components, and optimization strategies. Biotechnol. Prog. 2018, 34, 1407–1426. [Google Scholar] [CrossRef]
  13. Pérez-Rodriguez, S.; Ramírez-Lira, M.d.J.; Trujillo-Roldán, M.A.; Valdez-Cruz, N.A. Nutrient supplementation strategy improves cell concentration and longevity, monoclonal antibody production and lactate metabolism of Chinese hamster ovary cells. Bioengineered 2020, 11, 463–471. [Google Scholar] [CrossRef]
  14. Alhuthali, S.; Kotidis, P.; Kontoravdi, C. Osmolality effects on CHO cell growth, cell volume, antibody productivity and glycosylation. Int. J. Mol. Sci. 2021, 22, 3290. [Google Scholar] [CrossRef]
  15. Yoon, S.K.; Choi, S.L.; Song, J.Y.; Lee, G.M. Effect of culture pH on erythropoietin production by Chinese hamster ovary cells grown in suspension at 32.5 and 37.0 °C. Biotechnol. Bioeng. 2005, 89, 345–356. [Google Scholar] [CrossRef]
  16. Moore, B.; Georgakis, C.; Antoniou, C.; Khattak, S. A two-phase approach optimizing productivity for a mAb-producing CHO cell culture process using dynamic response surface methodology models. Biochem. Eng. J. 2024, 201, 109137. [Google Scholar] [CrossRef]
  17. Liang, K.; Luo, H.; Li, Q. Enhancing and stabilizing monoclonal antibody production by Chinese hamster ovary (CHO) cells with optimized perfusion culture strategies. Front. Bioeng. Biotechnol. 2023, 11, 1112349. [Google Scholar] [CrossRef]
  18. Shirahata, H.; Diab, S.; Sugiyama, H.; Gerogiorgis, D.I. Dynamic modelling, simulation and economic evaluation of two CHO cell-based production modes towards developing biopharmaceutical manufacturing processes. Chem. Eng. Res. Des. 2019, 150, 218–233. [Google Scholar] [CrossRef]
  19. Berrios, J.; Altamirano, C.; Osses, N.; Gonzalez, R. Continuous CHO cell cultures with improved recombinant protein productivity by using mannose as carbon source: Metabolic analysis and scale-up simulation. Chem. Eng. Sci. 2011, 66, 2431–2439. [Google Scholar] [CrossRef]
  20. Tihanyi, B.; Nyitray, L. Recent advances in CHO cell line development for recombinant protein production. Drug Discov. Today Technol. 2020, 38, 25–34. [Google Scholar] [CrossRef]
  21. Maria, S.; Bonneau, L.; Fould, B.; Ferry, G.; Boutin, J.A.; Cabanne, C.; Santarelli, X.; Joucla, G. Perfusion process for CHO cell producing monoclonal antibody: Comparison of methods to determine optimum cell specific perfusion rate. Biochem. Eng. J. 2023, 191, 108779. [Google Scholar] [CrossRef]
  22. Schwarz, H.; Lee, K.; Castan, A.; Chotteau, V. Optimization of medium with perfusion microbioreactors for high density CHO cell cultures at very low renewal rate aided by design of experiments. Biotechnol. Bioeng. 2023, 120, 2523–2541. [Google Scholar] [CrossRef]
  23. Schellenberg, J.; Nagraik, T.; Wohlenberg, O.J.; Ruhl, S.; Bahnemann, J.; Scheper, T.; Solle, D. Stress-induced increase of monoclonal antibody production in CHO cells. Eng. Life Sci. 2022, 22, 427–436. [Google Scholar] [CrossRef]
  24. Luo, Y.; Kurian, V.; Song, L.; Wells, E.A.; Robinson, A.S.; Ogunnaike, B.A. Model-based control of titer and glycosylation in fed-batch mAb production: Modeling and control system development. AlChE J. 2023, 69, e18075. [Google Scholar] [CrossRef]
  25. Mahé, A.; Martiné, A.; Fagète, S.; Girod, P.-A. Exploring the limits of conventional small-scale CHO fed-batch for accelerated on demand monoclonal antibody production. Bioprocess Biosyst. Eng. 2022, 45, 297–307. [Google Scholar] [CrossRef]
  26. Hill, A.; DeZern, A.E.; Kinoshita, T.; Brodsky, R.A. Paroxysmal nocturnal haemoglobinuria. Nat. Rev. Dis. Primers 2017, 3, 17028. [Google Scholar] [CrossRef]
  27. Brodsky, R.A. How I treat paroxysmal nocturnal hemoglobinuria. Blood 2021, 137, 1304–1309. [Google Scholar] [CrossRef]
  28. Zheng, C.; Zhuang, C.; Chen, Y.; Fu, Q.; Qian, H.; Wang, Y.; Qin, J.; Wu, X.; Qi, N. Improved process robustness, product quality and biological efficacy of an anti-CD52 monoclonal antibody upon pH shift in Chinese hamster ovary cell perfusion culture. Process Biochem. 2018, 65, 123–129. [Google Scholar] [CrossRef]
  29. Pan, X.; Dalm, C.; Wijffels, R.H.; Martens, D.E. Metabolic characterization of a CHO cell size increase phase in fed-batch cultures. Appl. Microbiol. Biotechnol. 2017, 101, 8101–8113. [Google Scholar] [CrossRef]
  30. Huang, Y.-M.; Hu, W.; Rustandi, E.; Chang, K.; Yusuf-Makagiansar, H.; Ryll, T. Maximizing productivity of CHO cell-based fed-batch culture using chemically defined media conditions and typical manufacturing equipment. Biotechnol. Prog. 2010, 26, 1400–1410. [Google Scholar] [CrossRef]
  31. Handlogten, M.W.; Lee-O’Brien, A.; Roy, G.; Levitskaya, S.V.; Venkat, R.; Singh, S.; Ahuja, S. Intracellular response to process optimization and impact on productivity and product aggregates for a high-titer CHO cell process. Biotechnol. Bioeng. 2018, 115, 126–138. [Google Scholar] [CrossRef]
  32. van Beers, M.M.C.; Bardor, M. Minimizing immunogenicity of biopharmaceuticals by controlling critical quality attributes of proteins. Biotechnol. J. 2012, 7, 1473–1484. [Google Scholar] [CrossRef]
  33. Brunner, M.; Fricke, J.; Kroll, P.; Herwig, C. Investigation of the interactions of critical scale-up parameters (pH, pO2 and pCO2) on CHO batch performance and critical quality attributes. Bioprocess Biosyst. Eng. 2017, 40, 251–263. [Google Scholar] [CrossRef]
  34. Lee, J.C.; Kim, D.Y.; Oh, D.J.; Chang, H.N. Long-term operation of depth filter perfusion systems (DFPS) for monoclonal antibody production using recombinant CHO cells: Effect of temperature, pH, and dissolved oxygen. Biotechnol. Bioprocess Eng. 2008, 13, 401–409. [Google Scholar] [CrossRef]
  35. Shen, L.; Yan, X.; Nie, L.; Xu, W.; Miao, S.; Wang, H.; Poon, H.F.; Qu, H. Chemometric identification of canonical metabolites linking critical process parameters to monoclonal antibody production during bioprocess development. Chin. J. Chem. Eng. 2019, 27, 1171–1176. [Google Scholar] [CrossRef]
  36. MacDonald, M.A.; Nöbel, M.; Martínez, V.S.; Baker, K.; Shave, E.; Gray, P.P.; Mahler, S.; Munro, T.; Nielsen, L.K.; Marcellin, E. Engineering death resistance in CHO cells for improved perfusion culture. mAbs 2022, 14, 2083465. [Google Scholar] [CrossRef]
  37. Gagnon, M.; Hiller, G.; Luan, Y.-T.; Kittredge, A.; DeFelice, J.; Drapeau, D. High-End pH-controlled delivery of glucose effectively suppresses lactate accumulation in CHO Fed-batch cultures. Biotechnol. Bioeng. 2011, 108, 1328–1337. [Google Scholar] [CrossRef]
  38. Zhu, M.M.; Goyal, A.; Rank, D.L.; Gupta, S.K.; Boom, T.V.; Lee, S.S. Effects of elevated pCO2 and osmolality on growth of CHO cells and production of antibody-fusion protein B1: A case study. Biotechnol. Prog. 2005, 21, 70–77. [Google Scholar] [CrossRef]
  39. Brunner, M.; Doppler, P.; Klein, T.; Herwig, C.; Fricke, J. Elevated pCO2 affects the lactate metabolic shift in CHO cell culture processes. Eng. Life Sci. 2018, 18, 204–214. [Google Scholar] [CrossRef]
  40. Xu, T.; Zhang, J.; Wang, T.; Wang, X. Recombinant antibodies aggregation and overcoming strategies in CHO cells. Appl. Microbiol. Biotechnol. 2022, 106, 3913–3922. [Google Scholar] [CrossRef]
  41. Roberts, C.J. Protein aggregation and its impact on product quality. Curr. Opin. Biotechnol. 2014, 30, 211–217. [Google Scholar] [CrossRef]
  42. Khawli, L.A.; Goswami, S.; Hutchinson, R.; Kwong, Z.W.; Yang, J.; Wang, X.; Yao, Z.; Sreedhara, A.; Cano, T.; Tesar, D.B.; et al. Charge variants in IgG1. mAbs 2010, 2, 613–624. [Google Scholar] [CrossRef]
  43. Horvath, B.; Mun, M.; Laird, M.W. Characterization of a monoclonal antibody cell culture production process using a quality by design approach. Mol. Biotechnol. 2010, 45, 203–206. [Google Scholar] [CrossRef]
  44. Yu, M.; Brown, D.; Reed, C.; Chung, S.; Lutman, J.; Stefanich, E.; Wong, A.; Stephan, J.-P.; Bayer, R. Production, characterization and pharmacokinetic properties of antibodies with N-linked Mannose-5 glycans. mAbs 2012, 4, 475–487. [Google Scholar] [CrossRef]
  45. Gao, Y.; Ray, S.; Dai, S.; Ivanov, A.R.; Abu-Absi, N.R.; Lewis, A.M.; Huang, Z.; Xing, Z.; Borys, M.C.; Li, Z.J.; et al. Combined metabolomics and proteomics reveals hypoxia as a cause of lower productivity on scale-up to a 5000-liter CHO bioprocess. Biotechnol. J. 2016, 11, 1190–1200. [Google Scholar] [CrossRef]
  46. Metze, S.; Ruhl, S.; Greller, G.; Grimm, C.; Scholz, J. Monitoring online biomass with a capacitance sensor during scale-up of industrially relevant CHO cell culture fed-batch processes in single-use bioreactors. Bioprocess Biosyst. Eng. 2020, 43, 193–205. [Google Scholar] [CrossRef]
  47. Neves, C.P.G.; Coffman, J.L.; Farid, S.S. Evaluating end-to-end continuous antibody manufacture with column-free capture alternatives from economic, environmental, and robustness perspectives. Biotechnol. Prog. 2024, 40, e3427. [Google Scholar] [CrossRef]
  48. Rathore, A.S.; Kateja, N.; Agarwal, H. Continuous downstream processing for production of biotech therapeutics. In Continuous Biomanufacturing: Innovative Technologies and Methods; Subramanian, G., Ed.; Wiley: Weinheim, Germany, 2017; pp. 259–288. [Google Scholar]
  49. Banerjee, S.; Jesubalan, N.G.; Nikita, S.; Rathore, A.S. Multi-objective optimization of continuous CHO cell clarification using acoustic wave separation. Sep. Purif. Technol. 2024, 338, 126579. [Google Scholar] [CrossRef]
Figure 1. Changing patterns of pH (A), DO (B), VCD (C), viability (D), glucose concentration (E), lactate concentration (F), osmolality (G), and pCO2 (H) during CHO cell fed-batch culture with different control strategies in a 3 L bioreactor. Each batch was conducted in the 3 L bioreactor in triplicate, and the data are shown as mean ± SD (n = 3).
Fermentation 10 00352 g001
Figure 2. EA5 titers and overall qualities of the CHO cell fed-batch cultures under different control strategies in a 3 L bioreactor (batches #1–#4). (A) EA5 titer; (B) relative abundance of monomers and aggregates; (C) main peak, acidic variant, and basic variant contents; and (D) percentages of N-glycans. The data are shown as mean ± SD (n = 3). Different letters in the column for the same index represent significant differences (p < 0.05) among batches #1–#4.
Fermentation 10 00352 g002
Figure 3. Changing patterns of pH and DO (A), VCD and viability (B), glucose and lactate concentrations (C), and osmolality and pCO2 (D) during CHO cell fed-batch culture in a 15 L bioreactor (batch #5, Clone 448). The culture of batch #5 was conducted in the 15 L bioreactor in triplicate, and the data are shown as mean ± SD (n = 3).
Fermentation 10 00352 g003
Figure 4. EA5 titers and overall qualities of the CHO cell fed-batch culture in a 15 L bioreactor (batch #5, Clone 448). (A) EA5 titer; (B) main peak, acidic variant, and basic variant contents; (C) relative abundance of monomers and aggregates; and (D) percentages of N-glycans. The results shown in (BD) were based on the samples on days 12, 13, and 14. The data are shown as mean ± SD (n = 3).
Fermentation 10 00352 g004
Figure 5. A schematic diagram of the CHO cell clarification process (A); the loading capacity of the primary membrane during the clarification process using CHO cell fed-batch cultures from the 3 L bioreactor (batch #3 (B)); and 15 L bioreactor (batch #5 (C)).
Fermentation 10 00352 g005
Disclaimer/Publisher’s Note: The statements, opinions and data contained in all publications are solely those of the individual author(s) and contributor(s) and not of MDPI and/or the editor(s). MDPI and/or the editor(s) disclaim responsibility for any injury to people or property resulting from any ideas, methods, instructions or products referred to in the content.

