Abstract
The clinical antibiotic gentamicin is a mixture of several difficult-to-separate components, the minor group of which is gentamicin C1a, a precursor for the synthesis of the high-efficacy and low-toxicity antibiotic etimicin. This study aimed to achieve the high production of gentamicin as well as gentamicin C1a. In this study, the influence of organic and inorganic salts on the gentamicin production was screened and label-free proteomics was used to determine the mechanisms responsible for the effects. In 25 L fermentation experiments, the addition of 0.1% CaCl2 and 0.3% sodium citrate increased gentamicin titers by 11.5% (2398 μg/mL vs. 2150 μg/mL), while the C1a ratio increased from 38% to 42%. The results showed that CaCl2 downregulated the synthesis and metabolism of the tetrapyrrole pathway and the GenK protein (0.08-fold) in the gentamicin synthesis pathway, whereas sodium citrate downregulated key proteins in the glycosylation pathway and tricarboxylic acid pathway. Thus, CaCl2 caused changes in methylation during the synthesis of gentamicin, increasing the proportion of gentamicin C1a. In contrast, sodium citrate inhibited primary metabolism to promote the production of secondary metabolites of gentamicin. This study provided a basis for the co-production of gentamicin C1a mono-component and gentamicin multicomponent.
1. Introduction
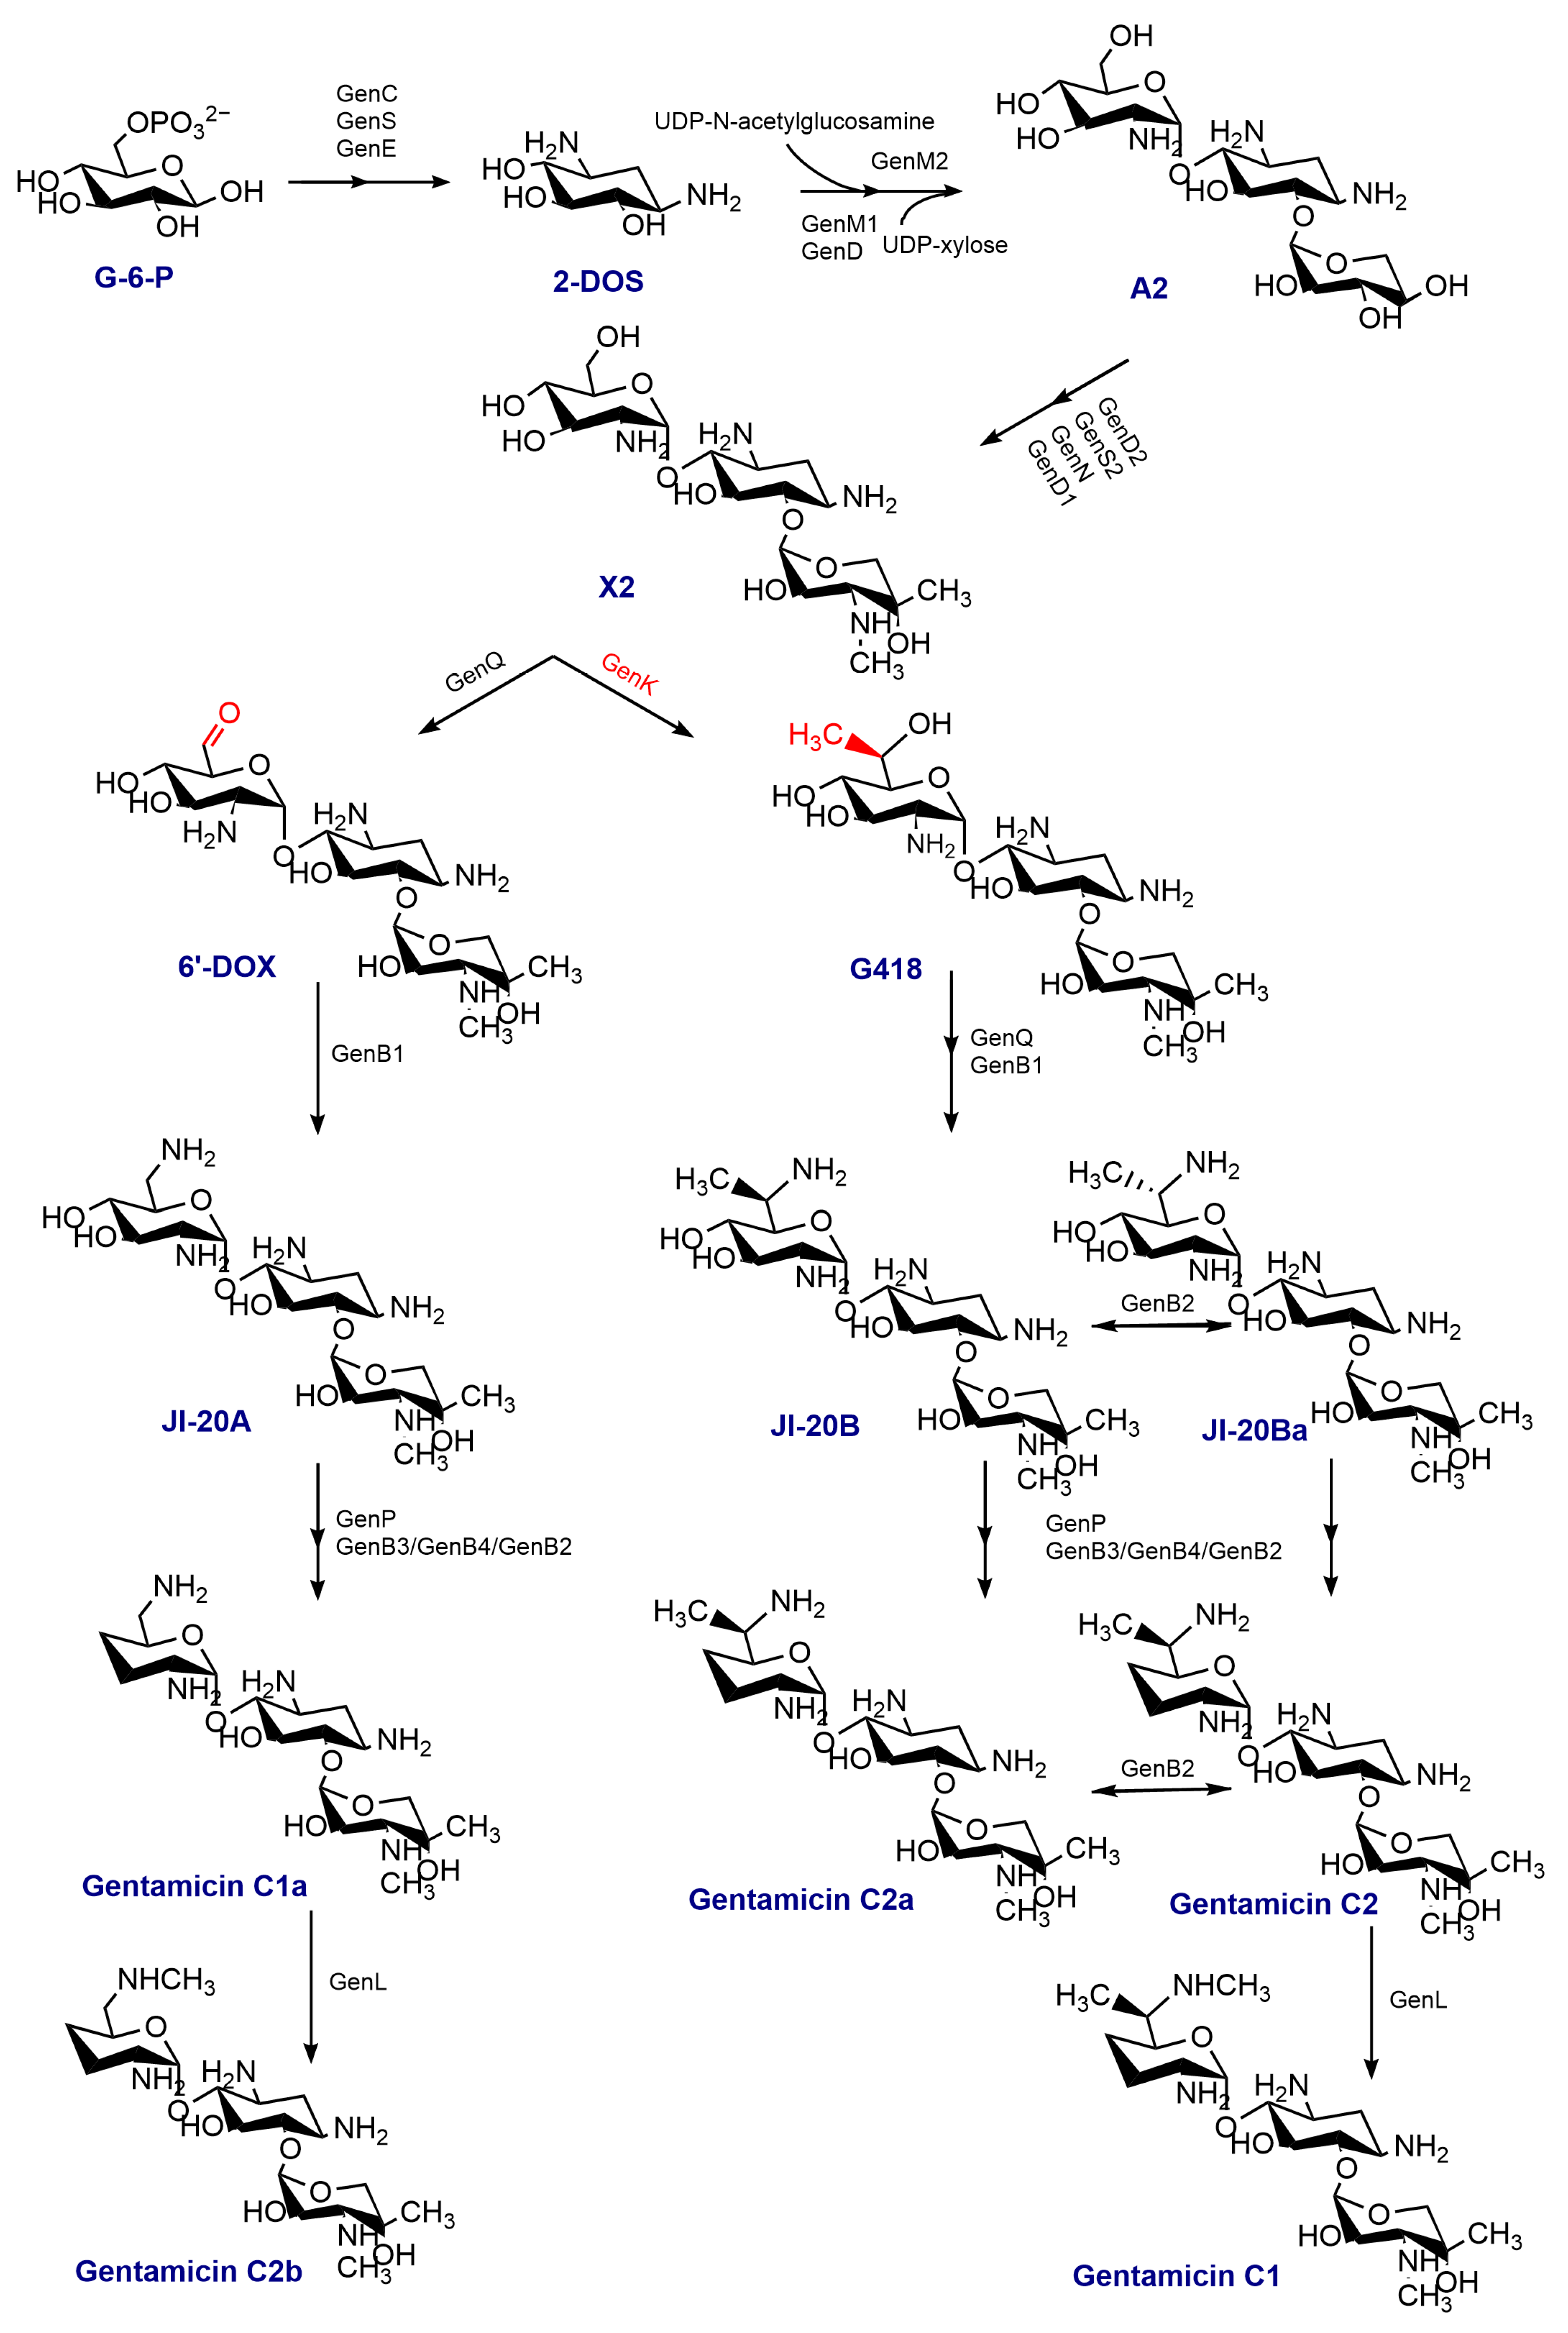
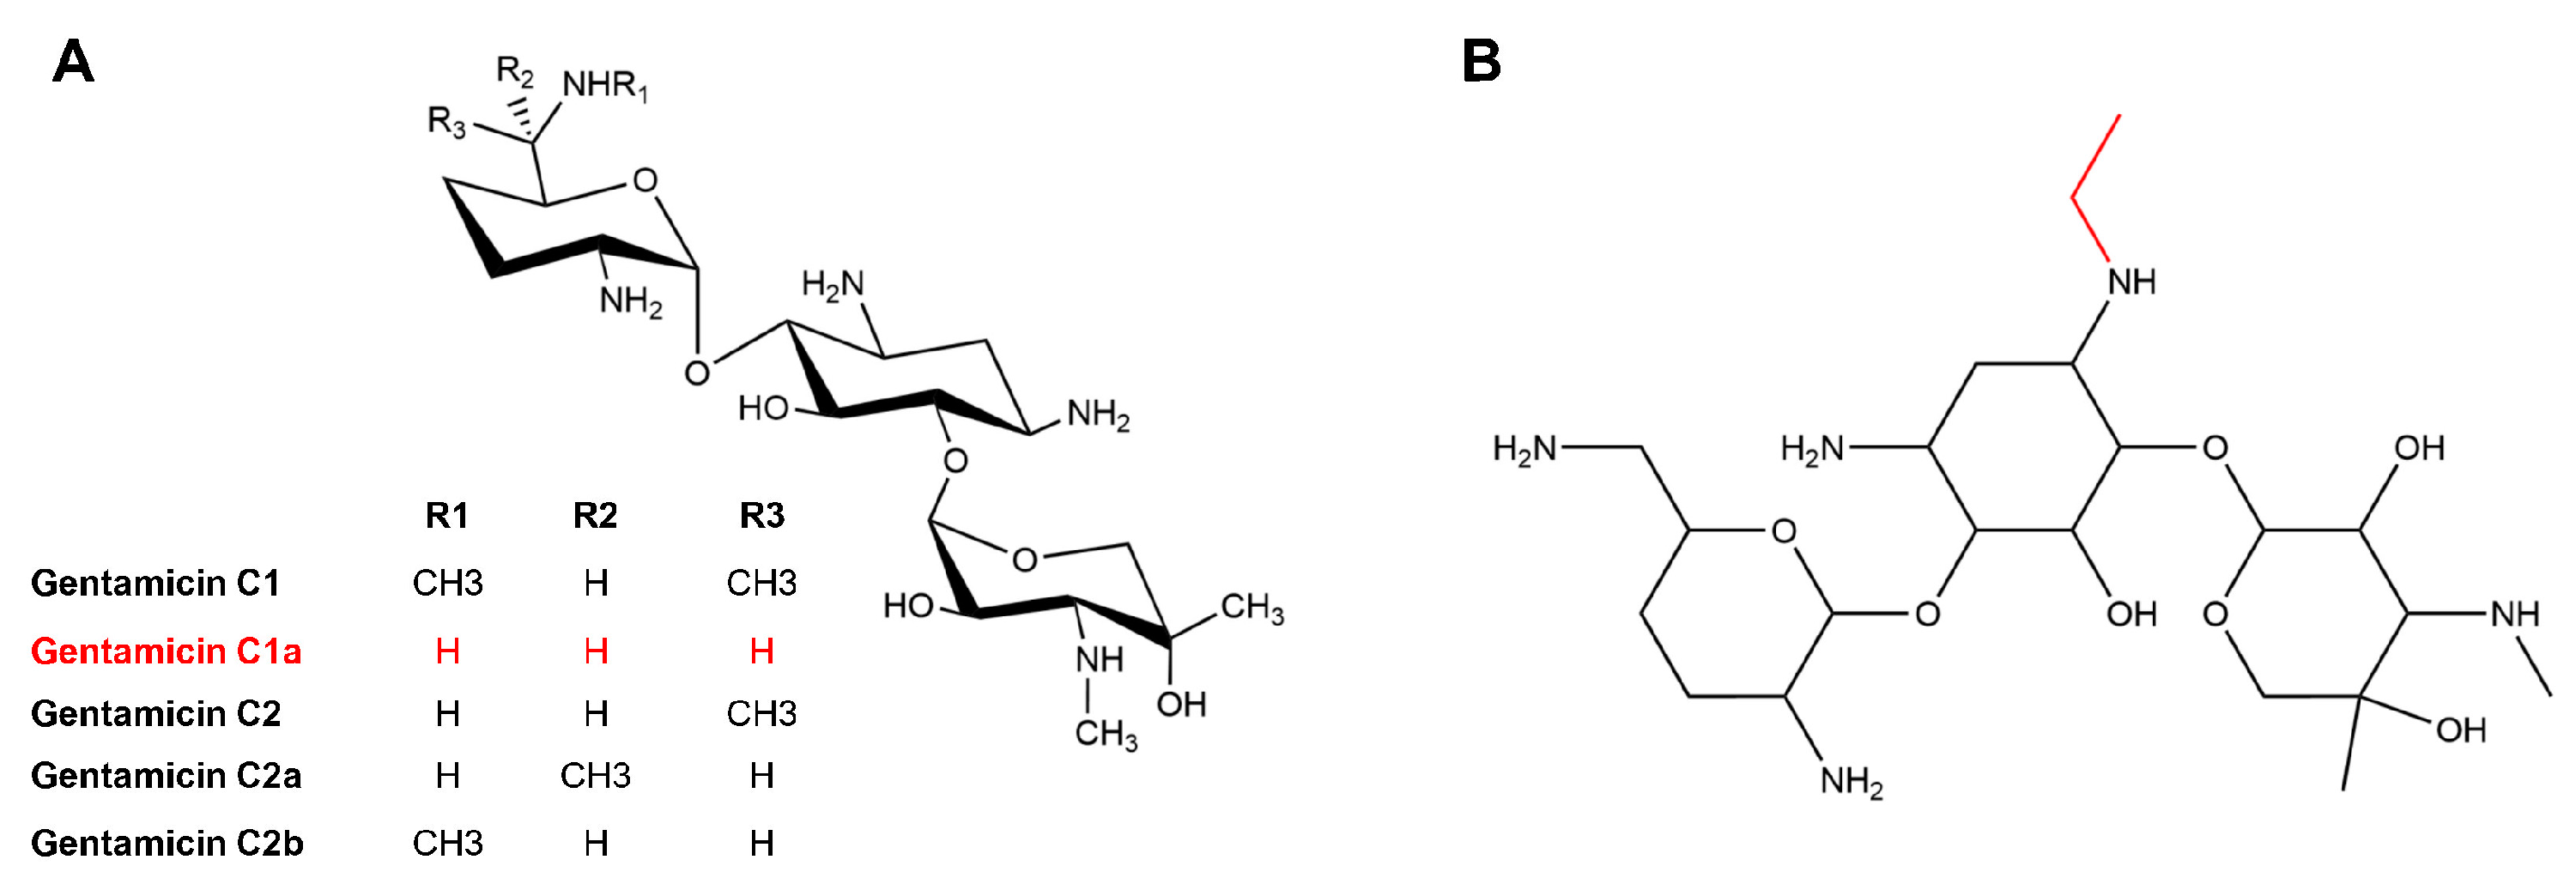
Gentamicin, an aminoglycoside antibiotic, holds significant clinical significance in the field of medicine [1,2]. This antibiotic binds to the aminoacyl site on 16 S rRNA of the 30 S subunit in the bacterial ribosome, disrupting protein synthesis and inhibiting bacteria [3]. Moreover, gentamicin exhibits potential in treating various genetic disorders associated with mutations in the amino acid coding sequence or premature termination codons (PTCs) [4]. Gentamicin is a multicomponent antimicrobial drug produced by Micromonospora echinospora. It contains a 2-deoxystreptamine (2-DOS) ring on C4 and C6, which is connected through glycosidic bonds to garosamine and purpurosamine. The majority of the enzymes used in the synthesis of gentamicin have been extensively elucidated [5,6,7,8,9,10,11,12,13]. The process of synthesizing gentamicin begins with D-glucose-phosphate, which is converted into 2-DOS by the isomerase GenC, the aminotransferase GenS1, and the dehydrogenase GenE. This product is then utilized as a substrate for loading one molecule each of UDP-N-acetylglucosamine and UDP-xylose at C4 and C6, respectively, with the help of the glycosyltransferases GenM1 and GenM2. As a result, the initial trisaccharide-like intermediate, gentamicin A2, is formed. In a series of enzyme-catalyzed reactions, gentamicin A2 is converted to gentamicin X2, which is vital in the following set of parallel pathways. The C6′ methyltransferase, GenK, catalyzes the conversion of gentamicin X2 to G418 [14]. Gentamicin X2 and G418 undergo a series of enzymatic reactions, resulting in their conversion to gentamicin C1a, gentamicin C2a, and gentamicin C2. The N6′ methyltransferase, GenL, additionally catalyzes the conversion of gentamicin C1a and gentamicin C2 into gentamicin C2b and gentamicin C1 [11]. The detailed scheme of gentamicin biosynthesis is given in Figure 1. It is composed mainly of gentamicin C1, gentamicin C1a, gentamicin C2 and C2a, as well as trace amounts of intermediates or byproducts. Due to the difficulty in isolating major and minor components, the gentamicin currently in use is a mixture whose primary ingredient is the gentamicin C fraction, comprising gentamicin C1, C2, C2a, C1a, and C2b (Figure 2).
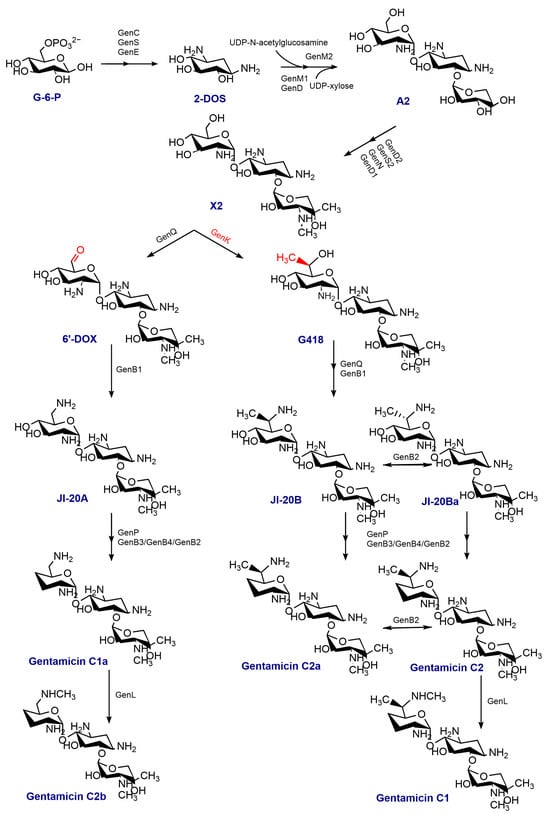
Figure 1.
The biosynthetic pathway of gentamicin; 2-DOS: 2-deoxystreptamine; A2: gentamicin A2; 6′-DOX: 6′-dehydro-6′-oxo-gentamicin X2.
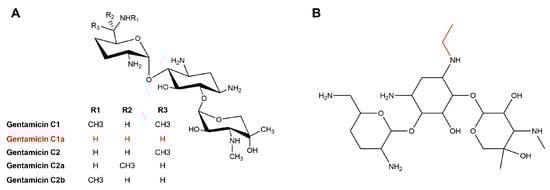
Figure 2.
Structure of gentamicin C complex (A) and etimicin (B).
However, side effects such as ototoxicity and nephrotoxicity, common to aminoglycoside antibiotics, have limited the use of gentamicin [15]. A new broad-spectrum antibiotic, etimicin, which effectively fights against most Gram-positive and Gram-negative bacteria, can remedy these issues [16,17]. Etimicin is an aminoglycoside antibacterial with gentamicin C1a as its “mother nucleus”, i.e., an ethyl group is introduced at the N1 position of gentamicin C1a (Figure 2). It is the first antimicrobial drug with independent intellectual property rights in China and was introduced to the Chinese market in 1999. It is widely used in China due to its high antimicrobial activity, broad antimicrobial spectrum, and low incidence of side effects [18]. The industrial production of etimicin requires a significant quantity of high-purity gentamicin C1a. As a result, many researchers have employed genetic engineering techniques to develop strains that produce high yields of single-component C1a [6,19,20,21].
In addition to meeting the high clinical demand for gentamicin and etimicin, the environmental pollution caused by drug residue emissions in antimicrobial drugs’ production is a major challenge. Process innovation is necessary to improve production levels and ensure sustainable development. Low-cost direct fermentation can be used to produce both single-component (C1a) and multicomponent gentamicin simultaneously, achieving the goals of improving quality, value, cost reduction, and emission reduction [22]. In a previous study, it was found that changes in medium components, such as carbon source, nitrogen source, inorganic salt, organic salt, amino acid, vitamin, nucleoside, etc., significantly influenced the titer of fermentation products. Specifically, the Co2+ ion was extensively studied in gentamicin synthesis as it not only impacted the gentamicin yield but also influenced the ratio of each component [23,24]. Additionally, the addition of inorganic salt MgSO4 helped release gentamicin bound to the cell wall, thereby reducing feedback inhibition and increasing the gentamicin yield [25]. Therefore, we aimed to determine if it is possible to screen suitable inorganic and organic salts to enhance the gentamicin yield while also increasing the ratio of C1a components.
In this study, we aimed to screen organic and inorganic salts to increase gentamicin production and the C1a ratio in M. echinospora. Proteomics analysis was used to analyze the effects of these salts on gentamicin synthesis. The results showed that calcium chloride and sodium citrate were effective in increasing gentamicin production and the C1a ratio. This suggests that these salts could regulate gentamicin synthesis. These findings provide a basis for the co-production of gentamicin C1a and gentamicin multicomponent and can be applied to the co-production of other similar antimicrobial drugs.
2. Materials and Methods
2.1. Bacterial Strains and Culture Conditions
The gentamicin-producing strain conserved by our laboratory, Micromonospora echinospora SIPI-GM.01, was used in this study. The slant medium consisted of (g/100 mL): corn starch, 1.0; KNO3, 0.1; K2HPO3, 0.03; MgSO4·7H2O, 0.05; NaCl, 0.05; L-asparagine, 0.002; CaCO3, 0.1; bran, 1.8; and agar, 1.4. The pH of the media was adjusted to 7.5. The seed medium consisted of (g/100 mL): soluble starch, 1.0; corn flour, 2.0; thermally extracted soybean powder, 2.0; glucose, 0.1; KNO3, 0.05; and CaCO3, 100 mL/750 mL. The pH of the media was adjusted to 7.0. The medium for fermentation in flasks consisted of (g/100 mL): glucose, 0.5; corn starch, 2.0; corn flour, 3.5; KNO3, 0.05; cold-pressed soybean powder, 2.6; tryptone, 1.0; CaCO3, 0.7; CoCl2, 0.002; and (NH4)2SO4, 0.1. The pH of the media was adjusted to 8.0. The medium for fed-batch fermentation in fermenters consisted of (g/100 mL): corn starch, 2.5; corn flour, 2.0; cold-pressed soybean powder, 2.0; tryptone, 1.0; (NH4)2SO4, 0.08; KNO3, 0.017; CaCO3, 0.9; CoCl2, 0.002; amylase, 0.001; and antifoam, 0.05. The pH of the media was adjusted to 8.0. On this basis, the carbon and nitrogen source concentrations in the diluted medium were reduced to one-third of those in the undiluted medium.
Bacterial suspensions were inoculated from the glycerol tube onto slant agar and incubated for 7–8 days at 37 °C. One loop of the cells from a slant was inoculated into a baffled flask with 100 mL seed medium and was cultivated at 37 °C, 240 rpm for 48 h. Then, 3 mL of the seed culture was transferred to a 100 mL flask with 35 mL fermentation medium at 240 rpm and 37 °C for 120 h. A seed culture of 70 mL medium was inoculated into a 25 L seed fermenter (Shanghai Auzone Bio-engineering equipment Co., Ltd., Shanghai, China) with 15 L working volume at 37 °C for 48 h, with the airflow rate and pressure set at 1 L/min, 0.05 MPa, respectively, after which 5 L seed culture was transferred to a 25 L fermenter with a 15 L working volume for the fed-batch fermentation at 37 °C for 110~120 h. Agitation speed was adjusted according to culture time (0~2 h, 250 rpm; 2~4 h, 300 rpm; 4~6 h, 350 rpm; 6~120 h, 400 rpm). Aeration was also controlled based on culture time (0~6 h, 0.6 L/min; 6~120 h, 1 L/min). The pressure was set at 0.03 MPa, and the dissolved oxygen concentration was maintained above 30%. In the fermentation process, the total sugar content and amino nitrogen content were controlled to be greater than 5 mg/mL and 0.2 mg/mL, respectively, by feeding the diluted medium in batches. The fermentation experiments were performed in triplicate.
2.2. Determination of Sugar, Amino Nitrogen, Germ Concentration, and Fermentation Potency
The reducing sugar was determined by Fehling’s reagent method [26] and the amino nitrogen was measured by using the formaldehyde oxidation method [27].
The fermentation broth with a volume of 10 mL was centrifuged at 7000 rpm for 15 min and then the volume of supernatant was measured. The germ concentration (%) can be calculated by using the following equation:
where Cg is the germ concentration (%), Vt is the total volume of fermentation broth (mL), and Vs is the volume of supernatant (mL). The fermentation broth was acidized to 2.0 by H2SO4 and kept still for 4 h, after which the broth was centrifuged (12,000 rpm × 5 min) at 12,000 rpm for 5 min and then the supernatant was collected.
Cg = (Vt − Vs)/Vt × 100
High-performance liquid chromatography (Agilent Technologies Co., Ltd., Santa Clara, CA, USA) with NanoMicro Unisil 5-120 C18 column (250 mm × 4.6 mm, 5 μm) was available for the measurement of gentamicin potency. The mobile phase at a flow rate of 0.8 mL/min was a 0.2 mol/L trifluoroacetic acid solution and methanol (96:4). The column temperature and injection volume were 55 °C and 20 μL, respectively. The evaporative light scattering detector (ELSD) was operated in cryogenic shunt mode with a drift tube temperature of 55 °C, a carrier gas flow rate of 2.5 L/min, a carrier gas of nitrogen, and a carrier gas pressure of 0.4 MPa. The potency (mg/L) can be calculated based on gentamicin content from the HPLC assay using the following equation:
where U is the potency of gentamicin in the test sample (mg/L), Us is the potency of gentamicin in the reference standard (mg/L), St is the peak area of gentamicin in the test sample, and Ss is the peak area of gentamicin in the reference standard.
U = (Us × St)/Ss
2.3. Label-Free Quantitative Proteomics
2.3.1. Protein Extraction
The M. echinospora samples were obtained from the fermentation culture after 96 h and rinsed two times with phosphate-buffered saline (PBS) solution. To disrupt the cells, protein lysate (8 mol urea with protease inhibitors) was applied on ice for 30 min with vortexing for 5–10 s every 5 min. The resulting mixture was centrifuged at 9342 rpm for 30 min at 4 °C, and the supernatant was collected. The protein concentration was determined using the BCA Assay Kit (Beyotime, Shanghai, China).
2.3.2. Protein Digestion and Desalination
A total of 100 μg of protein from each sample was mixed with lysate and 100 mM triethylammonium bicarbonate buffer (TEAB) was added. This mixture was then exposed to tris (2-carboxyethyl)phosphine with a concentration of 10 mM for 60 min at 37 °C. To the samples, iodoacetamide (40 mM) was added and kept in storage for 40 min at room temperature under light protection. Each sample was treated with approximately six-fold of pre-cooled acetone, which was then allowed to precipitate for 4 h at a temperature of −20 °C. Subsequently, the samples were centrifuged at 8528 rpm for 20 min, and the precipitate was removed. The pellet was then completely dissolved using 100 µL of 100 mM triethylammonium bicarbonate buffer. The proteins were digested overnight at 37 °C using trypsin (1:50 w/w, Promega Biotech Co., Ltd., Beijing, China). After trypsin digestion, peptides were extracted using a vacuum pump and re-solubilized with 0.1% trifluoroacetic acid (TFA). The peptides were purified by HLB desalting method and dried in a vacuum concentrator. Subsequently, the quantification of peptide samples was carried out with the Peptide Quantification Kit (Thermo Fisher Scientific, Waltham, MA, USA).
2.3.3. LC-MS/MS Analysis
The peptide samples were dissolved in solvent A, which was composed of 2% acetonitrile with 0.1% formic acid, until reaching a concentration of 0.1 µg/mL. An EASY-nLC 1000 system (Thermo Fisher Scientific, Waltham, MA, USA) with a timsTOF Pro 2 mass spectrometer (Bruker, Karlsruhe, Germany) via a nanoelectrospray ion source was used for analysis. The C18 column (0.75 × 25 cm, Ionopticks, Aurora, CO, USA), with a mobile phase consisting of solvent A and solvent B (B: 80% acetonitrile containing 0.1% formic acid), was utilized, at a flow rate of 300 nL/min and 60 min LC run. MS spectra (m/z 100–1700) were acquired using a timsTOF Pro 2 mass spectrometer, operating at a resolution of 70,000. Data acquisition mode: The study employed the PASEF (parallel accumulated serial fragmentation) mode for acquiring mass spectra. A single first-stage mass spectrum is acquired, followed by 10 PASEFs to collect mothers, with a cycle window of 1.17 s. Technical abbreviations are explained upon first use. For a two-stage spectrum with a charge between 0 and 5, the dynamic exclusion time of the tandem mass spectrometry scan is set to 24 s to avoid repetitive scans of mothers.
2.3.4. Bioinformatics Analysis
Maxquant Software (Version 2.0.3.1) against the M. echinospora. database available in UniProt was used for data analysis. The precursor mass tolerance was configured to be within 10 ppm. Trypsin was employed for the cleaving enzyme allowing for two missed cleavage sites. Protein annotations were performed using the protein’s gene ontology (GO, https://geneontology.org/ (accessed on 22 November 2023)), clusters of orthologous groups (COG, https://www.ncbi.nlm.nih.gov/research/COG (accessed on 22 November 2023)), Kyoto Encyclopedia of Genes and Genomes (KEGG, https://www.genome.jp/kegg/ (accessed on 22 November 2023)), and Pfam (http://pfam.xfam.org/ (accessed on 22 November 2023)) analyses. The proteomics data were deposited at iProX (http://www.iprox.org (accessed on 22 November 2023)) with the accession number: IPX0007313003.
2.4. Statistical Analysis
The study employed three replicates for each fermentation run, and the experimental results were expressed as mean ± SD. Statistical analysis was carried out using Student’s t-test, and results were deemed significant if p < 0.05.
3. Results and Discussion
3.1. Enhancing the Gentamicin Production by Adding CaCl2 and Sodium Citrate to the Cultivation Medium
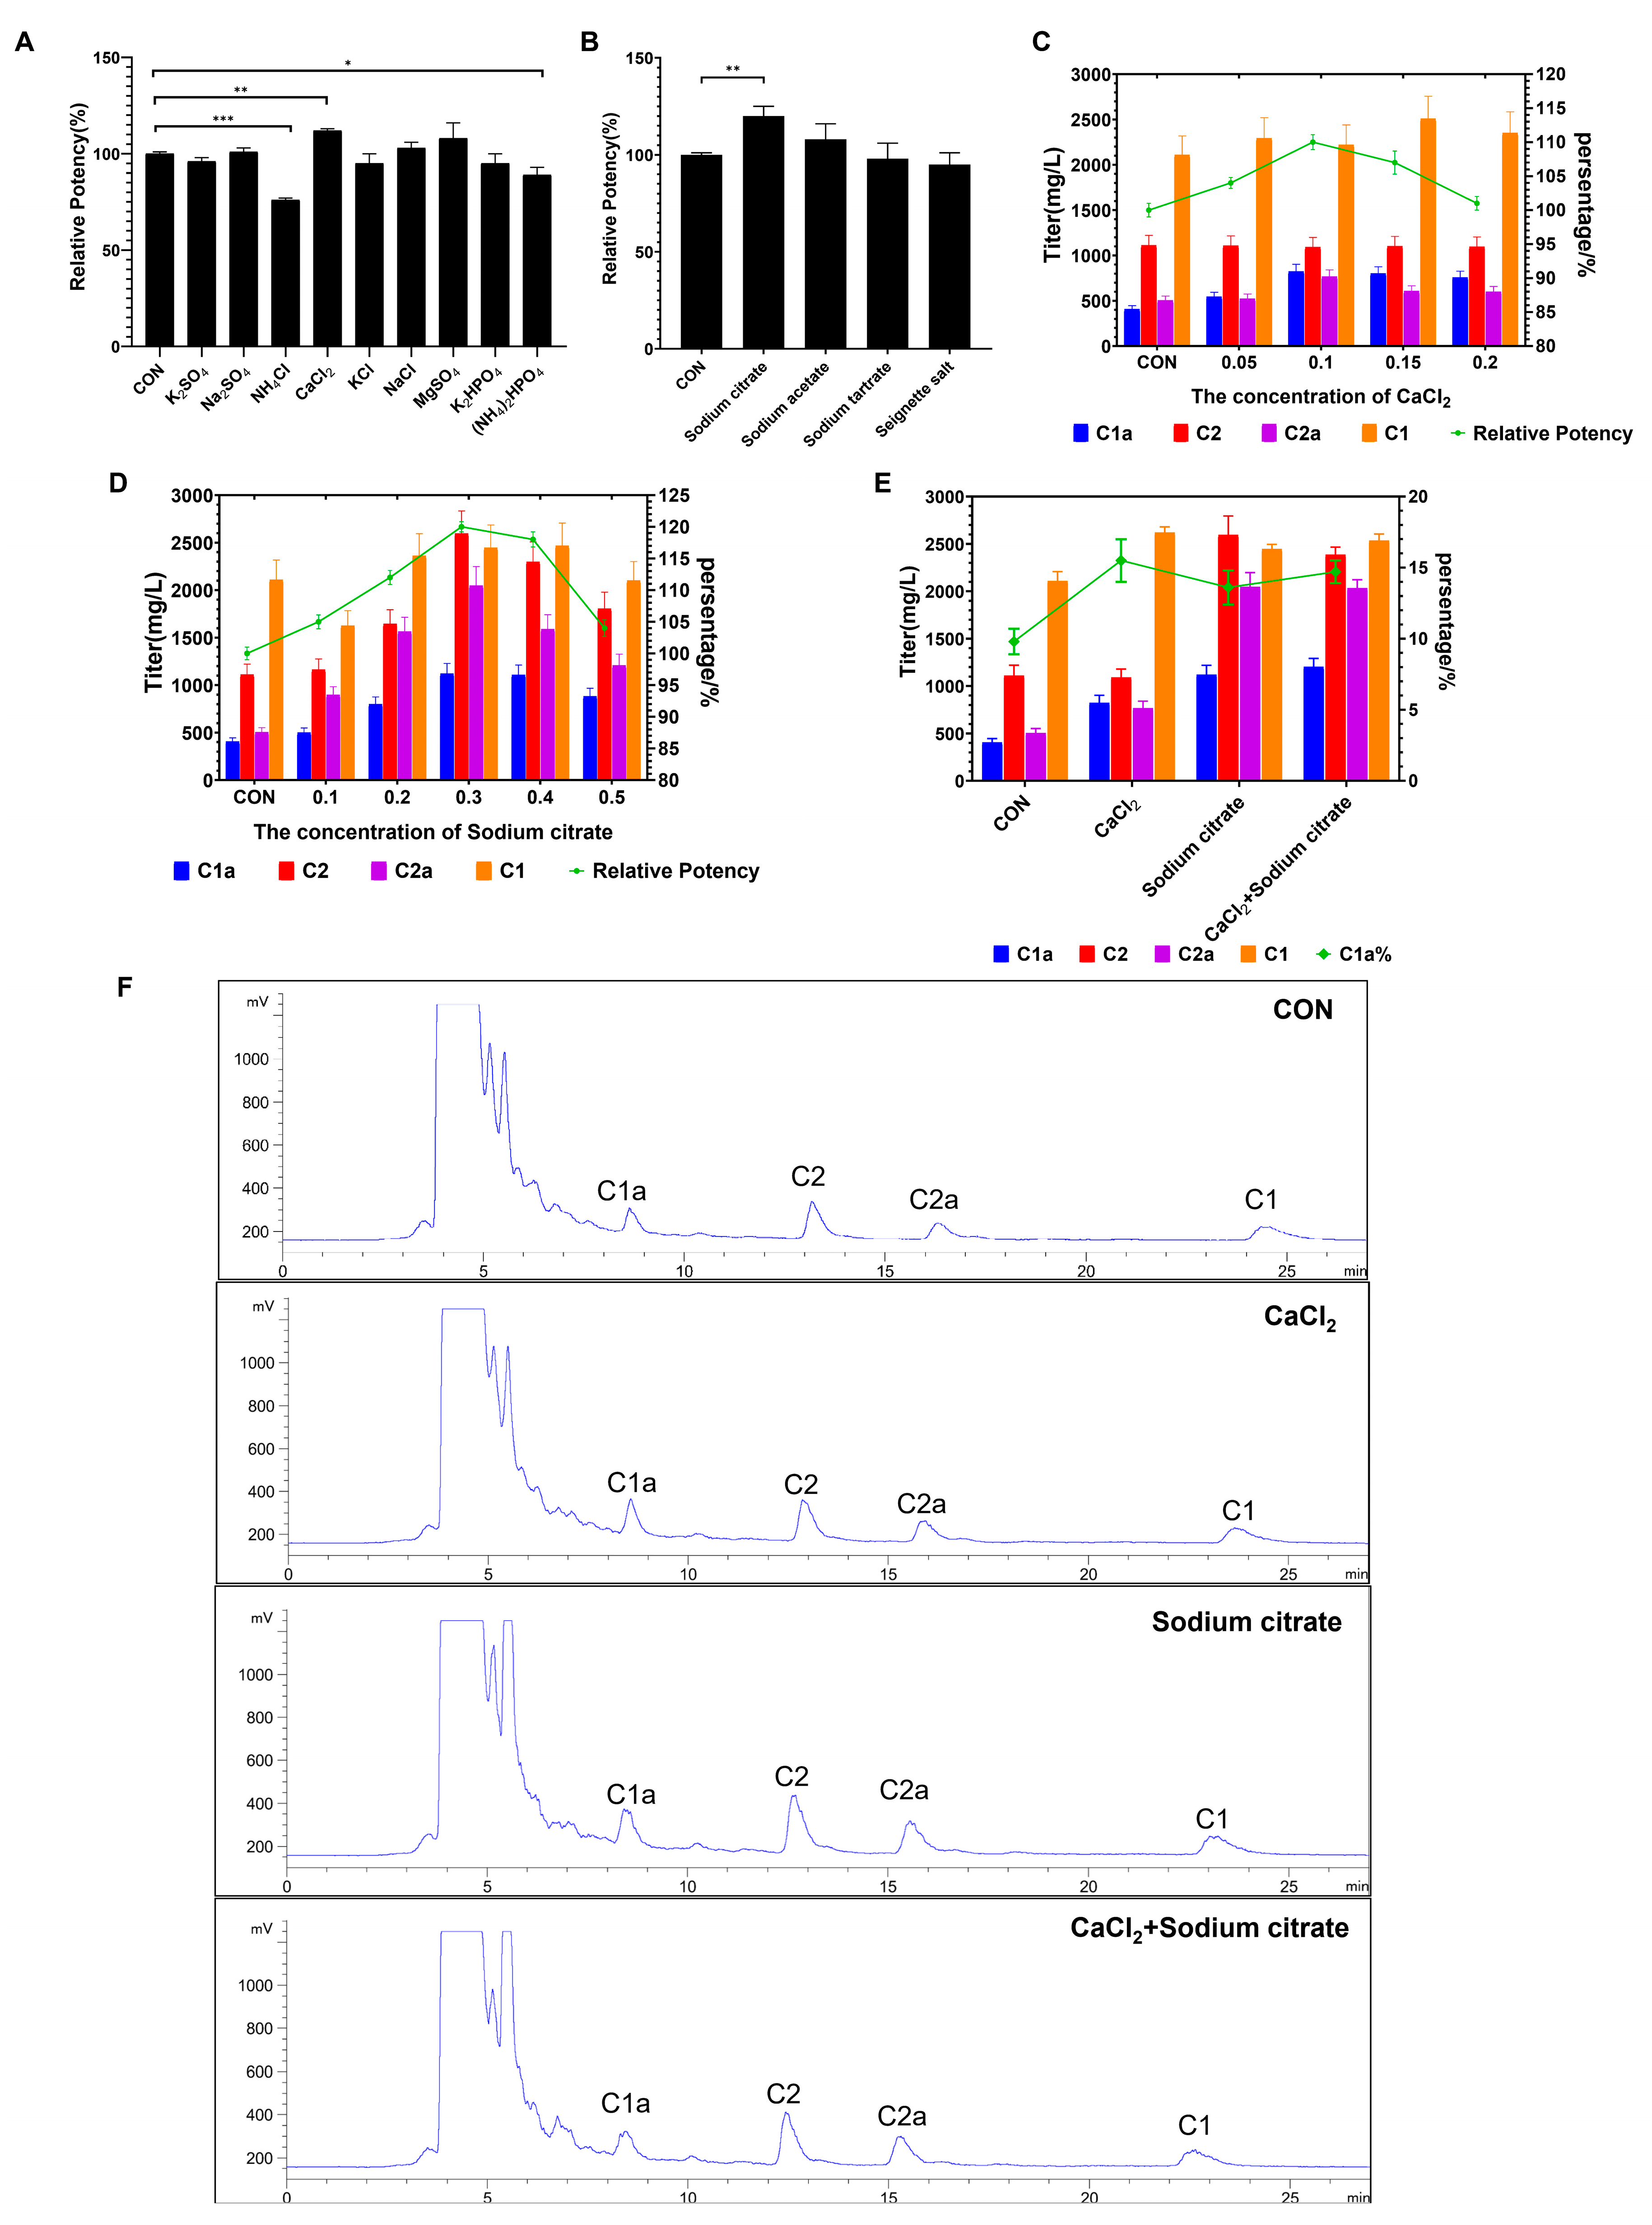
In this study, we examined the impact of adding inorganic salts and organic acid salts on fermentation efficacy using flask culture. The findings demonstrated that the relative potency was notably enhanced with the inclusion of CaCl2 or sodium citrate in the fermentation medium (Figure 3A,B). By contrast, the addition of nitrogen salt markedly induced a decrease in gentamicin production. To further explore the relationship between the fermentation potency and the dosages employed, we further tested the titers at different concentrations of CaCl2 and sodium citrate. As illustrated in Figure 3C,D, the results demonstrated that the peak relative potency was reached at concentrations of 0.1% and 0.3% for CaCl2 and sodium citrate, respectively, with a relative potency of 110% and 120% compared to the control group. We observed that the addition of CaCl2 resulted in a significant increase in the proportion of gentamicin C1a. In addition, gentamicin C2 and C1 showed an increase compared to the control. Conversely, the presence of citric acid notably increased the quantity of individual components (gentamicin C1a, C2, C2a, C1) of gentamicin, although its effect on the proportion of gentamicin C1a was not as significant as that of CaCl2 (Figure 3E,F). Considering our goal to enhance the proportion of high-value single-component gentamicin C1a and overall gentamicin production, we simultaneously added both calcium chloride and sodium citrate. The results showed that, compared to the group with only sodium citrate added, only gentamicin C1a showed an increase, while the other components showed no significant difference, further indicating that calcium chloride primarily enhances the proportion of gentamicin C1a (Figure 3E,F). These findings suggest that both CaCl2 and sodium citrate additions increase gentamicin levels and the percentage of gentamicin C1a in shake flask fermentations.
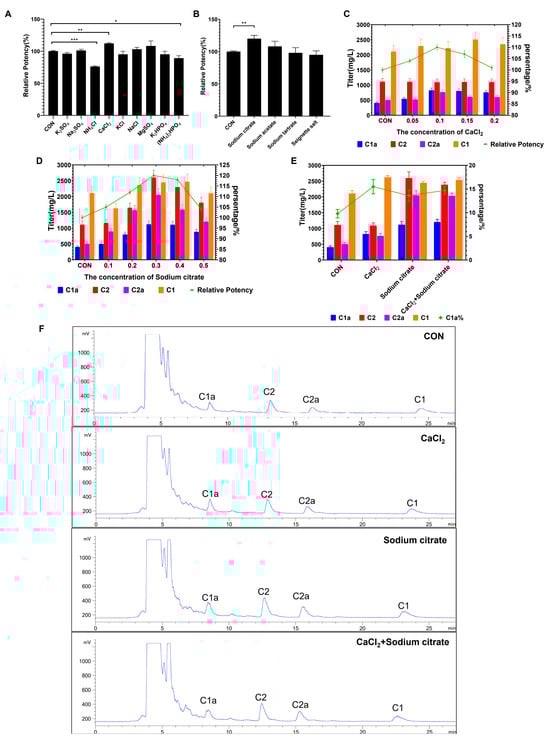
Figure 3.
Effects of adding inorganic salt and organic acid salt to medium during fermentation process on the gentamicin production in flask culture. (A) Relative potency of gentamicin after adding different types of inorganic salts to culture media. (B) Relative potency of gentamicin after exposure to different types of inorganic salts. (C) Effects of CaCl2 concentrations on titers of gentamicin C complex and relative potency. (D) Effects of sodium citrate concentrations on titers of gentamicin C complex and relative potency. (E) Effects of added CaCl2 and sodium citrate on titers of gentamicin C complex and C1a proportion. (F) The chromatogram of each treatment group. * represents p < 0.05, ** represents p < 0.01; *** represents p < 0.001.
It has been reported that, during the fermentation process, excessive accumulation of gentamicin on the cell surface prevents the release of intracellular substances, which inhibits the further synthesis of gentamicin [25]. The increase in gentamicin levels by CaCl2 and sodium citrate may be due to the direct interaction of Ca2+ and Na+ contained in them with the cell wall, allowing the release of gentamicin that promotes cell wall attachment. In addition, previous studies have reported that the inclusion of sodium citrate in the culture medium has a modulatory effect on metabolic pathways, resulting in an increase in the synthesis of various secondary metabolites [28,29,30]. Therefore, the significant increase in gentamicin components by sodium citrate may be related to its involvement in the regulation of metabolism.
The components of gentamicin C vary in their degree of methylation, as shown in Figure 2. Previous research has indicated that the addition of cobalt or vitamin B12 can affect the relative content of these methylated components [24]. Specifically, cobalt ions contribute to the vitamin B12-dependent production of methionine, which acts as the methyl donor for the methylated C1 and C2 components of gentamicin complexes [31]. Consequently, the addition of CaCl2 may play a role in influencing the methylation reaction during the synthesis of gentamicin, ultimately increasing the proportion of C1a.
3.2. Effect of CaCl2 and Sodium Citrate on Gentamicin Fermentation Process in Fermenter
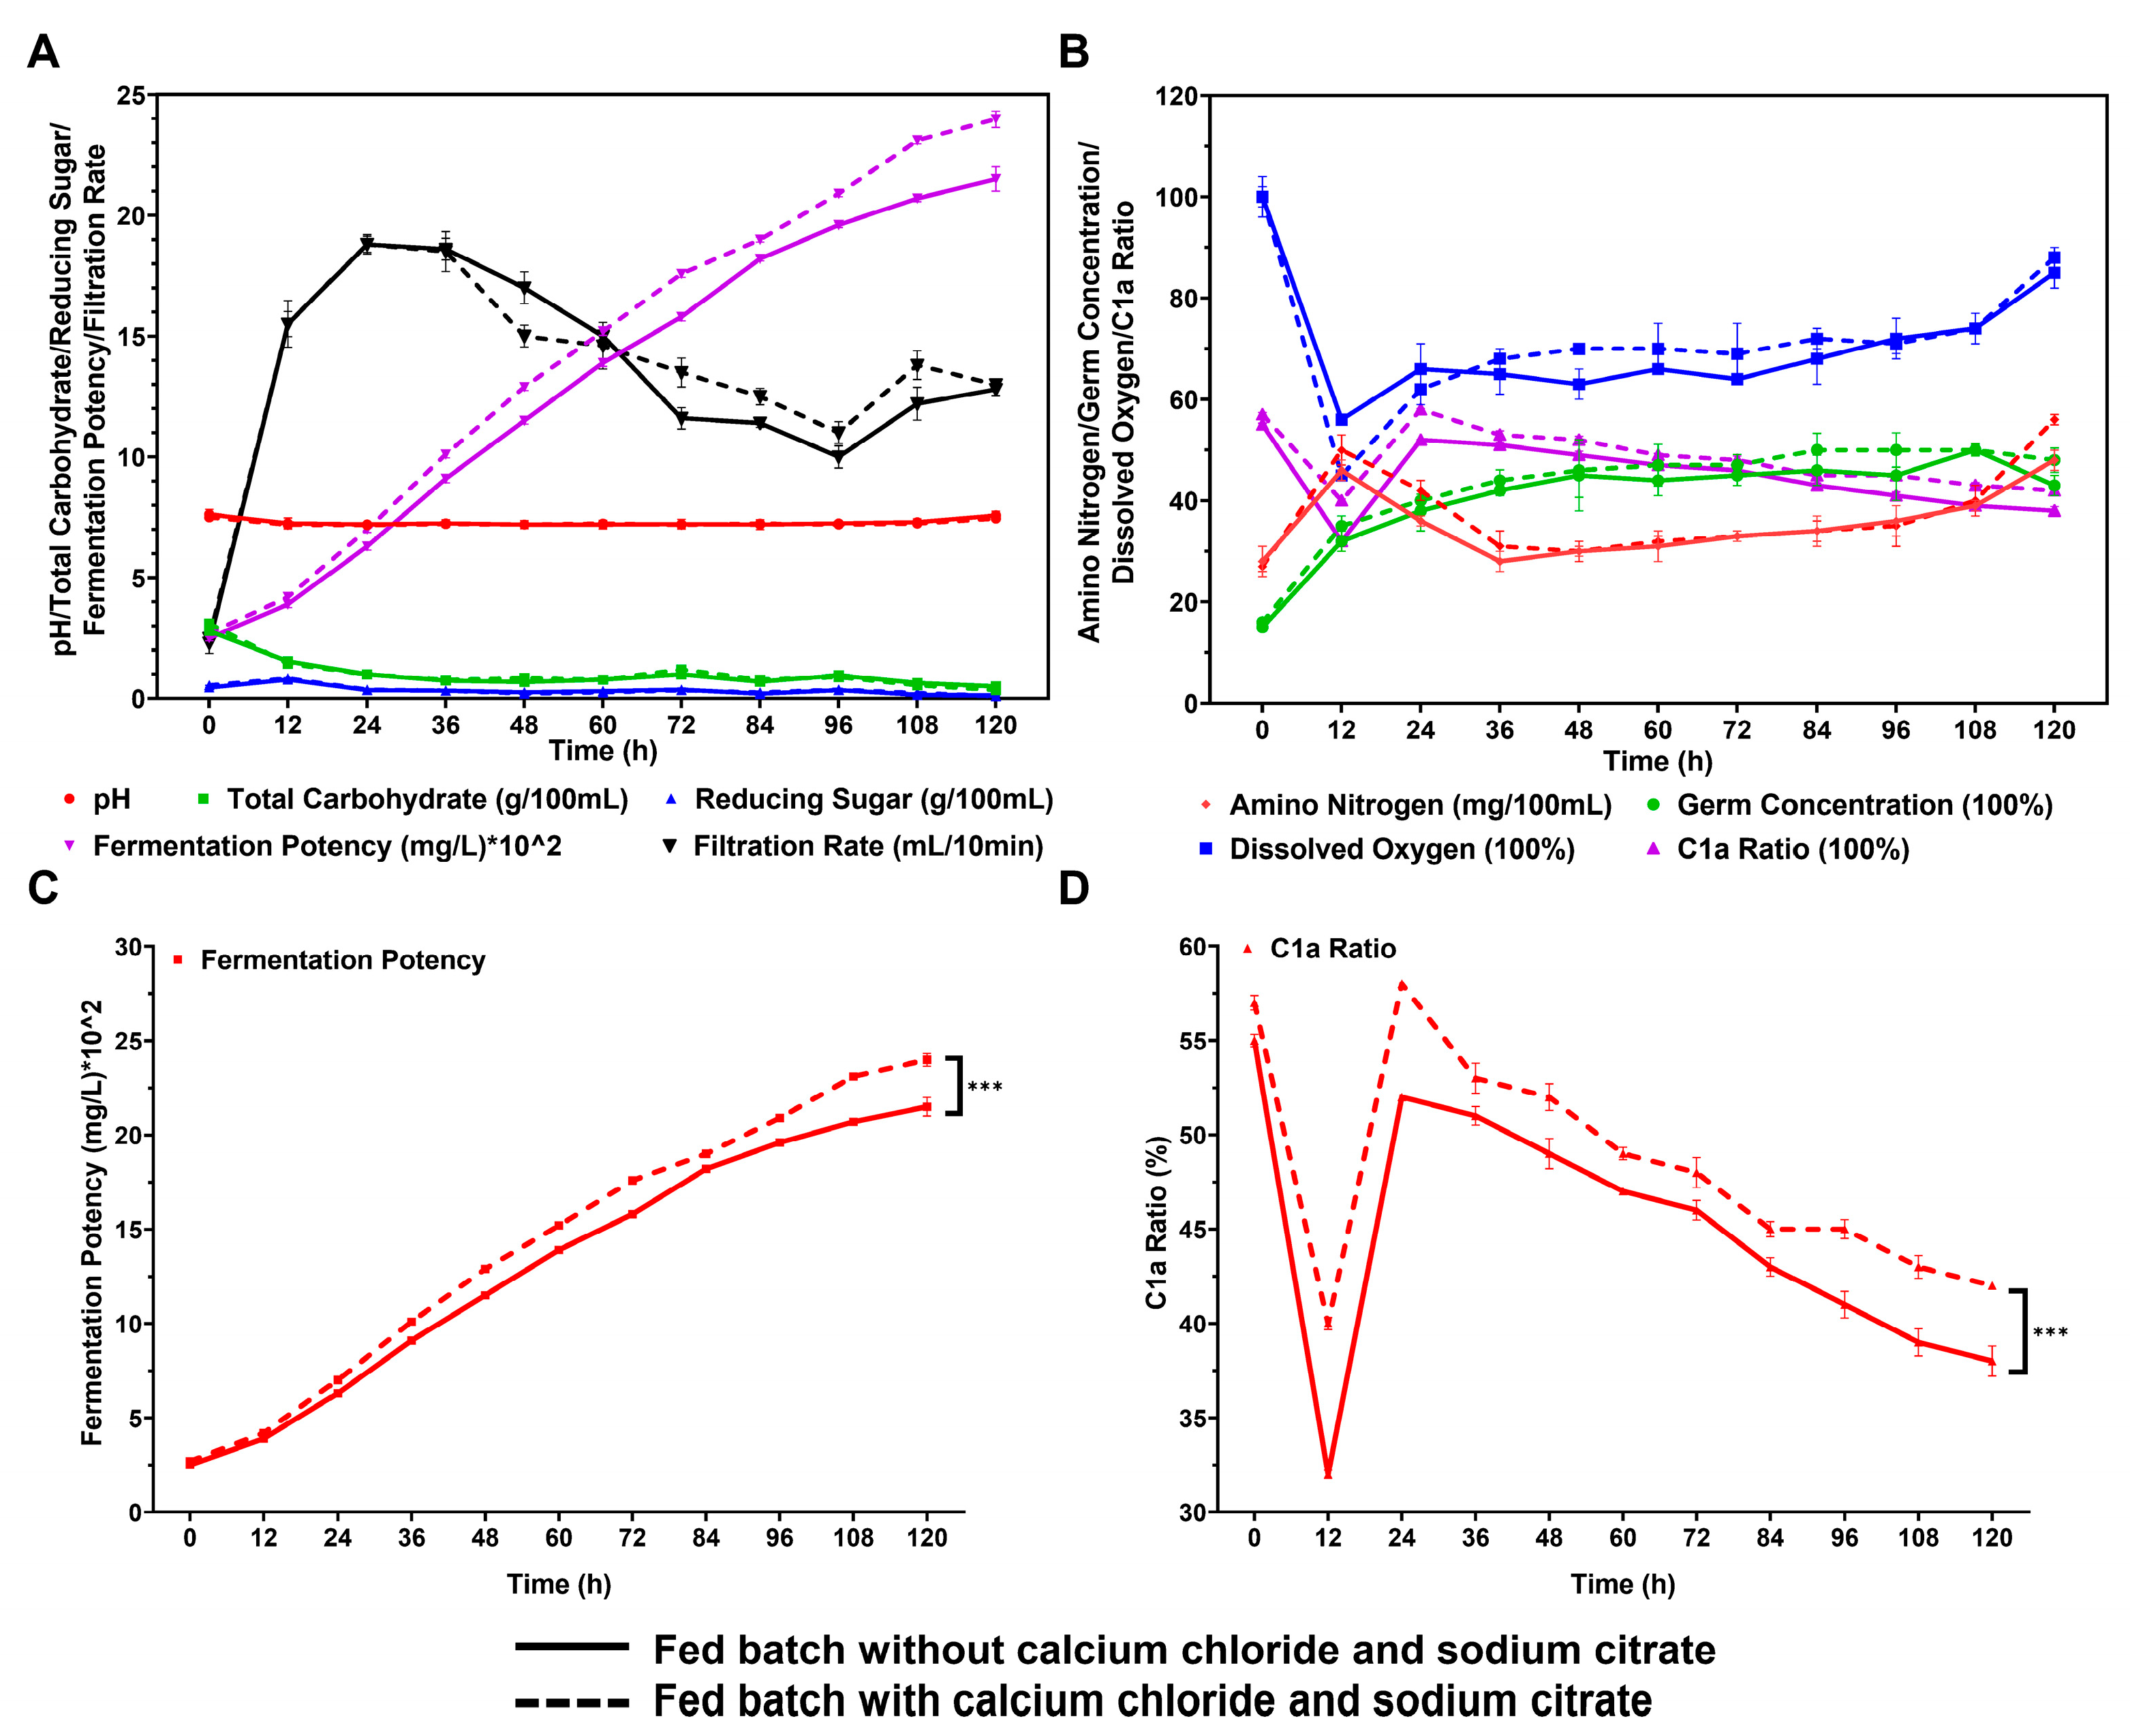
To further analyze the impact of CaCl2 and sodium citrate on gentamicin fermentation in the fermenter, we employed a fed-batch fermentation approach to compare the outcomes of incorporating 0.1% CaCl2 and 0.3% sodium citrate to those without them. We observed the fermentation process indicators and gentamicin yield in a 25 L bioreactor. As depicted in Figure 4A,B, the inclusion of CaCl2 and sodium citrate did not result in any substantial alterations to the changes in sugar, nitrogen, and dissolved oxygen concentrations throughout the fermentation process. In the presence of 0.1% CaCl2 and 0.3% sodium citrate, the production of gentamicin increased to 2398 μg/mL, showing an 11.5% improvement compared to the control group without these additives (2150 μg/mL). This yield is also significantly higher than the highest reported yield in the existing literature (approximately 1800 μg/mL) [32] (Figure 4A–C, Table S1). Moreover, the proportion of gentamicin C1a in the total gentamicin production also significantly increased, from 38% in the control group to 42% (Figure 4D, Table S1). It is noteworthy that this observable improvement not only meets the required standards of the Pharmacopoeia of the People’s Republic of China for the available components of gentamicin but also utilizes surplus gentamicin C1a for its single-component production.
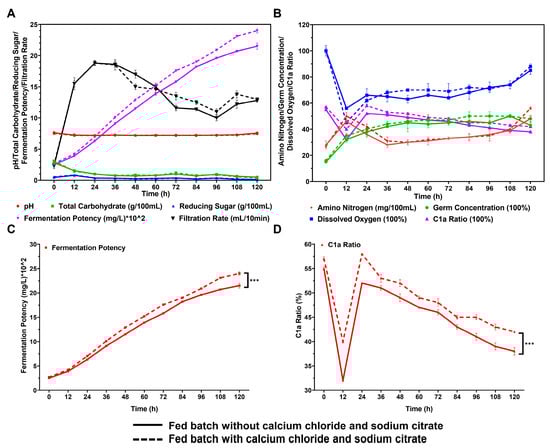
Figure 4.
Effects of adding 0.1% CaCl2 and 0.3% sodium citrate in fermenter culture by the fed-batch method on fermentation indicators and production of gentamicin. Comparisons between two processes in the presence and absence of 0.1% CaCl2 and 0.3% sodium citrate in terms of pH, total carbohydrate, reducing sugar, filtration rate (A), amino nitrogen, dissolved oxygen, germ concentration (B), fermentation potency (C), and C1a ratio (D). *** represents p < 0.001.
Generally, the high yield of gentamicin and the high proportion of gentamicin C1a provide a basis for the co-production of gentamicin and gentamicin C1a. The co-production effect provides the optimal balance between economic and environmental benefits. To achieve this, high-value-added components should be isolated and purified as much as possible and the method of active and precise blending should be used to meet the requirements of different pharmacopeias or standards. This co-production can be expanded to include the manufacturing of additional antibacterial pharmaceuticals, for example, the co-production of meleumycin multicomponent and midecamycin A1 single-component [22].
3.3. Bioinformation Analysis of Proteomics of M. echinospora
Proteomics serves as a valuable tool in the identification of biochemical reactions and regulatory mechanisms involved in biological process [33]. Additionally, it can be utilized to globally analyze variations of key metabolic pathways and enzymatic differences in metabolism. In this research, we employed a label-free quantitative proteomics strategy to examine the underlying mechanisms behind the stimulatory effects of sodium citrate on gentamicin biosynthesis and the role of calcium chloride in promoting the production of C1a in M. echinospora. We analyzed differentially expressed proteins (DEPs) in M. echinospora under different treatment conditions. As shown in Figure 5A, there was a strong correlation observed in both the experimental groups and the control groups. However, the differences between the CaCl2 and sodium citrate experimental groups were small, probably due to their similar effects on M. echinospora. In Figure 5B,D, it was observed that a total of 10,819 peptides were detected, with the majority of peptides ranging in length from 7 to 33 amino acids. Additionally, a total of 2321 proteins were identified, and 86% of these proteins had a peptide coverage exceeding 5 kDa (Figure 5C). These findings validate that the distribution of peptide lengths met the quality standards for label-free proteomics. The total number of identified protein groups was 2186, and the majority of proteins had a molecular weight between 1 and 101 kDa (Figure 5E). These data confirm that the peptide analysis yielded a diverse range of proteins with satisfactory molecular weight coverage. The Venn diagram presented in Figure 5F illustrates the protein distribution among the different treatment groups, including sodium citrate, CaCl2, and control. It is evident that there were 14 proteins that were uniquely expressed in the sodium citrate treatment group, while only 4 proteins were exclusive to the CaCl2 treatment group. Meanwhile, the control group had 641 unique proteins, and the total number of identified proteins was nearly double that of the experimental group (Figure 5F). It is speculated that this may be because the addition of CaCl2 and sodium citrate biased the metabolic flow toward the gentamicin synthesis pathway, which resulted in low levels of other metabolism-related proteins below the instrumental detection line in the experimental group, and thus not detected in the experimental group.
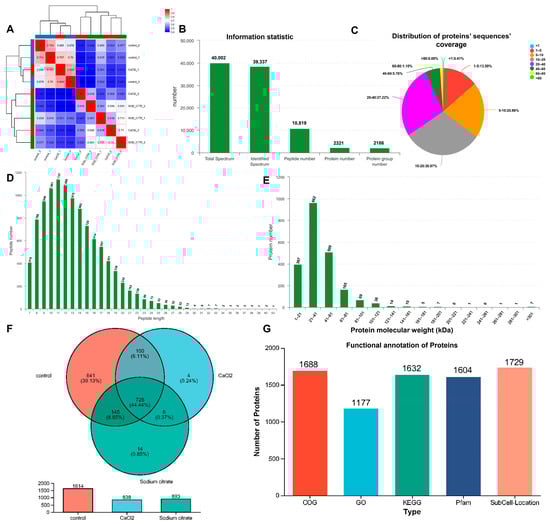
Figure 5.
Bioinformation analysis of proteomics of M. echinospora. Sodium citrate or CaCl2 was introduced into the M. echinospora broth at the start of fermentation and incubated continuously. Three sets of replicated cultures were sampled over a 96 h fermentation period. Proteomic analysis was conducted using a label-free approach. The proteomic analysis was conducted using a label-free method. The data were subjected to analysis using the online platform Majorbio Cloud Platform (www.majorbio.com (accessed on 22 November 2023)). (A) The correlation among varying treatment samples. The green, dark blue, red on the edge present different groups, which mean the sodium citrate group, the control group, and the CaCl2 group, respectively. (B) Detected statistics for peptides’ and proteins’ information. (C) Distribution of proteins’ sequences’ coverage. (D) Peptide length distribution. (E) Protein molecular weight distribution. (F) Venn diagram for the proteins in the sodium citrate, CaCl2, and control treatment groups. (G) Protein function annotation (COG, GO, KEGG, and Pfam) results of M. echinospora.
GO, KEGG, COG, and Pfam are commonly used universal functional databases that provide annotations. The functional annotation of the identified proteins was carried out using these databases to understand the functional properties of the different proteins. A total of 1177 proteins have been annotated in the GO database, whereas 1632 proteins have been annotated in the KEGG database, 1688 proteins in the COG database, and 1604 proteins in the Pfam database. The annotation results for the four databases are shown in Figure 5G. According to the protein identification in M. echinospora, 53.84% (1177 of 2186), 74.66% (1632 of 2186), 77.22% (1688 of 2186), and 73.38% (1604 of 2186) were annotated by GO, KEGG, COG, and Pfam, respectively. The highest number of annotated proteins was in the COG database, then KEGG and Pfam, and the lowest number was in the GO. Moreover, 79.09% (1729 of 2217) of the proteins identified in M. echinospora were functionally annotated and had predictive information on subcellular localization.
3.4. Analysis of Differentially Expressed Proteins (DEPs) in M. Echinospora of Various Treatment Groups
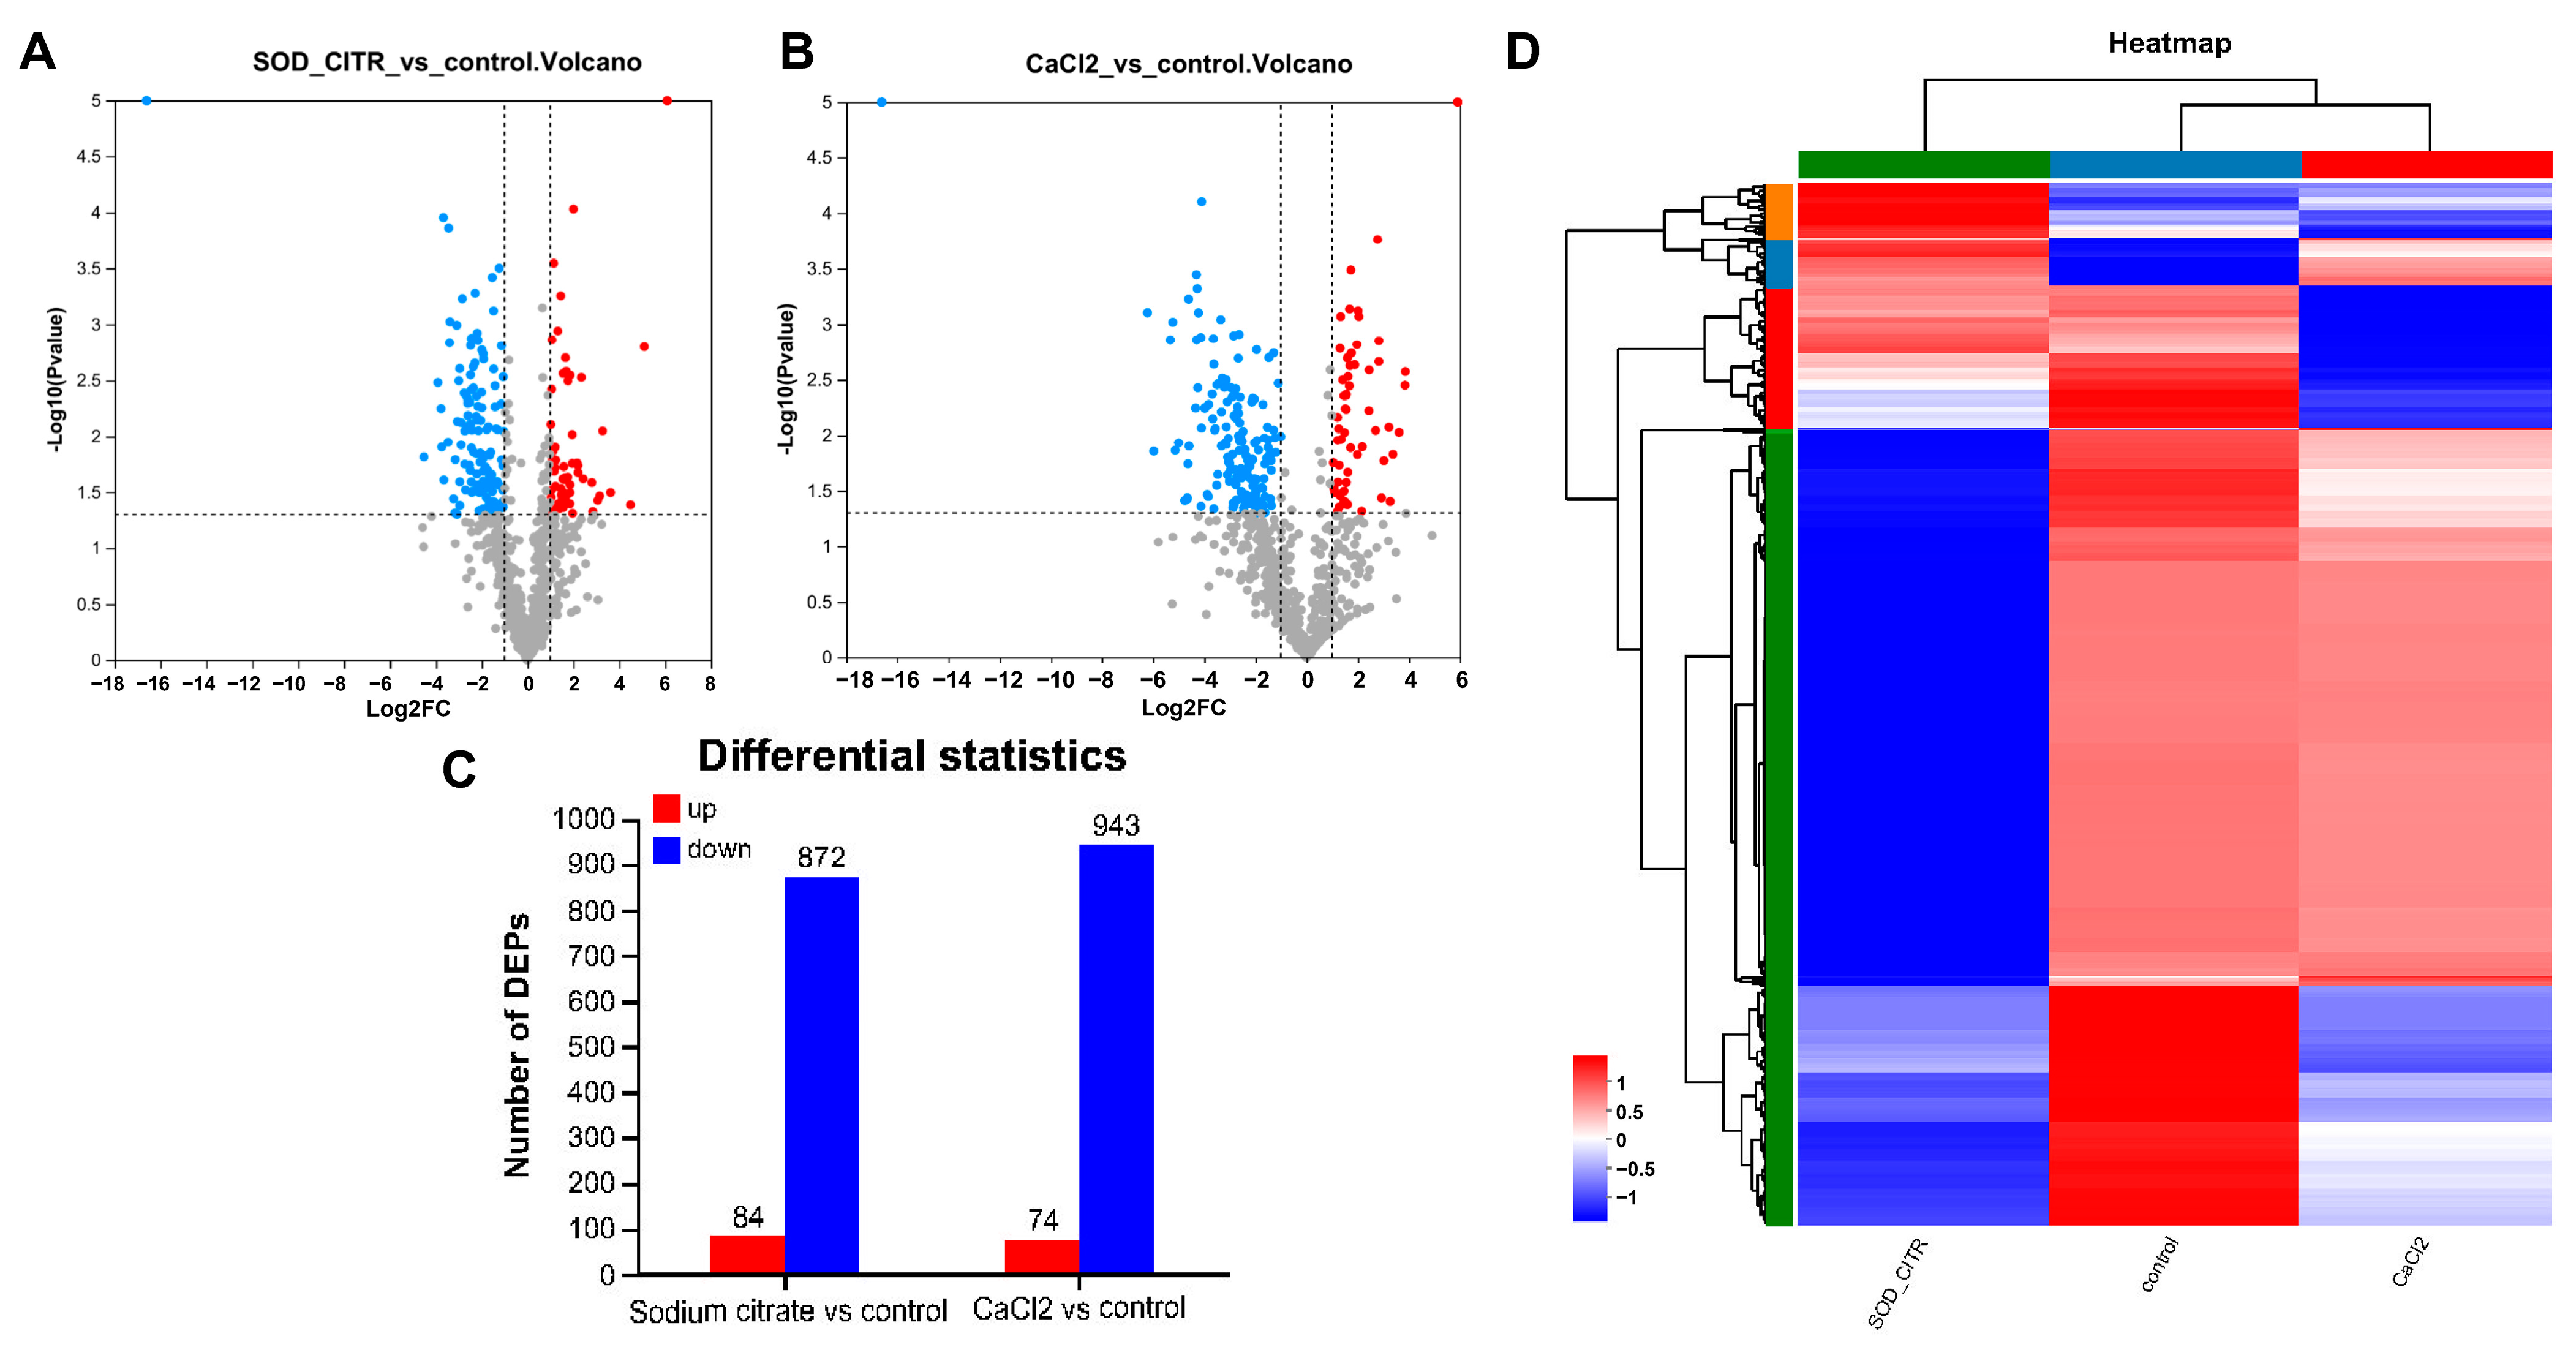
To explore the impact of CaCl2 and sodium citrate on biochemical reactions and potential regulatory mechanisms in gentamicin synthesis, we focused on the DEPs within the CaCl2 or sodium citrate groups, comparing them to the control group. In this study, differentially expressed proteins (DEPs) were defined as those with a p-value of less than 0.05 in the Student’s t-test and a fold change greater than 2 or less than 0.5 (or −2). This analysis was subsequently used to produce DEPs’ volcanoes for sodium citrate and CaCl2 compared to the control group, respectively (Figure 6A,B). A total of 956 proteins were significantly altered in the sodium citrate treatment group, with 84 upregulated and 872 downregulated. The total number of differentially expressed proteins in the CaCl2 treatment groups (74 upregulated and 943 downregulated) was approximately equivalent to the number mentioned (Figure 6C). A clustering analysis was performed using heat maps to compare the up- and downregulation of DEPs in M. echinospora under sodium citrate, CaCl2, and control treatment groups. The results are displayed in Figure 6D, where the color intensity scale ranges from red (highest) to blue (lowest), reflecting the relative abundance of proteins. Hierarchical clustering analysis of DEPs in the three groups revealed distinct grouping patterns. These findings suggest that the M. echinospora’s cellular response to sodium citrate was still different from that of CaCl2, hinting at the involvement of specific mechanisms in the gentamicin biosynthesis.

Figure 6.
The differentially expressed proteins (DEPs) in different treatment groups. (A) Volcano plot of DEPs in the sodium citrate and control groups; (B) volcano plot of DEPs in the CaCl2 and control groups; blue polka dots indicate proteins with p-value less than 0.05, i.e. −log10 (p value) > 1.30 and fold change less than −2, i.e. log2FC < −1; red polka dots indicate proteins with −log10 (p value) > 1.30 and log2FC > 1, and gray polka dots represent other proteins. (C) numbers of differentially expressed proteins in different treatment groups. (D) Hierarchical clustering analysis of the DEPs among the sodium citrate, CaCl2, and control groups. The green, dark blue, and red at the top represent the sodium citrate group, the control group, and the CaCl2 group, respectively. The green, red, dark blue, and orange on the left side mean different subclusters which are classified by the protein expression levels.
3.5. GO Analysis of DEPs in M. Echinospora Treated with CaCl2 or Sodium Citrate
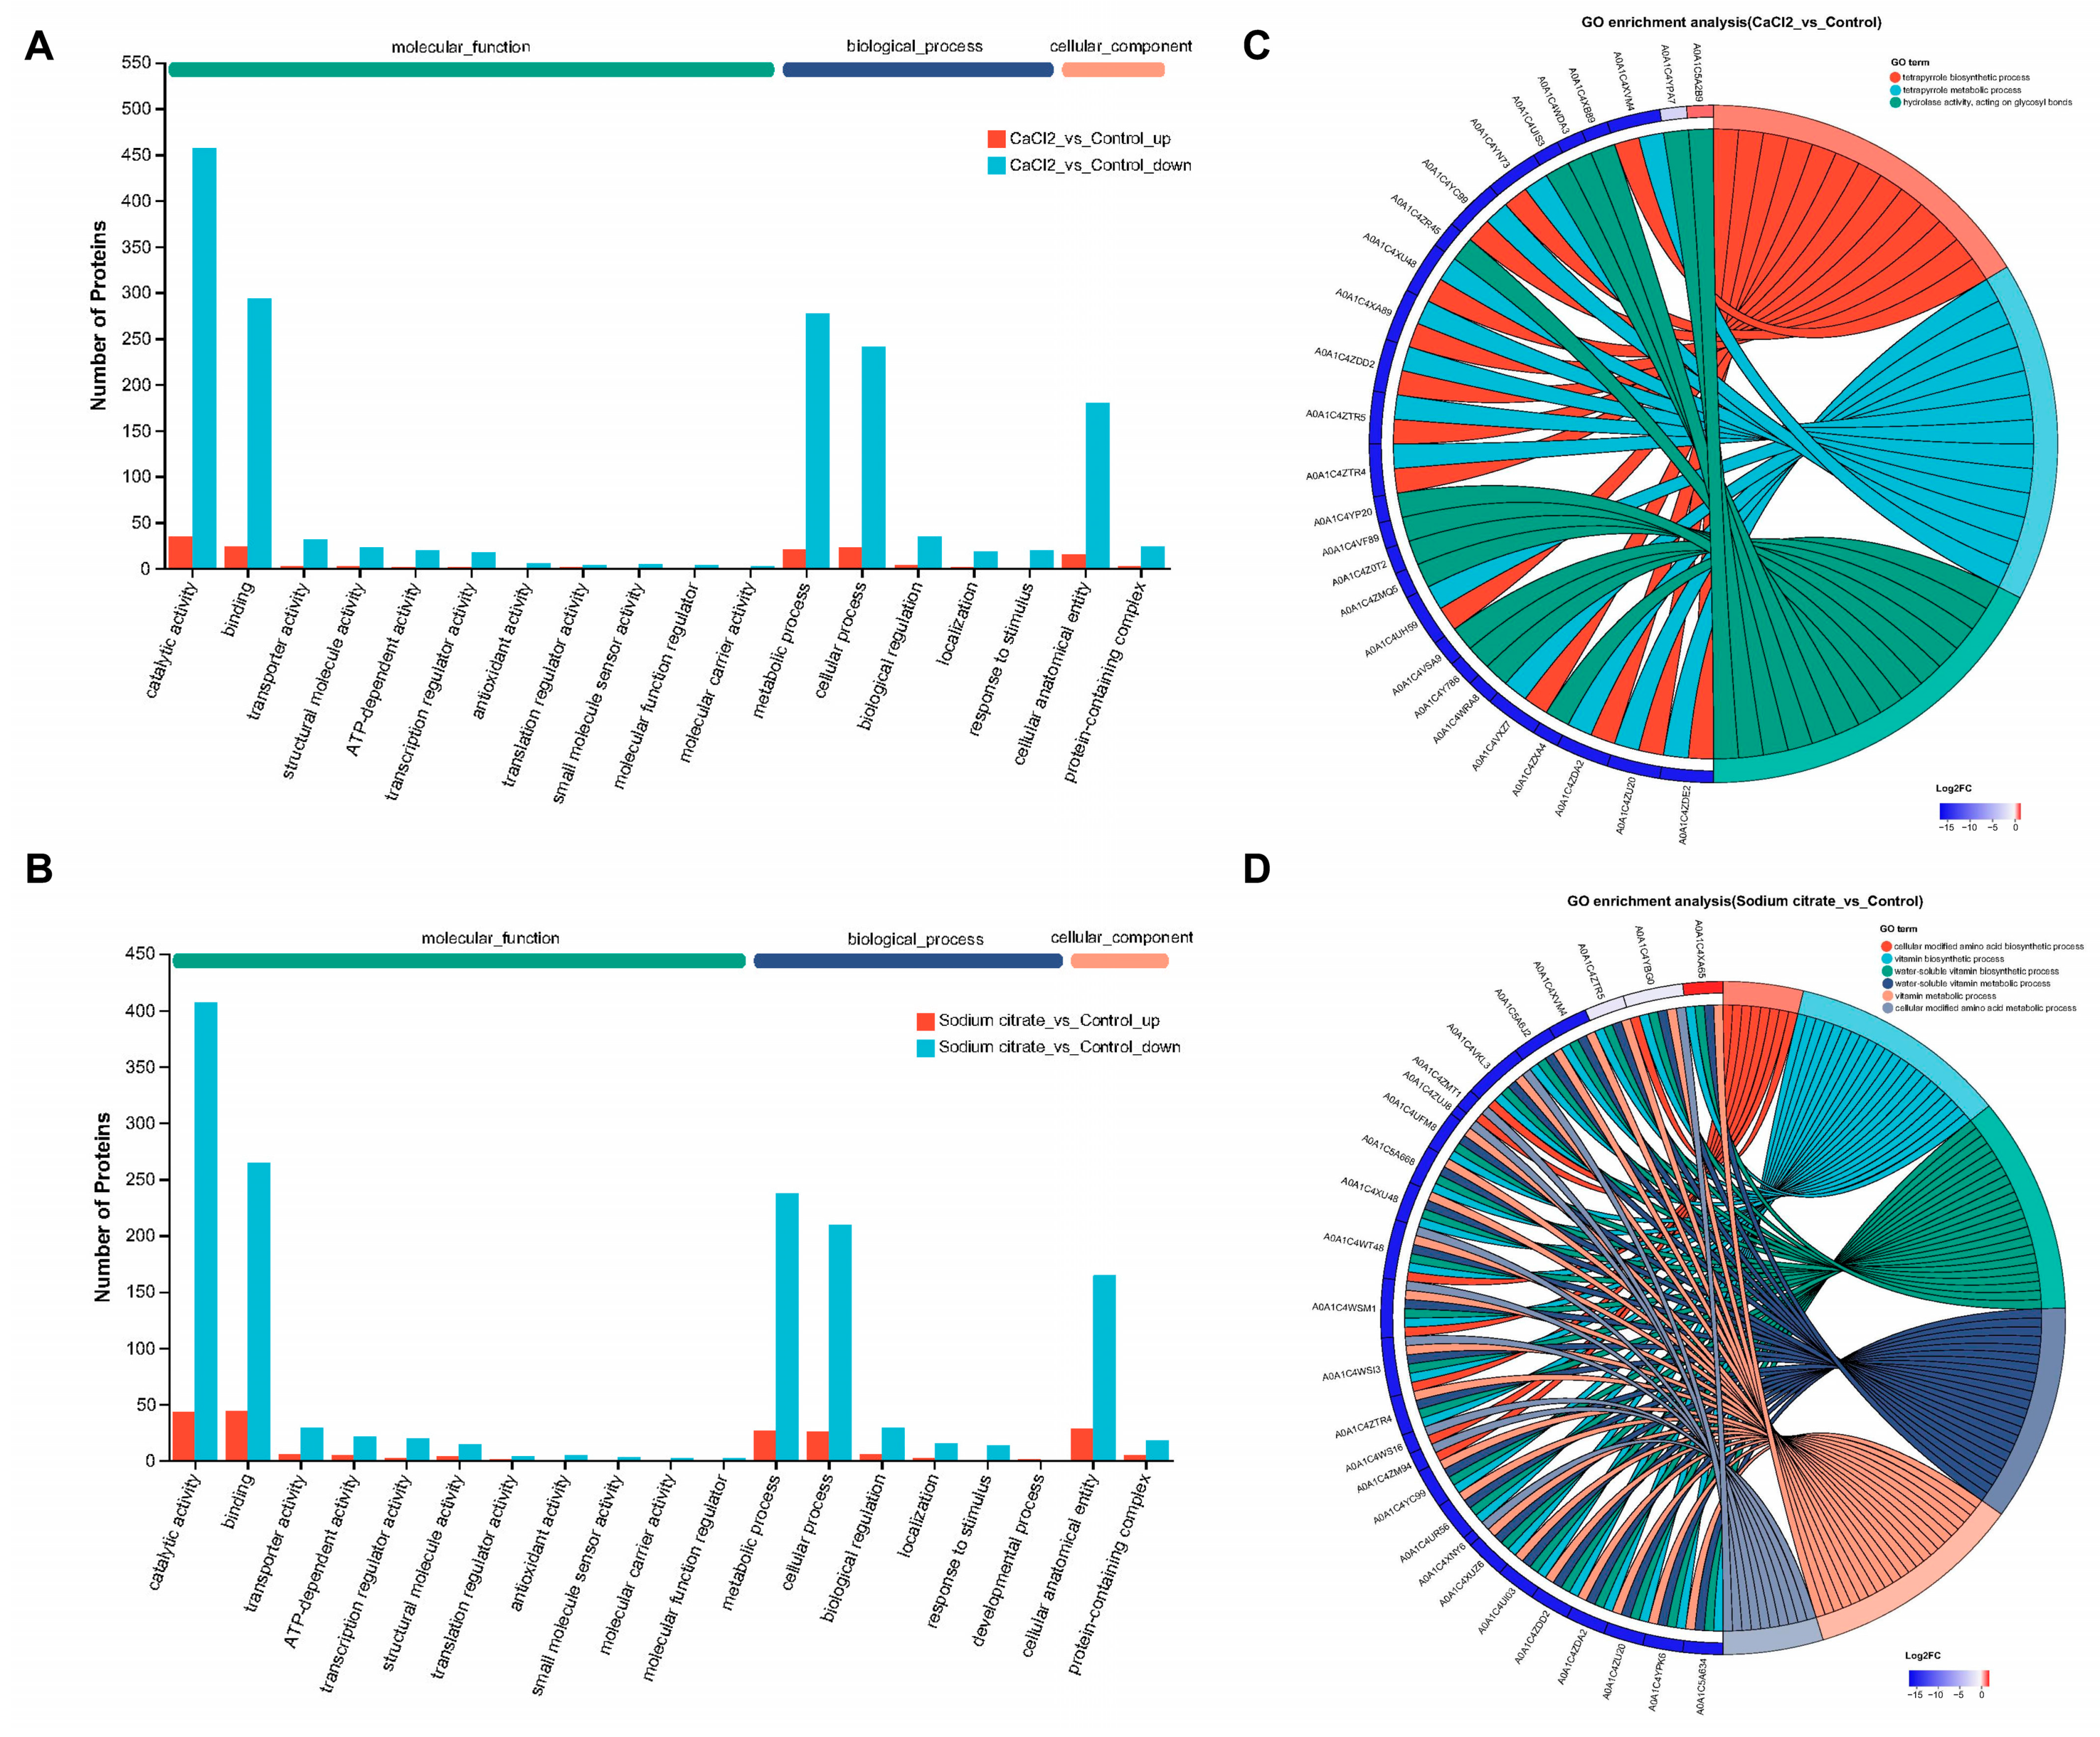
To acquire information about DEPs, a GO analysis was conducted. The GO annotations categorized all DEPs into three functional categories: molecular function, biological process, and cellular component. The molecular function section displayed in Figure 7A,B demonstrated that the DEPs were primarily involved in catalytic activity (495, 48.34%; 450, 48.54%) and binding (318, 31.05%; 308, 33.23%). The biological process classification indicated that these proteins were mostly engaged in the metabolic process (301, 29.39%; 263, 28.37%) and cellular process (265, 25.88%; 235, 25.35%). The cellular component classification indicated that the proteins were primarily involved in the cellular anatomical entity (197, 19.24%; 192, 20.71%). The data in brackets correspond to the CaCl2 group and the sodium citrate group, respectively. The differentially expressed proteins producing “catalytic activity” occupied the majority of this category in either the CaCl2 or sodium citrate group, indicating that the addition of either CaCl2 or sodium citrate would impact the enzymatic activity of M. echinospora during the fermentation process.

Figure 7.
GO analysis and subcellular location of differentially expressed proteins (DEPs) in M. echinospora treated with CaCl2 or sodium citrate groups, respectively. (A,B) GO annotations analysis of DEPs. The blue-green columns on these maps indicate proteins that are downregulated, and the orange columns indicate proteins that are upregulated. These maps display the top 20 GO terms for abundance. (C,D) Chordal map of GO enrichment analysis of DEPs. The maps illustrate the 50 most important protein targets containing a significant number of annotated GO terms. Additionally, the 15 most significant GO terms featuring these target proteins are displayed based on the p-value of the enrichment results.
Further information about GO enrichment can be obtained from Figure 7C,D; the GO functional enrichment analysis revealed that the differentially expressed proteins from the CaCl2 group were predominantly enriched in 68 GO terms, while those from the sodium citrate group were primarily enriched in 106 GO terms. In the group treated with CaCl2, the process of tetrapyrrole biosynthesis and metabolism were enriched in the biological process; the process of hydrolase activity, acting on glycosyl bonds, was found to be enriched in the molecular function (Figure 7C). In the group treated with sodium citrate, the processes of cellular modified amino acid biosynthesis and metabolism, vitamin biosynthesis and metabolism, and water-soluble vitamin biosynthesis and metabolism were enriched in the biological process; the process of the extracellular region was found to be enriched in the cellular component. The GO enrichment analysis revealed that the CaCl2 addition primarily downregulated the synthesis and metabolism of tetrapyrrole. Tetrapyrrole, which is a precursor of vitamin B12, plays a role in the synthesis of methionine, which is dependent on vitamin B12 [31]. Methionine serves as the donor of methyl groups for the biosynthesized gentamicin complex’s methylated C1 and C2 components [24]. Therefore, the significant increase in the proportion of gentamicin C1a by the CaCl2 addition may be related to the downregulation of tetrapyrrole synthesis and metabolism.
3.6. KEGG and Subcellular Location Analysis of DEPs in M. echinospora Treated with CaCl2 or Sodium Citrate
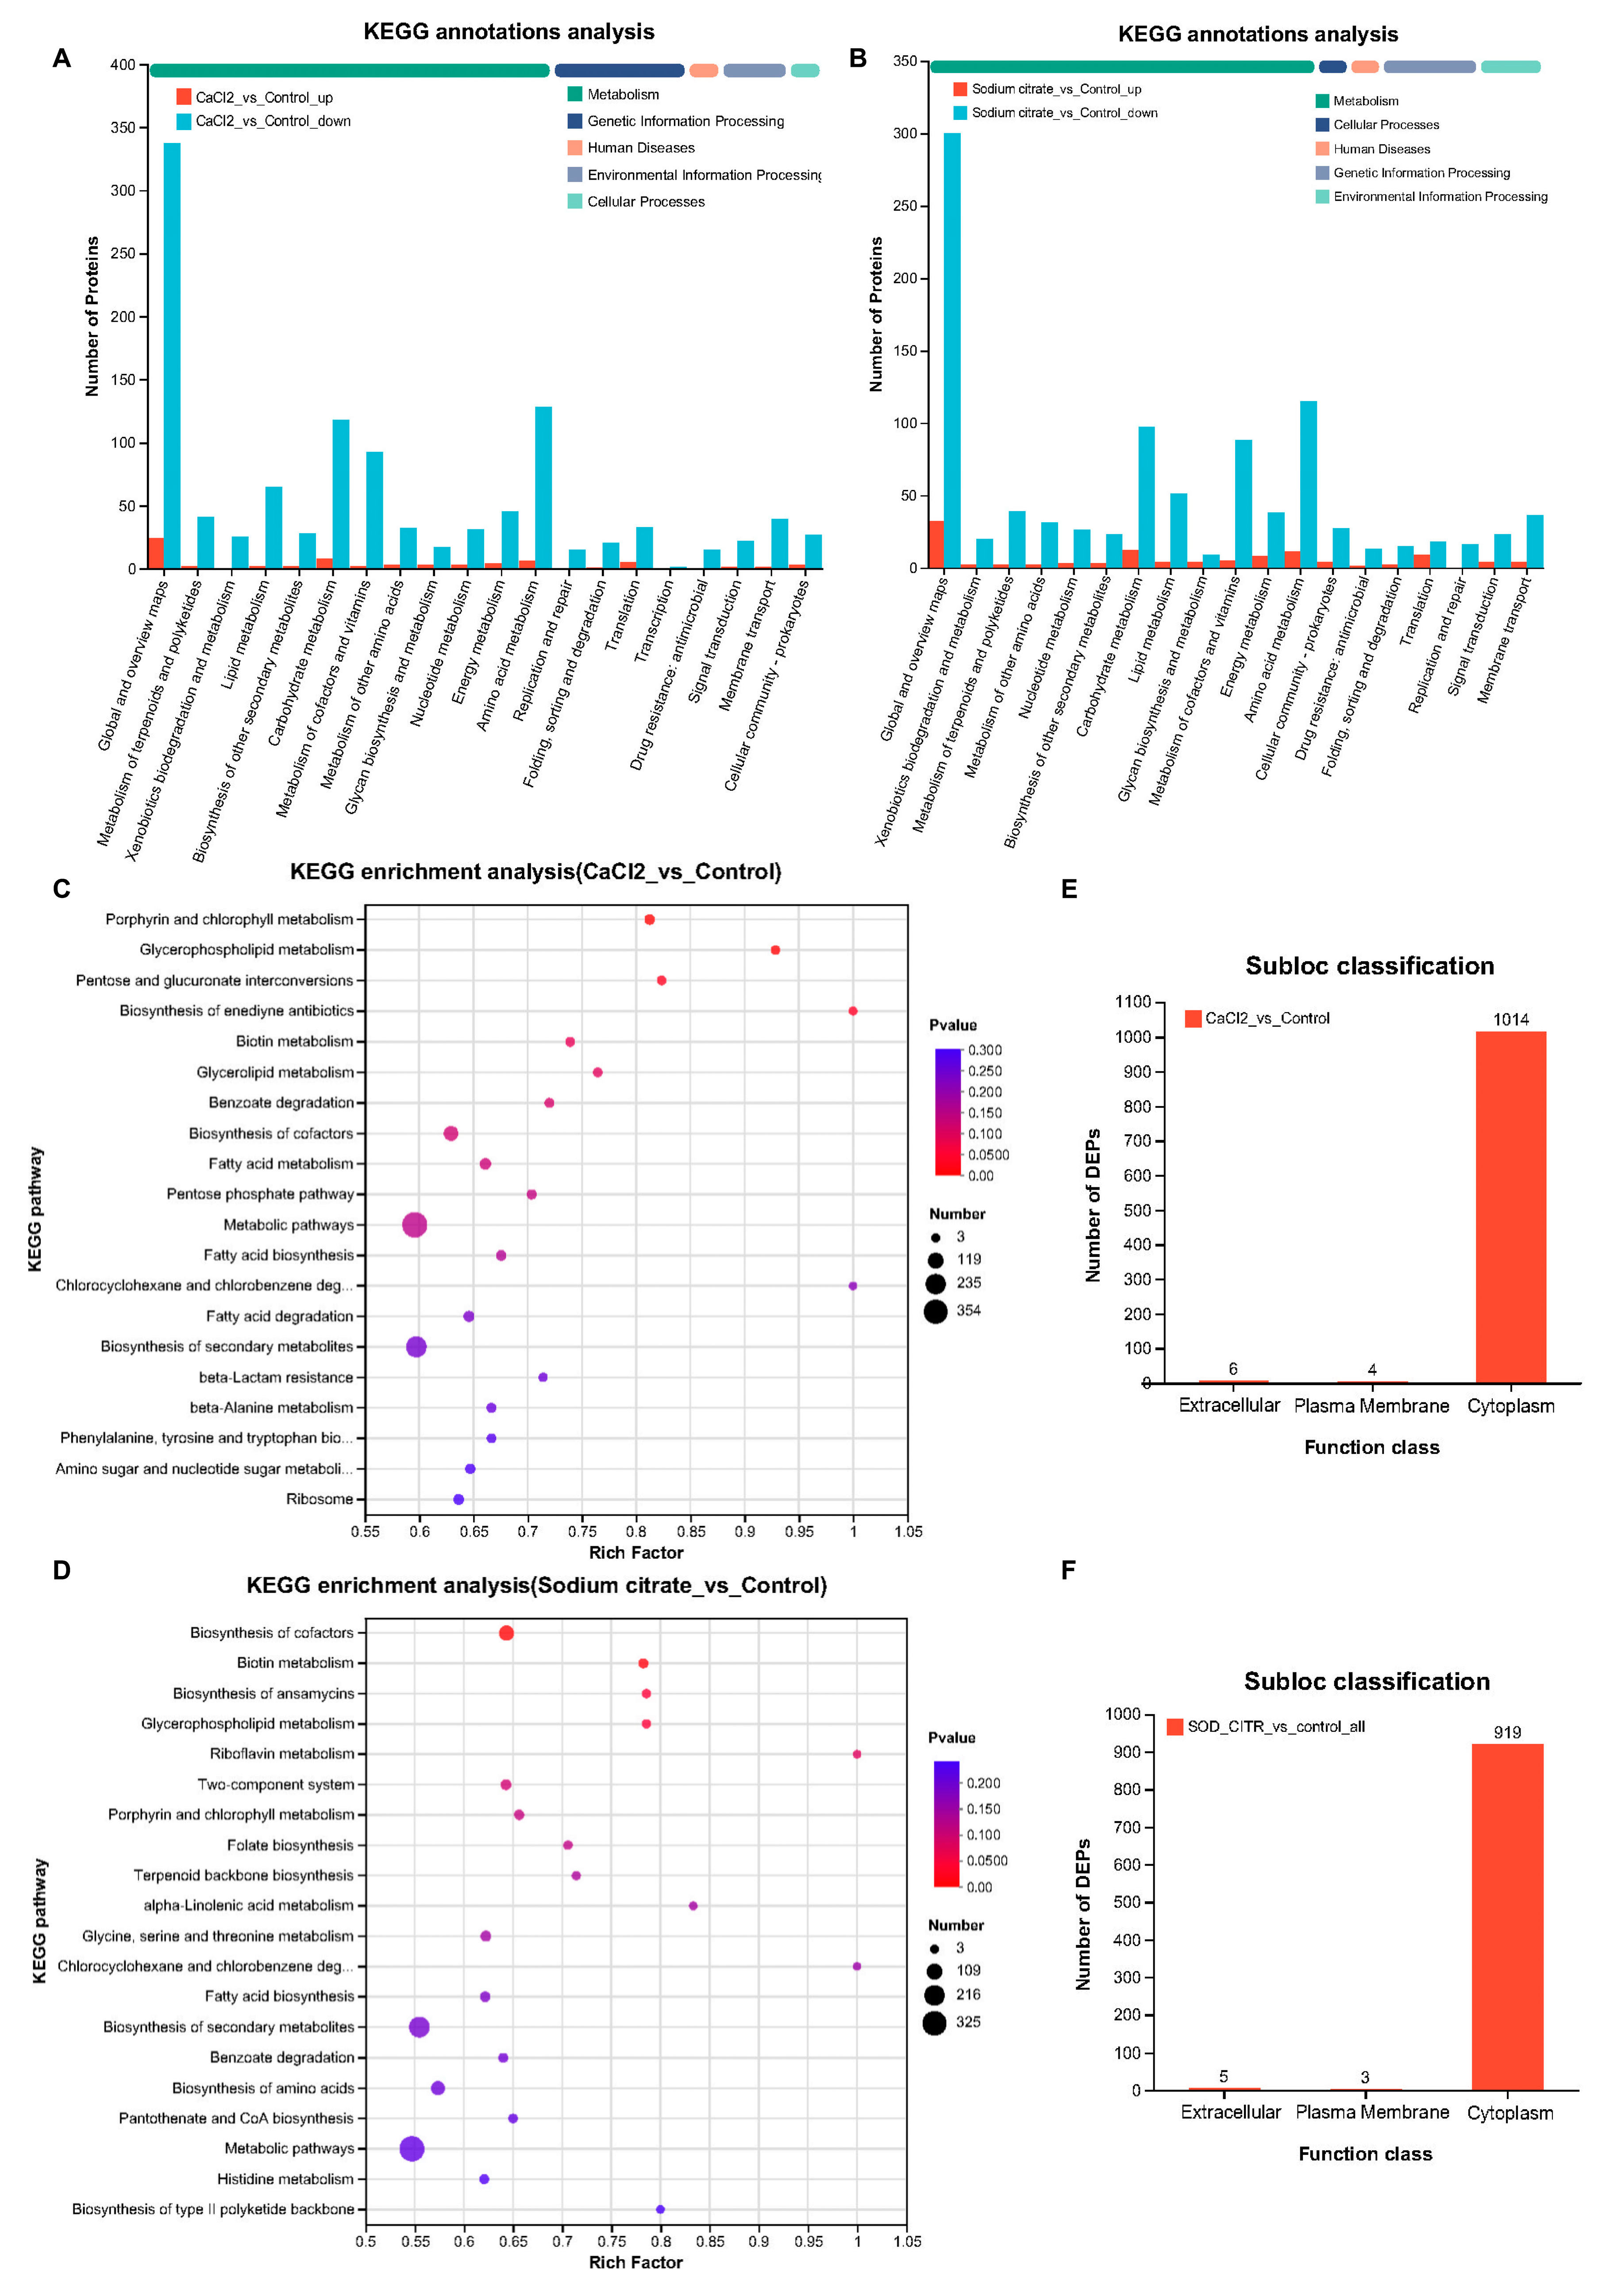
KEGG is an integrated database resource that systematically analyzes gene functions and links genomic and functional information. In living organisms, proteins do not exist in isolation, but different proteins perform their specific biological functions through orderly coordination with each other [34]. Therefore, the main metabolic and signaling pathways involved in the DEPs in M. echinospora treated with CaCl2 or sodium citrate could be identified by KEGG pathway analysis. According to the KEGG function classification, the DEPs were classified into five categories, including metabolism, cellular process, human diseases, genetic information processing, and environmental information processing. The DEPs in M. echinospora treated with CaCl2 and sodium citrate were mainly related to global and overview maps, amino acid metabolism, carbohydrate metabolism, metabolism of cofactors and vitamins, and lipid metabolism (Figure 8A,B). KEGG pathway enrichment analysis is shown in Figure 8C,D. The KEGG enrichment analysis bubble map was drawn based on the top 20 pathways selected by the p-value size. In the group treated with CaCl2, the p-values for “porphyrin and chlorophyll metabolism”, “glycerophospholipid metabolism”, “pentose and glucuronate interconversions”, and “biosynthesis of enediyne antibiotics” were <0.05. Thus, the addition of CaCl2 had a significant effect on these pathways. In the group receiving sodium citrate, the pathways “biosynthesis of cofactors”, “biotin metabolism”, “glycerophospholipid metabolism”, and “biosynthesis of ansamycins” showed significant effects (p < 0.05). The results showed that sodium citrate and CaCl2, individually, mainly interfere with cofactor synthesis and porphyrin and chlorophyll metabolism in M. echinospora to increase the yield of gentamicin and the proportion of C1a in the compound.
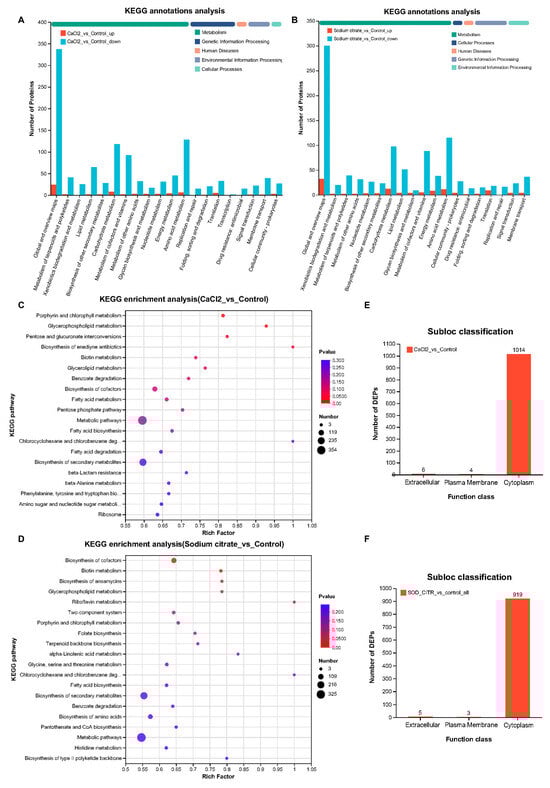
Figure 8.
KEGG analyses and subcellular locations of DEPs that were markedly differently expressed in M. echinospora treated with CaCl2 or sodium citrate groups, respectively. (A,B) KEGG annotations analysis of DEPs. The downregulated proteins are represented by blue-green columns; upregulated proteins are represented by orange columns. These maps show the top 20 KEGG terms for abundance. (C,D) Bubble maps of GO enrichment analyses of DEPs. The top 20 pathways were selected based on the p-value. (E,F) Subcellular location classifications of DEPs.
Based on the identified proteins’ subcellular locations (Figure 8E,F), the cytoplasm was the main location of DEPs (99.02%; 99.14%), and only a few DEPs were located in the extracellular and plasma membranes. This aligns with the findings from the GO and KEGG analyses, indicating that CaCl2 and sodium citrate predominantly impeded the catalytic function of cytoplasmic molecules, consequently affecting metabolism.
3.7. Gentamicin Biosynthetic Pathway Analysis
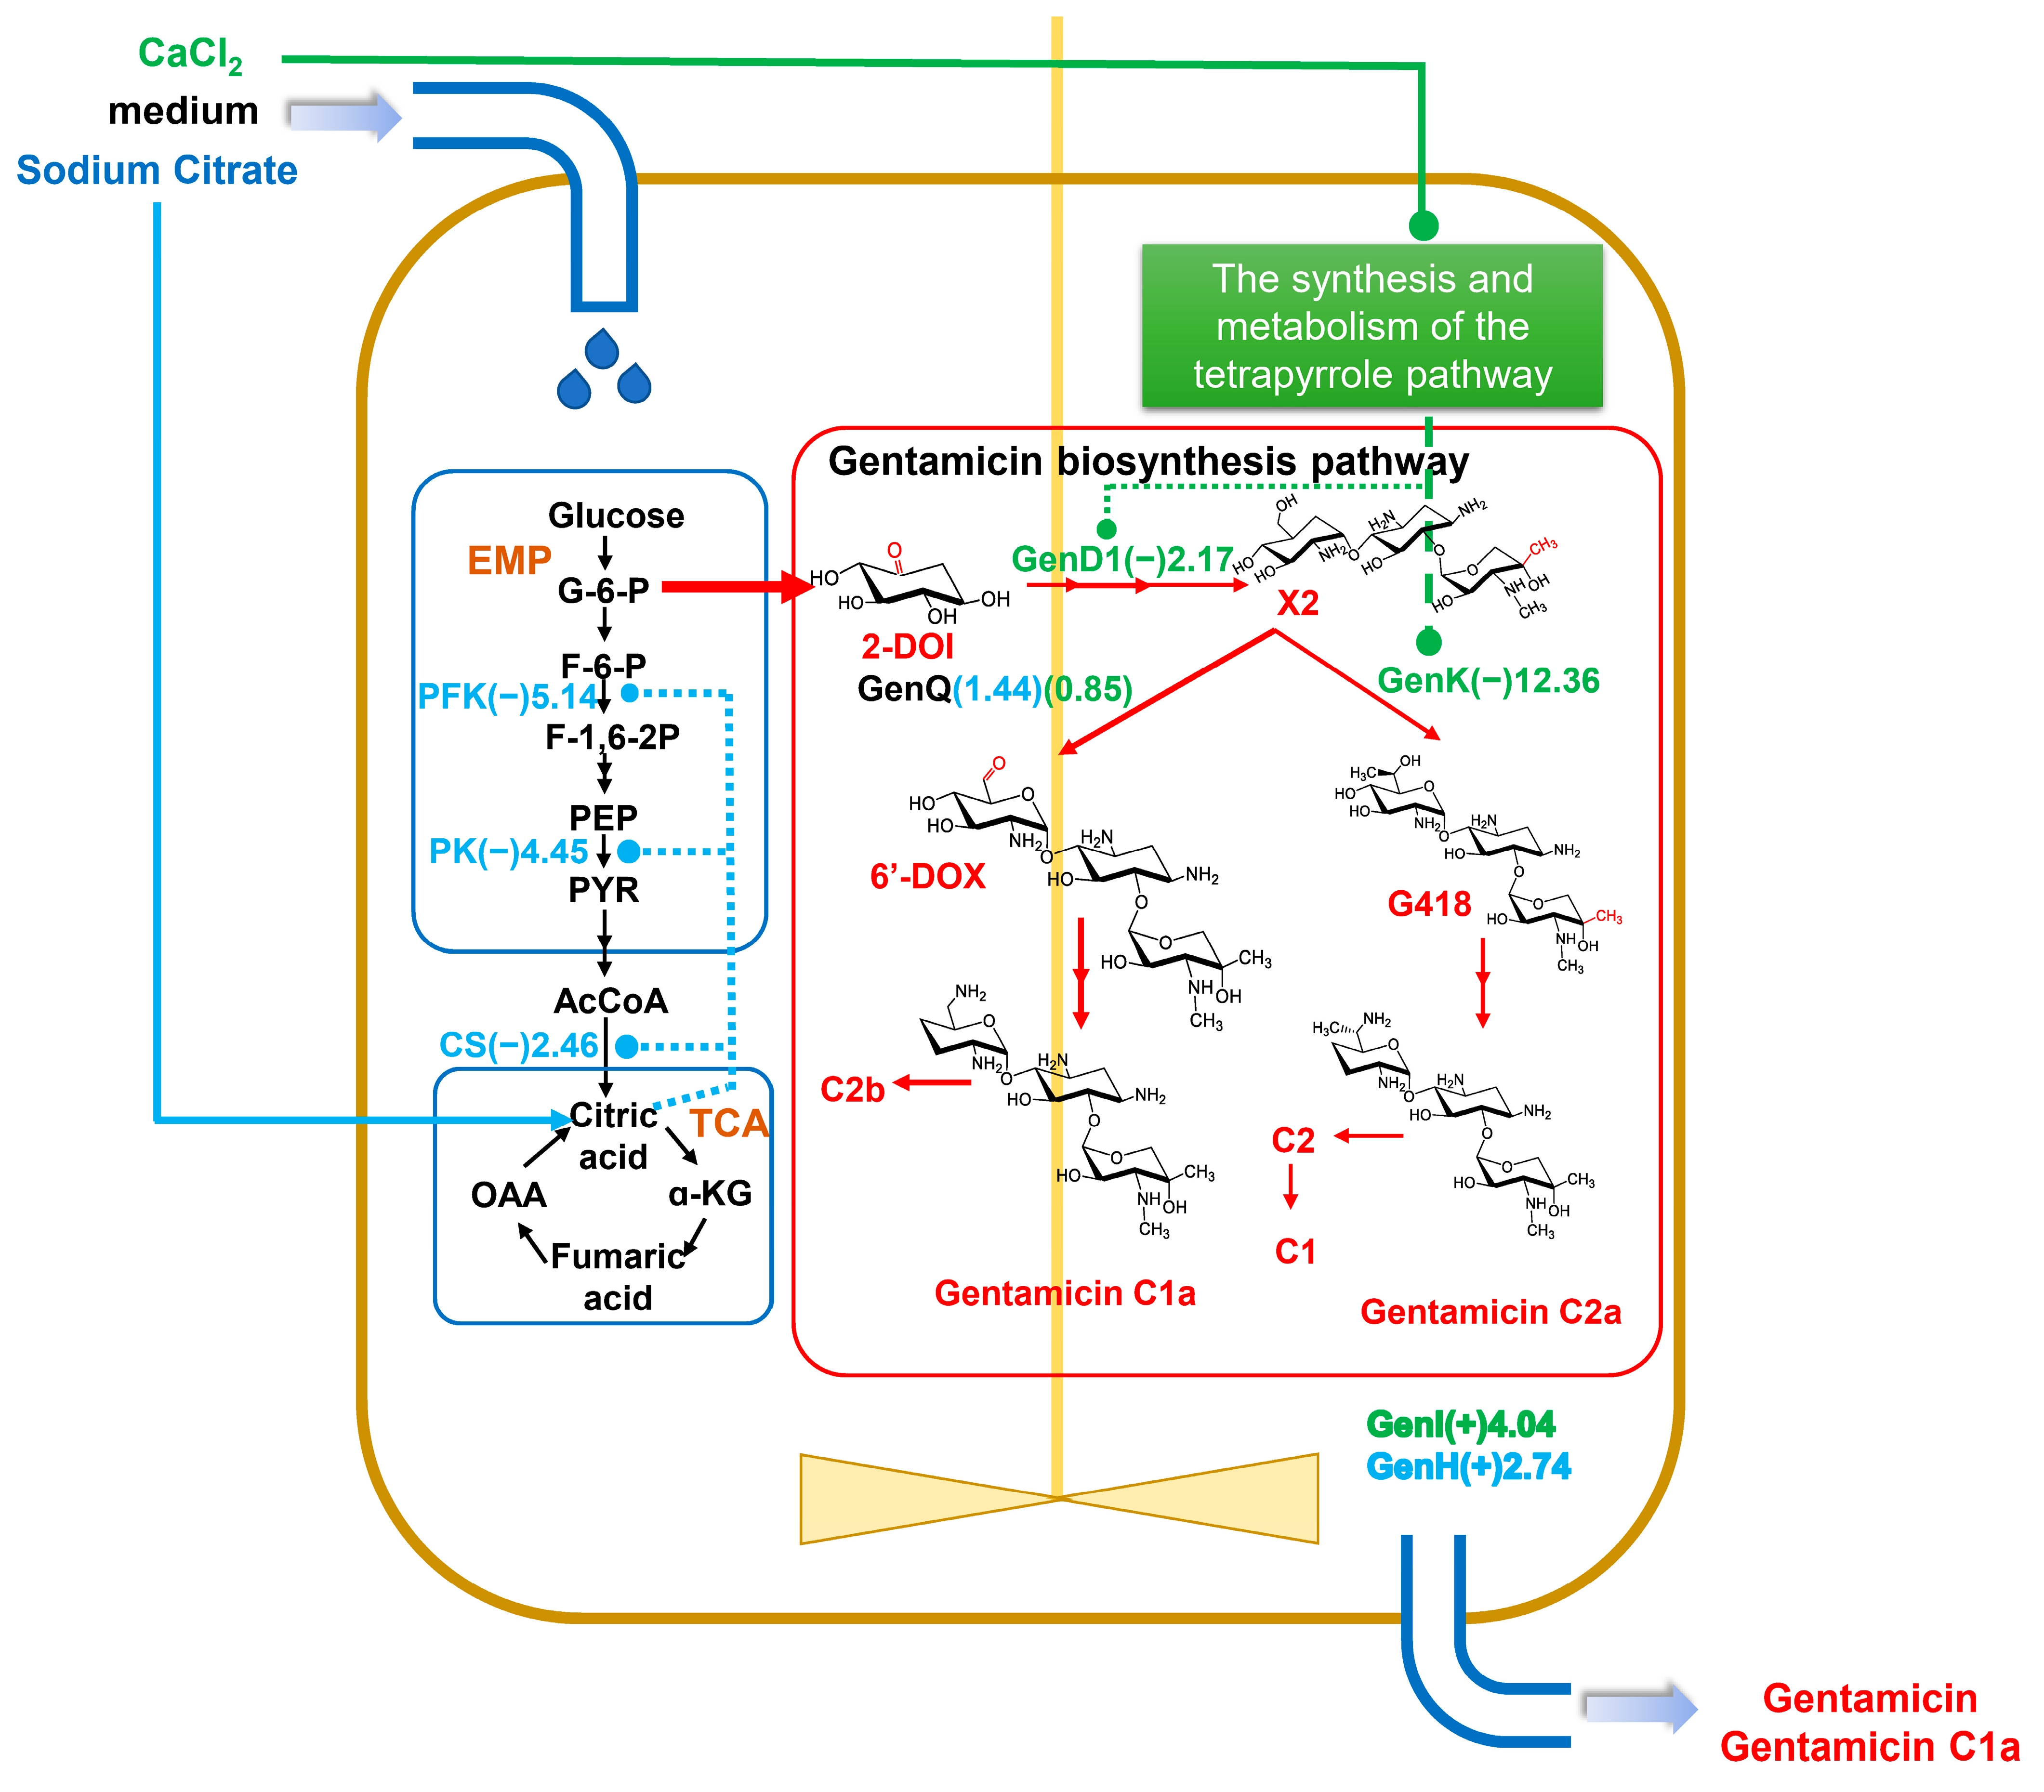
The biosynthesis of gentamicin can be divided into two processes, starting from D-glucose to the formation of the important gentamicin precursor A2, followed by the gradual formation of the gentamicin C mixture from gentamicin A2 catalyzed by a series of postmodifying enzymes (Figure 1). Thus, our focus was on the expression of specific enzymes in the gentamicin synthesis pathway. The outcomes revealed that the inclusion of CaCl2 or sodium citrate substantially increased the expression levels of a protein, referred to as the putative gentamicin exporter, GenI by 4.037-fold or the isoenzyme GenH by 2.74-fold, correspondingly. (Table S2) It is noteworthy that gentamicin X2 generates 6′-dehydro-6′-oxo-gentamicin X2 (6′-DOX) or G418 intermediates via the dehydrogenase GenQ or the methyltransferase GenK, respectively. These intermediates subsequently produce distinct fractions of gentamicin C1a or C2a after a series of reactions (Figure 1). The proteomic analysis demonstrated a significant reduction (0.08-fold) in GenK protein levels upon the addition of CaCl2, with no discernible effect on GenQ protein (Figure 9, Table S2). The previous GO analysis indicated that the CaCl2 addition significantly decreased the synthesis and metabolism of the tetrapyrrole pathway, affecting cobalamin (vitamin B12) synthesis (Figure 7C, Supplementary Figure S1). The GenK protein is a cobalamin- and radical SAM-dependent methyltransferase, and its significant downregulation may be thought to be a result of the impact of calcium chloride on cobalamin production. Another methyltransferase, GenD1 [13], is involved in the synthesis of gentamicin alongside GenK. However, the results indicate that GenD1 is less reliant on cobalamin compared to GenK, as it was only downregulated by a factor of 2.17 (0.46-fold) (Table S2). Conversely, sodium citrate exhibited no significant effect on the levels of either of these proteins. These findings suggest that CaCl2 influences the crucial GsenK protein and significantly boosts the proportion of the C1a fraction in gentamicin.
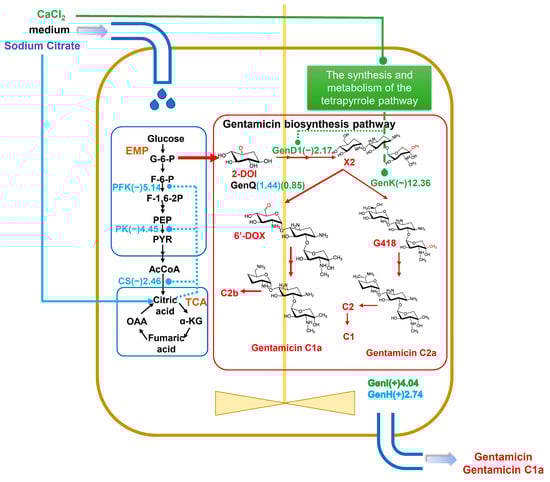
Figure 9.
The general changes in gentamicin biosynthesis pathway by CaCl2 and sodium citrate in Micromonospora echinospora. Blue represents changed protein by sodium citrate. Green represents changed protein by CaCl2. The number bracketed represents the fold change. Proteins with (+) fold changes represent upregulated proteins, while those with (−) fold changes represent downregulated proteins. EMP: Embden–Meyerhof pathway, glycolytic pathway; TCA: tricarboxylic acid cycle; 2-DOI: 2-deoxy-scyllo-inosose; X2: gentamicin X2; 6′-DOX: 6′-dehydro-6′-oxo-gentamicin X2. The black and red arrows in the figure direct the reaction process of biosynthesis. The blue arrow means the addition of sodium citrate.
Gentamicin biosynthesis is not only related to the biosynthesis and assembly of gentamicin but also to the metabolism of carbohydrates [6]. This is mainly because glucose-6-phosphate is an important precursor of gentamicin (Figure 1). As we can see from Figure 9, phosphofructokinase (A0A1C4YCI0) and pyruvate kinase (A0A1C4YHB7) levels were decreased in the glycolytic pathway (EMP), with the fold changes of 0.19 and 0.22, respectively; the citrate synthase (A0A1C5A2F4) level was decreased in tricarboxylic acid (TCA), with the fold change of 0.41 (Table S2, Supplementary Figures S2 and S3). The addition of sodium citrate significantly downregulated these three key enzymes, resulting in a weakening of the glycolytic pathway and inhibition of glucose consumption by the TCA pathway, consistent with the literature reports [28,29,30]. Furthermore, NADH and FADH2 cofactors were predominantly synthesized via the TCA cycle. The presence of sodium citrate hindered the glycolytic and TCA pathways, which resulted in a noteworthy reduction in cofactor biosynthesis in the KEGG analysis. GO enrichment analysis revealed a significant decrease in the process of cellular modified amino acid biosynthesis and metabolism, which could be a result of the downregulation of the primary metabolic process. The overall decrease in aminotransferase during gentamicin synthesis after adding sodium citrate (Table S2) could conceivably be influenced by these changes. Importantly, despite the diminishment of these enzymes, there was no concomitant decrease in the synthesis of gentamicin (Figure 3E). Therefore, the biosynthesis of gentamicin utilized higher amounts of glucose, which explains the significant increase in its overall effectiveness when added to sodium citrate (Figure 9).
Overall, CaCl2 increased the proportion of gentamicin C1a by interfering with methylation in gentamicin synthesis via vitamin B12 synthesis inhibition, while sodium citrate inhibited primary metabolism by influencing the metabolism of carbohydrates and boosted the production of gentamicin secondary metabolites.
4. Conclusions
This paper explored the impact of CaCl2 and sodium citrate on the gentamicin biosynthesis of M. echinospora through label-free proteomics. The findings of the study demonstrated that CaCl2 and sodium citrate exerted modulatory effects on gentamicin synthesis by perturbing the metabolic process of M. echinospora. CaCl2 disrupted methylation events in the biosynthesis of gentamicin through the inhibition of vitamin B12 synthesis, leading to an augmentation in the relative proportion of gentamicin C1a. Conversely, sodium citrate impeded primary metabolism by regulating carbohydrate metabolism, thereby facilitating the production of gentamicin secondary metabolites. This process innovation establishes a foundation for the simultaneous production of single-component gentamicin C1a and multicomponent gentamicin. It has the potential to serve as a framework for creating other intricate antimicrobial drug formulations. The study demonstrates the effectiveness of using sodium citrate in the biosynthesis of secondary metabolites, resulting in more efficient production methods. Additionally, the knowledge acquired from this investigation could advance the development of pharmaceutical manufacturing technologies, particularly in producing multicomponent drugs. Producers have the ability to refine production methods for cultivating multicomponent antimicrobials, to increase the proportion of valuable single components in multicomponent drugs, and to accomplish the simultaneous production of single-component and multicomponent pharmaceuticals. As a result, this can enhance efficiency and reduce costs.
In summary, the study’s findings identify promising directions for future antimicrobial drug biosynthesis research and pharmaceutical production applications, particularly in complex antimicrobial formulations. These advancements may catalyze the development of multicomponent drug biosynthesis in the evolution of pharmaceutical production technologies.
Supplementary Materials
The following supporting information can be downloaded at https://www.mdpi.com/article/10.3390/fermentation9120997/s1: Figure S1: The effect of adding CaCl2 on vitamin B12 biosynthesis pathway. Figure S2: The effect of adding sodium citrate on glycolytic pathway. Figure S3: The effect of adding sodium citrate on TCA pathway. Table S1: Effect of CaCl2 and sodium citrate on the fermentation process of gentamicin biosynthesis in M. echinospora. Table S2. Differentially expressed proteins potentially related to gentamicin biosynthesis.
Author Contributions
Conceptualization, H.L. and P.Y.; methodology, P.Y. and H.L.; software, P.Y.; validation, P.Y. and H.L.; formal analysis, P.Y. and H.L.; investigation, P.Y. and X.W.; resources, D.C., H.L. and Y.Y.; data curation, P.Y., H.L. and X.W.; writing—original draft preparation, P.Y. and X.W.; writing—review and editing, D.C., J.L., H.L. and Y.Y.; supervision, H.L. and P.Y.; project administration, J.L. and D.C.; funding acquisition, D.C. and Y.Y. All authors have read and agreed to the published version of the manuscript.
Funding
This research was funded in part by the National Key Research and Development Program of China (Grant Nos. 2022YFC2105400, 2018YFA0901900), the Project of Inner Mongolia Science and Technology Agency (Grant No. 2022YFHH0127), and the Inner Mongolia Autonomous Region—Shanghai Jiao Tong University Science and Technology Cooperation Special Project (Grant No. KJXM2022-02-05).
Institutional Review Board Statement
Not applicable.
Informed Consent Statement
Not applicable.
Data Availability Statement
The proteomics data were deposited at iProX with the accession number: IPX0007313003.
Conflicts of Interest
The authors state that they have no competing interest. The funding sources did not play a role in the study design, data collection, analysis and interpretation, manuscript writing, or decision to publish the findings.
References
- Weinstein, M.J.; Luedemann, G.M.; Oden, E.M.; Wagman, G.H.; Rosselet, J.P.; Marquez, J.A.; Coniglio, C.T.; Charney, W.; Herzog, H.L.; Black, J. Gentamicin, a New Antibiotic Complex from Micromonospora. J. Med. Chem. 1963, 6, 463–464. [Google Scholar] [CrossRef] [PubMed]
- Gentamicin. Available online: https://list.essentialmeds.org/medicines/229 (accessed on 14 October 2023).
- Borovinskaya, M.A.; Pai, R.D.; Zhang, W.; Schuwirth, B.S.; Holton, J.M.; Hirokawa, G.; Kaji, H.; Kaji, A.; Cate, J.H. Structural basis for aminoglycoside inhibition of bacterial ribosome recycling. Nat. Struct. Mol. Biol. 2007, 14, 727–732. [Google Scholar] [CrossRef] [PubMed]
- Ng, M.Y.; Zhang, H.; Weil, A.; Singh, V.; Jamiolkowski, R.; Baradaran-Heravi, A.; Roberge, M.; Jacobson, A.; Friesen, W.; Welch, E.; et al. New in Vitro Assay Measuring Direct Interaction of Nonsense Suppressors with the Eukaryotic Protein Synthesis Machinery. ACS Med. Chem. Lett. 2018, 9, 1285–1291. [Google Scholar] [CrossRef] [PubMed]
- Li, S.; Santos Bury, P.D.; Huang, F.; Guo, J.; Sun, G.; Reva, A.; Huang, C.; Jian, X.; Li, Y.; Zhou, J.; et al. Mechanistic Insights into Dideoxygenation in Gentamicin Biosynthesis. ACS Catal. 2021, 11, 12274–12283. [Google Scholar] [CrossRef]
- Xu, F.; Zhang, X.; Liu, L.; Ke, X.; Wu, J.; Guo, Y.; Tian, X.; Chu, J. Engineering the methyltransferase through inactivation of the genK and genL leads to a significant increase of gentamicin C1a production in an industrial strain of Micromonospora echinospora 49-92S. Bioprocess. Biosyst. Eng. 2022, 45, 1693–1703. [Google Scholar] [CrossRef] [PubMed]
- Kim, H.J.; Liu, Y.N.; McCarty, R.M.; Liu, H.W. Reaction Catalyzed by GenK, a Cobalamin-Dependent Radical S-Adenosyl-l-methionine Methyltransferase in the Biosynthetic Pathway of Gentamicin, Proceeds with Retention of Configuration. J. Am. Chem. Soc. 2017, 139, 16084–16087. [Google Scholar] [CrossRef] [PubMed]
- Zhou, S.; Chen, X.; Ni, X.; Liu, Y.; Zhang, H.; Dong, M.; Xia, H. Pyridoxal-5′-phosphate-dependent enzyme GenB3 Catalyzes C-3′,4′-dideoxygenation in gentamicin biosynthesis. Microb. Cell Fact. 2021, 20, 65. [Google Scholar] [CrossRef]
- Chen, X.; Zhang, H.; Zhou, S.; Bi, M.; Qi, S.; Gao, H.; Ni, X.; Xia, H. The bifunctional enzyme, GenB4, catalyzes the last step of gentamicin 3′,4′-di-deoxygenation via reduction and transamination activities. Microb. Cell Fact. 2020, 19, 62. [Google Scholar] [CrossRef]
- de Araújo, N.C.; Bury, P.D.S.; Tavares, M.T.; Huang, F.; Parise-Filho, R.; Leadlay, P.; Dias, M.V.B. Crystal Structure of GenD2, an NAD-Dependent Oxidoreductase Involved in the Biosynthesis of Gentamicin. ACS Chem. Biol. 2019, 14, 925–933. [Google Scholar] [CrossRef]
- Li, S.; Guo, J.; Reva, A.; Huang, F.; Xiong, B.; Liu, Y.; Deng, Z.; Leadlay, P.F.; Sun, Y. Methyltransferases of gentamicin biosynthesis. Proc. Natl. Acad. Sci. USA 2018, 115, 1340–1345. [Google Scholar] [CrossRef]
- Bury, P.D.S.; Huang, F.; Li, S.; Sun, Y.; Leadlay, P.F.; Dias, M.V.B. Structural Basis of the Selectivity of GenN, an Aminoglycoside N-Methyltransferase Involved in Gentamicin Biosynthesis. ACS Chem. Biol. 2017, 12, 2779–2787. [Google Scholar] [CrossRef]
- Huang, C.; Huang, F.; Moison, E.; Guo, J.; Jian, X.; Duan, X.; Deng, Z.; Leadlay, P.F.; Sun, Y. Delineating the biosynthesis of gentamicin x2, the common precursor of the gentamicin C antibiotic complex. Chem. Biol. 2015, 22, 251–261. [Google Scholar] [CrossRef]
- Kim, H.J.; McCarty, R.M.; Ogasawara, Y.; Liu, Y.N.; Mansoorabadi, S.O.; LeVieux, J.; Liu, H.W. GenK-catalyzed C-6′ methylation in the biosynthesis of gentamicin: Isolation and characterization of a cobalamin-dependent radical SAM enzyme. J. Am. Chem. Soc. 2013, 135, 8093–8096. [Google Scholar] [CrossRef] [PubMed]
- Saleh, P.; Abbasalizadeh, S.; Rezaeian, S.; Naghavi-Behzad, M.; Piri, R.; Pourfeizi, H.H. Gentamicin-mediated ototoxicity and nephrotoxicity: A clinical trial study. Niger. Med. J. 2016, 57, 347–352. [Google Scholar] [CrossRef] [PubMed]
- Shao, W.; Zhong, D.; Jiang, H.; Han, Y.; Yin, Y.; Li, R.; Qian, X.; Chen, D.; Jing, L. A new aminoglycoside etimicin shows low nephrotoxicity and ototoxicity in zebrafish embryos. J. Appl. Toxicol. 2021, 41, 1063–1075. [Google Scholar] [CrossRef] [PubMed]
- Yao, L.; Zhang, J.W.; Chen, B.; Cai, M.M.; Feng, D.; Wang, Q.Z.; Wang, X.Y.; Sun, J.G.; Zheng, Y.W.; Wang, G.J.; et al. Mechanisms and pharmacokinetic/pharmacodynamic profiles underlying the low nephrotoxicity and ototoxicity of etimicin. Acta Pharmacol. Sin. 2020, 41, 866–878. [Google Scholar] [CrossRef] [PubMed]
- Zhao, C.; Li, J.; Hou, J.; Guo, M.; Zhang, Y.; Chen, Y. A randomized controlled clinical trial on etimicin, a new aminoglycoside antibiotic, versus netilmicin in the treatment of bacterial infections. Chin. Med. J. 2000, 113, 1026–1030. [Google Scholar]
- Li, D.; Li, H.; Ni, X.; Zhang, H.; Xia, H. Construction of a gentamicin C1a-overproducing strain of Micromonospora purpurea by inactivation of the gacD gene. Microbiol. Res. 2013, 168, 263–267. [Google Scholar] [CrossRef]
- Wu, Z.; Gao, W.; Zhou, S.; Wen, Z.; Ni, X.; Xia, H. Improving gentamicin B and gentamicin C1a production by engineering the glycosyltransferases that transfer primary metabolites into secondary metabolites biosynthesis. Microbiol. Res. 2017, 203, 40–46. [Google Scholar] [CrossRef]
- Wei, Z.; Shi, X.; Lian, R.; Wang, W.; Hong, W.; Guo, S. Exclusive Production of Gentamicin C1a from Micromonospora purpurea by Metabolic Engineering. Antibiotics 2019, 8, 267. [Google Scholar] [CrossRef]
- Li, J.a.; Lin, H.; Chen, D. Practice of “Co-production” Process Innovation in the Production of Aminoglycoside Antibiotics and the Potential Application for Other Products. Chin. J. Pharm. 2020, 51, 1347–1355. [Google Scholar] [CrossRef]
- Testa, R.T.; Tilley, B.C. Biosynthesis of sisomicin and gentamicin. Jpn. J. Antibiot. 1979, 32, S47–S59. [Google Scholar] [PubMed]
- Krasnova, T.P.; Laznikova, T.N.; Likina, E.V.; Orlova, N.V. Role of cobalt in the biosynthesis of the components of the gentamicin complex. Antibiotiki 1978, 23, 12–18. [Google Scholar] [PubMed]
- Chu, J.; Niu, W.; Zhang, S.; Zhuang, Y.; Hu, H.; Li, Y. Effect of metal ions on the binding of gentamicin to the peptidoglycan of Micromonospora echinospora. Process. Biochem. 2004, 39, 1145–1150. [Google Scholar] [CrossRef]
- Porretta, S.; Sandei, L.; Crucitti, P.M.; Poli, G.; Attolini, M.G. Comparison of the main analytical methods used in quality-control of tomato paste. Int. J. Food Sci. Technol. 1992, 27, 145–152. [Google Scholar] [CrossRef]
- Zeleny, L. The action of formaldehyde on amino acids with special reference to the formation of amines. J. Biol. Chem. 1930, 90, 427–441. [Google Scholar] [CrossRef]
- Chen, S.; Chu, J.; Zhuang, Y.; Zhang, S. Enhancement of inosine production by Bacillus subtilis through suppression of carbon overflow by sodium citrate. Biotechnol. Lett. 2005, 27, 689–692. [Google Scholar] [CrossRef] [PubMed]
- Gao, Y.; Liu, N.; Zhu, Y.; Yu, S.; Liu, Q.; Shi, X.; Xu, J.; Xu, G.; Zhang, X.; Shi, J.; et al. Improving glutathione production by engineered Pichia pastoris: Strain construction and optimal precursor feeding. Appl. Microbiol. Biotechnol. 2022, 106, 1905–1917. [Google Scholar] [CrossRef] [PubMed]
- Wu, H.; Guo, Y.; Chen, L.; Chen, G.; Liang, Z. A Novel Strategy to Regulate 1-Deoxynojirimycin Production Based on Its Biosynthetic Pathway in Streptomyces lavendulae. Front. Microbiol. 2019, 10, 1968. [Google Scholar] [CrossRef]
- Wang, S.C. Cobalamin-dependent radical S-adenosyl-l-methionine enzymes in natural product biosynthesis. Nat. Prod. Rep. 2018, 35, 707–720. [Google Scholar] [CrossRef]
- Hong-liang, H. Research Progress on Gentamicin. Strait Pharm. J. 2009, 21, 5–8. [Google Scholar]
- O’Brien, E.J.; Monk, J.M.; Palsson, B.O. Using Genome-scale Models to Predict Biological Capabilities. Cell 2015, 161, 971–987. [Google Scholar] [CrossRef]
- Kanehisa, M.; Furumichi, M.; Sato, Y.; Kawashima, M.; Ishiguro-Watanabe, M. KEGG for taxonomy-based analysis of pathways and genomes. Nucleic Acids Res. 2023, 51, D587–D592. [Google Scholar] [CrossRef] [PubMed]

Disclaimer/Publisher’s Note: The statements, opinions and data contained in all publications are solely those of the individual author(s) and contributor(s) and not of MDPI and/or the editor(s). MDPI and/or the editor(s) disclaim responsibility for any injury to people or property resulting from any ideas, methods, instructions or products referred to in the content. |
© 2023 by the authors. Licensee MDPI, Basel, Switzerland. This article is an open access article distributed under the terms and conditions of the Creative Commons Attribution (CC BY) license (https://creativecommons.org/licenses/by/4.0/).