Article

Phenotypic Characterization of Fermentation Performance and Stress Tolerance in Commercial Ale Yeast Strains

by
Anqi Chen
1,*,
Qiqi Si
1,
Qingyun Xu
1,
Chenwei Pan
1,2,
Yuhan Cheng
1 and
Jian Chen
1
1
Science Center for Future Foods, Jiangnan University, Wuxi 214122, China
2
Jiaxing Institute of Future Food, Jiaxing 314050, China
*
Author to whom correspondence should be addressed.
Fermentation 2024, 10(7), 364; https://doi.org/10.3390/fermentation10070364
Submission received: 24 June 2024 / Revised: 3 July 2024 / Accepted: 10 July 2024 / Published: 18 July 2024
(This article belongs to the Special Issue Saccharomyces cerevisiae Strains and Fermentation: 2nd Edition)

Abstract

:
Yeast plays a crucial role in the fermentation industry, particularly in alcoholic beverage production, where robustness and metabolic flexibility are essential. This study aimed to investigate the stress tolerance and metabolic capabilities of seven commercial ale yeast strains under various stress conditions, including temperature, pH, osmotic pressure, glucose starvation, and ethanol concentration. Detailed growth assays and stress tolerance tests were utilized to evaluate fermentation efficiency, carbon source utilization, and stress adaptation. Significant variability was observed among the strains. ACY169 and ACY150 demonstrated high overall stress tolerance, making them suitable for high-gravity brewing and processes involving extreme temperature fluctuations. ACY10 showed robust performance under acid stress, making it ideal for sour beer production. In contrast, ACY5 exhibited limited adaptability under stress, with longer doubling times and reduced metabolic activity. The study also revealed differences in carbon source utilization, with ACY169 displaying exceptional metabolic versatility by efficiently fermenting various sugars, including glucose, fructose, maltose, and raffinose. ACY10 and ACY150 exhibited balanced fermentation profiles with high ethanol production rates, while ACY9 demonstrated the highest glucose consumption rate but lower ethanol yields and significant acidification.

1. Introduction

The fermentation industry, especially in alcoholic beverage production, heavily relies on the robustness and metabolic flexibility of yeast strains [1,2]. Yeast plays a crucial role in converting sugars into ethanol and CO2 during fermentation. The efficiency and quality of this process are influenced by various stress factors such as temperature, pH, osmotic pressure, and ethanol concentration [3,4]. Yeast strains must endure multiple stress conditions, including high sugar concentrations, low pH levels, and elevated ethanol levels, all of which can be inherently toxic to cells [5]. Additionally, temperature fluctuations during fermentation and storage can impact yeast viability and performance [6,7]. However, many widely used commercial yeast strains are not well-studied in terms of their stress tolerance and metabolic capabilities. Understanding these characteristics is crucial as it can help in optimizing fermentation processes, improving product quality, and ensuring consistency in large-scale beer production.
Several studies highlight the practical applications of stress-tolerant yeast strains in the brewing industry. For example, the use of osmotolerant yeast strains in high-gravity brewing can result in higher ethanol production efficiency [8,9]. High-gravity brewing involves fermenting wort with a high sugar concentration, leading to increased osmotic stress on yeast [10]. In addition to osmotic stress, yeast strains must also contend with ethanol stress, which can inhibit cell growth and fermentation efficiency [11]. Strains with high ethanol tolerance are particularly useful for producing high-strength beers, as they can maintain cellular integrity and function in high-alcohol environments [12]. Yeast strains must also manage glucose limitation, a common stress in brewing when fermentable sugars become scarce towards the end of the fermentation process [13]. In addition, yeast strains that can efficiently utilize alternative carbon sources and maintain metabolic activity under low-glucose conditions are highly valuable [14]. For instance, certain yeast strains have been selected for their ability to upregulate pathways that metabolize non-fermentable carbon sources, ensuring continued fermentation activity even when glucose levels are low [15].
The application of stress-tolerant yeast strains in the brewing industry not only improves the efficiency of the fermentation process but also enhances the sensory qualities of the beer [16]. By selecting and utilizing yeast strains that can withstand various stresses, brewers can produce a wide range of beer styles with consistent quality and unique flavor profiles. This study aims to fill the gap in knowledge about the stress tolerance and metabolic capabilities of widely used commercial yeast strains. By systematically evaluating these characteristics, this research seeks to identify strains that can be optimized for better performance under industrial brewing conditions.

2. Materials and Methods

2.1. Yeast Strains

The yeast strains employed in this study are detailed in Table 1. Seven commercial ale yeast strains for alcoholic beverage production were employed in this study. The strains included WLP001 California Ale, WLP004 Irish Ale Yeast, and WLP300 Hefeweizen Ale Yeast from White Labs, as well as Lalvin 71B, Lalvin BM45, Lalvin ICV D254, and Lalvin V1116 from Lallemand. ACY283 is a prototrophic HAP1+ derivative of FY4, repaired for the HAP1 gene and retaining the GAL+ phenotype, enabling normal galactose metabolism. As a prototrophic strain, ACY283 can grow without supplementary amino acids or nucleotides. The construction details of HAP1-repaired, GAL+, prototrophic derivatives of S288C are described by [17]. This lab strain was included to compare its performance with other yeast strains in various experiments. The commercial yeast powders were inoculated into YPD medium, and single colonies were isolated. These isolated colonies were preserved in glycerol solution at −80 °C and used for all subsequent tests to ensure consistency in the experiments.

2.2. Media

The strains used in this study were maintained and propagated using protocols adapted from a previous study, ensuring the reproducibility and reliability of growth conditions [18]. Yeast cell growth was facilitated using two main types of media: minimal and rich. Minimal media consisted of 0.67% w/v yeast nitrogen base (YNB) without amino acids (Solarbio, Beijing, China) and 2% w/v of various carbon sources, depending on the experimental requirements. Rich media were prepared with 2% w/v Bacto peptone (OXOID, Basingstoke, UK), 1% w/v yeast extract (OXOID, Basingstoke, UK), and 2% w/v of specified carbon sources to support optimal yeast growth and development. Solid media incorporated 2% w/v agar (Solarbio, Beijing, China) into the above media and was sterilized and poured into 9 cm Petri dishes (SUPIN, Nantong, China) for culturing.

2.3. Microscopic Imaging of Yeast Morphology

Yeast strains were grown in YPD medium (1% yeast extract, 2% peptone, 2% dextrose) until the stationary phase. Cultures were inoculated into 5 mL of YPD and incubated at 30 °C with shaking at 200 RPM. After reaching the stationary phase, cultures were diluted 1:10 with sterile distilled water. Then, 2 µL of the diluted culture was placed on a microscope slide and covered with a coverslip. Slides were observed under a microscope at 400× magnification, and images were captured using an Olympus BX51 microscope (Olympus Corporation, Tokyo, Japan) with a digital camera (Figure 1). Images were processed with ImageJ software 1.54J for clarity and consistency.

2.4. Fermentation Parameters Measurement

Yeast strains were inoculated into a fermentation medium at an initial optical density (OD600) of 0.1. The fermentation was conducted in a 300 mL flask containing 100 mL of YPD. The fermentation process was maintained at 30 °C with constant agitation at 200 RPM to ensure homogeneity. Samples were taken at regular intervals over a 48 h period. pH was measured before and after fermentation, while residual glucose was measured at 0, 6, 8, 10, 12, 14, and 16 h timepoints. OD600 and ethanol production were measured at 0, 6, 8, 10, 12, 14, 16, 18, 24, 30, 42, and 48 h timepoints. OD600 was measured to monitor yeast growth and cell density. Then, 1 mL of the fermentation sample was diluted 1:10 with sterile distilled water to bring the OD600 within the linear range of the spectrophotometer. The diluted sample was then transferred to a cuvette, and the OD600 was measured using a UV–Vis spectrophotometer (Spectronic 200, Thermo Fisher Scientific, Waltham, MA, USA), with values corrected for the dilution factor. The pH of each sample was measured to monitor changes in acidity during fermentation using a calibrated pH meter (SevenCompact S210, Mettler Toledo, Columbus, OH, USA) with an appropriate probe. Residual glucose and ethanol production were measured using a biosensor (Siemans, Munich, Germany). The biosensor was calibrated according to the manufacturer’s instructions before each measurement. Then, 1 mL of each sample was filtered to remove yeast cells, and the filtrate was analyzed by the biosensor to determine the concentrations of residual glucose and ethanol.
The average glucose consumption rate (g/L/h) and average ethanol production rate (g/L/h) were calculated by determining the changes in glucose and ethanol concentrations over specific time intervals. The average glucose consumption rate was calculated using the following equation [19]:
average   glucose   consumption   rate = ( i = 1 n G i 1 G i t i t i 1 ) / n
where Gi and Gi−1 are the glucose concentrations at consecutive time points ti and ti−1, respectively, and n is the number of intervals. Similarly, the average ethanol production rate was determined using the equation [20]:
average   ethanol   production   rate = ( i = 1 n E i 1 E i t i t i 1 ) / n
where Ei and Ei−1 are the ethanol concentrations at consecutive time points ti and ti−1, respectively, and n is the number of intervals.

2.5. Cell Density Measurement and Doubling Time Calculation

Cell density was measured by absorbance at 600 nm using either a Genesys 6 UV–Vis spectrophotometer (JINGHUA, Shanghai, China) or a Synergy H1 Hybrid reader (BioTek, Winooski, VT, USA). For plate reader assays, yeast cultures were inoculated at an initial OD600 of 0.05 and dispensed into 96-well plates at a volume of 200 μL per well. The plates were then sealed with Breathe-Easy gas-permeable membranes (Research Products International Corporation, Mt. Prospect, IL, USA) to allow for proper gas exchange. The sealed 96-well plates were incubated at 30 °C with double orbital shaking at a speed of 559 cpm to ensure uniform growth. The plates were incubated according to the temperatures and durations specified in the study figures and captions. Doubling time was calculated using the following equation [21]:
Td = t × log2/log (Nt/N0)
where Td is the doubling time, t is the time interval between measurements, N0 is the initial cell density (OD600 at the beginning of the log phase), and Nt is the cell density (OD600) at the end of the time interval. This calculation provides an estimate of the time taken for the yeast population to double in number under the specified growth conditions. The following stress conditions were tested as described above; osmotic stress was induced using 1 M sorbitol in YPD, ethanol stress was applied using 10% ethanol in YPD, glucose starvation was achieved with 0.5% glucose in YP, cold tolerance was tested by incubating the cultures at 4 °C for 3 days followed by recovery in YPD, and acid tolerance was assessed using YPD adjusted to pH 2.2.

2.6. Assessment of Thermotolerance

Yeast strains were inoculated in YNB media containing 2% glucose and cultured overnight at 30 °C. For heat shock, 0.8 mL of each culture was transferred to a microcentrifuge tube (BBI, Shanghai, China) and incubated at 45 °C for 1 h in a thermomixer (BIOER, Hangzhou, China). Control aliquots were kept at 30 °C. Post-heat-shock viability was measured by plating dilutions on YPD agar and counting colony-forming units after 2–3 days of incubation at 30 °C. A minimum of three biological replicates per assay were performed.

2.7. Measurement of Trehalose

To assess yeast intracellular trehalose level, stationary-phase yeast cultures with an OD600 value of 2 were divided. One aliquot was treated with trehalose to a final concentration of 1 g/L, creating the experimental group, while the second aliquot, serving as the control, received sterile water. Both samples underwent incubation at 30 °C with agitation at 220 rpm for two hours, enabling the yeast cells to internalize the exogenous trehalose. Post incubation, cells were pelleted by centrifugation, washed with deionized water to remove residual extracellular trehalose, and subsequently lysed following the protocol from the Megazyme Trehalose Assay Kit (Megazyme, Bray, Ireland). The lysis procedure ensured the breakdown of cells and the elimination of interfering reducing sugars. For quantification, a 20 µL sample of the lysate was treated with 0.5 µL of trehalase enzyme and incubated at 37 °C for 16 h to ensure complete hydrolysis of trehalose. The glucose generated from the hydrolyzed trehalose was measured with a Glucose Assay Kit (Nanjing Jiancheng, Nanjing, China). The glucose levels were then compared to a glucose standard curve to calculate the net trehalose uptake by comparing the trehalose content in the experimental and control groups.

2.8. Measurement of Reactive Oxygen Species (ROS) Levels

Yeast cells were grown in YNB media containing 2% glucose to logarithmic (OD600 ≈ 0.5) or stationary (OD600 ≈ 2), respectively. After reaching the desired growth phase, cells were diluted in phosphate-buffered saline (PBS) to a working concentration and transferred to 1.5 mL microfuge tubes. To this cell suspension, 1 µL of 2′,7′-dichlorodihydrofluorescein diacetate (DCFH-DA) from a 5 mg/mL stock solution was added. The tubes were gently mixed by pipetting and then placed in a shaking incubator at 30 °C for 1 h to allow for the uptake and oxidation of the probe by ROS within the cells. Following incubation, cells were collected by centrifugation at 6000 rpm for 3 min at room temperature, the supernatant was discarded, and the cell pellet was retained. The cells were washed with 500 µL of 1× PBS and centrifuged again under the same conditions. This washing step was repeated at least three times to remove any remaining DCFH-DA probe. The final cell pellet was resuspended in 600 µL of 1× PBS. A 200 µL aliquot of this suspension was transferred to a 96-well plate for fluorescence measurement. The microplate reader (BioTek) was programmed to measure fluorescence intensity at an endpoint, with a monochromator set to an excitation wavelength of 488 nm and emission wavelength of 525 nm.

2.9. Stress Tolerance Assessment

Stress tolerance for each yeast strain was quantitatively assessed by measuring three growth parameters: doubling time, maximum optical density (OD600), and time to reach log phase. These metrics were assigned respective weights of 0.4, 0.3, and 0.3 to reflect their relative importance. For each metric, the mean and standard deviation were calculated from the collective performance of all strains. The z-score for each strain within each metric was computed using the following formula:
z = (X − μ)/σ
where X is the value for the strain, μ is the mean for that metric, and σ is the standard deviation for that metric. The z-scores provide a standardized measure of how each strain performs relative to the population mean. To ensure all scores were on a positive scale and to normalize the range between 0 and 1, the z-scores were adjusted using the following formula [22]:
Normalized score = (z − min(z))/((max(z) − min(z))
where min (z) and max (z) are the minimum and maximum z-scores for the metric. In metrics where a lower value indicated higher stress tolerance, such as doubling time, the z-score was inverted to reflect the appropriate direction of tolerance. The final z-scores were then weighted according to the relative importance of each metric, resulting in a composite stress tolerance score for each yeast strain. The composite score was calculated using the following formula:
Composite score = 0.4 × normalized doubling time + 0.3 × normalized OD600 + 0.3 × normalized time to log phase
All experiments were conducted using at least three independent biological replicates to ensure accuracy and reproducibility.

2.10. Statistical Analysis

A multivariate analysis of variance (MANOVA) using Wilks’ lambda was performed to evaluate the significance of differences among yeast strains under acid stress (pH 2.2), 10% ethanol stress, and osmotic stress (1 M sorbitol). The dependent variables included doubling time, maximum OD600, and time before entering the log phase. Data collection involved measuring these variables for each strain, tested in triplicate. The MANOVA was conducted using SPSS with the following model formula [23]:
MANOVA (doubling time + maximum OD600 + time before log phase ∼ Strain)
Wilks’ lambda tested the null hypothesis of no significant differences among strains. Values closer to 0 indicated stronger effects. Significance was assessed using the F-value and p-value, with p < 0.05 considered significant.

3. Results

3.1. Fermentation Profile

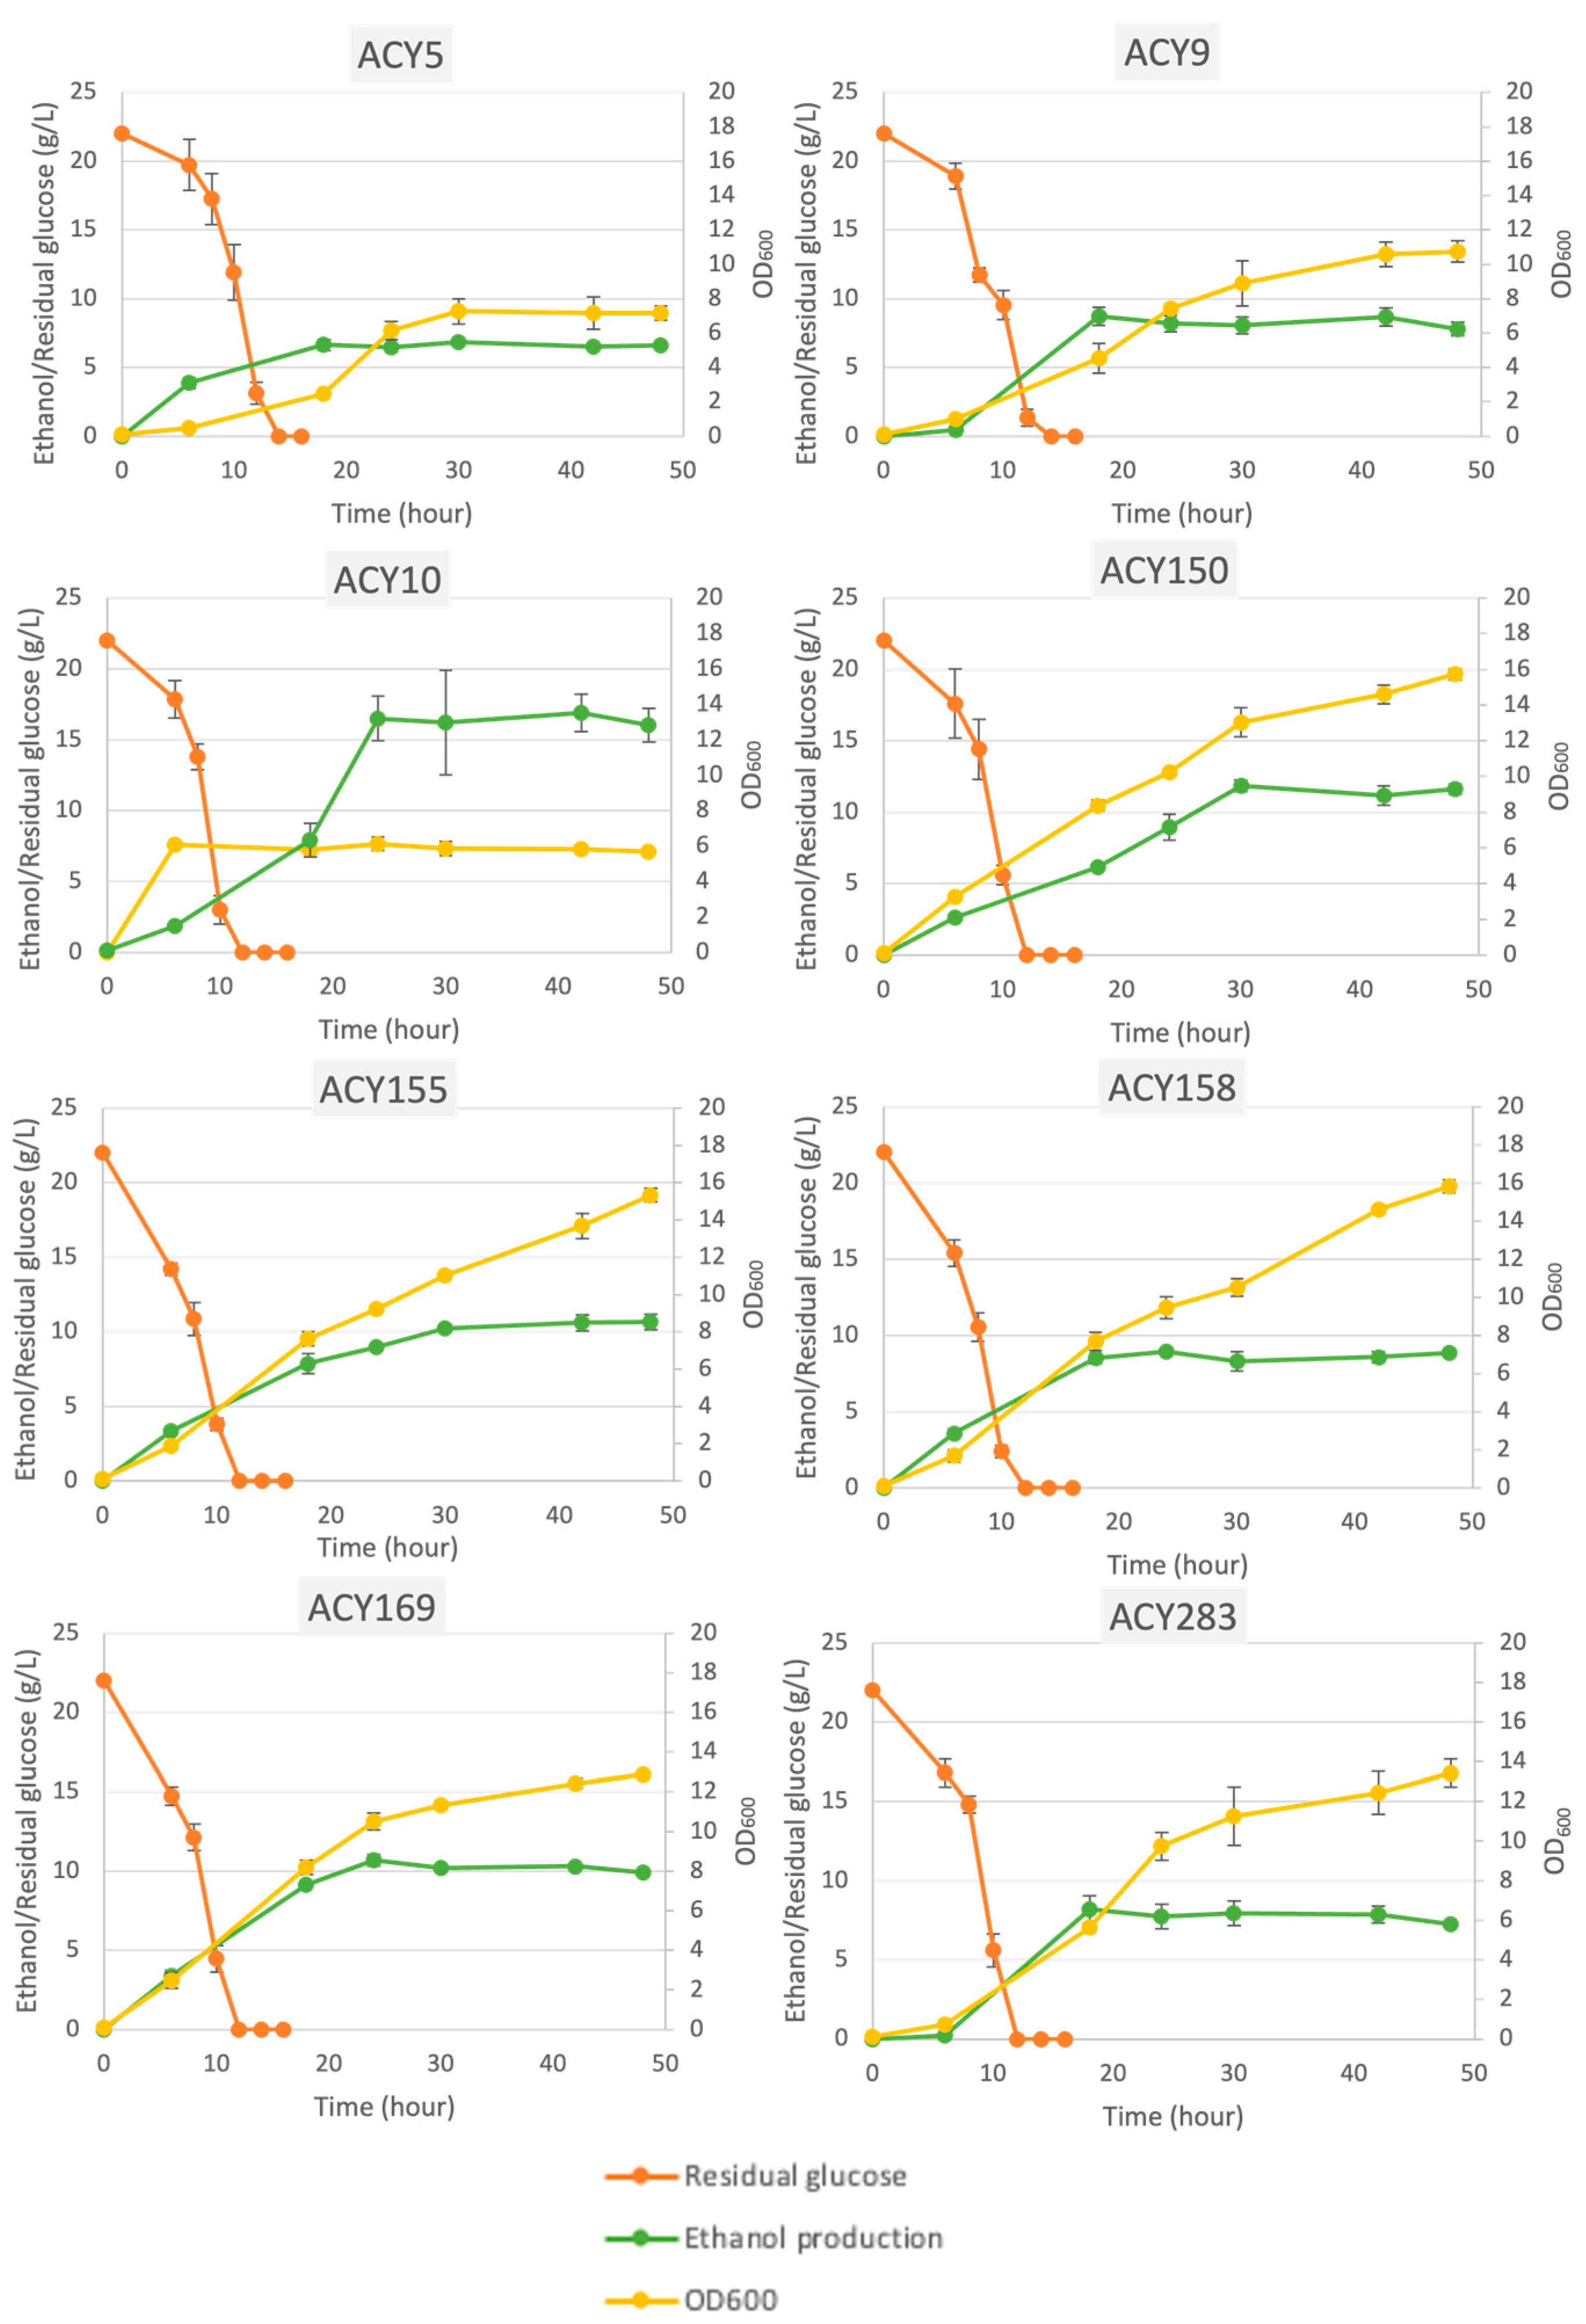
The fermentation profiles of the tested yeast strains are summarized in Table 1, and the fermentation kinetics are illustrated in Figure 2. ACY5 and ACY150 showed efficient glucose utilization with moderate ethanol yields and minimal to moderate pH changes, indicating balanced fermentation profiles suitable for general use. ACY150, in particular, had one of the highest ethanol production rates (0.255 g/L/h). ACY9 demonstrated a glucose consumption rate of 0.661 g/L/h and produced ethanol at a rate of 0.236 g/L/h, accompanied by the most substantial pH drop (1.947). This suggests a robust fermentation profile with significant acidification.
ACY10 stood out for its high glucose consumption (0.996 g/L/h) and notable ethanol production rate (0.197 g/L/h) among the strains tested, along with a moderate pH change (−1.487). The lab strain S288C derivative had the lowest glucose consumption rate (0.658 g/L/h) and the lowest ethanol production rate (0.023 g/L/h) with minimal pH change (−0.353), indicating less efficiency compared to commercial strains. In Figure 2, the sugar in the ACY10 and ACY150 fermentation broths was exhausted within about 10 h of fermentation, but ethanol production continued to increase significantly.
This observation raises questions about ethanol production in the absence of sugar. Normally, without sugar, yeast would lack a carbon source for anaerobic fermentation. However, ethanol production can occur through the metabolism of stored glycogen or intermediary metabolites formed during initial fermentation stages [24]. The metabolic pathways of yeast proliferation and alcohol production differ. Generally, ethanol is produced anaerobically after aerobic proliferation. The increase in ethanol production and OD value in the absence of sugar suggests that the yeast strains might be utilizing alternative metabolic pathways or stored internal resources [1].
Strains ACY150, 155, 158, and 283 exhibit this phenomenon, indicating these strains may have mechanisms through which to continue ethanol production after external sugar depletion. This could be due to intracellular reserves or efficient recycling of metabolic intermediates [25]. These results highlight the variability in fermentation efficiency among yeast strains. Commercial strains generally showed higher metabolic activity and ethanol yields compared to the laboratory strain, with ACY9 and ACY10 particularly notable for their high glucose consumption and ethanol production rates, respectively.

3.2. Carbon Source Utilization

The growth adaptability of the tested yeast strains to various sugar sources was evaluated by measuring their doubling times and calculating a normalized average (Table 2). The doubling times varied significantly among the strains, indicating differences in metabolic flexibility. ACY5 and ACY9 exhibited prolonged doubling times, particularly in trehalose and galactose, respectively, suggesting potential metabolic bottlenecks in these pathways. ACY10 also showed a delayed growth rate in trehalose, with a notable doubling time, implying less efficient utilization of this sugar. Additionally, ACY5 displayed slower growth in maltose and sucrose, highlighting its limited adaptability to these carbon sources. In contrast, ACY169 demonstrated the shortest average doubling time in raffinose, highlighting its robust metabolic efficiency and ability to adapt rapidly to different fermentable sugars. This strain also showed competitive growth rates in glucose, fructose, and maltose, indicating versatile sugar utilization. The lab strain ACY283 displayed consistent growth across all sugar sources, affirming its role as a reliable control with balanced metabolic performance. The normalized average scores further emphasized the superior performance of ACY169 and ACY283, with scores of 0.875 and 0.836, respectively. ACY5 and ACY9 had the lowest scores, 0.275 and 0.261, indicating overall lower efficiency and adaptability. An ANOVA test was conducted to compare the doubling times of yeast strains across different carbon sources. The results show a significant difference in the doubling times (F (6, 49) = 12.579, p < 0.0001), indicating that the type of carbon source significantly affects the growth rate of yeast strains. This suggests that yeast strains have varying efficiencies in metabolizing different sugars, which is crucial information for optimizing fermentation processes.

3.3. Stress Tolerance

3.3.1. Glucose Limitation

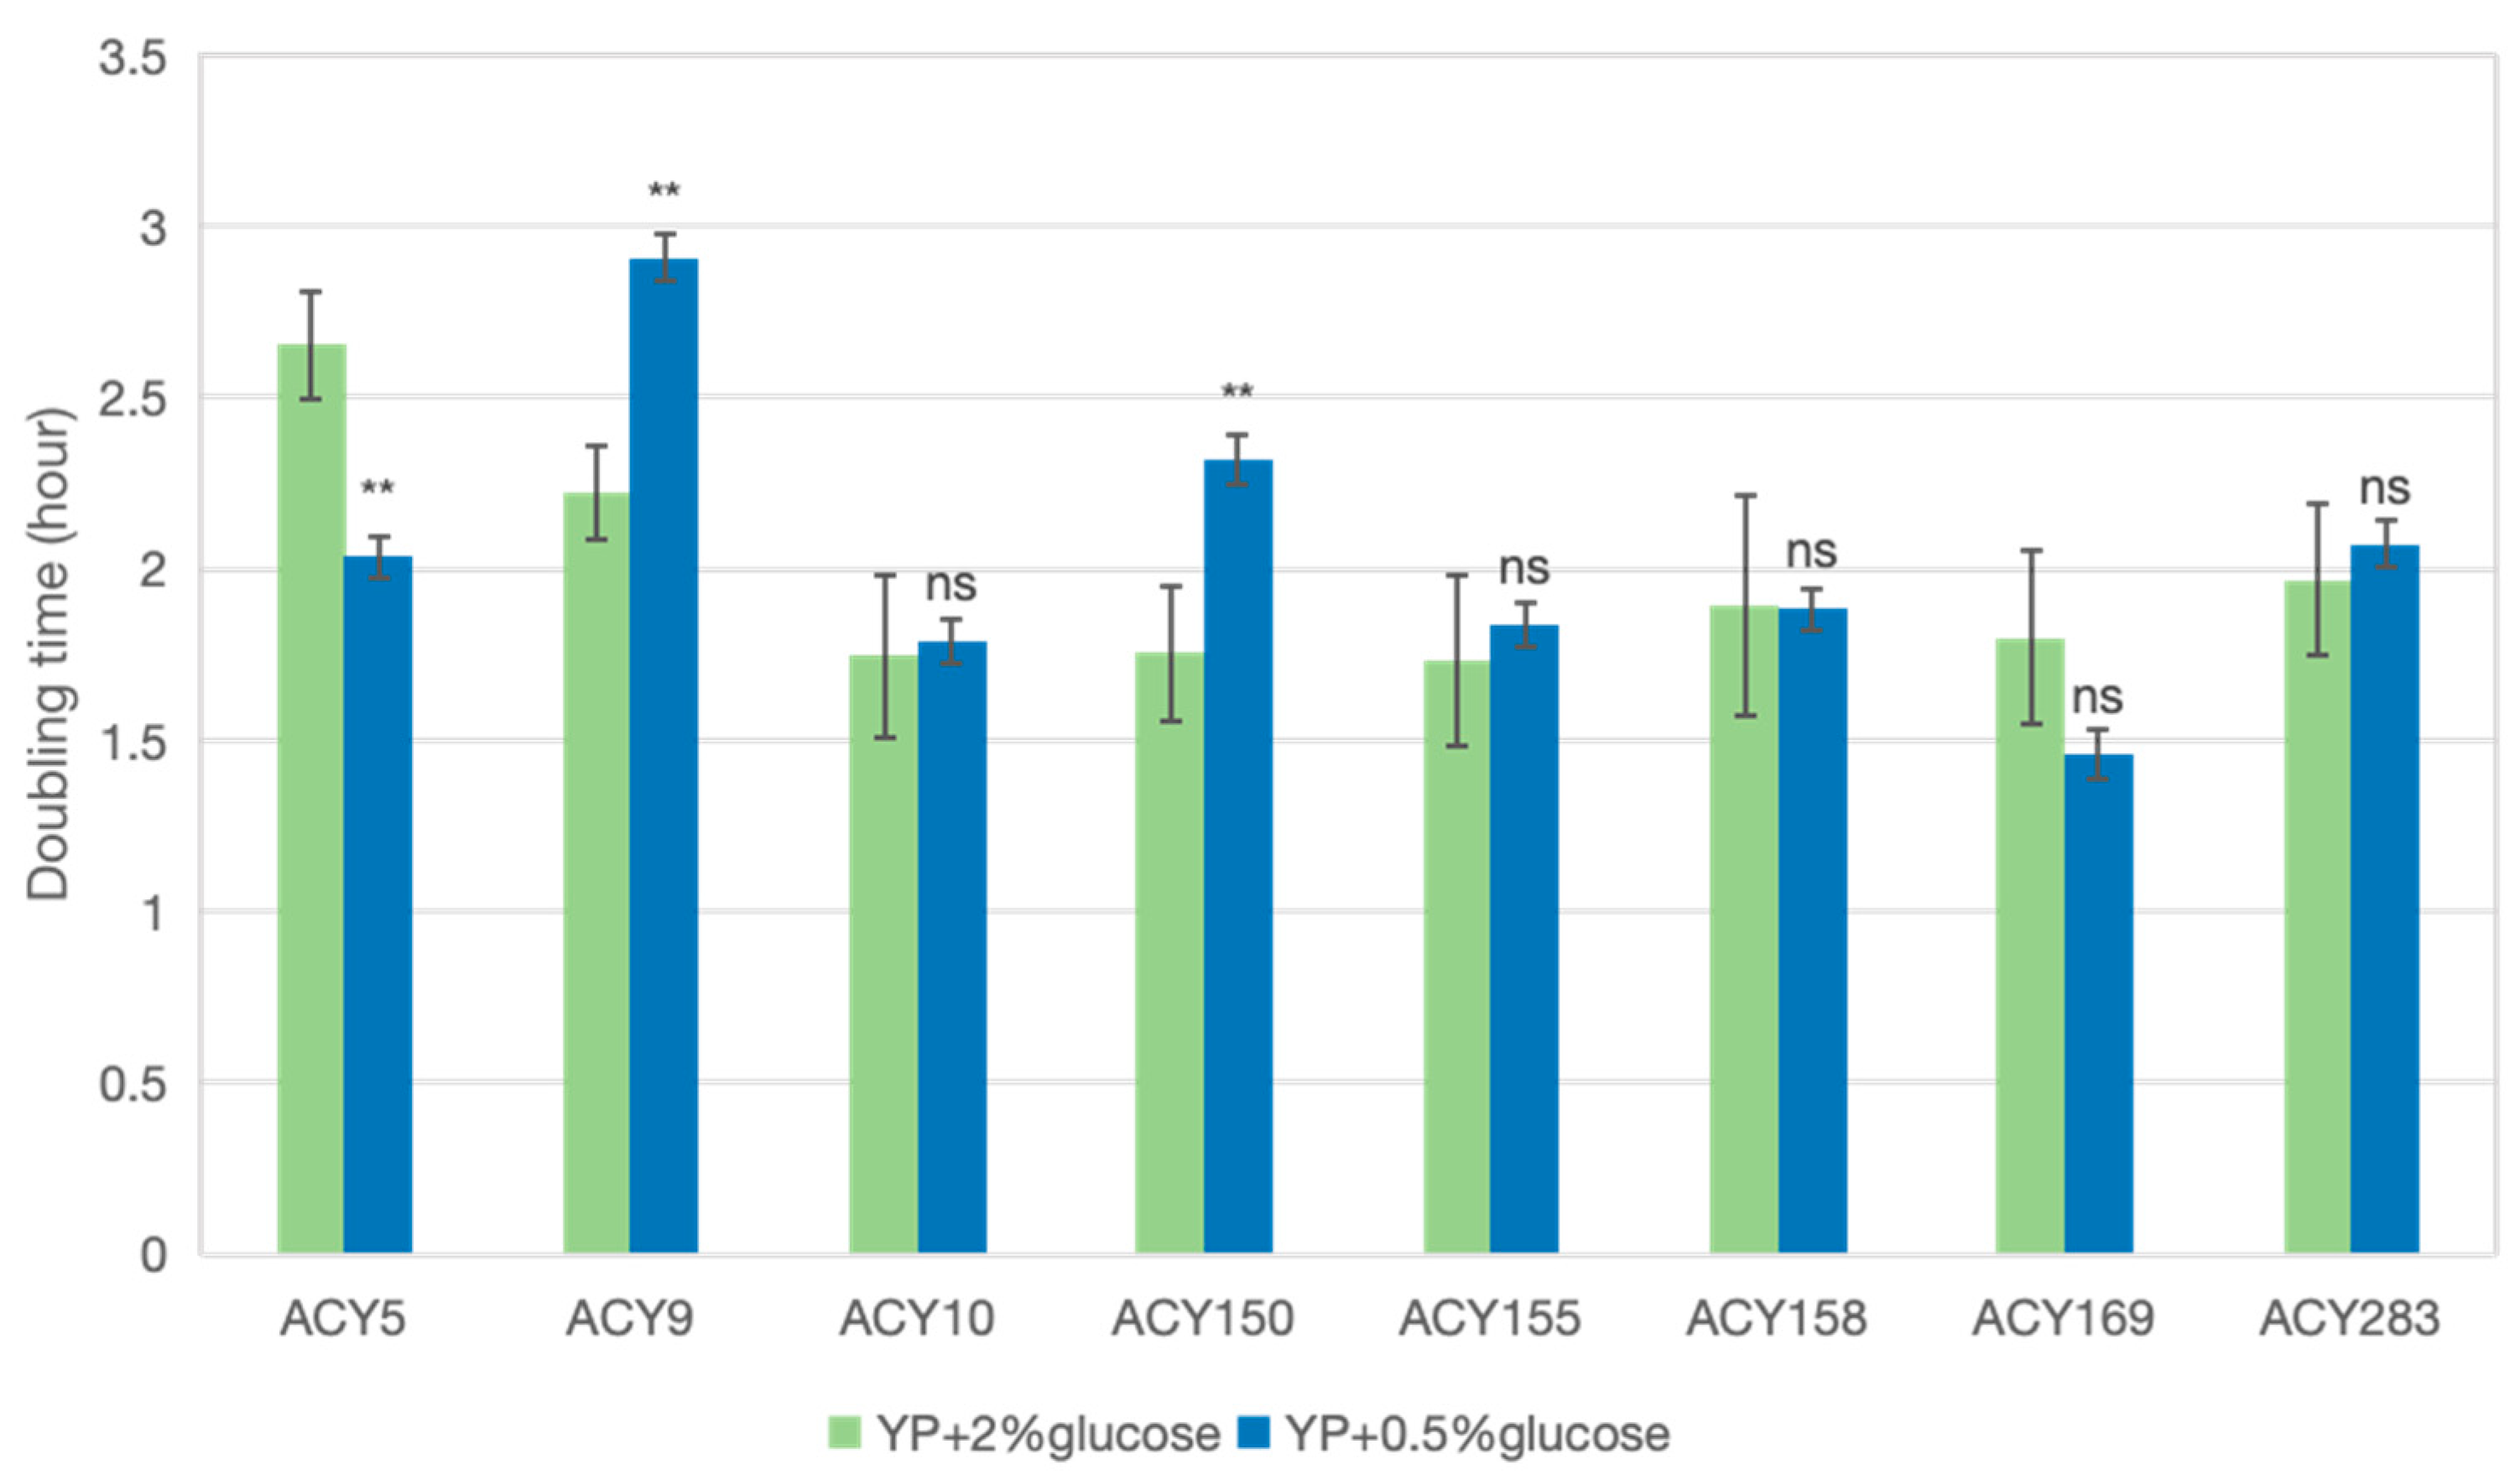
The response of the tested yeast strains to glucose limitation was explored by observing growth in media with standard and reduced glucose levels (Figure 3). ACY5 demonstrated a notable reduction in doubling time when glucose was scarce, possibly indicating a metabolic proficiency for adapting to nutrient stress [26]. This strain may have a regulatory system that efficiently reallocates resources or activates alternative pathways to sustain growth, an attribute that could be valuable in industrial brewing settings where glucose levels can fluctuate during different stages of fermentation. On the other hand, ACY9 and ACY150 showed significant increases in doubling time under the same conditions, suggesting a less flexible metabolic response to glucose scarcity. These differences among the strains could stem from variations in the activation of stress response pathways or the efficiency of glucose transport systems [27]. Minimal changes in doubling times for ACY10, ACY155, ACY158, and ACY283 suggest resilience to glucose limitation, potentially offering an advantage in brewing processes such as continuous or high-gravity fermentations where consistent performance under variable glucose conditions is beneficial. The data imply that ACY5 and similarly adaptable strains could be harnessed for processes that require rapid adaptation to changing nutrient levels, enhancing the efficiency and robustness of the fermentation process. In brewing, glucose limitation can occur as yeast consumes available sugars, particularly in high-gravity brewing where initial sugar concentrations are high [28]. Strains that can adapt to decreasing glucose levels without significant reductions in growth rates are valuable for maintaining fermentation efficiency and ensuring complete sugar utilization.

3.3.2. Osmotic Stress Tolerance

Osmotic stress is significant in brewing due to the high sugar concentrations in wort, which can affect yeast viability and fermentation efficiency [29]. The performance of the tested yeast strains under osmotic stress (1 M sorbitol) is summarized in Table 3. The normalized scores reflect a combination of three critical parameters: doubling time, maximum OD600, and time before log phase entry, which together indicate the overall adaptability and robustness of the yeast strains under osmotic stress. ACY150 and ACY169 exhibited the highest osmotic stress tolerance with normalized scores of around 0.88. These strains demonstrated robust growth with shorter doubling times (1.83 and 1.95 h), higher maximum OD600 values (2.20 and 2.21), and quicker log phase entry times (8 and 7 h). These parameters suggest that ACY150 and ACY169 can efficiently adapt and grow under highly osmotic conditions, making them ideal candidates for high-gravity brewing processes wherein maintaining yeast viability and activity is crucial for achieving high alcohol yields and consistent product quality. In contrast, ACY5 and ACY10 displayed lower tolerance to osmotic stress, with normalized scores of 0.11 and 0.33, respectively. ACY5 had a longer doubling time of 2.63 h, a lower maximum OD600 of 1.74, and a delayed log phase entry at 13 h. Similarly, ACY10 showed a doubling time of 2.24 h, a maximum OD600 of 1.89, and log phase entry at 13 h. These parameters indicate reduced adaptability and slower growth under highly osmotic conditions. A MANOVA test showed significant differences among strains in doubling time, maximum OD600, and time before entering the log phase among strains under osmotic stress (Wilks’ lambda = 0.0116, p = 0.0001).

3.3.3. Cold Shock Tolerance

Cold stress is important in brewing, especially during the cold conditioning phase wherein yeast activity is reduced to clear the beer [30]. The performance of the tested yeast strains was assessed after being stored at 4 °C for 3 days and then recovered in YPD (Table 3). Among the strains tested, ACY155, ACY150, and ACY169 demonstrated the highest cold stress tolerance. ACY155 exhibited robust growth with a maximum OD600 of 2.33 and entered the log phase in 14 h. Similarly, ACY150 showed good resilience with a maximum OD600 of 2.23 and log phase entry in 21 h. ACY169 highlighted rapid growth under cold conditions, entering the log phase in 11 h. The results indicate that ACY155, ACY150, and ACY169 are the most robust strains under cold stress conditions, such as during cold storage. Maintaining yeast viability and activity during cold stress is crucial for ensuring the clarity of the final product, flavor stability, and quality, as yeast can continue to condition the beer and remove undesirable compounds during these stages. ACY5, while scoring slightly lower at 0.861, also demonstrated good adaptability with a higher maximum OD600 of 2.46; however, it took longer to enter the log phase. On the lower end, ACY158 showed poor performance under cold stress, with a normalized score of 0.004. This strain had the longest doubling time of 18.31 h and took 47 h to enter the log phase, indicating limited adaptability to cold conditions. ACY10 also exhibited poor performance, with a score of 0.31, a doubling time of 5.63 h, and log phase entry at 47 h. A MANOVA test showed significant differences among strains in doubling time, maximum OD600, and time before entering the log phase under cold stress (Wilks’ lambda = 0.0035, p = 0.0001).

3.3.4. Acid Tolerance

Acid stress is crucial in brewing as it affects yeast viability and fermentation efficiency, especially in sour beer production wherein low pH levels are common [31]. The performance of the tested yeast strains under acid stress (pH 2.2) is summarized in Table 4. ACY10 exhibited the shortest doubling time (2.18 h), a relatively high maximum OD600 (3.01), and rapid log phase entry (7 h), indicating robust growth and high tolerance to acid stress. ACY150 and ACY155 also performed well with doubling times of 2.29 and 2.43 h, maximum OD600 values of 2.01 and 2.3, and log phase entry times of 7 h each, showing significant acid tolerance. In contrast, ACY5 showed the longest doubling time (5.25 h) and delayed log phase entry (23 h), indicating poor performance and limited adaptability to low-pH conditions. Its maximum OD600 of 1.63 further highlights its reduced ability to thrive under acid stress. Strains ACY158, ACY283, ACY9, and ACY169 showed moderate performance with intermediate doubling times and log phase entry times. These strains demonstrated reasonable tolerance to acid stress, making them suitable for less stringent brewing conditions. Overall, the results indicate that ACY10, ACY150, and ACY155 are the most robust strains under acid stress conditions, making them excellent candidates for brewing processes that require high acid tolerance, such as sour beer production. Additionally, these strains could be beneficial in the production of other acidic beverages like certain fruit beers and ciders, which also require robust yeast performance in low-pH environments. A MANOVA test showed significant differences among strains in doubling time, maximum OD600, and time before entering the log phase under acid stress (Wilks’ lambda = 3.67 × 10⁻⁵, p-value = 2.55 × 10−143).

3.3.5. Ethanol Tolerance

Testing ethanol tolerance is crucial in brewing as yeast must withstand high ethanol levels during fermentation to ensure efficient sugar conversion and consistent production of high-alcohol beers [32]. Among the strains tested, ACY150 and ACY169 demonstrated the highest ethanol stress tolerance with normalized scores of 0.915 and 0.979, respectively. ACY150 exhibited robust performance with short doubling times, high maximum OD600 values, and relatively quick log phase entry, indicating strong growth and high adaptability to ethanol-rich environments. Similarly, ACY169 showed a balanced performance across all metrics, making it a top performer under conditions of ethanol stress. On the other hand, ACY5 exhibited the lowest ethanol stress tolerance with a normalized score of 0.003, indicating poor performance in ethanol-rich environments. The extended doubling time and significantly delayed entry into the log phase suggest that ACY5 struggles to cope with the cellular stress induced by high ethanol levels, leading to impaired growth and metabolic activity. ACY9, with a score of 0.277, also showed suboptimal performance, characterized by a longer time before entering the log phase and lower maximum OD600, which points to its limited ability to maintain cellular integrity and function under ethanol stress. A MANOVA test showed significant differences among strains in doubling time, maximum OD600, and time before entering the log phase under 10% ethanol stress (Wilks’ lambda = 8.35 × 10⁻⁸, p = 5.57 × 10−236).

3.3.6. Heat Tolerance

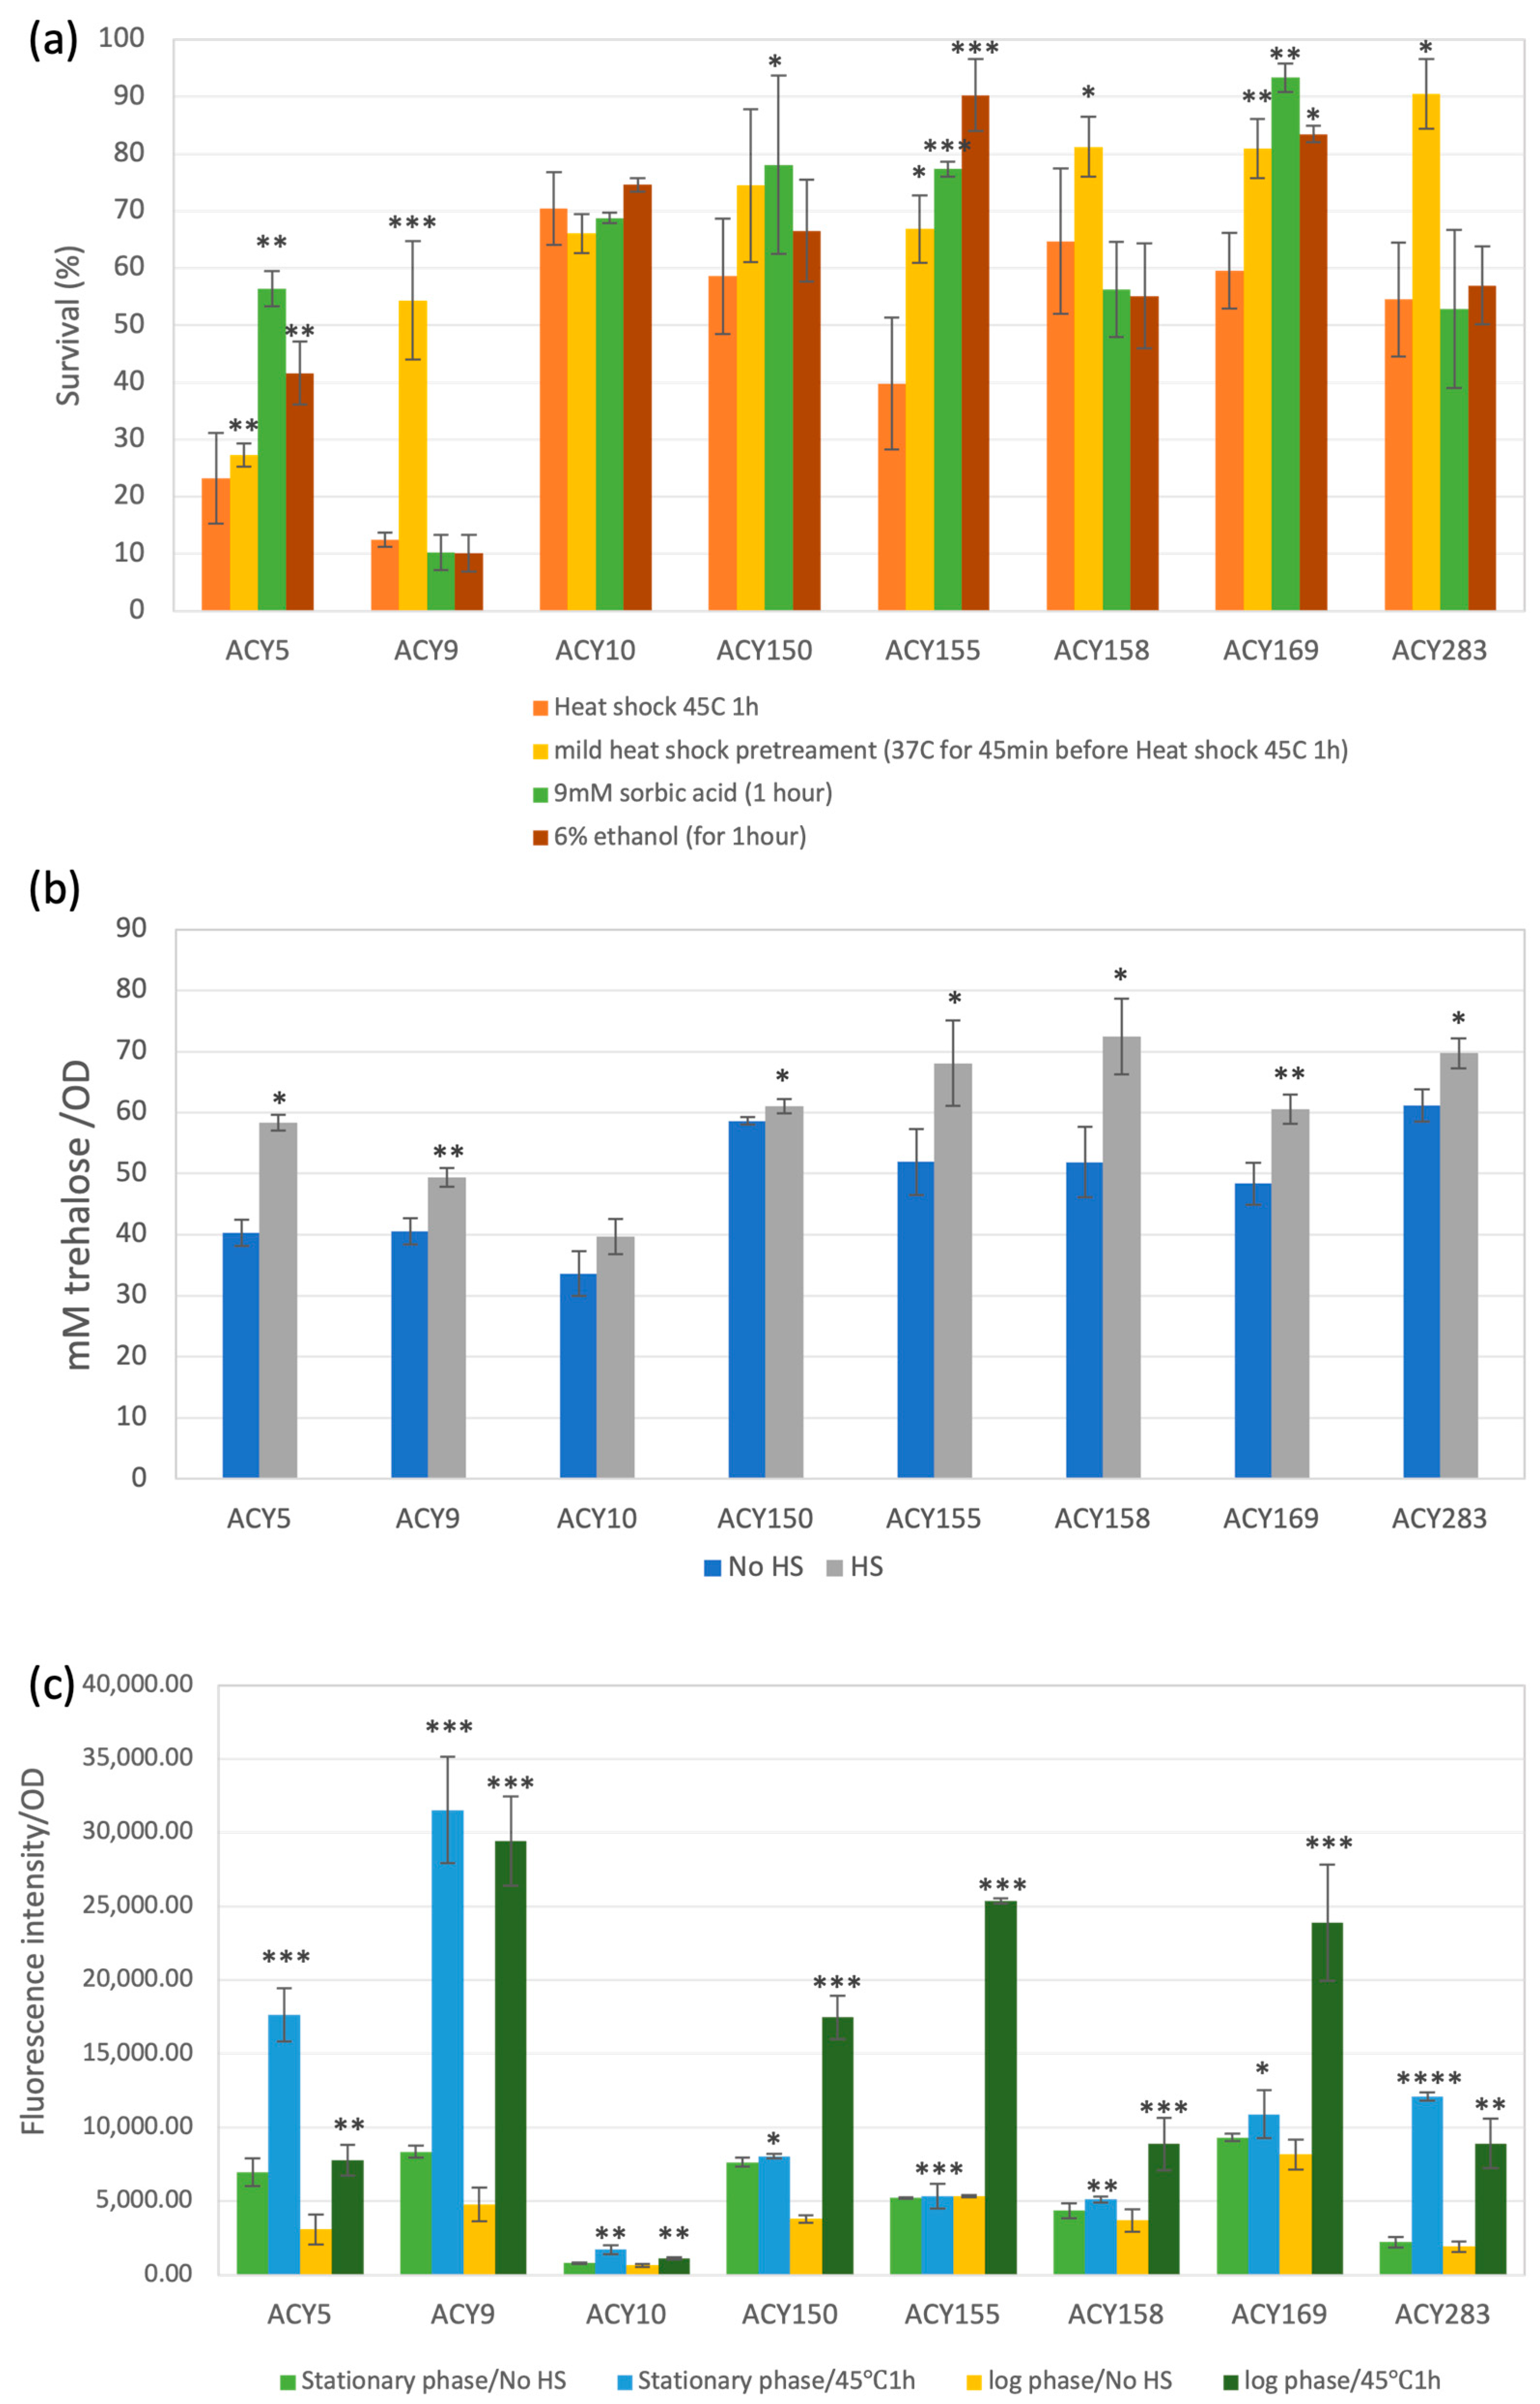
In assessing the heat shock tolerance of the tested yeast strains, the survival rates after 45 °C heat shock coupled with pretreatments like mild heat, sorbic acid, and ethanol showcased a diverse range of responses (Figure 4a) [33,34,35]. These survival rates, depicted through normalized scores, point towards specific applications and practices that could benefit various industries. The pronounced susceptibility of ACY9 to heat shock was mitigated by mild heat pretreatment, suggesting that such preconditioning strategies can activate heat resistance mechanisms [36]. This finding can be directly applied to industries like bioethanol production, where yeast might encounter high-temperature phases. By implementing a mild heat pretreatment step, it is possible to induce a state of increased thermal tolerance in strains like ACY9, thereby enhancing their viability and efficiency during the heat shock conditions inherent to the production process. Conversely, ACY150 and ACY158 showcased substantial survival scores even in the absence of pretreatments, highlighting their natural heat resistance. These strains are ideal candidates for processes like high-temperature fermentations or baking industries, where temperatures can significantly rise, thus requiring strains that maintain their metabolic activities at elevated temperatures without any prior adaptation [37]. Interestingly, the perfect survival score of ACY 169 after sorbic acid pretreatment indicates its potential in the food and beverage industry, where sorbic acid is a common preservative. Such a strain could maintain viability in preservative-rich environments, potentially allowing for lower preservative concentrations and thus cost savings without compromising product safety or shelf life [38].
Following heat shock treatment, most yeast strains exhibited an increase in intracellular trehalose levels (Figure 4b). This observation typically suggests a stress response, positioning trehalose as a potential indicator of cellular stress levels. However, the direct role of trehalose as a protective molecule against heat shock has not yet been definitively established [39]. While some strains with heightened trehalose showed improved survival, others like ACY10 maintained viability without a significant rise in trehalose, indicating that survival post heat shock may not be solely reliant on this molecule. Previous studies suggested that while intracellular trehalose levels are directly associated with freeze–thaw tolerance and correlate with freeze–thaw tolerance in yeast, the attributed physiological functions of trehalose, such as heat resistance, may not be directly related to its presence [39,40]. Many of the metabolic and growth defects associated with mutations in the trehalose biosynthesis pathway are not abolished by providing abundant intracellular trehalose. Therefore, the relationship between trehalose levels and cell survival under heat stress invites further scrutiny to ascertain whether trehalose indeed acts as a protective agent or merely marks the occurrence of cellular stress.
Post heat shock, all studied yeast strains exhibited an increase in intracellular ROS levels, indicative of oxidative stress (Figure 4c). This rise in ROS suggests a common response to thermal stress among the strains, reflecting the cellular challenge imposed by heat shock [41]. However, the diversity in the magnitude of ROS increase across different strains highlights the complexity of their oxidative stress responses. For example, ACY5 and ACY283 showed significant elevations in ROS, pointing to a substantial oxidative challenge, whereas other strains like ACY155 had a less pronounced increase. This variability underscores the need for further research to understand the specific role of ROS in heat shock tolerance and whether it serves as a mere byproduct of stress or a trigger for protective mechanisms in yeast cells.

3.3.7. Overall Stress Tolerance

The overall stress tolerance of the tested commercial ale yeast strains was evaluated based on an averaged normalized scoring system encompassing osmotic tolerance, acid tolerance, cold tolerance, heat tolerance, ethanol tolerance, and glucose limitation (Table 5). ACY169 exhibited the highest overall scoring of 0.864, making it ideal for diverse brewing processes that demand high resilience, such as high-gravity brewing or extreme temperature fluctuations. ACY150 also demonstrated strong overall stress tolerance with a score of 0.773, highlighting its potential utility in various brewing environments. ACY283, a lab strain, achieved a notable overall score of 0.726, suggesting it can serve as a reliable model for studying stress tolerance mechanisms. ACY155, achieving an overall score of 0.695, displayed relatively high stress tolerance, particularly excelling in acidic and cold stress conditions. This strain is well suited to specialized brewing processes like sour beer production or cold conditioning.

4. Discussion

Studying commercial yeast strains is critical for brewing and other industrial applications due to the significant impact these strains have on fermentation efficiency, product quality, and process consistency. In brewing, yeast not only drives the fermentation process by converting sugars into ethanol and CO2 but also influences the flavor, aroma, and mouthfeel of the final product. Understanding the metabolic capabilities and stress tolerance of different yeast strains allows brewers to optimize fermentation conditions, ensuring consistent production of high-quality beer across various styles.
Carrasco et al. systematically analyzed 14 commercial wine yeast strains, revealing significant differences in their resistance to various stresses [42]. This underscores the importance of selecting the right yeast strains for specific fermentation conditions. Zuzuarregui et al. demonstrated a clear correlation between stress resistance and fermentative behavior in 14 yeast strains, suggesting that stress resistance can be a valuable criterion for selecting effective wine yeasts [43]. Our study adds to this body of knowledge by evaluating the stress tolerance of ale yeast strains under conditions such as acid stress, ethanol stress, and osmotic stress.
Our findings revealed that ACY10, ACY150, and ACY155 exhibited robust performance under acid stress, making them excellent candidates for brewing sour beers and other acidic beverages. These results are supported by Zhang et al., who showed that enhancing yeast strains for better acid stress tolerance can significantly improve fermentation efficiency and product quality [44]. Furthermore, strains like ACY150 and ACY169 demonstrated high overall stress tolerance, making them suitable for high-gravity brewing and processes involving extreme temperature fluctuations. These strains were able to maintain high maximum OD600 and rapid time to log phase under ethanol and osmotic stress conditions.
This is consistent with Liu et al.’s study, which found that modifying the general transcription factor gene SPT15 in S. cerevisiae enhances tolerance to hyperosmotic, thermal, and ethanol stresses [45]. In addition to genetic modifications, adaptive laboratory evolution has been shown to evolve yeast strains under specific stress conditions or carbon source limitations, yielding strains with enhanced performance traits for industrial brewing applications [46]. For example, Zhang et al. developed a multiple-stress-tolerant S. cerevisiae strain YF10-5 through adaptive laboratory evolution involving freeze–thaw cycles and stress shock selection, which showed improved very high-gravity (VHG) fermentation capacity and increased ethanol yield [47]. A recent study developed the mutant S. cerevisiae strain YN81mc-8.3 through adaptive laboratory evolution, which demonstrated enhanced osmotic and ethanol stress tolerance, improved fermentation performance, and superior sensory qualities in strong beer production [48]. This approach could be applied to further enhance the strains identified in our study.
Conducting comprehensive metabolomic and proteomic analyses would provide further insights into the metabolic pathways and stress response mechanisms of different yeast strains, helping to identify key regulatory points for optimization. For example, Wolf et al. identified core pathways, long non-coding RNAs, and mechanisms involved in ethanol tolerance in yeast, highlighting the roles of longevity, peroxisomal pathways, CTA1, ROS, ribosomal and RNA pathways via SUI2, and lipid metabolism in differentiating high- and low-ethanol-tolerant phenotypes [49]. Wu et al. identified key genes and metabolic pathways that enhance stress tolerance in high-gravity brewing, showing that overexpression of MAN2, PCL1, and PFK26 genes improves fermentation efficiency without altering flavor profiles, thereby aiding in the development of more robust yeast strains [50].
Our study provides a comprehensive assessment of multiple stress tolerances, emphasizing practical applications in brewing environments. The stress tolerance profiles of ACY10, ACY150, ACY155, and ACY169 suggest they can maintain fermentation performance and product quality under challenging industrial conditions. These findings highlight the potential applications of these robust yeast strains in various brewing processes. Future research could focus on genetic and metabolic engineering to enhance these traits and validate the performance of these strains at an industrial scale.

5. Conclusions

In conclusion, the commercial yeast strains tested in this study exhibited significant variability in their fermentation profiles, carbon source utilization, and stress tolerance, making them suitable for diverse brewing applications. The fermentation profiles revealed that strains like ACY10 and ACY150 demonstrated balanced fermentation profiles with high ethanol production rates, while ACY9 exhibited the highest glucose consumption rate but lower ethanol yields and significant acidification. The ability to utilize various carbon sources varied significantly among strains, with ACY169 displaying exceptional metabolic versatility and efficiently fermenting a range of sugars including glucose, fructose, maltose, and raffinose. In contrast, strains like ACY5 and ACY9 showed limited adaptability to certain sugars. Regarding stress tolerance, strains such as ACY169 and ACY150 demonstrated high overall stress tolerance, ideal for high-gravity brewing and processes involving extreme temperature fluctuations. ACY10, ACY150, and ACY155 showed robust performance under acid stress, making them excellent candidates for brewing sour beers and other acidic beverages. These findings highlight the importance of selecting appropriate yeast strains for specific brewing conditions to maintain consistent fermentation performance and product quality.

Author Contributions

Conceptualization, A.C. and J.C.; methodology, A.C., Q.S., Q.X., C.P. and Y.C.; software, Y.C.; formal analysis, Q.S.; investigation, A.C., Q.S., Q.X. and C.P.; writing—original draft preparation, A.C.; writing—review and editing, A.C. and Q.S.; supervision, Y.C.; funding acquisition, A.C. and J.C. All authors have read and agreed to the published version of the manuscript.

Funding

This research was funded by National Natural Science Foundation of China (grant No.: 32302035); Wuxi Science and Technology Development Fund (grant No.: K20231030); the Fundamental Research Funds for the Central Universities (grant No.: JUSRP124031); China Postdoctoral Science Fund-General Fund (grant No.: 2024M751155); China Postdoctoral Science Fund-Special Fund (grant No.: 2024T170351).

Institutional Review Board Statement

Not applicable.

Informed Consent Statement

Not applicable.

Data Availability Statement

Data are contained within this article.

Conflicts of Interest

The authors declare no conflicts of interest.

References

  1. Parapouli, M.; Vasileiadis, A.; Afendra, A.S.; Hatziloukas, E. Saccharomyces cerevisiae and Its Industrial Applications. AIMS Microbiol. 2020, 6, 1–31. [Google Scholar] [CrossRef] [PubMed]
  2. Walker, G.M.; Stewart, G.G. Saccharomyces cerevisiae in the Production of Fermented Beverages. Beverages 2016, 2, 30. [Google Scholar] [CrossRef]
  3. Maicas, S. Yeast Fermentation and the Make of Biotechnological Products. Microorganisms 2023, 11, 1463. [Google Scholar] [CrossRef] [PubMed]
  4. Shen, D.; He, X.; Weng, P.; Liu, Y.; Wu, Z. A Review of Yeast: High Cell-Density Culture, Molecular Mechanisms of Stress Response and Tolerance during Fermentation. FEMS Yeast Res. 2022, 22, foac050. [Google Scholar] [CrossRef] [PubMed]
  5. Postaru, M.; Tucaliuc, A.; Cascaval, D.; Galaction, A.I. Cellular Stress Impact on Yeast Activity in Biotechnological Processes—A Short Overview. Microorganisms 2023, 11, 2522. [Google Scholar] [CrossRef] [PubMed]
  6. Kucharczyk, K.; Tuszyński, T. The Effect of Temperature on Fermentation and Beer Volatiles at an Industrial Scale. J. Inst. Brew. 2018, 124, 230–235. [Google Scholar] [CrossRef]
  7. Liszkowska, W.; Berlowska, J. Yeast Fermentation at Low Temperatures: Adaptation to Changing Environmental Conditions and Formation of Volatile Compounds. Molecules 2021, 26, 1035. [Google Scholar] [CrossRef] [PubMed]
  8. Puligundla, P.; Smogrovicova, D.; Mok, C.; Obulam, V.S.R. A Review of Recent Advances in High Gravity Ethanol Fermentation. Renew. Energy 2019, 133, 1366–1379. [Google Scholar] [CrossRef]
  9. Puligundla, P.; Smogrovicova, D.; Mok, C.; Obulam, V.S.R. Recent Developments in High Gravity Beer-Brewing. Innov. Food Sci. Emerg. Technol. 2020, 64, 102399. [Google Scholar] [CrossRef]
  10. Sipiczki, M. Yeast Two- and Three-Species Hybrids and High-Sugar Fermentation. Microb. Biotechnol. 2019, 12, 1101–1108. [Google Scholar] [CrossRef]
  11. Yoshida, M.; Furutani, N.; Imai, F.; Miki, T.; Izawa, S. Wine Yeast Cells Acquire Resistance to Severe Ethanol Stress and Suppress Insoluble Protein Accumulation during Alcoholic Fermentation. Microbiol. Spectr. 2022, 10, e0090122. [Google Scholar] [CrossRef]
  12. Yang, T.; Zhang, S.; Li, L.; Tian, J.; Li, X.; Pan, Y. Screening and Transcriptomic Analysis of the Ethanol-Tolerant Mutant Saccharomyces cerevisiae YN81 for High-Gravity Brewing. Front. Microbiol. 2022, 13, 976321. [Google Scholar] [CrossRef] [PubMed]
  13. Shen, W.; Gao, Z.; Chen, K.; Ouyang, Q.; Luo, C. Yeast Cells under Glucose-Limitation Environment Need Increased Response Cost for Osmostress Defense. bioRxiv 2021. [Google Scholar] [CrossRef]
  14. Lane, S.; Xu, H.; Oh, E.J.; Kim, H.; Lesmana, A.; Jeong, D.; Zhang, G.; Tsai, C.S.; Jin, Y.S.; Kim, S.R. Glucose Repression Can Be Alleviated by Reducing Glucose Phosphorylation Rate in Saccharomyces cerevisiae. Sci. Rep. 2018, 8, 2613. [Google Scholar] [CrossRef] [PubMed]
  15. Turcotte, B.; Liang, X.B.; Robert, F.; Soontorngun, N. Transcriptional Regulation of Nonfermentable Carbon Utilization in Budding Yeast. FEMS Yeast Res. 2010, 10, 2–13. [Google Scholar] [CrossRef] [PubMed]
  16. Iorizzo, M.; Coppola, F.; Letizia, F.; Testa, B.; Sorrentino, E. Role of Yeasts in the Brewing Process: Tradition and Innovation. Processes 2021, 9, 839. [Google Scholar] [CrossRef]
  17. Hickman, M.J.; Winston, F. Heme Levels Switch the Function of Hap1 of Saccharomyces cerevisiae between Transcriptional Activator and Transcriptional Repressor. Mol. Cell. Biol. 2007, 27, 7414–7424. [Google Scholar] [CrossRef]
  18. Botstein, D.; Fink, G.R. Yeast: An Experimental Organism for 21st Century Biology. Genetics 2011, 189, 695–704. [Google Scholar] [CrossRef]
  19. Jordan, M.A. Bioprocess Engineering Principles; Academic Press: Cambridge, MA, USA, 2013. [Google Scholar]
  20. Stanbury, P.F.; Whitaker, A.; Hall, S.J. Principles of Fermentation Technology, 3rd ed.; Butterworth-Heinemann: Oxford, UK, 2016. [Google Scholar]
  21. Korzyńska, A.; Zychowicz, M. A Method of Estimation of the Cell Doubling Time on Basis of the Cell Culture Monitoring Data. Biocybern. Biomed. Eng. 2008, 28, 75–82. [Google Scholar]
  22. Henderi, H. Comparison of Min-Max Normalization and Z-Score Normalization in the K-Nearest Neighbor (KNN) Algorithm to Test the Accuracy of Types of Breast Cancer. IJIIS Int. J. Inform. Inf. Syst. 2021, 4, 13–20. [Google Scholar] [CrossRef]
  23. Dattalo, P. Analysis of Multiple Dependent Variables; Oxford University Press: New York, NY, USA, 2013. [Google Scholar]
  24. Shulman, R.G.; Rothman, D.L. Homeostasis and the Glycogen Shunt Explains Aerobic Ethanol Production in Yeast. Proc. Natl. Acad. Sci. USA 2015, 112, 10902–10907. [Google Scholar] [CrossRef] [PubMed]
  25. Boer, V.M.; Crutchfield, C.A.; Bradley, P.H.; Botstein, D.; Rabinowitz, J.D. Growth-Limiting Intracellular Metabolites in Yeast Growing under Diverse Nutrient Limitations. Mol. Biol. Cell 2010, 21, 198–211. [Google Scholar] [CrossRef] [PubMed]
  26. Winderickx, J.; Holsbeeks, I.; Lagatie, O.; Giots, F.; Thevelein, J.; de Winde, H. From Feast to Famine; Adaptation to Nutrient Availability in Yeast. In Yeast Stress Response; Springer: Berlin/Heidelberg, Germany, 2003. [Google Scholar]
  27. Jung, H.M.; Im, D.K.; Lim, J.H.; Jung, G.Y.; Oh, M.K. Metabolic Perturbations in Mutants of Glucose Transporters and Their Applications in Metabolite Production in Escherichia coli. Microb. Cell Factor. 2019, 18, 170. [Google Scholar] [CrossRef] [PubMed]
  28. Piddocke, M.P.; Kreisz, S.; Heldt-Hansen, H.P.; Nielsen, K.F.; Olsson, L. Physiological Characterization of Brewer’s Yeast in High-Gravity Beer Fermentations with Glucose or Maltose Syrups as Adjuncts. Appl. Microbiol. Biotechnol. 2009, 84, 453–464. [Google Scholar] [CrossRef] [PubMed]
  29. Dziugan, P.; Balcerek, M.; Pielech-Przybylska, K.; Patelski, P. Evaluation of the Fermentation of High Gravity Thick Sugar Beet Juice Worts for Efficient Bioethanol Production. Biotechnol. Biofuels 2013, 6, 158. [Google Scholar] [CrossRef] [PubMed]
  30. Miedl, M.; Bamforth, C.W. The Relative Importance of Temperature and Time in the Cold Conditioning of Beer. J. Am. Soc. Brew. Chem. 2004, 62, 75–78. [Google Scholar] [CrossRef]
  31. Dysvik, A.; La Rosa, S.L.; De Rouck, G.; Rukke, E.O.; Westereng, B.; Wicklund, T. Microbial Dynamics in Traditional and Modern Sour Beer Production. Appl. Environ. Microbiol. 2020, 86, e00566-20. [Google Scholar] [CrossRef] [PubMed]
  32. Doğan, A.; Demirci, S.; Aytekin, A.Ö.; Şahin, F. Improvements of Tolerance to Stress Conditions by Genetic Engineering in Saccharomyces cerevisiae during Ethanol Production. Appl. Biochem. Biotechnol. 2014, 174, 28–42. [Google Scholar] [CrossRef]
  33. Choudhary, J.; Singh, S.; Nain, L. Thermotolerant Fermenting Yeasts for Simultaneous Saccharification Fermentation of Lignocellulosic Biomass. Electron. J. Biotechnol. 2016, 21, 82–92. [Google Scholar] [CrossRef]
  34. Harvey, H.J.; Hendry, A.C.; Chirico, M.; Archer, D.B.; Avery, S.V. Adaptation to Sorbic Acid in Low Sugar Promotes Resistance of Yeast to the Preservative. Heliyon 2023, 9, e22057. [Google Scholar] [CrossRef]
  35. Yoshida, M.; Kato, S.; Fukuda, S.; Izawa, S. Acquired Resistance to Severe Ethanol Stress in Saccharomyces cerevisiae Protein Quality Control. Appl. Environ. Microbiol. 2021, 87, e02353-20. [Google Scholar] [CrossRef] [PubMed]
  36. Morano, K.A.; Grant, C.M.; Moye-Rowley, W.S. The Response to Heat Shock and Oxidative Stress in Saccharomyces cerevisiae. Genetics 2012, 190, 1157–1195. [Google Scholar] [CrossRef] [PubMed]
  37. Caspeta, L.; Chen, Y.; Nielsen, J. Thermotolerant Yeasts Selected by Adaptive Evolution Express Heat Stress Response at 30 °C. Sci. Rep. 2016, 6, 27003. [Google Scholar] [CrossRef] [PubMed]
  38. Stratford, M.; Vallières, C.; Geoghegan, I.A.; Archer, D.B.; Avery, S.V. The Preservative Sorbic Acid Targets Respiration, Explaining the Resistance of Fermentative Spoilage Yeast Species. mSphere 2020, 5, e00273-20. [Google Scholar] [CrossRef] [PubMed]
  39. Gibney, P.A.; Schieler, A.; Chen, J.C.; Rabinowitz, J.D.; Botstein, D. Characterizing the In Vivo Role of Trehalose in Saccharomyces cerevisiae Using the AGT1 Transporter. Proc. Natl. Acad. Sci. USA 2015, 112, 6116–6121. [Google Scholar] [CrossRef] [PubMed]
  40. Chen, A.; Gibney, P.A. Intracellular Trehalose Accumulation via the Agt1 Transporter Promotes Freeze–Thaw Tolerance in Saccharomyces cerevisiae. J. Appl. Microbiol. 2022, 133, 2390–2402. [Google Scholar] [CrossRef] [PubMed]
  41. Mejía-Barajas, J.A.; Montoya-Pérez, R.; Salgado-Garciglia, R.; Aguilera-Aguirre, L.; Cortés-Rojo, C.; Mejía-Zepeda, R.; Arellano-Plaza, M.; Saavedra-Molina, A. Oxidative Stress and Antioxidant Response in a Thermotolerant Yeast. Braz. J. Microbiol. 2017, 48, 326–332. [Google Scholar] [CrossRef]
  42. Carrasco, P.; Querol, A.; Del Olmo, M. Analysis of the Stress Resistance of Commercial Wine Yeast Strains. Arch. Microbiol. 2001, 175, 450–457. [Google Scholar] [CrossRef]
  43. Zuzuarregui, A.; del Olmo, M. lí Analyses of Stress Resistance under Laboratory Conditions Constitute a Suitable Criterion for Wine Yeast Selection. Antonie Leeuwenhoek Int. J. Gen. Mol. Microbiol. 2004, 85, 271–280. [Google Scholar] [CrossRef]
  44. Zhang, H.; Hu, W.; Lu, Y.; Shen, C.; Yao, H.; Yang, X.; Yao, X.; Lu, T.; Hu, B. PEP4-Allele Modification Provides an Industrial Brewing Yeast with Malate Stress Tolerance. Fermentation 2023, 9, 378. [Google Scholar] [CrossRef]
  45. Liu, Y.; Lin, Y.; Guo, Y.; Wu, F.; Zhang, Y.; Qi, X.; Wang, Z.; Wang, Q. Stress Tolerance Enhancement via SPT15 Base Editing in Saccharomyces cerevisiae. Biotechnol. Biofuels 2021, 14, 155. [Google Scholar] [CrossRef] [PubMed]
  46. Hirasawa, T.; Maeda, T. Adaptive Laboratory Evolution of Microorganisms: Methodology and Application for Bioproduction. Microorganisms 2023, 11, 92. [Google Scholar] [CrossRef] [PubMed]
  47. Zhang, Q.; Jin, Y.L.; Fang, Y.; Zhao, H. Adaptive Evolution and Selection of Stress-Resistant Saccharomyces cerevisiae for Very High-Gravity Bioethanol Fermentation. Electron. J. Biotechnol. 2019, 41, 88–94. [Google Scholar] [CrossRef]
  48. Yang, T.; Zhang, S.; Pan, Y.; Li, X.; Liu, G.; Sun, H.; Zhang, R.; Zhang, C. Breeding of High-Tolerance Yeast by Adaptive Evolution and High-Gravity Brewing of Mutant. J. Sci. Food Agric. 2024, 104, 686–697. [Google Scholar] [CrossRef] [PubMed]
  49. Wolf, I.R.; Marques, L.F.; de Almeida, L.F.; Lázari, L.C.; de Moraes, L.N.; Cardoso, L.H.; de Oliveira Alves, C.C.; Nakajima, R.T.; Schnepper, A.P.; Golim, M.d.A.; et al. Integrative Analysis of the Ethanol Tolerance of Saccharomyces cerevisiae. Int. J. Mol. Sci. 2023, 24, 5646. [Google Scholar] [CrossRef]
  50. Wu, Z.; Wang, J.; Niu, C.; Liu, C.; Zheng, F.; Li, Q. Transcriptomic and Metabolomic Analysis Reveals Genes Related to Stress Tolerance in High Gravity Brewing. World J. Microbiol. Biotechnol. 2022, 38, 59. [Google Scholar] [CrossRef]
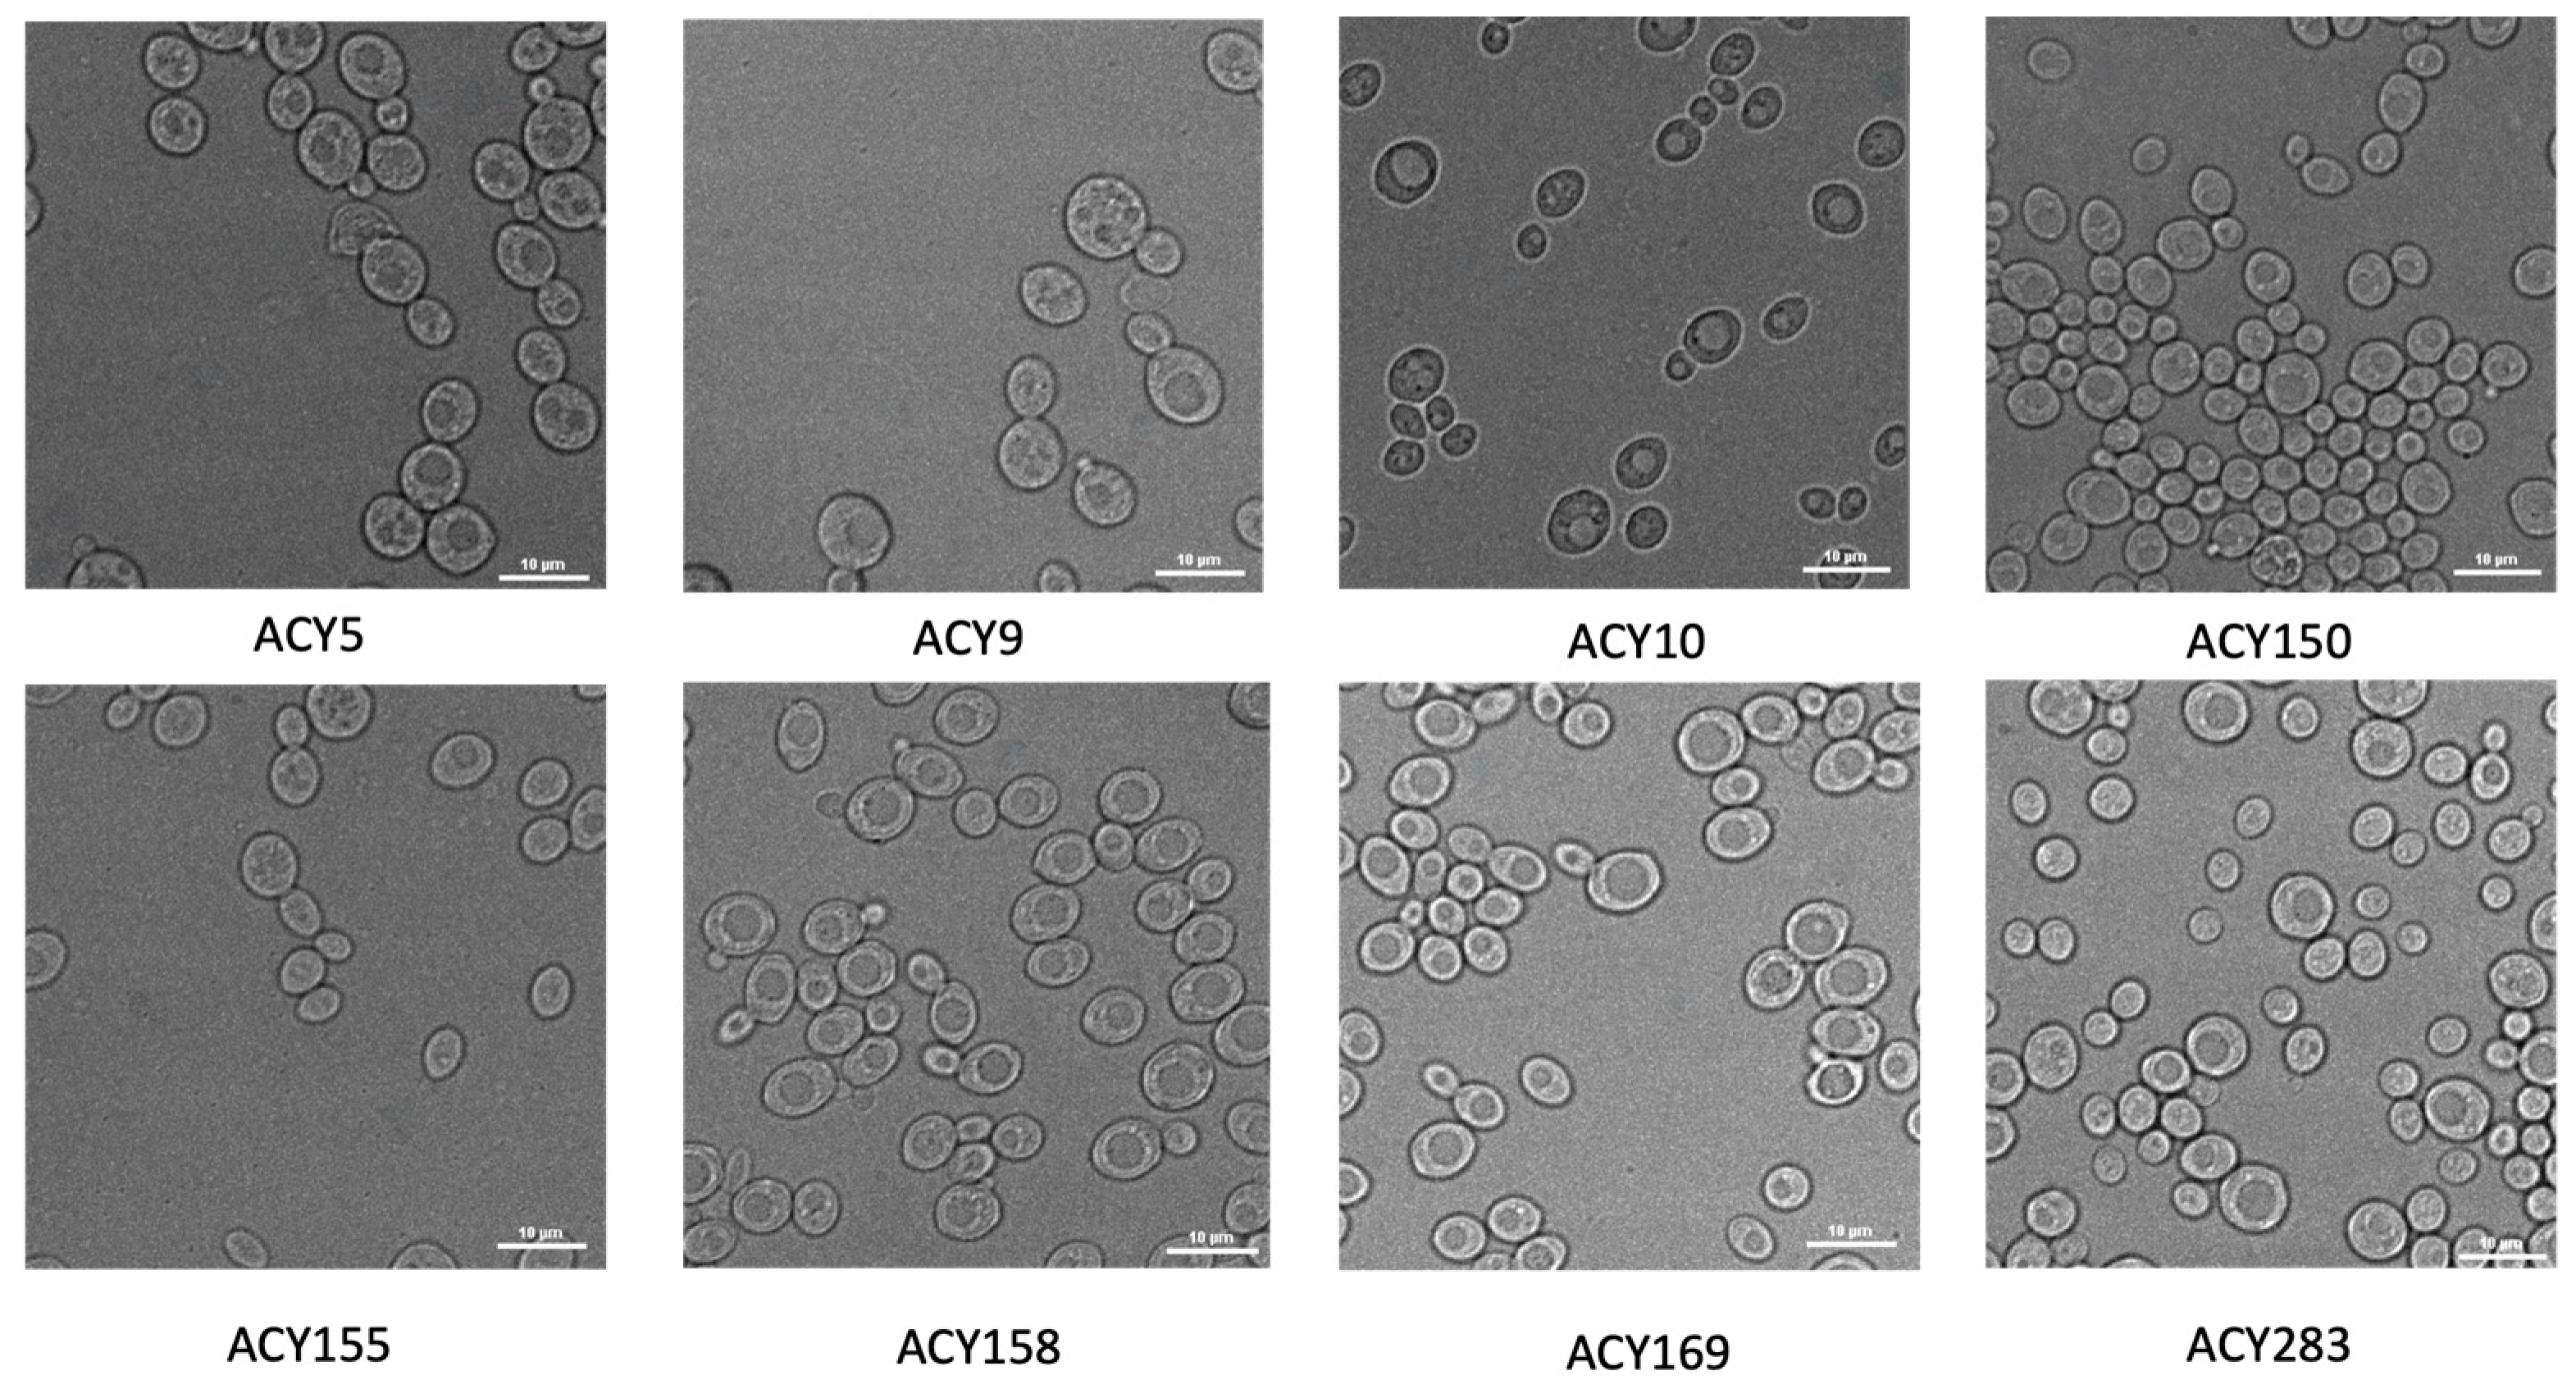
Figure 1. Microscopic examination of yeast morphology. The images were captured at 400× magnification. Cells were grown in YPD to the stationary phase.
Fermentation 10 00364 g001
Figure 2. Fermentation kinetics of yeast strains. Yeast strains were inoculated into a fermentation medium at an initial optical density (OD600) of 0.1 and grown in 300 mL flasks containing 100 mL of YPD at 30 °C with constant agitation at 200 RPM. Samples were taken at regular intervals over a 48 h period. Residual glucose was measured at 0, 6, 8, 10, 12, 14, and 16 h timepoints, while OD600 and ethanol production were measured at 0, 6, 8, 10, 12, 14, 16, 18, 24, 30, 42, and 48 h timepoints. pH was measured before and after fermentation.
Fermentation 10 00364 g002
Figure 3. Doubling times of yeast strains under glucose-rich and glucose-limited conditions. The green bars indicate the doubling time in glucose-rich conditions (YP medium with 2% glucose), and the blue bars show the doubling time in glucose-limited conditions (YP medium with 0.5% glucose). Error bars represent the standard deviation from the mean. Statistical significance between conditions for each strain is denoted by asterisks (** p < 0.01), with ‘ns’ indicating no significant difference.
Fermentation 10 00364 g003
Figure 4. Heat shock response and cellular defense mechanisms. (a) survival rates after exposure to 45 °C for 1 h, with pretreatments including mild heat shock at 37 °C, sorbic acid, and ethanol, to assess the enhancement of heat survival; (b) levels of intracellular trehalose before and after heat shock in both log and stationary phases; (c) ROS levels before and after heat shock, also during log and stationary phases, to measure oxidative stress. Error bars indicate standard deviation from three or more biological replicates. Statistical significance compared to untreated controls is represented with asterisks, where * p < 0.05, ** p < 0.01, *** p < 0.001, and **** p < 0.0001.
Fermentation 10 00364 g004
Table 1. Strains’ information and their fermentation profiles.
StrainDescriptionFermentation Profile
Average Glucose Consumption Rate (g/L/h)Average Ethanol Production Rate (g/L/h)pH Change (pHinitial − pHfinal)
ACY5WLP001 California Ale (White Labs)0.662 ± 0.0040.185 ± 0.0000.483 ± 0.080
ACY9WLP004 Irish Ale Yeast (White Labs)0.661 ± 0.0040.236 ± 0.0101.947 ± 0.238
ACY10WLP300 Hefeweizen Ale Yeast (White Labs)0.996 ± 0.0040.197 ± 0.005−1.487 ± 0.050
ACY150Lalvin 71B (Lallemand)0.990 ± 0.0100.255 ± 0.023−1.253 ± 0.110
ACY155Lalvin BM45 (Lallemand)0.976 ± 0.0020.228 ± 0.019−1.327 ± 0.117
ACY158Lalvin ICV D254 (Lallemand)0.981 ± 0.0040.173 ± 0.009−1.397 ± 0.106
ACY169Lalvin V1116 (Lallemand)0.978 ± 0.0020.195 ± 0.007−1.633 ± 0.144
ACY283Lab strain S288C derivative0.658 ± 0.0020.023 ± 0.007−0.353 ± 0.097
Table 2. Variation in carbon source utilization.
StrainDoubling Time (h)
YP + 2% GlucoseYP + 2% FructoseYP + 2% GalactoseYP + 2% MaltoseYP + 2% TrehaloseYP + 2% SucroseYP + 2% RaffinoseAVERAGE (Normalized)
ACY52.70 ± 0.173.04 ± 0.343.75 ± 0.273.90 ± 0.329.85 ± 0.092.86 ± 0.304.29 ± 0.190.275
ACY92.22 ± 0.153.91 ± 0.365.66 ± 0.304.63 ± 0.344.09 ± 0.243.83 ± 0.223.11 ± 0.260.261
ACY102.22 ± 0.262.09 ± 0.242.76 ± 0.353.15 ± 0.1210.12 ± 0.182.06 ± 0.482.69 ± 0.200.722
ACY1501.34 ± 0.222.59 ± 0.253.35 ± 0.313.14 ± 0.096.37 ± 0.183.35 ± 0.442.91 ± 0.380.630
ACY1551.32 ± 0.272.70 ± 0.242.32 ± 0.232.83 ± 0.115.80 ± 0.242.61 ± 0.103.32 ± 0.290.735
ACY1581.73 ± 0.362.72 ± 0.332.43 ± 0.242.87 ± 0.065.48 ± 0.402.64 ± 0.083.10 ± 0.370.718
ACY1691.07 ± 0.282.55 ± 0.092.56 ± 0.262.56 ± 0.143.46 ± 0.062.74 ± 0.191.67 ± 0.180.875
ACY2831.80 ± 0.242.02 ± 0.242.89 ± 0.312.51 ± 0.215.75 ± 0.241.92 ± 0.142.66 ± 0.160.836
The ANOVA test performed across the different carbon sources shows a significant difference in doubling times (F (6, 49) = 12.579, p < 0.0001).
Table 3. Variation in high-osmolarity and cold tolerance.
StrainDoubling Time (h)Maximum OD600Time before Enters Log Phase (h)Scoring (Normalized)
Osmotic Stress (1 M Sorbitol)Cold Stress (4 °C)Osmotic Stress (1 M Sorbitol)Cold Stress (4 °C)Osmotic Stress (1 M Sorbitol)Cold Stress (4 °C)Osmotic Stress (1 M Sorbitol)Cold Stress (4 °C)
ACY52.63 ± 0.232.15 ± 0.03 1.74 ± 0.062.46 ± 0.1313.0 ± 0.3027.0 ± 0.140.1100.861
ACY92.07 ± 0.252.09 ± 0.031.47 ± 0.091.34 ± 0.078.0 ± 0.2734.0 ± 0.140.4800.650
ACY102.24 ± 0.265.63 ± 0.031.89 ± 0.010.26 ± 0.0313.0 ± 0.2847.0 ± 0.130.3340.309
ACY1501.83 ± 0.272.00 ± 0.032.20 ± 0.082.23 ± 0.078.0 ± 0.2921.0 ± 0.120.8800.882
ACY1551.93 ± 0.274.13 ± 0.031.56 ± 0.082.33 ± 0.079.0 ± 0.3014.0 ± 0.120.5260.902
ACY1581.66 ± 0.2918.31 ± 0.022.00 ± 0.110.29 ± 0.038.0 ± 0.2647.0 ± 0.130.8660.004
ACY1691.95 ± 0.311.89 ± 0.022.21 ± 0.071.64 ± 0.027.0 ± 0.3411.0 ± 0.130.8790.887
ACY2832.38 ± 0.31 2.18 ± 0.021.89 ± 0.022.13 ± 0.127.5 ± 0.3231.0 ± 0.110.5510.782
A MANOVA test was conducted for the osmotic stress data, revealing statistically significant differences among the strains (Wilks’ lambda = 0.0116, F (21, 28.465) = 8.7487, p < 0.0001). A MANOVA test was conducted for the cold stress data, revealing statistically significant differences among the strains (Wilks’ lambda = 0.0035, F (21, 28.465) = 12.872, p < 0.0001).
Table 4. Variation in acid and ethanol tolerance.
StrainDoubling Time (h)Maximum OD600Time before Enters Log Phase (h)Scoring (Normalized)
Acid Stress (pH = 2.2)10% Ethanol StressAcid Stress (pH = 2.2)10% Ethanol StressAcid Stress (pH = 2.2)10% Ethanol StressAcid Stress (pH = 2.2)10% Ethanol Stress
ACY55.25 ± 0.1124.30 ± 0.071.63 ± 0.160.39 ± 0.0323.0 ± 0.5947.0 ± 0.250.0760.003
ACY92.48 ± 0.1111.38 ± 0.081.16 ± 0.070.38 ± 0.0313.0 ± 0.6247.0 ± 0.240.5370.277
ACY102.18 ± 0.119.41 ± 0.103.01 ± 0.111.09 ± 0.117.0 ± 0.6426.0 ± 0.330.9820.645
ACY1502.29 ± 0.115.62 ± 0.132.01 ± 0.121.92 ± 0.127.0 ± 0.6122.0 ± 0.300.8060.915
ACY1552.43 ± 0.108.22 ± 0.122.30 ± 0.181.57 ± 0.147.0 ± 0.5718.0 ± 0.150.8360.833
ACY1582.61 ± 0.116.87 ± 0.122.44 ± 0.021.57 ± 0.027.0 ± 0.6126.0 ± 0.310.8340.786
ACY1693.35 ± 0.116.59 ± 0.122.30 ± 0.172.03 ± 0.248.0 ± 0.5715.0 ± 0.190.6980.979
ACY2833.26 ± 0.118.31 ± 0.122.59 ± 0.191.28 ± 0.056.0 ± 0.5826.0 ± 0.260.7910.703
A MANOVA test was conducted for the acid stress data, revealing statistically significant differences among the strains (Wilks’ lambda = 3.67 × 10⁻⁵, F (21, 201.5523) = 326.75, p < 0.0001). A MANOVA test was conducted for the ethanol stress data, revealing statistically significant differences among the strains (Wilks’ lambda = 8.35 × 10⁻⁸, F (21, 201.552) = 2791.26, p < 0.0001).
Table 5. Overall stress tolerance of the tested yeast strains.
StrainOverall Scoring
ACY50.296
ACY90.315
ACY100.622
ACY1500.773
ACY1550.695
ACY1580.671
ACY1690.864
ACY2830.726
Disclaimer/Publisher’s Note: The statements, opinions and data contained in all publications are solely those of the individual author(s) and contributor(s) and not of MDPI and/or the editor(s). MDPI and/or the editor(s) disclaim responsibility for any injury to people or property resulting from any ideas, methods, instructions or products referred to in the content.