Abstract
Sour beers play an important role in the brewing market, and their production has been growing exponentially. In light of this, six microorganisms directly related to this class of beer were studied, and the fermentation behavior of six strains used in the past for traditional commercial Berliner Weisse beer production was monitored. The microorganisms used were Lactobacillus brevis, Lactobacillus parabrevis, Brettanomyces bruxellensis, and Brettanomyces anomalus and two strains of Saccharomyces cerevisiae. The six microorganisms were selected in a previous work, and a comparison between single and mixed fermentations was carried out via daily measurements of the fermentation parameters like pH, extract, and cell count during 22 days. The ability to isolate a specific microorganism from a mixed culture was investigated using three commonly used nutrient media and aerobic/anaerobic growth conditions. Both Lactobacillus and Brettanomyces could be isolated; however, the conditions imposed were not sufficient in order to isolate Saccharomyces. Fermentations carried out with LAB and Brettanomyces showed a decrease in Lactobacillus growth if compared to pure fermentations, but no influence on the growth of Brettanomyces could be perceived. In general, fermentations carried out in the presence of Saccharomyces were dominated by this yeast. Its quick growth seems to be responsible for the high end pH values observed as well as the decrease in cell growth for both LAB and Brettanomyces. A decrease in the cell viability of Saccharomyces was followed by an increased growth of the other microorganisms involved, possibly meaning that the molecules released through apoptosis are used by both LAB and Brettanomyces as a valuable nutrient source. The volatile compound concentrations of the first group were higher in fermentations with Saccharomyces, whereas esters’ concentration was higher in fermentations carried out only with Brettanomyces and Lactobacillus. Furthermore, understanding how these microorganisms interact during the fermentation process can help brewers better control production and ensure the consistency in the quality of the final product. The end pH values and acidity reached levels acceptable for Berliner Weisse beer. This innovative approach certainly contributes to the evolution and refinement of the art of brewing.
1. Introduction
Poor cell behavior prediction, sluggish fermentations, and off-flavors are some very common problems encountered by breweries. At the end of the 19th century, to try to avoid and correct the flaws during beer production, Emil Christian Hansen, the director of the physiological department at Carlsberg Laboratory, started to work on pure culture fermentations, the most widely used fermentation technique for beer production [1].
The presence of any microorganism other than the ones desired is considered, in many cases, dangerous and detrimental to beer quality. The great majority of breweries nowadays use specific single strains which can be controlled and evaluated by means of common and well-known measurements and observations. Across the spectrum, there are breweries, often smaller in scale, employing multiple microorganisms or foregoing cell pitching altogether to initiate fermentation [2].
The fermentation of wort using mixed cultures usually can be divided into two parts, primary and secondary fermentation. The primary fermentation is characterized by the action of microorganisms that consume the great majority of the simplest and most available fermentable sugars while producing CO2, ethanol, and byproducts. During this phase, the pH drops for a variety of reasons. Cells take in basic molecules like ammonium ions and excrete organic acids. The main microorganisms responsible for the primary fermentation during beer production are the top- and bottom-fermenting yeasts, Saccharomyces cerevisiae and Saccharomyces Pastorious, respectively [1,3,4]. Secondary fermentation takes place in parallel with and after primary fermentation. The analysis carried out during spontaneously fermented Lambic showed that the types of microorganisms present depend on the age of the beer. After primary fermentation, strong bacterial activity was observed, which is linked to lactic acid and ethyl lactate production. At the end, yeast cells were identified as responsible for the super attenuation of these beers. Both prokaryotic and eukaryotic groups have, because of their differentiated enzymatic diversity, an immense impact on flavor development. Many molecules, as mercaptans and acetic acid, can be formed directly from raw material and from metabolites excreted in the medium previously by other microorganisms [5,6,7].
Many brewers believe that they can mimic these flavors once that they know which microorganisms are present, the compounds they metabolize, and the technical aspects of the process. To achieve predictable results, breweries are developing techniques to produce mixed fermented beers using pure cultures in separated fermentation steps. The best examples are the methods used for souring wort before the main fermentation using lactic acid bacteria (LAB) [8,9].
However, it is important to observe that not all mixed fermentations yield sour beers. In the past years, the brewing community has also seen an increased interest in the flavor contribution from wild yeast, the most famous being the genus Brettanomyces, which was the first described by Claussen (1904) while studying the secondary fermentation and development of flavors of the finest English stock ales. Known as a super attenuative yeast, Brettanomyces is commonly added to secondary fermentations, and its set of enzymes is responsible for many secondary flavor-active compounds [10,11].
There seems to be a tendency for breweries to use a triad of Saccharomyces, lactic acid bacteria, and Brettanomyces strains to produce mixed fermented sour beers, especially for the Berliner Weisse style. We can separate mixed sour fermentation under the quick and slow categories. Quick mixed sour fermentations are usually characterized by a quick souring method before primary fermentation. The most widely used procedure is the “sour kettle”. It is defined as the acidification of wort by using LAB at the optimum temperature levels for the strain. The bulk lactic acid is produced between 24 and 72 h (1–3 days). It has the advantage of speed and microbiological stability once that the wort can be heated up to kill other microorganisms. One disadvantage is that after souring the wort, it is usually pasteurized to kill the bacteria; the high temperatures can volatilize some important flavor compounds and precursors. On the other hand, the slow souring methods demand time to elapse, and LAB is pitched at the very beginning of fermentation and can act at normal fermentation temperatures [3]. This process can take between weeks and months.
The complexity of the microflora is responsible for the huge number of flavor-active compounds [2,9,12]. It is not unusual to find these “secondary” microorganisms present and active in beers aged in wooden vessels. Spontaneous fermented beers are the best example. According to a historical survey, it is reasonable to affirm that these microorganisms, when not purposely added, originate mainly from raw material, air, and pores on the wood surfaces [8,12].
In this study, the sour beer selected was Berliner Weisse. According to the Beer Judge Certification Program (BJCP), this beer style is characterized as a pale-colored, refreshing, low-alcohol German wheat beer with a clean lactic sourness and a very high carbonation level. A light bread dough malt flavor supports the sourness, which should not seem artificial. Any Brettanomyces funk is restrained. The wheat aroma may present as uncooked bread dough in fresher versions; combined with the acidity, it may suggest sourdough bread. The recipe may contain wheat malt, typically 50% of the grist with the remainder typically being pilsner malt. A symbiotic fermentation with top-fermenting yeast and Lactobacillus (various strains) provides the sharp sourness, which may be enhanced by the blending of beers of different ages during fermentation and by extended cool aging. German brewing scientists believe that Brettanomyces is essential to obtain the correct flavor profile, but this character is never strong. Compared to a lambic, it is generally not as acidic and has a clean lactic sourness which is restrained to below the sensory threshold funk. It is also lower in alcohol content [13].
The objective of this study was to monitor the fermentation behavior of six strains used in the past for traditional commercial Berliner Weisse beer production. When working with mixed cultures in a brewery, it is important to be able to separate the different microorganisms and ascertain that cross contamination is not occurring. For that reason, an evaluation of the isolation and culturability capacity of these strains on selective media was carried out, looking to scale up the input of some innovations in sour beer production, which has the potential to innovate the Berliner Weisse and Catharina Sour styles and others.
2. Materials and Methods
2.1. Cell Count
The cell number was assessed via bright field microscopy using an Olympus CH-2 microscope (Olympus Corporation, Tokyo, Japan) at 400× and 600× magnifications. Two different hemocytometers were used: a 0.01 mm deep Assistent® Bacterial Thoma Chamber (Karl Hecht GmbH & Co KG, Rhön, Germany) and a 0.1 mm deep Yeast Thoma Chamber (FeinOptik, Bad Blankenburg, Germany). Cell suspensions were diluted with a 0.9% NaCl solution prior to counting.
2.2. Analytical Techniques
The pH values were measured at 20 °C using a Calimatic pH-meter 766 (Knick Elektronische Messgeräte, Berlin, Germany). The apparent extract values were measured using a portable DMA 35 density meter (Anton-paar, Graz, Austria) at 20 °C. The specific gravity was measured using a calibrated hydrometer (VLB, Berlin, Germany) at 20 °C. The decarbonation of samples was carried out via filtration through a Whatman 597 1/2 filter (GE Healthcare Life Sciences, London, UK) followed by a Bandelin SONOREX™ Digital 10 P ultrasonic bath (Sigma-Aldrich, St Louis, MI, USA). The yeast surplus was removed via centrifuging at 10,000 rpm for 5 min at 20 °C using an AvantiTM J-25 centrifuge (Beckman Coulter, Brea, CA, USA). The final real extract, density values, and pH of the decarbonated samples were measured using a DMA 4500 M density meter plus a Alcolyzer Beer ME (Anton-paar, Graz, Austria). The titratable acidity was measured according to the ASBC Beer-8 Potentiometric Method.
2.3. Quantification of Esters and Higher Alcohols
The esters measured in this study included the following ethyl esters: format, acetate, propionate, butyrate, caproate, caprate, caprylate, valerate, dodecanoate, and tetradecanoate. Acetate esters’ analysis included isoamyl, isopropyl, isobutyl and hexyl acetate. Alcohols include methanol, n-propanol, isobunatol, 2-methyl-1-butanol, 3-methyl-1- butanol, and 2-phenylethanol. Aldehydes included acetaldehyde and phenylacetaldehyde.
The compounds were measured via headspace (HS)-SPME-GC/FID and using a Gerstel MultiPurposeSampler MPS (GERSTEL GmbH & Co.KG, Mulheim an der Ruhr, Germany) for sampling. Volumes of 5 mL beer + 2 g NaCl were added to 20 mL vials, and the volatiles were adsorbed via a SPME fiber assembly polyacrylate (PA), df 85 μm, for use with autosamplers, with a needle size of 23 ga (Sigma-Aldrich, St. Louis, MI, USA) for 30 min at 40 °C under constant stirring.
The volatiles were desorbed in the GC port at 240 °C (splitless) and were separated on a DB-WAX column (60 m, 0.50 μm, 240/250; Agilent Technologies, St. Clara, CA, USA) by using the constant pressure mode and following the temperature program: 40 °C for 3 min, heating to 200 °C at 4 °C/min, in 2 min to 220 °C, and holding for 15 min. Quantification was performed using a matrix-matched standard addition in beer using a 5-point calibration.
2.4. Wort Preparation
The malt bill was composed of 25% pilsner barley malt, 25% chit barley malt, and 50% wheat malt (Weyermann, Bamberg, Germany). Wort was prepared to yield a medium rich in dextrines. The final concentration was measured at 7.2 °P and pH 5.5 ± 0.05. Kegs were filled with hot wort and transferred to a cold room at 2 °C, where they were kept until needed.
2.5. Bottle Conditioning
To test for further acidification and extract consumption during the bottle conditioning for mixed cultures, 10% of 7.2 °P wort, produced as described above, was added to each fermentation tank, and its content was bottled in sterile flip-top 0.5 L bottles. The bottles were autoclaved at 121 °C for 15 min at 15 psi. For conditioning, they were kept upright at 12 °C for two months. The pH and extract were measured after one and two months as described for the fermentation samples. The slurry decantated after the last measurement was not transferred to the bottles.
2.6. Microorganisms
All the microorganisms used in this study belong to the Yeast Bank from the Brewing Department of the Technische Universität Berlin. The strains were screened for flavor production during previous work.
In the literature, it is more common to find the term Brettanomyces instead of Dekkera. For this reason, both B1 and B2 are referred to as Brettanomyces bruxellensis and Brettanomyces anomalous, respectively. The yeast strains used were identified through the Real-Time-Polymerase Chain Reaction (RT-PCR) by the Forschungszentrum Weihenstephan für Brau- und Lebensmittelqualität, Technische Universität München.
The two strains of Saccharomyces cerevisiae were named S1 and S2. The two strains of LAB were Lactobacillus brevis (L1) and Lactobacillus parabrevis (L2). These microorganisms were selected for their historical relevance in Berliner Weisse production and sour beers.
2.7. Conditions of Storage, Detection, and Enumeration
All the microorganisms were stored at 4 °C. B1 and B2 strains were stored on MYPG agar containing malt extract, 3 g/L; yeast extract, 3 g/L; glucose 10 g/L; peptone, 2 g/L (Sifin, Berlin, Germany); agar 15 g/L and CaCO3 2 g/L (Carl Roth, Karlsruhe, Germany). S1 and S2 strains were stored on wort agar prepared by diluting 15 g/L of agar (Carl Roth, Karlsruhe, Germany) in 7.2 °P wort. Both media had their pH adjusted to 5.0 using HCl and autoclaved at 121 °C for 15 min at 15 psi. The initial growth was at 25 °C in a dark, aerobic growth chamber. The L1 and L2 strains were kept on MRS Broth (Carl Roth, Karlsruhe, Germany). A total of 52 g/L MRS was added to distilled water, and the pH was adjusted to 6.2 using HCl and autoclaved at 121 °C for 15 min at 15 psi. The initial growth was at 25 °C in a dark, anaerobic growth chamber.
The ability of Brettanomyces to grow on lysine agar (VLB Berlin, Berlin, Germany) was assessed. The bottles were handled as specified by the producer. The initial growth was at 25 °C in a dark, aerobic growth chamber.
2.8. Isolating Microorganisms Using Selective Media
The ability to grow each one of the strains and isolate a specific microorganism from a mixed liquid culture was evaluated using three different media under both aerobic and anaerobic conditions. MYPG agar was prepared as described above. The addition of a 0.1% solution of cycloheximide, 10 mg/L (10 ppm) was carried out after autoclaving once that the media were at the pouring temperature. VLB-S7-S (VLB, Berlin, Germany) and NBB® -A agar (Döhler, Darmstadt, Germany) were prepared as recommended by the manufacturers. Each microorganism was inoculated under the conditions displayed below. The plates were then incubated at 25 °C until growth could be observed. Anaerobic growth was carried out in anaerobic jars using Anaerocult® A (Merck KGaA, Darmstadt, Germany).
2.9. Propagation of the Yeast and Bacterial Strains
Upon the growth of the inoculum culture on the media plate as described above, single cells were looped for propagation. A quantity of 500 mL Erlenmeyer flasks containing a stir bar were autoclaved at 121 °C for 15 min at 15 psi. Immediately after autoclaving, 100 mL of wort was added and then placed in a water bath to be pasteurized at 80 °C for 5 min. After cooling to 20 °C, the flasks were inoculated, and sterile airlocks were inserted on top. The contents were kept under an agitation rate of 200 rpm by means of magnetic stirrer plates at an average temperature of 25 °C.
The initial cell growth from single colonies proceeded for 72 h (3 days). The contents were transferred to new sterile Erlenmeyer flasks containing 250 mL of wort prepared as described above. The second propagation step was carried out for 4–7 days for Saccharomyces sp. and Brettanomyces sp., respectively, reaching the stationary phase of growth before inoculation into the fermenters.
For bacteria, 150 mL Duran® bottles containing 75 mL of distilled water were autoclaved at 121 °C for 15 min at 15 psi. Immediately after autoclaving, 100 mL of wort was added and then placed in a water bath to be pasteurized at 80 °C for 5 min. After cooling to 20 °C, the flasks were inoculated, and sterile airlocks were inserted on top. The bottles were then placed in an incubator and kept at 30 °C for 10 days. All the propagation steps performed throughout this project were carried out in duplicate and in the same way, except when stated otherwise. For the viability tests, the yeast samples taken from the propagators were transferred to 15 mL sterile plastic tubes, which were then dipped in liquid nitrogen for 60 s.
The samples were thawed at 25 °C; their contents were homogenized, and 1 mL was transferred into pre-sterilized glass test tubes containing 9 mL of 0.9% NaCl solution. For each sample, the test tubes were then homogenized, and 1 mL was transferred into a new presterilized glass test tube containing the salt solution. Further dilutions were carried out in order to achieve suspensions from 10-1 to 10-8. A volume of 1 mL of each dilution step was plated on wort agar using the spread plate technique. The plates were then incubated at 25 °C under aerobic conditions until single colonies could be observed and counted. Their viability was measured by comparing the number of cells counted in the non-diluted thawed yeast suspension to the number of CFU observed after growth.
2.10. Bright Field Microscopy
A 0.8 mM TB solution was prepared by dissolving 7.68 mg of trypan blue (Carl Roth, Karlsruhe, Germany) in 10 mL of PBS solution (NaCl, 8 g/L; KCl, 0.2 g/L; Na2HPO4, 1.42 g/L; KH2PO4, 0.24 g/L). Of the thawed yeast suspension, 20 μL was diluted at a 1:50 rate with a 0.9% NaCl solution. Of this solution, 100 μL was then mixed with 100 μL of the 0.8 mM trypan blue preparation and allowed to rest for 30 s before counting. Löfflers methylene blue (Carl Roth, Karlsruhe, Germany) was diluted with distilled water at a 1:10 ratio. A total of 1000 μL of the diluted yeast suspension was mixed with 50 μL of the MB solution and allowed to rest for 3 min before counting. All the cell counting was carried out at 400× magnification using the yeast hemocytometer mentioned above.
2.11. Cell Viability Determination
The cell viability determination was carried out by using the fluorescence method. Of the thawed yeast suspension, 20 μL was diluted at a 1:50 rate with a 0.9% NaCl solution. A volume of 20 μL of this solution was then mixed with 20 μL of a 0.1% propidium iodide preparation (Sigma-Aldrich, USA) and allowed to rest for 30 s before counting, using a Cellometer® Vision cell counter (Nexcelom Bioscience, St. Lawrence, KS, USA). Single and mixed culture fermentation 5 L Duran® bottles containing 3.5 L of wort were prepared as described above. Stir bars were added to all the bottles prior to autoclaving.
With the purpose of determining the total amount of cells existing inside the fermenters, a simple sampling method to ensure the homogeneity was used throughout this work. The content of the fermenters was mixed for 2 min using a stir plate set at 100 rpm to minimize the oxygen intake. The airlocks were removed and 10 mL samples were taken using pre-autoclaved glass pipettes. The samples were then transferred into 15 mL sterile plastic tubes for further cell counting, viability and pH testing, and extract measurement. All the fermentations and measurements were carried out in duplicate, except when stated otherwise.
3. Results
3.1. Microorganismsand Isolating Using Selective Media
All the microorganisms used in this study belong to the Yeast Bank from the Brewing Department of the Technische Universität Berlin. The strains were screened for flavor production during previous work. In literature it is more common to find the term Brettanomyces instead of Dekkera. For this reason both B1 and B2 will be refered to as Brettanomyces bruxellensis and Brettanomyces anomalus respectively.
The yeast strains used were identified through Real-Time-Polymerase Chain Reaction (RT-PCR) by the Forschungszentrum Weihenstephan für Brau- und Lebensmittelqualität, Technische Universität München. They were cassified as below (Table 1):

Table 1.
Microorganisms used during this study. Yeasts were identified via RT-PCR.
The ability to isolate pure cultures from a mixed population using selective media was assessed. Both strains of Saccharomyces, S1 and S2, were not capable of growing on the media tested under the conditions imposed. L1 and L2 showed little capacity to grow under aerobic conditions. Weak growth was observed only when using VLS-S7-S. Growth under anaerobiosis was moderate or strong for all the mediums used. The Brettanomyces strains, B1 and B2, grew well on MYPG containing cycloheximide and on NBB® -A. No or very weak growth was detected on VLB-S7-S (Table 2).
Table 2.
Growth of cells on selective media at 25 °C for 7–10 days until CFU could be counted.
3.2. Viability Tests
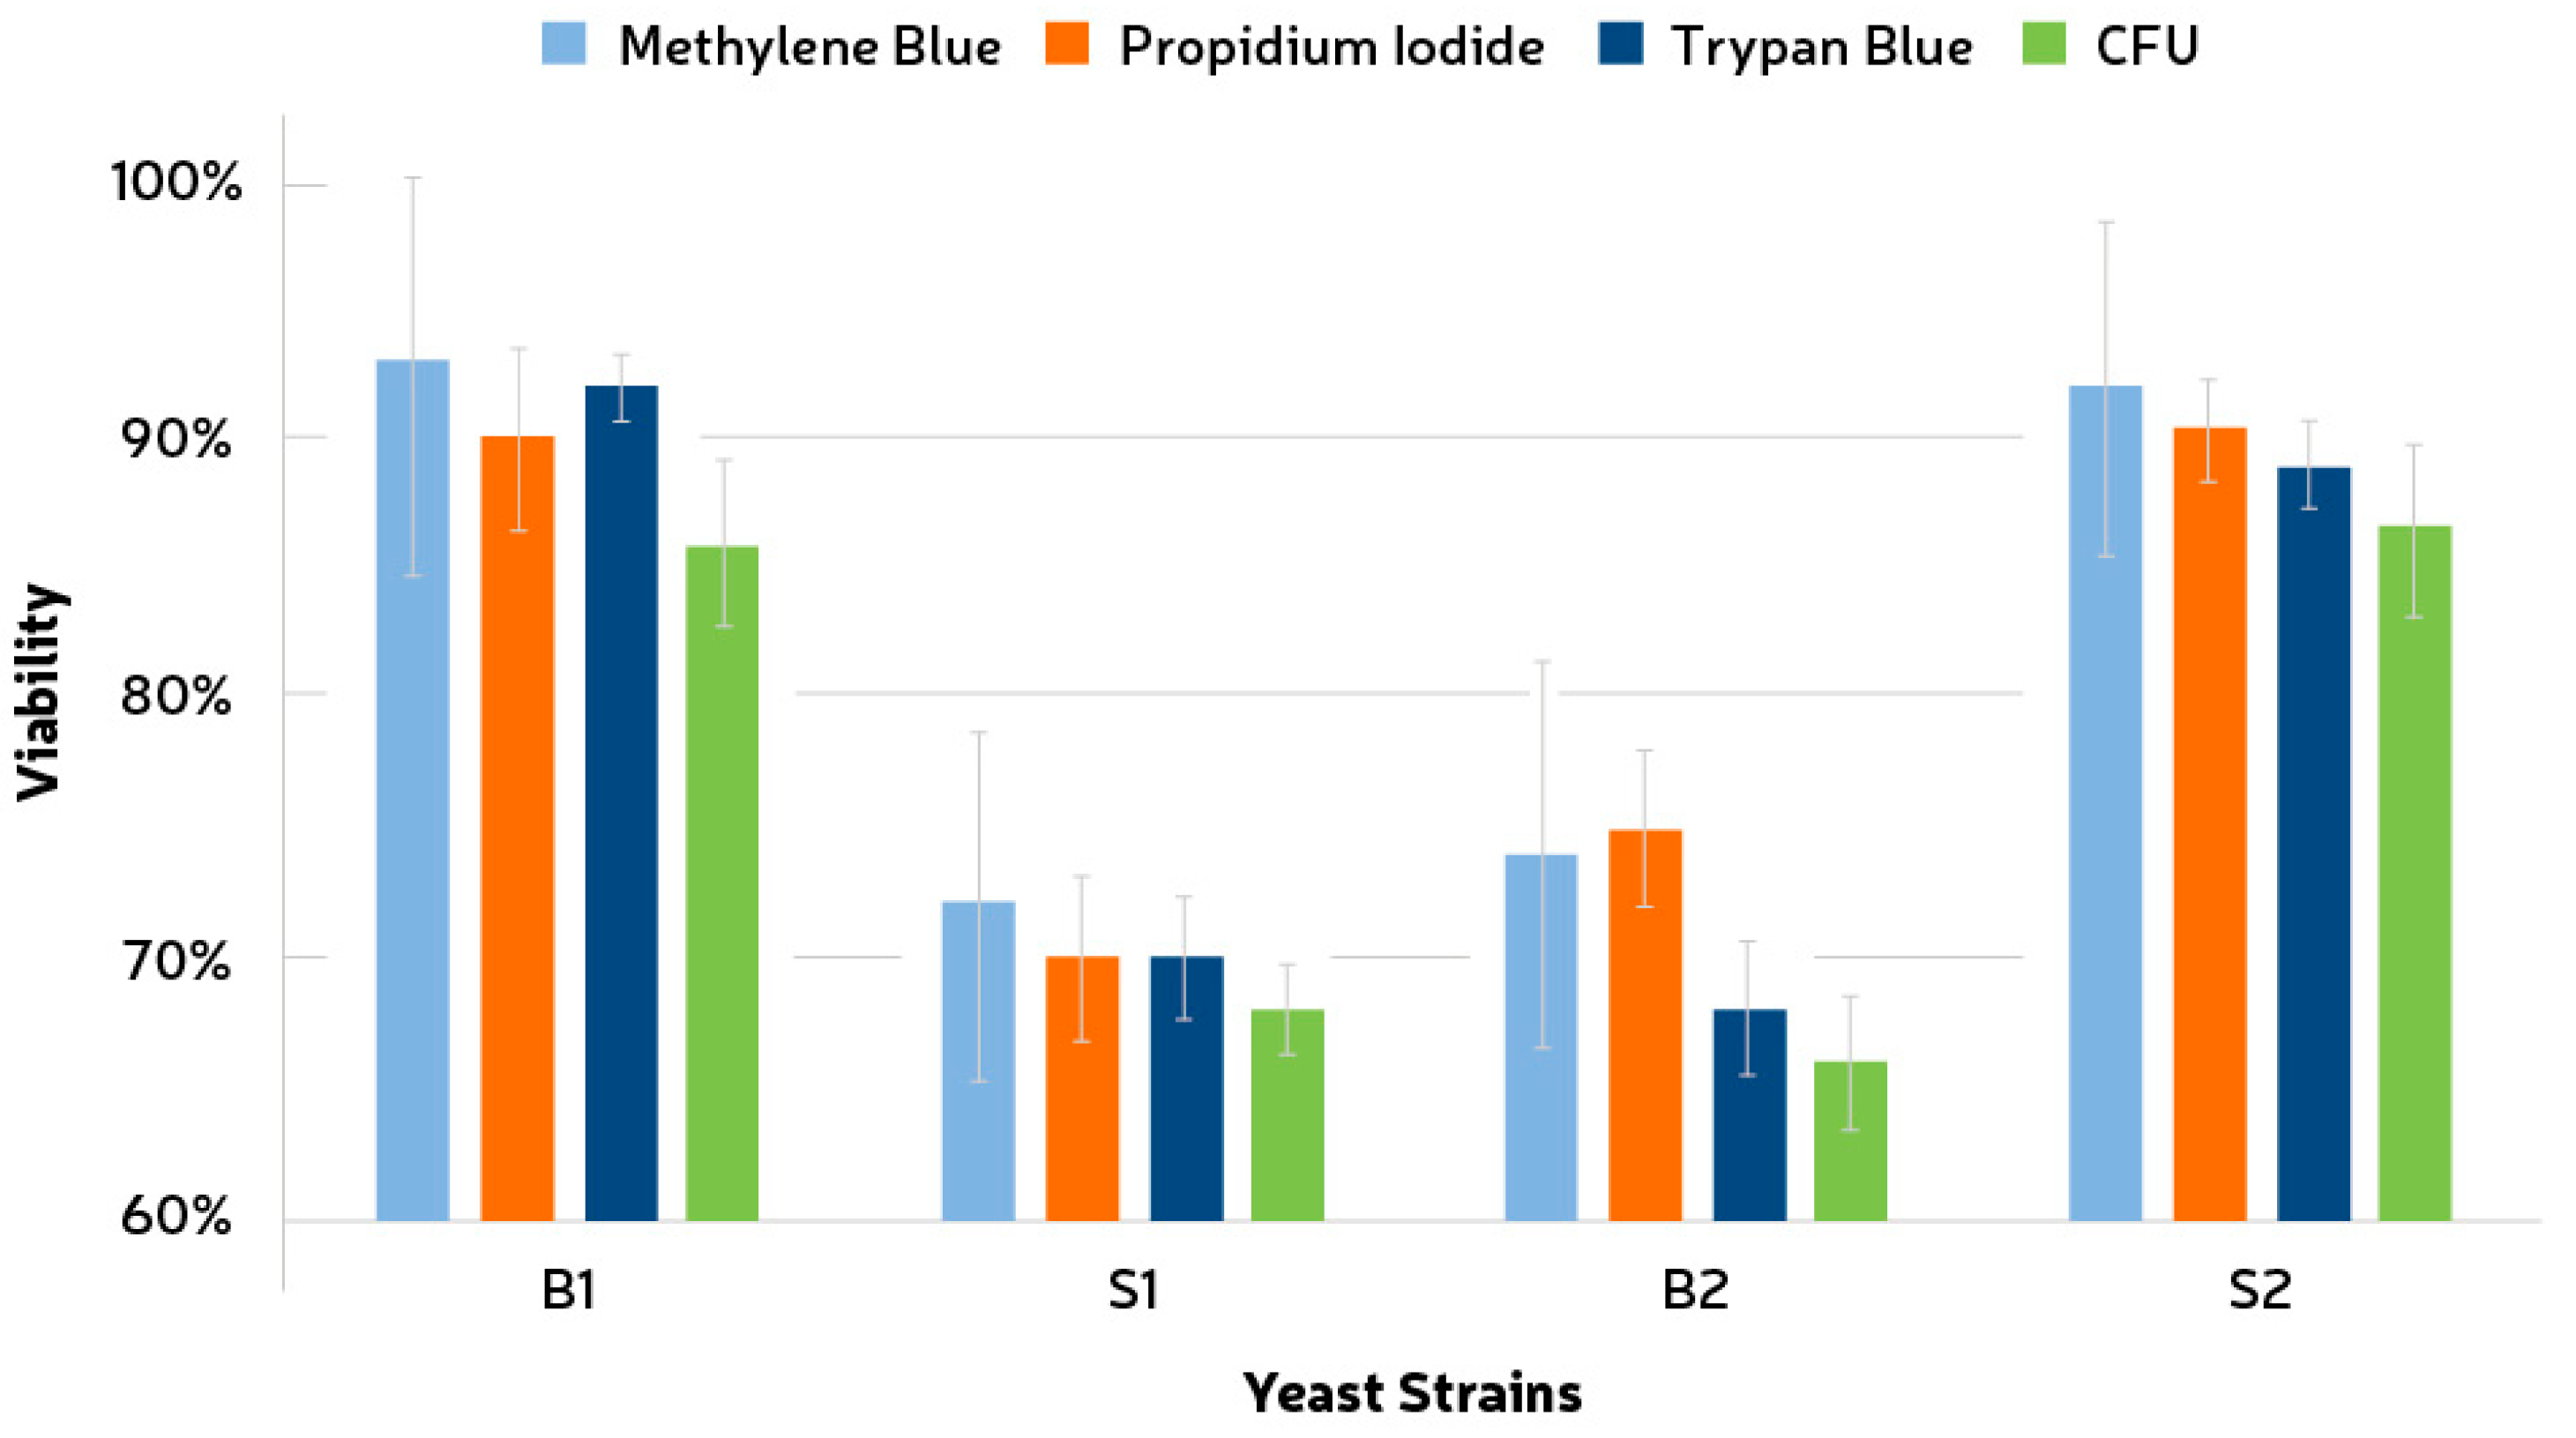
Three different vital stains were evaluated for viability assessment of the yeast strains used, i.e., methylene blue, trypan blue, and propidium iodide. Staining with these chemicals was compared to seriated dilutions followed by growth and CFU formation (Figure 1). The total number of cells was obtained via cell counting as described in the above section. CFU counting showed values of 72% (±3.2%), 58% (±1.7%), 56% (±2.6%), and 74% (±3.3%) for the strains B1, S1, B2, and S2, respectively. Only for strain S1 did the staining method (TB) exhibit a lower viability than the CFU counting. The standard deviations for MB were the highest among all tests, i.e., 8.3%, 6.7%, 7.4%, and 6.4% for B1, S1, B2, and S2, respectively. This result, together with the fact that the values for MB were higher than CFU in all the cases, indicates that a significant overestimation (p < 0.05) could be an issue if using this chemical. Propidium iodide also showed an overestimation pattern, especially for B2. The standard deviations for TB were the lowest and were measured as 1.3%, 2.4%, 2.5%, and 1.67% for B1, S1, B2, and S2, respectively. It was also observed that the contact time between the TB solution and the cells decreased the viability of the sample quickly.
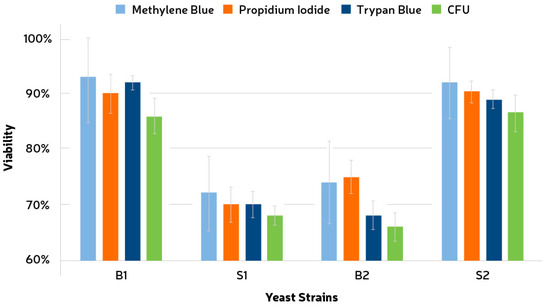
Figure 1.
Comparison between three different vital stains and seriated dilution for cell viability assessment. Stained cells were considered non-viable. Wort agar was used for growth assessment at 25 °C through CFU counting. B1, Brettanomyces bruxellensis; B2, Brettanomyces anomala; S1 and S2, Saccharomyces cerevisiae.
3.3. Comparison between Single and Mixed Fermentations: Cell Count
Cells were propagated under anaerobic and semi anaerobic conditions as explained above for LAB and yeasts, respectively. The cell viability for yeasts was considered when calculating the volume that should be added to each fermentation tank.
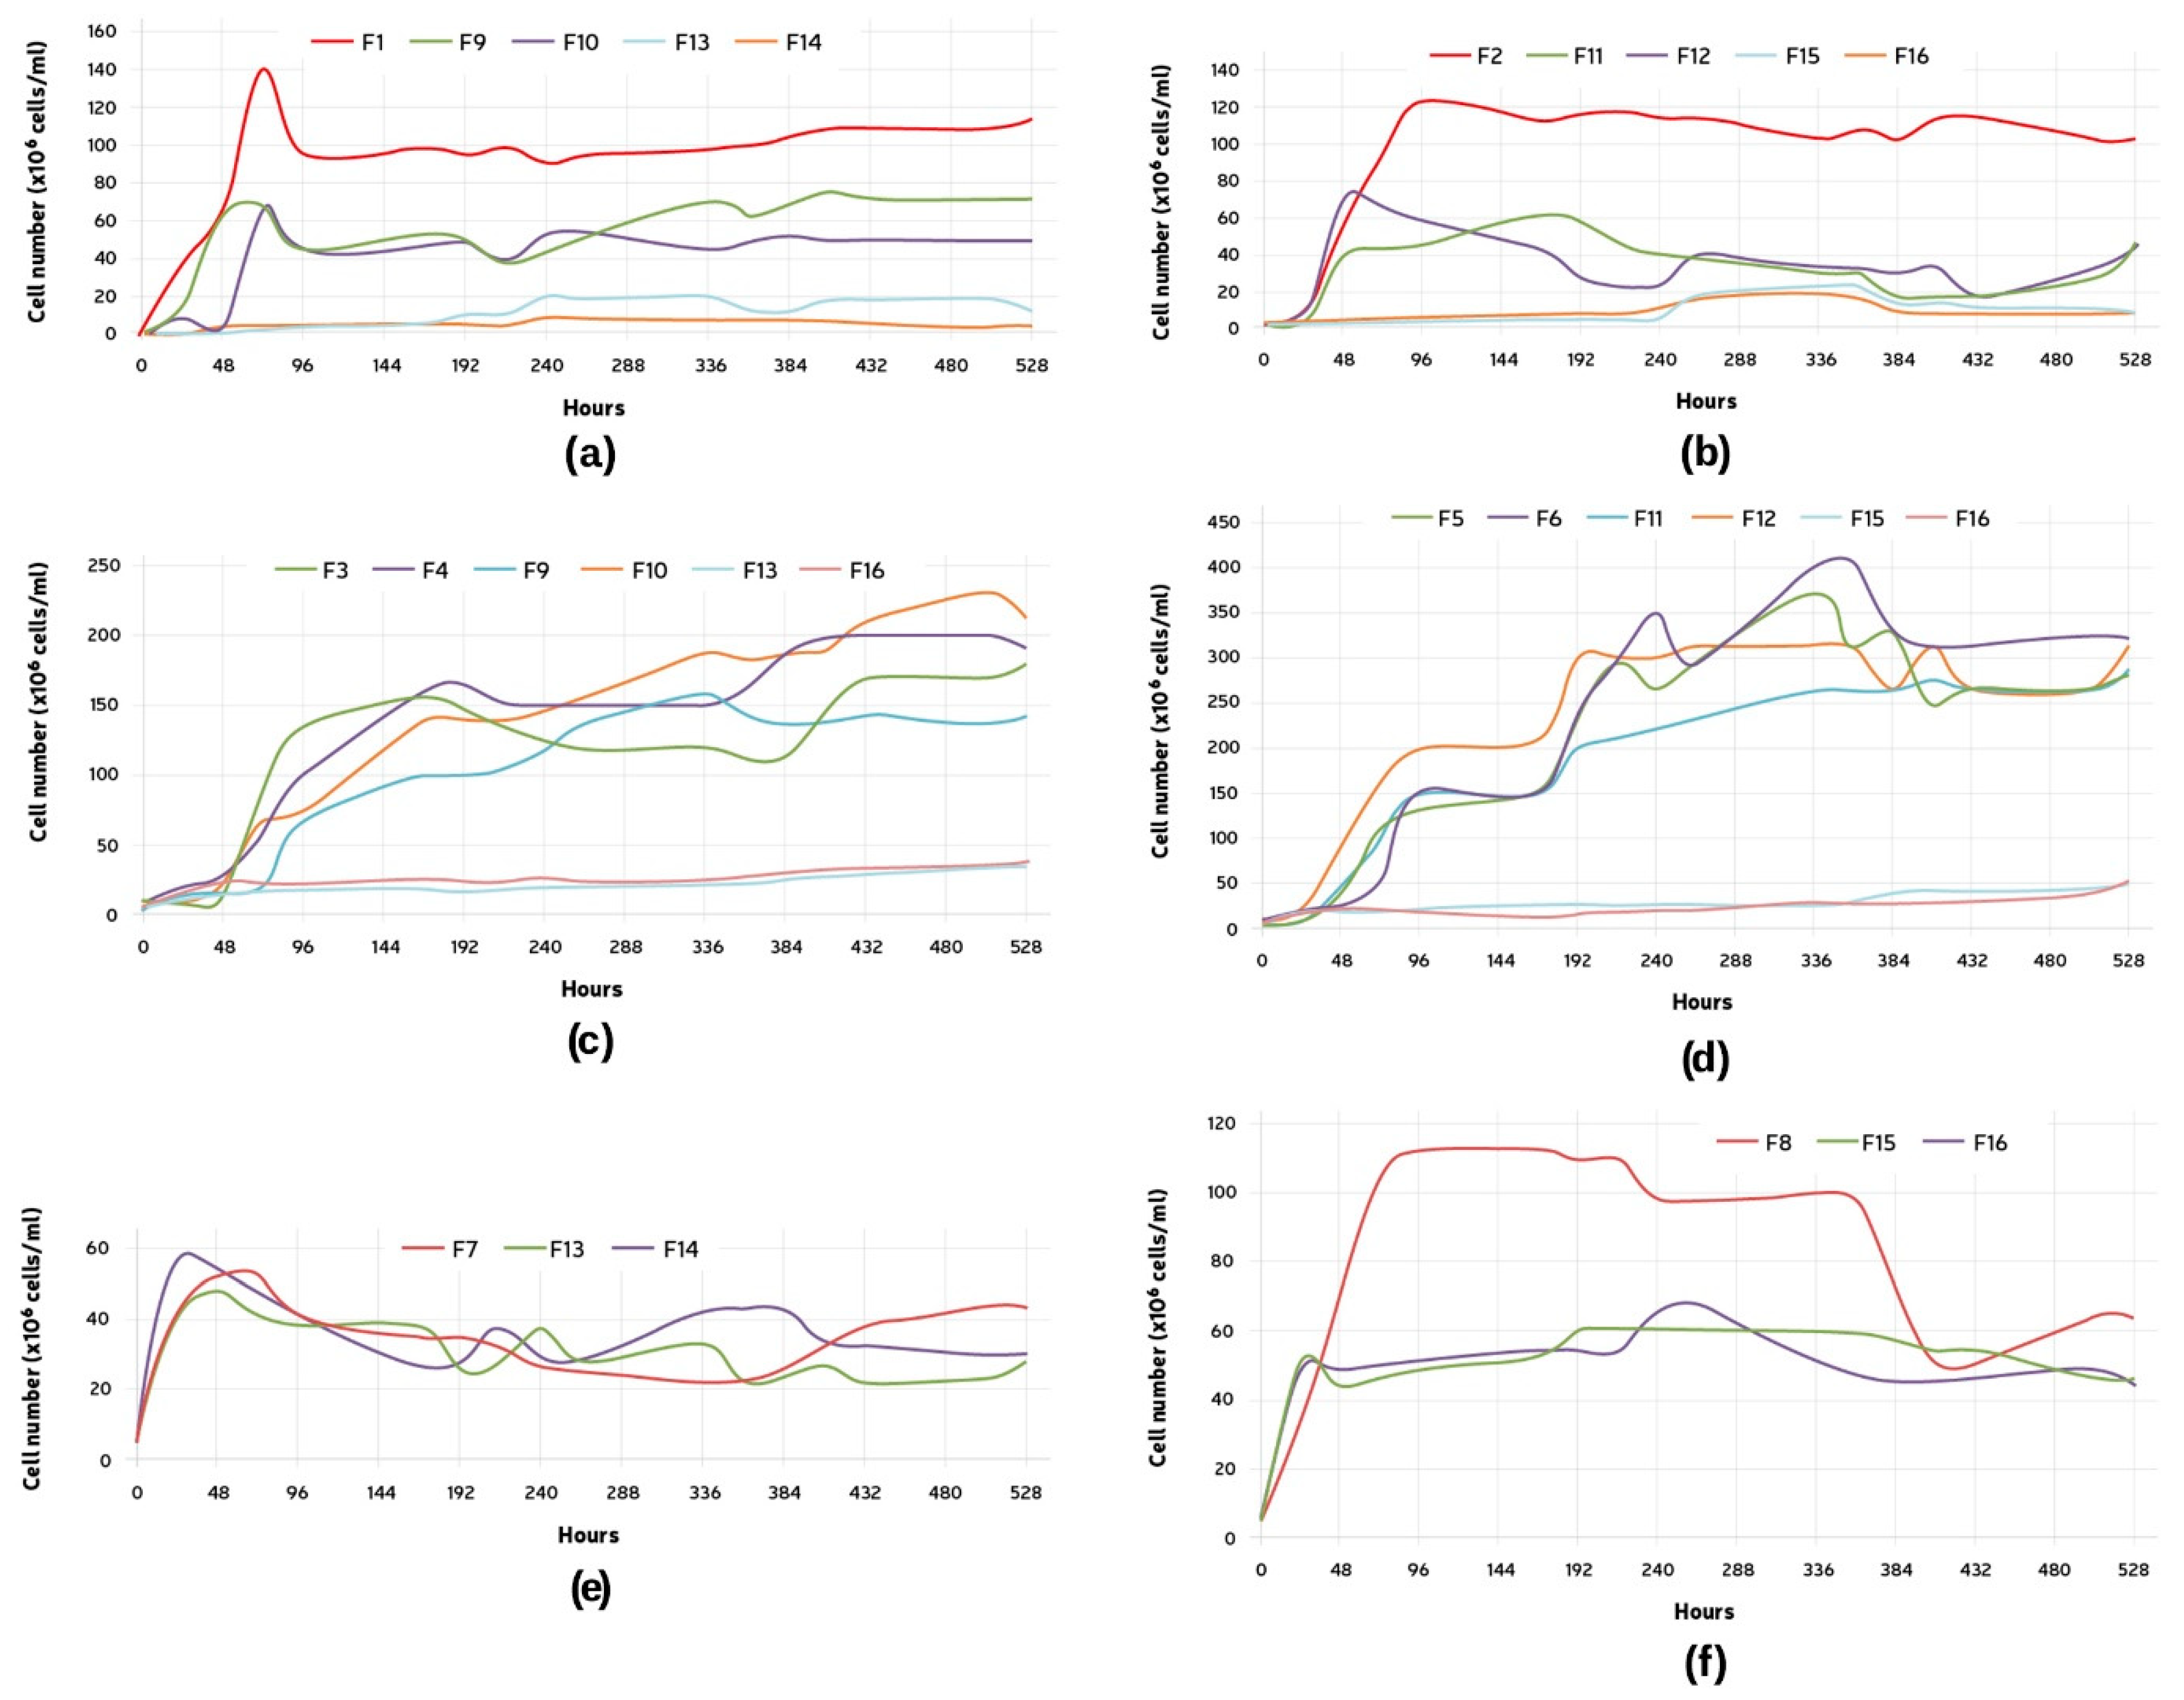
The growth of Lactobacillus brevis (L1) was evaluated at a fixed initial pitching rate of 1 × 10⁶ cells/mL (Figure 2a). In F1, after a quick initial growth, a decrease in the cell number was observed. The number of cells later was maintained throughout the experiment. When in the presence of only B1, the cell growth presented itself lower, but also showed the initial growth decrease pattern. On average, when in the presence of B1 and S1 (F13 and F14), the final cell count for L1 was much inferior to the average number for the single fermentation, being only 7.6% of F1 and 13.22% of F9 and F10 (L1 + B1). The change in the pitching rate for B1 seemed not to affect L1’s growth (F9 and F10).
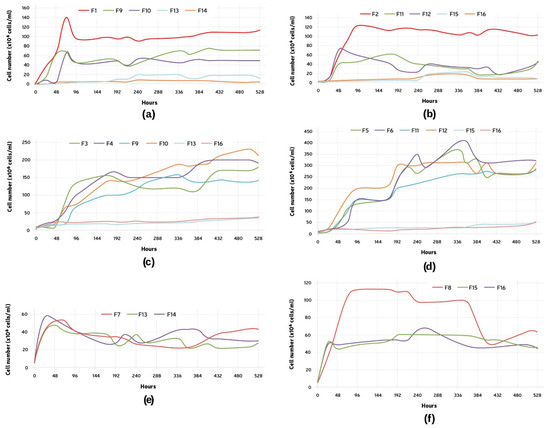
Figure 2.
Growth curve of: (a) Lactobacillus brevis (L1), comparison between F1, single microorganism, F9, L1 + B1 (B1: 5 × 10⁶ cells/mL), F10, L1 + B1 (B1: 1 × 10⁷ cells/mL), F13, L1 +S1 + B1 (B1: 5 × 10⁶ cells/mL), and F14, L1 + S1 + B1 (B1: 1 × 10⁷ cells/mL); (b) Lactobacillus parabrevis (L2), comparison between F2, single microorganism, F11, L2 + B2 (B2: 5 × 10⁶ cells/mL), F12, L2 + B2 (B2: 1 × 10⁷ cells/mL), F15, L2 + S2 + B2 (B2: 5 × 10⁶ cells/mL), and F16, L2 + S2 + B2 (B2: 1 × 10⁷ cells/mL); (c) Brettanomyces bruxellensis (B1), comparison between F3, single microorganism (5 × 10⁶ cells/mL), F4, single microorganism (1 × 10⁷ cells/mL), F9, L1 + B1 (B1: 5 × 10⁶ cells/mL), F10, L1 + B1 (B1: 1 × 10⁷ cells/mL), F13, L1 +S1 + B1 (B1: 5 × 10⁶ cells/mL), and F14, L1 + S1 + B1 (B1: 1 × 10⁷ cells/mL); (d) Brettanomyces anomalus (B2), comparison between F5, single microorganism (5 × 10⁶ cells/mL), F6, single microorganism (1 × 10⁷ cells/mL), F11, L2 + B2 (B2: 5 × 10⁶ cells/mL), F12, L2 + B2 (B2: 1 × 10⁷ cells/mL), F15, L2 + S2 + B2 (B2: 5 × 10⁶ cells/mL), and F16, L2 + S2 + B2 (B2: 1 × 10⁷ cells/mL); (e) Saccharomyces cerevisiae (S1), comparison between F7, single microorganism, F13, L1 + S1 + B1 (B1: 5 × 10⁶ cells/mL), and F14, L1 + S1 + B1 (B1: 1 × 10⁷ cells/mL); (f) Saccharomyces cerevisiae (S2), comparison between F8, single microorganism, F15, L2 + S2 + B2 (B2: 5 × 10⁶ cells/mL), and F16, L2 + S2 + B2 (B2: 1 × 10⁷ cells/mL).
The growth of Lactobacillus parabrevis (L2) was evaluated at a fixed initial pitching rate of 1 × 10⁶ cells/mL (Figure 2b). Similarly to L1, this strain showed the growth-decrease pattern. Both fermentations containing exclusively L2 and B2 (F11 and F12) exhibited a similar behavior, and the higher pitching rate for Brettanomyces did not seem to have much effect on the LAB growth.
The growth of Brettanomyces bruxellensis (B1) was tested at two different initial pitching rates: 5 × 10⁶ and 1 × 10⁷ cells/mL (Figure 2c). The two-fold difference in the starting cell count was not observed at the end of the fermentations. A higher pitching rate, F4, resulted in a bigger initial growth if compared to F3. All the fermentations exhibited a two-step growth behavior. This could be clearly seen during the single fermentations and in the presence of L1. The lag phase occurred between 24 and 72 h. The tests started with the same cell concentration showed a similar final cell count (F4 and F10, F3 and F9). Little growth was observed in F13 and F14, which exhibited an almost continuous cell count during the 22 days.
The growth of Brettanomyces anomalus (B2) was also tested at two different initial pitching rates: 5 × 10⁶ and 1 × 10⁷ cells/mL (Figure 2d). Similar to B1, the two-fold difference in the starting cell count was not observed at the end of the fermentations. All the fermentations also exhibited a two-step growth pattern; however, the lag phase observed occurred between 4 and 7 days. The final cell count for all the fermentations was similar. Little growth was observed in F15 and F16, which exhibited an almost continuous cell count during the 22 days.
The growth of Saccharomyces cerevisiae (S1) was evaluated at a fixed initial pitching rate of 5 × 10⁶ cells/mL (Figure 2e). An increase in the cell number could be observed immediately after the fermentation started. An approximately 10-fold increase in the cell count happened within the first 48 h, followed by a decrease in and maintenance of the cell number. All the fermentations exhibited a similar profile.
The growth of Saccharomyces cerevisiae (S2) was evaluated at a fixed initial pitching rate of 5 × 10⁶ cells/mL (Figure 2f). The initial cell growth for S2 was similar in all the cases. However, F8 exhibited continuous growth until reaching a higher maximum cell count of 1.13 × 10⁸ cells/mL (96 h), while both F15 and F16 reached a plateau of approximately 5 × 10⁷ cells/mL after the primary growth. This plateau was maintained until the end of the measurements.
3.4. Comparison between Single and Mixed Fermentations: Titratable Acidity (TA) and pH
The samples fermented with only one microorganism showed, on average, a lower pH and higher TA than the samples containing more than one microorganism. The final pH values for all the fermentations are listed from lowest to highest in Table 3. Fermentations carried out with LAB and/or Brettanomyces yielded the lowest final values; however, it is noticeable that the pH decrease in these tests started only 24 h after the inoculation of the wort. The variation in the pH values between fermentations with different initial pitching rates for Brettanomyces was not expressive. Fermentations carried out with only Brettanomyces and/or Lactobacillus exhibited the lowest end pH values.
Table 3.
pH values after 22 days of fermentation and microorganisms involved. a 5 × 10⁶ cells/mL; b 1 × 10⁷ cells/mL. Lactobacillus brevis (L1), Lactobacillus parabrevis (L2), Brettanomyces bruxellensis (B1), 5.3.4. Brettanomyces anomalus (B2), Saccharomyces cerevisiae (S1), 5 Saccharomyces cerevisiae (S2).
For both groups, a comparison of the initial 72 h showed a faster decrease in the pH values when Saccharomyces sp. was present (F7; F8, F13–F16). Fermentations carried out in the presence of S1 or S2 exhibited the lowest TA values together with the highest pH. The CFU results for the change in the pitching rate for Brettanomyces did not show expressive influence on the end pH and TA of the mixed fermentations. However, a slight increase in pH and decrease in TA was observed for the pure fermentations when the pitching rate of B1 was augmented: F3 (pH: 3.53; TA: 8 g/L) and F4 (pH: 3.63; TA: 7.3 g/L). B2 exhibited the opposite behavior, an increase in the pitching rate yielded lower pH and higher TA values: F5 (pH: 3.35; TA: 8.3 g/L) and F6 (pH: 3.29; TA: 9.4 g/L).
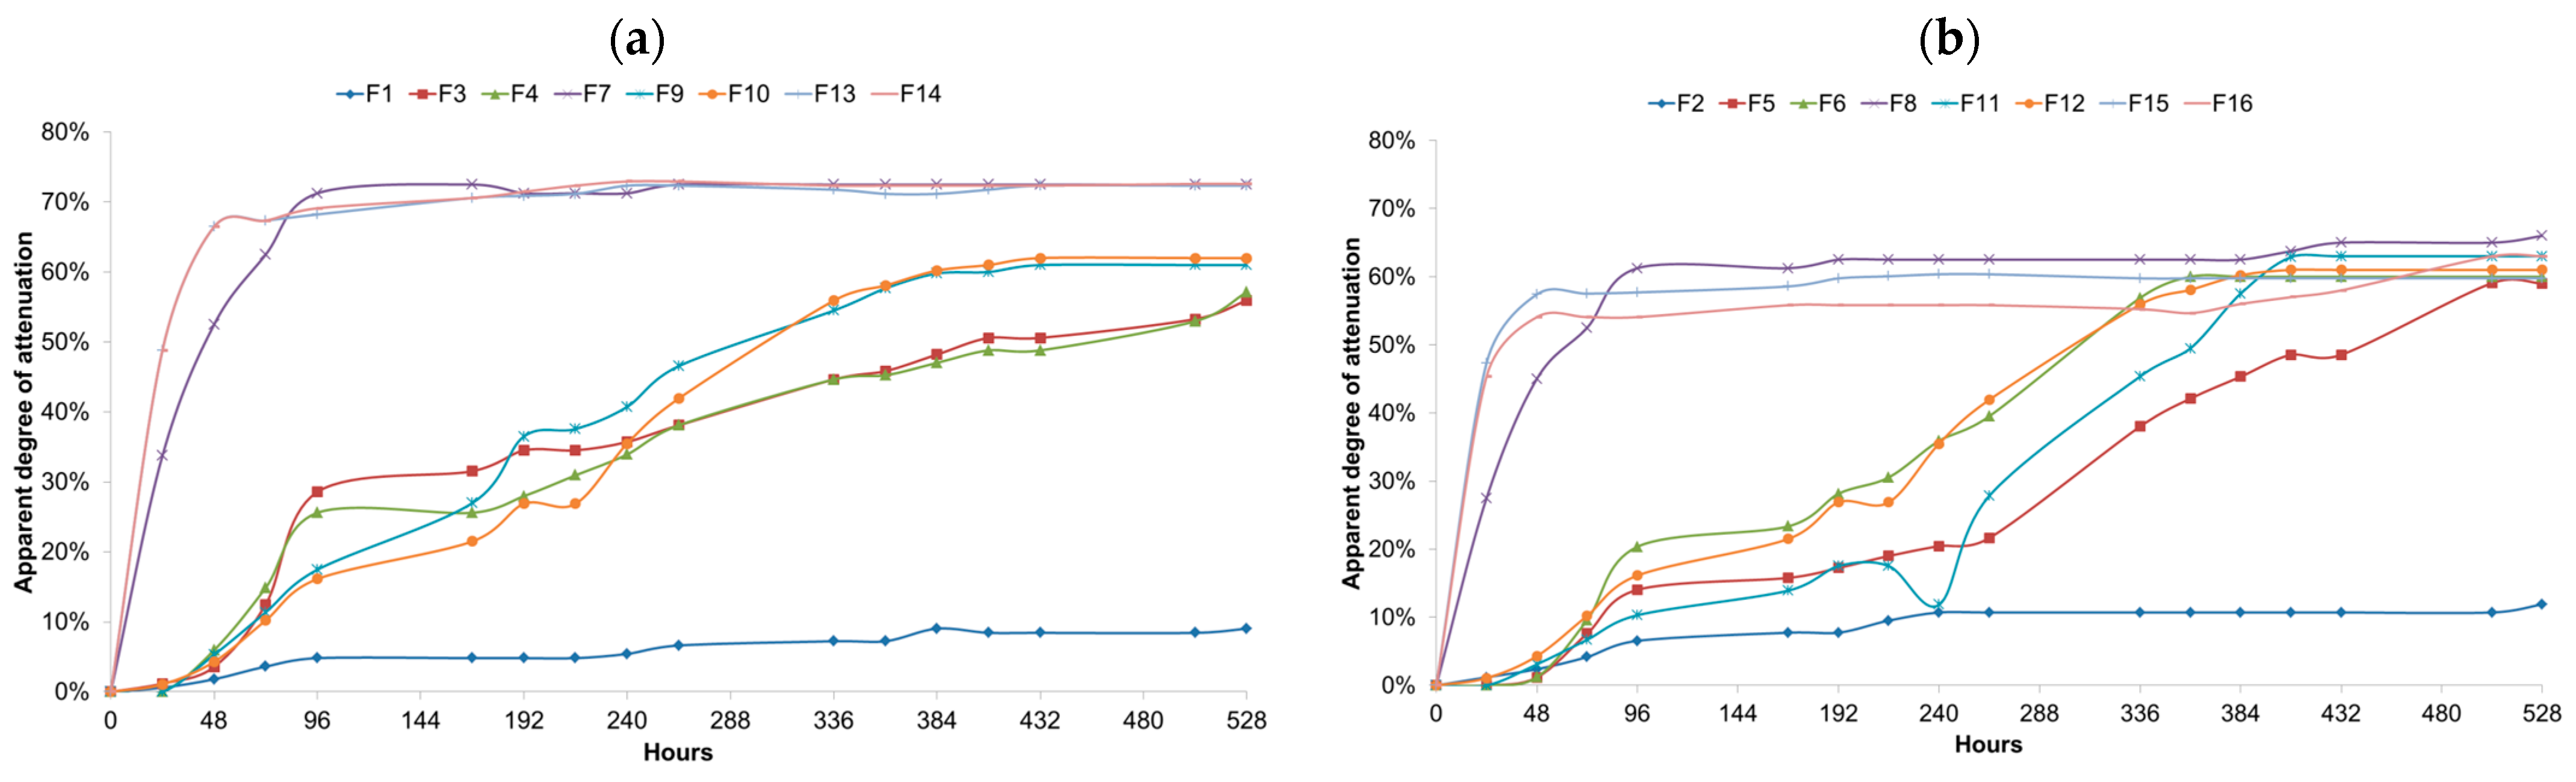
Further pH drops and medium acidification were investigated during the bottle conditioning at 12 °C. Only F12 showed no further pH drop, while all the other fermentations had their pH values reduced. The titratable acidity values can be seen in Figure 3. All the fermentations showed an increase in the medium acidity during the bottle conditioning. The F13–F16, with fermentations carried out with Saccharomyces cerevisiae, exhibited the highest pH and lowest TA values, among the mixed fermentations, at bottling. However, it was observed that for these fermentations, the bottle conditioning was most effective at dropping the pH and increasing the TA values.
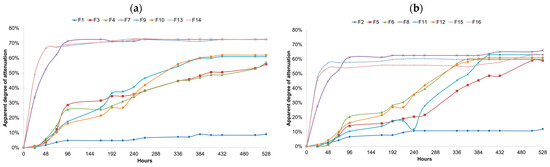
Figure 3.
(a) Apparent degree of attenuation for single and mixed fermentations carried with Lactobacillus brevis (L1), Saccharomyces cerevisiae (S1) and Brettanomyces bruxellensis (B1) strains at 25 °C during 528 h. Samples were taken every 24 h and colled to 20 °C for extract measurement. F1, L1; F3, B1 (5 × 10⁶ cells/mL); F4, B1 (1 × 10⁷ cells/mL); F7, S1; F9, L1 + B1 (B1: 5 × 10⁶ cells/mL); F10, L1 + B1 (B1: 1 × 10⁷ cells/mL); F13, L1 +S1 + B1 (B1: 5 × 10⁶ cells/mL); F14, L1 + S1 + B1 (B1: 1 × 10⁷ cells/mL). (b) Apparent degree of attenuation for single and mixed fermentations carried with Lactobacillus parabrevis (L2), Saccharomyces cerevisiae (S2) and Brettanomyces anomalus (B2) at 25 °C during 528 h Saccharomyces cerevisiae (S1) and Brettanomyces bruxellensis (B1) strains at 25 °C during 528 h. Samples were taken every 24 h and colled to 20 °C for extract measurement. F2, L2; F5, B2 (5 × 10⁶ cells/mL); F6, B2 (1 × 10⁷ cells/mL); F8, S2; F11, L2 + B2 (B2: 5 × 10⁶ cells/mL); F12, L2 + B2 (B2: 1 × 10⁷ cells/mL); F15, L2 + S2 + B2 (B2: 5 × 10⁶ cells/mL); F16, L2 + S2 + B2 (B2: 1 × 10⁷ cells/mL).
3.5. Comparison between Single and Mixed Fermentations: Yeast Cell Viability
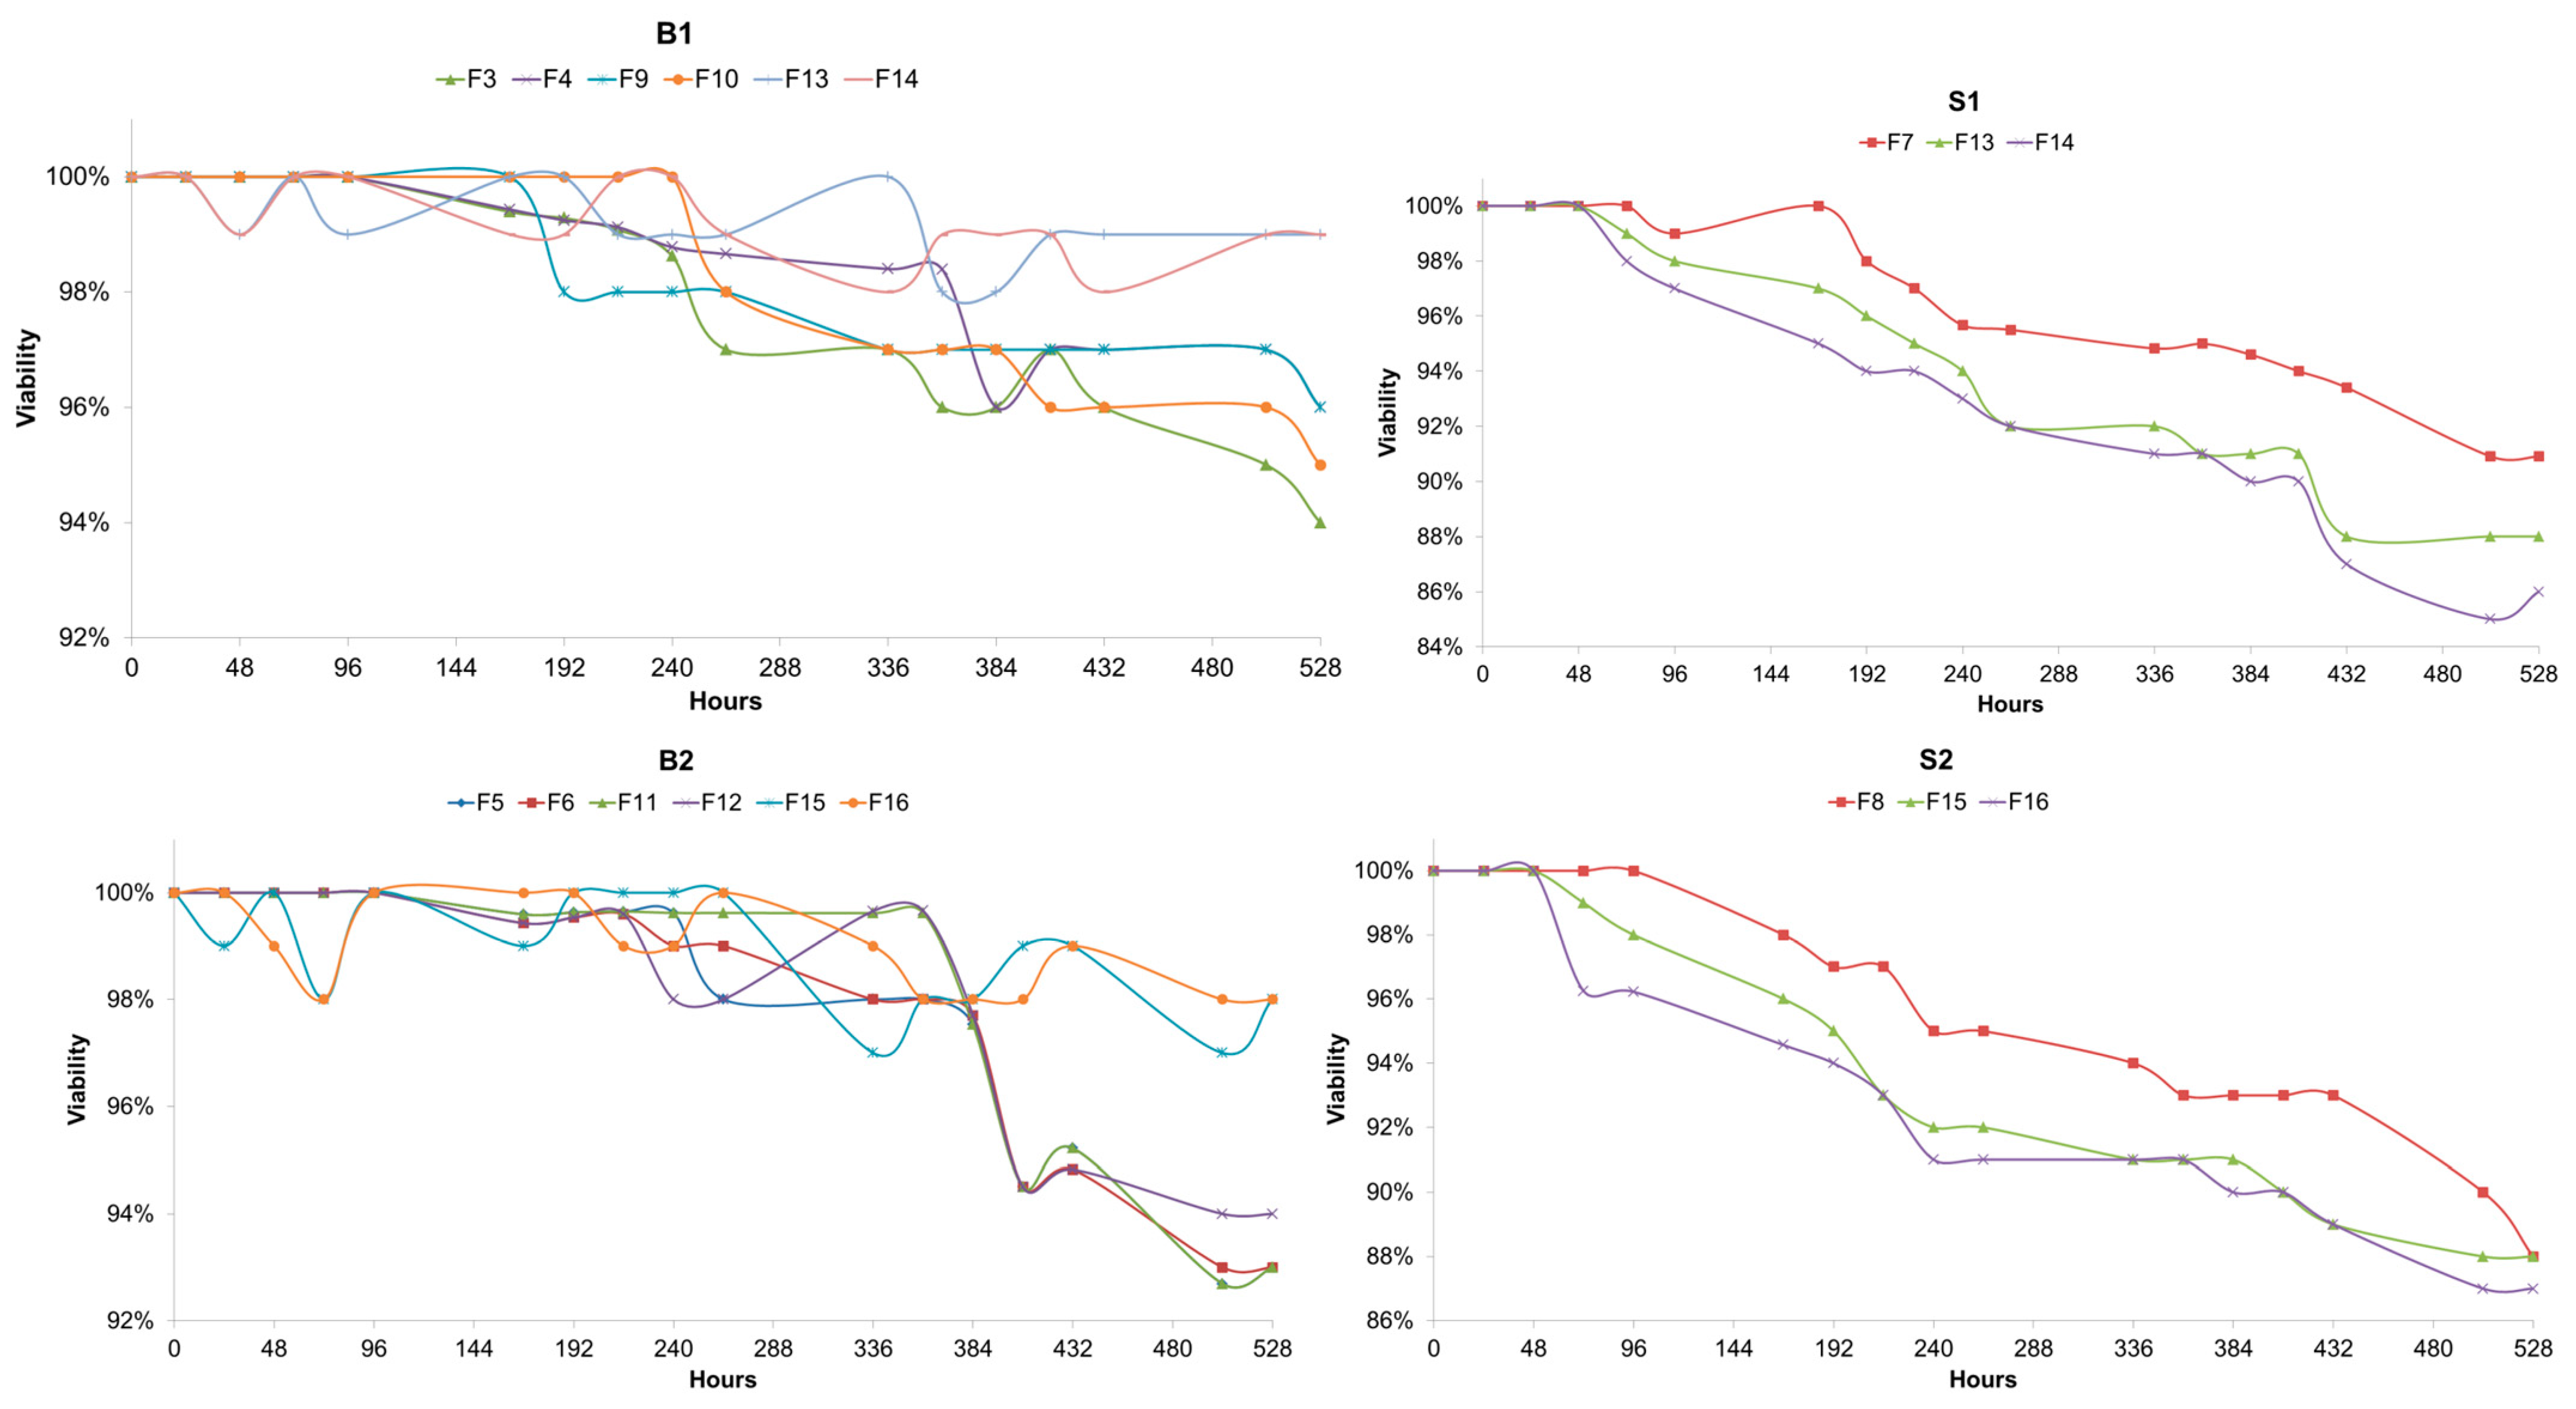
The viability of the yeast cells involved in the fermentations was assessed, and it was observed that both Brettanomyces strains exhibited higher viability values when compared to the Saccharomyces strains tested (Figure 4). The final viabilities were, on average, 9% higher than Saccharomyces and showed slightly higher values. Interestingly, it was observed that the viability values for Brettanomyces when in the presence of S. cerevisiae were higher than the values during the fermentations where Brettanomyces was the only yeast present. The mixed fermentations exhibited higher values for Brettanomyces’s viability, but the opposite was observed for both S1 and S2. A higher pitching rate for Brettanomyces did not have any effect on the viability.
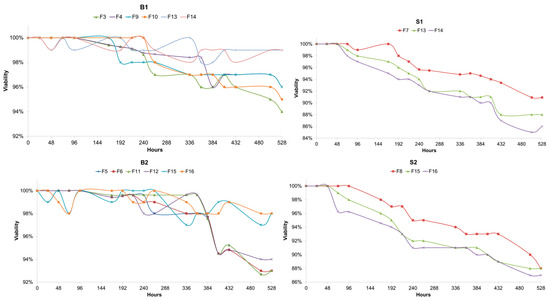
Figure 4.
(B1) Viability values of Brettanomyces bruxellensis (B1) measured with Trypan Blue. Measurements were made every 24 h during 528 h of fermentation at 25 °C. F3, B1 (5 × 10⁶ cells/mL); F4, B1 (1 × 10⁷ cells/mL); F9, L1 + B1 (B1: 5 × 10⁶ cells/mL); F10, L1 + B1 (B1: 1 × 10⁷ cells/mL); F13, L1 +S1 + B1 (B1: 5 × 10⁶ cells/mL); F14, L1 + S1 + B1 (B1: 1 × 10⁷ cells/mL). (S1) Viability values of Saccharomyces cerevisiae (S1) measured with Trypan Blue. Measurements were made every 24 h during 528 h of fermentation at 25 °C. F7, S1; F13, L1 + S1 + B1 (B1: 5 × 10⁶ cells/mL); F14, L1 + S1 + B1 (B1: 1 × 10⁷ cells/mL). (B2) Viability values of Brettanomyces anomalus (B2) measured with Trypan Blue. Measurements were made every 24 h during 528 h of fermentation at 25 °C. F5, B2 (5 × 10⁶ cells/mL); F6, B2 (1 × 10⁷ cells/mL); F11, L2 + B2 (B2: 5 × 10⁶ cells/mL); F12, L2 + B2 (B2: 1 × 10⁷ cells/mL); F15, L2 + S2 + B2 (B2: 5 × 10⁶ cells/mL); F16, L2 + S2 + B2 (B2: 1 × 10⁷ cells/mL). (S2) Viability values of Saccharomyces cerevisiae (S2) measured with Trypan Blue. Measurements were made every 24 h during 528 h of fermentation at 25 °C. F8, S2; F15, L2 + S2 + B2 (B2: 5 × 10⁶ cells/mL); F16, L2 + S2 + B2 (B2: 1 × 10⁷ cells/mL).
3.6. Comparison of the Fermentation Parameters during the Mixed Fermentations
The cell growth, pH decrease, extract consumption, and cell viability appeared to be unaffected by a higher or lower pitching rate for both B1 and B2. For that reason, this section focuses on comparing the parameters before mentioned during the mixed fermentations F9, F11, F13, and F15 only when Brettanomyces sp. was pitched at 5 × 10⁶ cells/mL.
F9 and F11 showed similar profiles. The first 24 h were characterized by cell growth for B1 and B2, no pH drop, and no extract consumption. After this initial 24 h, the measured parameters started to change. B1 and B2 exhibited the same continuous slow growth behavior. However, the final cell count for B2 was approximately two times the final count for B1. This “lag-phase” was not observed for F13 and F15. An immediate growth of all the yeast strains involved (B1, B2, S1, and S2) occurred while the pH and extract values started to decline.
The two LAB strains developed in similar ways. In both F9 and F11, expressive cell growth was observed after 24 h, reaching a plateau after 96 h. In F13 and F15, both LAB strains exhibited little and slow growth. Expressive cell growth occurred only after 168 and 10 days for L1 and L2, respectively. The cell proportion for all fermentations can be viewed in Table 4.
Table 4.
Cell proportions during mixed fermentations F9, F11, F13, and F15. Cell number was counted every 24 h during 22 days. Viability was taken into account to reflect the actual cell number. 1 = 1 × 10⁶ cells/mL
The maximum cell count for S1 was 4.79 × 10⁷ cells/mL at 48 h, a ten-fold increase. The rest of the fermentation was characterized by a decrease in the cell count for S1, which finished at 2.82 × 10⁷ cells/mL. S2 showed a similar behavior. During the first day, a ten-fold increase in the cell count was observed. This was followed by 24 h of slight decline, after which the number of cells increased once again to a maximum value of 7.66 × 10⁷ cells/mL at 240 h. The end cell count for S2 was measured as 4.66 × 10⁷ cells/mL.
3.7. Quantification of Esters and Higher Alcohols
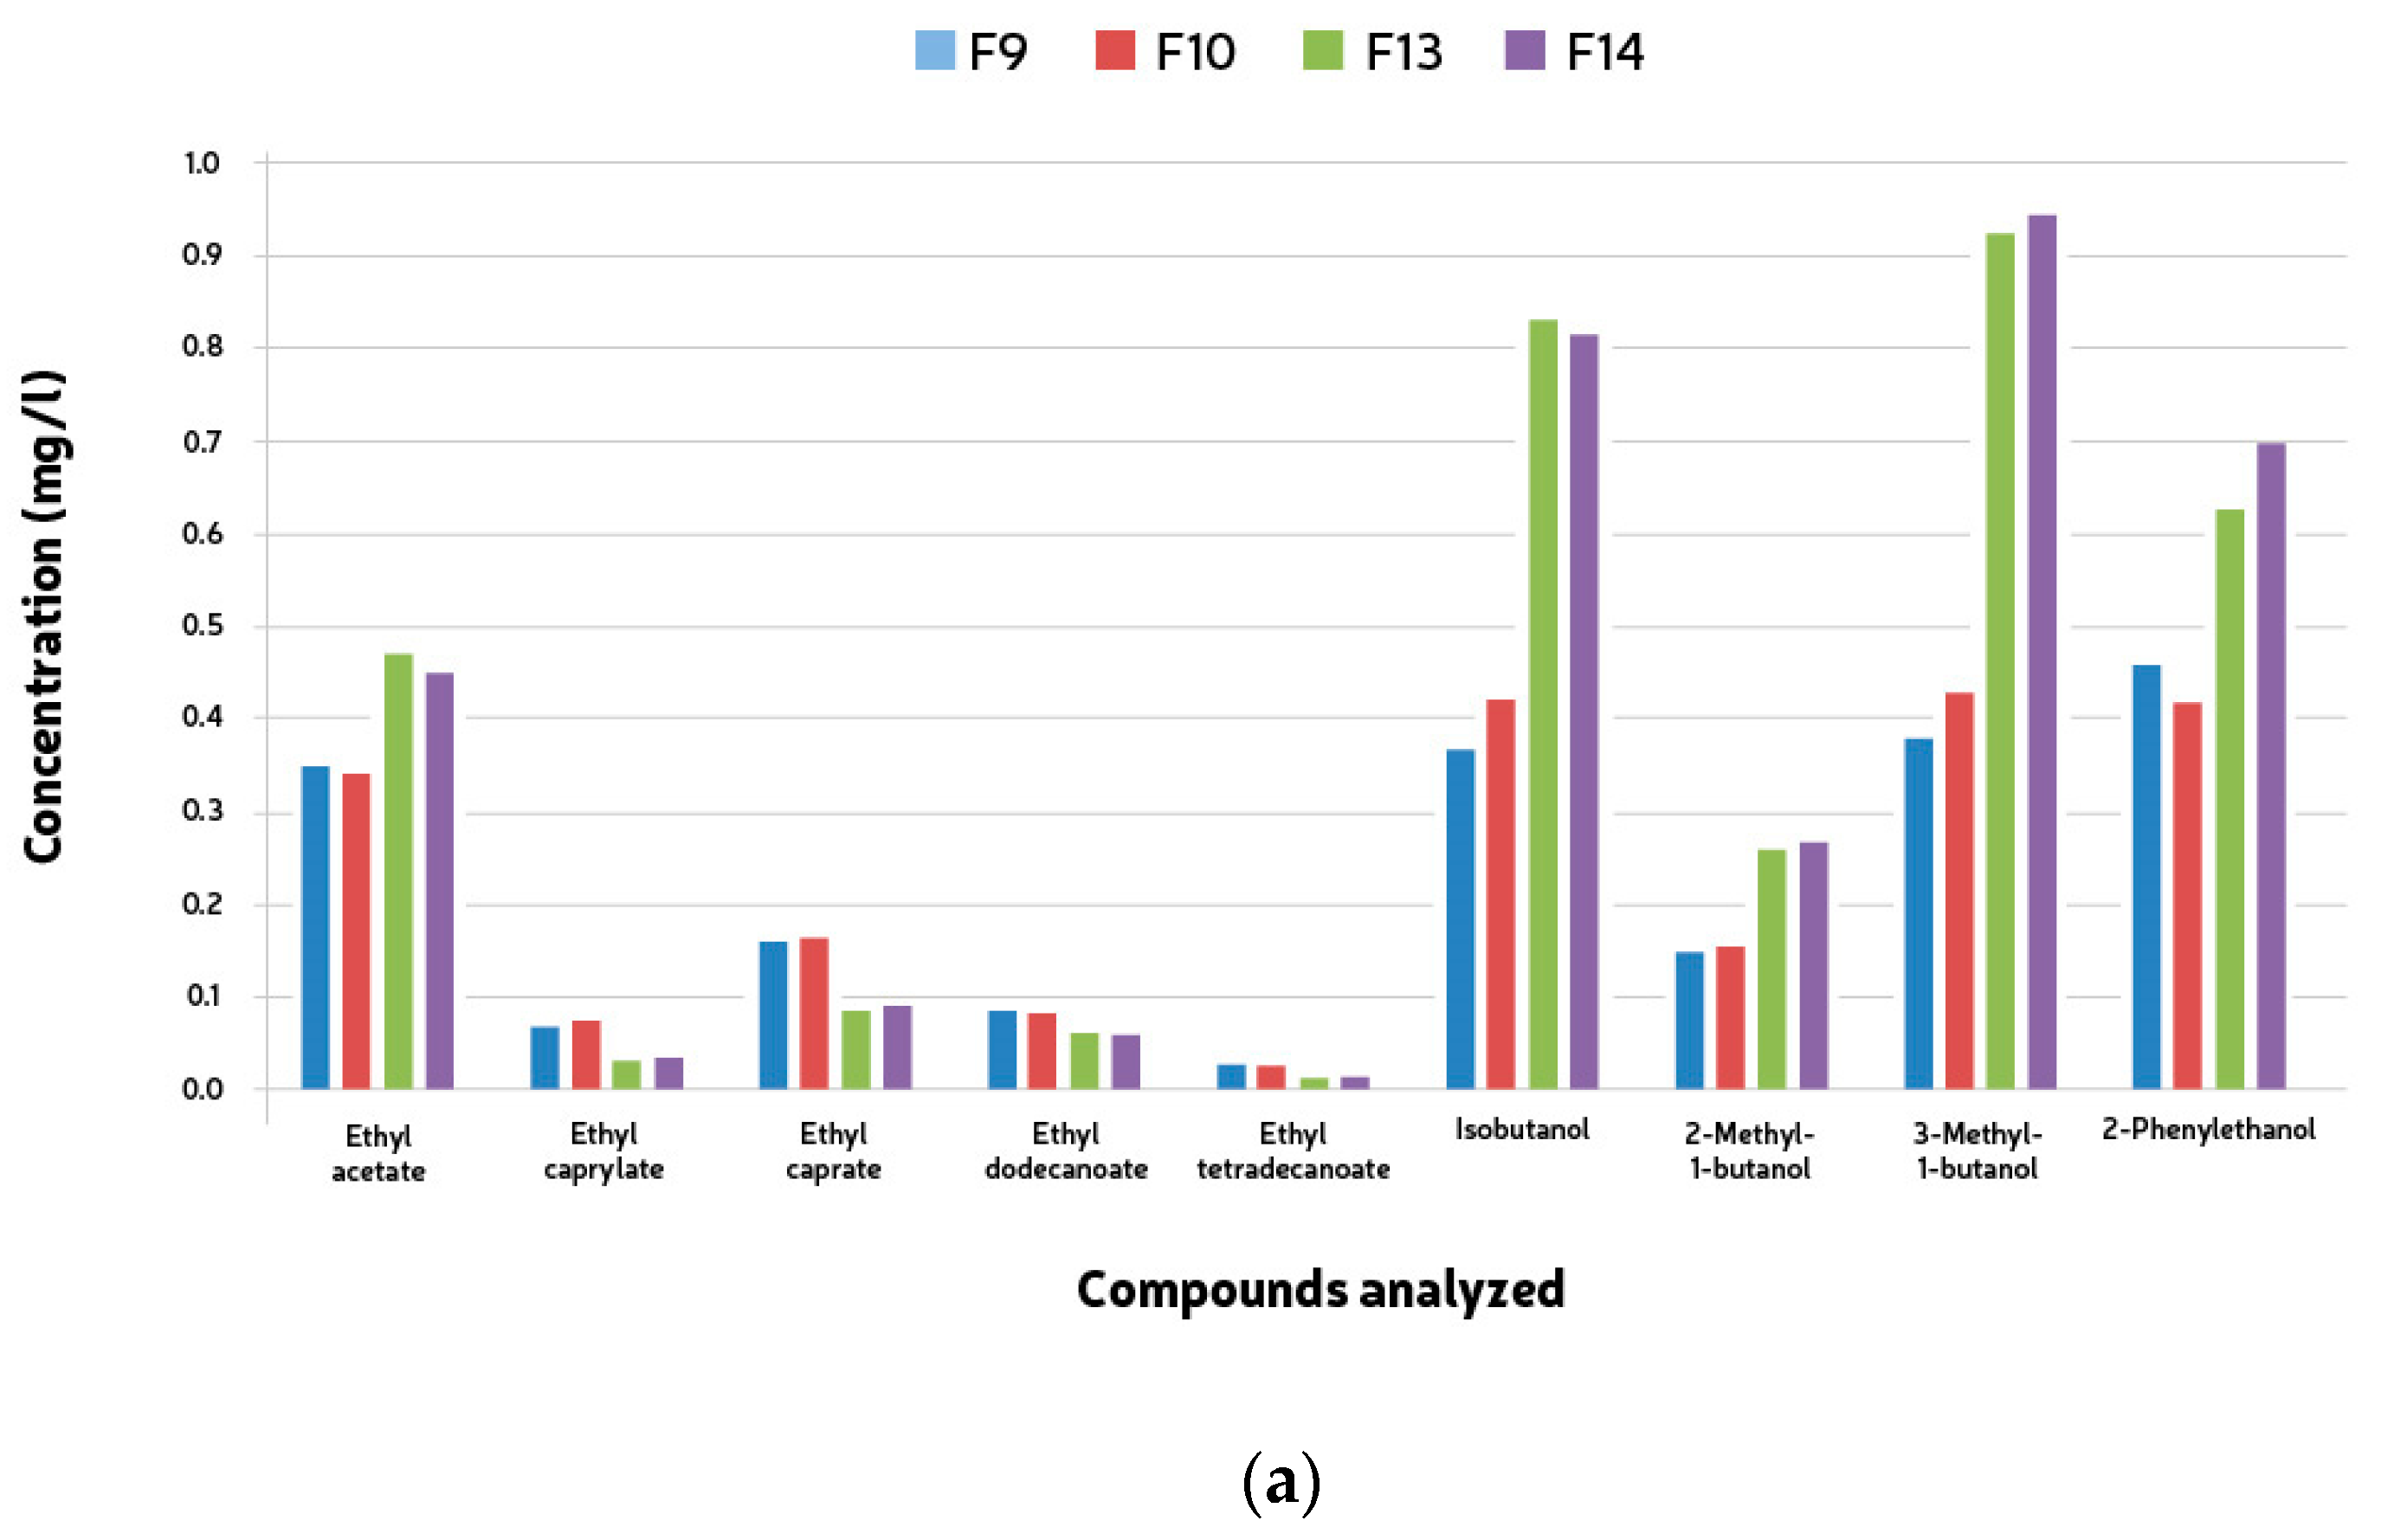
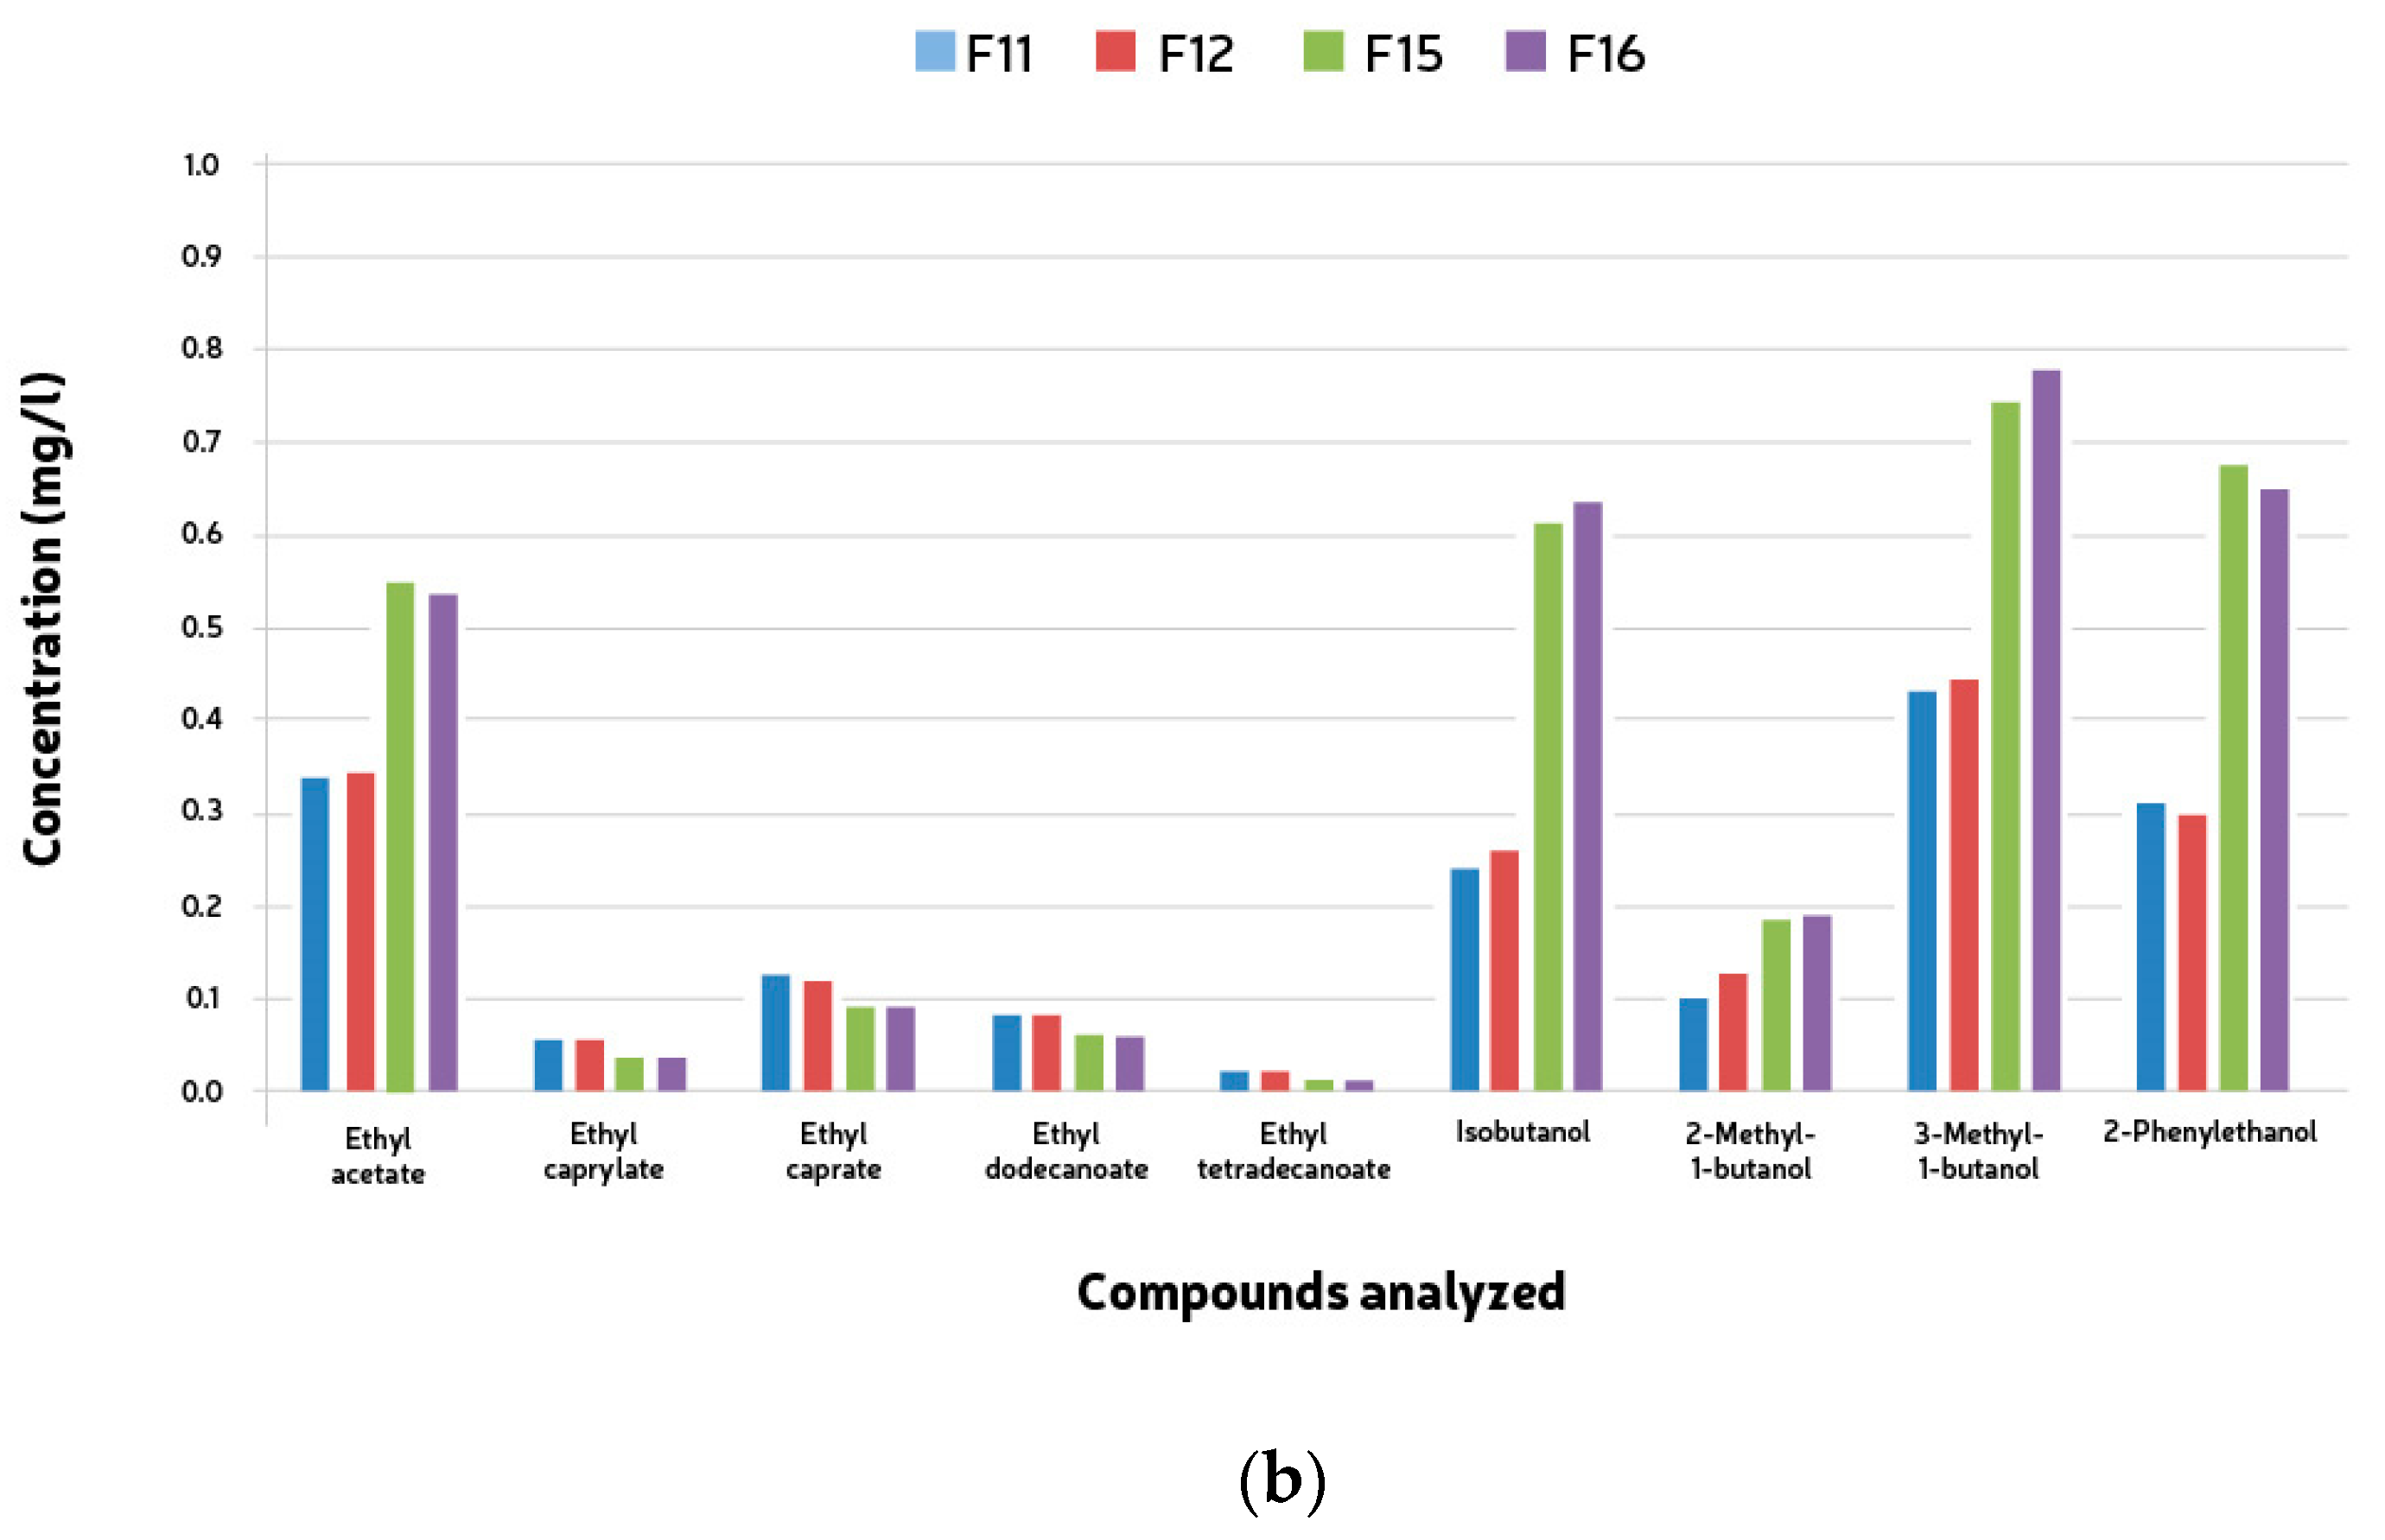
The volatile compounds analyzed (fifteen esters and six alcohols) were detected during the mixed fermentations. The esters encountered were ethyl acetate, ethyl caprylate, ethyl caprate, ethyl dodecanoate, and ethyl tetradecanoate, and the higher alcohols were isobutanol, 2-Methyl-1-butanol, 3-Methyl-1-butanol, and 2-Phenylethanol according to Table 3. The quantification of esters and higher alcohols showed similar results for both groups of microorganisms. No compound was present above the threshold values. The total concentration of both higher alcohols and esters was much lower than the average values found in beer. Ethyl acetate was the only ester found in higher amounts in the samples fermented with Saccharomyces caravisiae (F9–12). In all the remaining fermentations (F13–16), the esters’ concentrations were higher in the samples where S. cerevisiae was not the main yeast. These same fermentations presented much higher concentrations of higher alcohols (Table 5).
Table 5.
Mean ester and higher alcohol compounds (mg/L) formed during 22 days + two months of bottle conditioning of mixed culture fermentation with L. brevis (L1), B. bruxellensis (B1), S. cerevisiae (S1), L. parabrevis (L2), B. anomalus (B2), and S. cerevisiae (/] S2). Compounds were measured via headspace (HS)-SPME-GC/FID and using a Gerstel MultiPurposeSampler MPS for sampling. F9, L1 + B1 (B1: 5 × 10⁶ cells/mL); F10, L1 + B1 (B1: 1 × 10⁷ cells/mL); F13, L1 +S1 + B1 (B1: 5 × 10⁶ cells/mL); F14, L1 + S1 + B1 (B1: 1 × 10⁷ cells/mL); F11, L2 + B2 (B2: 5 × 10⁶ cells/mL); F12, L2 + B2 (B2: 1 × 10⁷ cells/mL); F15, L2 + S2 + B2 (B2: 5 × 10⁶ cells/mL); F16, L2 + S2 + B2 (B2: 1 × 10⁷ cells/mL).
Compound analyses were conducted to observe esters and higher alcohols produced during the mixed fermentations. Fifteen esters and six alcohols were analyzed, including ethyl acetate, ethyl caprylate, ethyl caprate, ethyl dodecanoate, and ethyl tetradecanoate among the esters, and isobutanol, 2-Methyl-1-butanol, 3-Methyl-1-butanol, and 2-Phenylethanol among the higher alcohols. The quantification of these compounds showed consistent results across both groups of microorganisms, with none exceeding threshold values. Interestingly, the total concentrations of both higher alcohols and esters were notably lower compared to typical beer averages. Notably, ethyl acetate was found in higher concentrations in samples fermented with Saccharomyces cerevisiae (F9-12), contrasting with fermentations (F13-16) where S. cerevisiae was not the predominant yeast. These latter fermentations exhibited significantly elevated levels of higher alcohols (see Figure 5a,b), indicating distinct fermentation profiles.
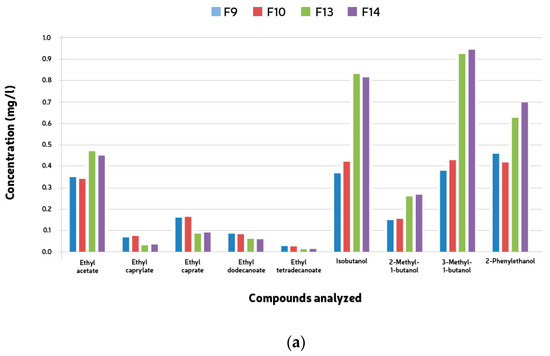

Figure 5.
Mean ester end higher alcohol compounds (mg/l) formed during 528 h + two month bottle conditioning of mixed culture fermentation with L. brevis (L1), B. bruxellensis (B1) and S. cerevisiae (S1). (a) F9, L1 + B1 (B1: 5 × 10⁶ cells/mL); F10, L1 + B1 (B1: 1 × 10⁷ cells/mL); F13, L1 +S1 + B1 (B1: 5 × 10⁶ cells/mL); F14, L1 + S1 + B1 (B1: 1 × 10⁷ cells/mL). (b) F11, L2 + B2 (B2: 5 × 10⁶ cells/mL); F12, L2 + B2 (B2: 1 × 10⁷ cells/mL); F15, L2 + S2 + B2 (B2: 5 × 10⁶ cells/mL); F16, L2 + S2 + B2 (B2: 1 × 10⁷ cells/mL).
4. Discussion
The use of mixed cultures for brewing purposes is an interesting option for increasing the product diversity. To maintain the quality and avoid cross-contamination, the microorganisms must be maintained pure and healthy. For that reason, the ability to culture, select, and propagate healthy cells is paramount. In the past, Berliner Weisse breweries did not watch out for the microbiological necessities of their cultures because they did not know which microorganisms were involved or where they originated from. The control of fermentation was solely accomplished through the configuration of the process parameters such as temperature, and slurry was used to start new fermentations. All this led to sensory problems and a lack of homogeneity.
So the pitch rate used, and the CFU results, were twice the number of cells that were added. The fact that the relationship between Saccharomices, Lactobacilli, and Brettanomyces is not maintained after fermentation ends is one of the most decisive factors for the decline in the production of traditional Berliner Weisse.
The behavior of mixed fermentations is not an issue encountered only by Berliner Weisse breweries. Any operation that makes use of mixed cultures can bump into complications, in most cases concerning the flavor. The understanding of how the parameters develop throughout fermentation is a powerful tool that can be used to predict the results and make corrections that can literally save time and money.
The LAB strains tested offered no challenge when growing on the media selected. Both strains exhibited growth on MRS agar after 3 days at 25 °C in an anaerobic atmosphere. This is not surprising, once that MRS became widely used for Lactobacilli cultivation. The colonies’ characteristics were similar for L1 and L2: circular shape, flat, entire margins, dark beige, shiny with a 2–3 mm diameter. Saccharomyces cerevisiae grew very well on wort agar. CFU formation was observed 3 days after inoculation. They developed into colonies with a circular shape, undulated margins, and raised, creamy, rough colonies with a 3–5 mm diameter.
The Brettanomyces strains developed very well when cultured on MYPG + CaCO3, and CFU could be observed after 10 days of incubation at 25 °C in a dark, aerobic growth chamber. Yakobson reported that Brettanomyces took longer than ten days to develop distinguishable colonies and appeared to have diminutive growth compared with other MYPG media agars [14]. Lysin agar was found to be a weak choice for both B1 and B2, and both strains failed to develop CFU.
This study investigated the possibility of isolating a specific microorganism from a mixed culture using simple conditions and three different media. All the media tested contained inhibitors for brewer’s yeast growth and as expected, no CFU were observed for S1 and S2.
Brettanomyces yeast exhibited the ability of growing on all the media tested. Growth on a medium containing up to 10 mg/L of cycloheximide was already described by Morneau et al. [15]. B1 and B2 took between 7 and 10 days for development on MYPG + cycloheximide. This agrees with the findings of Colomer and co-authors, and both L1 and L2 showed the ability to grow on VLB-S7-S and NBB® -A under anaerobic conditions as specified by the medium’s producers [16]. The same conditions, however, were not sufficient to hinder growth from B1 and B2 on NBB® -A and are not recommended for separating Brettanomyces and LAB. The same conclusions and observations were also related by Dysvik and Freek and co-authors in sour beers [7,17].
Upon growth on selective media, it was observed that the colony morphology was similar in shape, margin, and elevation to the CFU observed on MYPG without cyclohexymide. However, the CFU sizes were smaller. L1 and L2 colonies were identical in shape and size, and what changed was the color. The results demonstrate that, for the strains tested, the use of the chosen selective media and aerobic/anaerobic conditions can be effective to eliminate Saccharomyces strains from a mixed population. It was shown that it is also possible to select only the two Brettanomyces strains tested if using NBB® -A or MYPG + cycloheximide under aerobic conditions.
The ability to assess the yeast viability is of paramount importance to guarantee healthy fermentations. Small breweries usually make use of bright field microscopy and simple staining methods to obtain data [18]. This study provided some valuable information on the staining ability of three different chemicals for the strains tested. It was observed that all the staining methods exhibited, on average, higher viability numbers if compared to CFU counting. This result is not surprising for Brettanomyces, considering that cells can enter a viable but nonculturable state which could result in underestimation via CFU, as reported in these two studies conducted by Postigo and Dysvik [19,20]. Chemical and environmental factors have been reported to induce a viable but not culturable state for Brettanomyces, including nutrient starvation, extreme temperatures and osmotic concentrations, oxygen, and food preservatives [16,21,22].
To better understand the effect that the presence of one microorganism has on the development of another strain in a mixed culture, growth curves between single and mixed fermentations were constructed and compared. Although the growth of LAB on varied media has already been published, studies on bacterial growth for beer production are relatively incipient [23,24]. LAB are usually viewed as spoilage microorganisms, and therefore research is conducted mainly to avoid their development. Being the main lactic acid producers in Berliner Weisse beer, the growth behavior of the two strains was observed and documented. Iaticci and co-authors reported some microorganisms used in craft beers to produce sour beers, but they did not perform a study for this specific beer style [25].
This initial growth was followed, in all cases, by a slight decrease in the number of cells. This behavior was reported by Ciosek and co-authors [26] and justified the zinc and magnesium supplementation. At this point, approximately 96 h after fermentations began, the pH had already reached its final values, while the extract was still available. Thereafter, the cell numbers stayed approximately constant. This constancy in the cell counts happened coincidentally to the stabilization of both pH and ADA for both strains. According to Peyer et al., the limiting factors on LAB growth are low pH and other metabolic byproducts, rather than a high residual sugar concentration [27].
Brettanomyces bruxellensis (B1) exhibited a two-phase growth pattern, which was also observed for extract consumption. The first 24 h were characterized by an approximate 5-fold increase in the cell concentration. During this period, little changed regarding both pH and extract values. Cell growth came to a halt during the next 48 h, in which once again, little change in pH and extract occurred. Seventy-two hours after the start of the fermentation, a second growth phase was observed, and it continued until a maximum cell count of 1.56 × 10⁸ cells/mL was reached. During this second growth period, the final pH and 60% of the final attenuation was reached. The remaining extract was slowly consumed over the next two weeks. Brettanomyces anomalus (B2) also exhibited a similar behavior; however, the growth phases and “lag” phases were at least 24 h longer than those observed for B1. The end pH values were reached already during the initial growth, but on the other hand, if compared to B1, during the same period, the extract consumption reached only 24% of the final ADA. The remaining extract was slowly consumed during the next 15 days.
The fermentations carried out with both Brettanomyces and Lactobacillus exhibited similar behaviors to those of the single fermentations. The main difference observed lay in the cell count for the LAB strains. Both L1 and L2 exhibited analogous growth patterns; however, the number of cells was lower during the fermentations with Brettanomyces. This behavior could characterize 48 competitions. No difference in the viability values for both B1 and B2 was observed if compared to the single fermentations. The same behavior was observed and reported by Ramanan and Fu and co-authors [28,29].
The four fusel alcohols present in the samples appeared in higher concentrations during the fermentations with the three microorganisms. This is interesting once that a higher alcohol formation is related to amino acid metabolism, which in turn is related to growth. Considering that the total cell growth of B1 and B2 during the fermentations with Brettanomyces and LAB was much higher than the total cell growth observed when Saccharomyces was present, it was expected that the number of higher alcohols would be greater in the samples originating from the fermentations carried out only with Brettanomyces and LAB. However, Peye et al. showed that higher alcohols were not the major byproducts during pure Brettanomyces fermentation. The total amount of higher alcohols produced by some Brettanomyces strains is much lower than the average found in beers. This leads us to conclude that the production of these compounds is carried out mainly by Saccharomyces yeast cells [27].
5. Conclusions
This study has shown that it is possible to produce an acidic and tart beer using a mixed population of the microorganisms previously chosen. The end pH values and acidity reached levels acceptable for Berliner Weisse beer. However, it took approximately two months of bottle conditioning at 12 °C so that the beers fermented with the three microorganisms could be considered acidic.
The isolation of Lactobacillus and Brettanomyces cells from a mixed culture was proved possible and simple; however, this was only not possible for Saccharomyces using the media and conditions imposed.
The viability tests showed that trypan blue is the most adequate vital dye for assessing the viability of the yeast strains tested once that the viability values were the closest to the CFU counts. Methylene blue measurements presented high standard deviations and the risk of the over- or underestimation of facts. Propidium iodide showed good proximity to the CFU numbers for B1, S1, and S2, but overestimation was observed for B2. The cell viability seems to have a great influence on how and when a certain microorganism will be more active during a mixed fermentation. Reitenbach reported that autolysis provides an important source of nutrients, which previously were not available in wort, for non-dominating, slow-growing microorganisms. It was observed that as the Saccharomyces viability decreased and the cells began to die, Brett’s activity increased, so this contributed to these results [30].
Fermentations carried out with LAB and Brettanomyces showed a decrease in Lactobacillus growth if compared to pure fermentations, but no influence on the growth of Brettanomyces could be perceived. In general, fermentations carried out in the presence of Saccharomyces were dominated by this yeast. Its quick growth seems to be responsible for the high end pH values observed as well as the decrease in the cell growth for both LAB and Brettanomyces. An analysis of organic acids and wort sugars could be interesting options to help to understand the sequence in which microorganisms consume nutrients.
Volatile compounds were quantified in the samples and alcohols’ concentration was higher in fermentations with Saccharomyces, whereas esters’ concentration was higher in fermentations carried out only with Brettanomyces and Lactobacillus. By identifying microorganisms with different growth profiles and sensory effects, brewers can have more options when developing new recipes or adjusting existing ones. This can lead to a greater diversity of flavors, providing a richer sensory experience for consumers.
Furthermore, understanding how these microorganisms interact during the fermentation process can help brewers better control the production and ensure consistency in the quality of the final product, especially in the mix fermentantion beer market. This innovative approach certainly contributes to the evolution and refinement of the art of brewing.
Author Contributions
Methodology, T.H.; Formal analysis, T.H. and G.F.G.; Investigation, V.M.B.; Resources, A.F.R.; Data curation, F.J.; Writing—original draft, A.F.R., V.M.B. and F.J.; Writing—review & editing, G.F.G.; Writing—review & editing, V.M.B. All authors have read and agreed to the published version of the manuscript.
Funding
DPI–University of Brasilia.
Institutional Review Board Statement
Not applicable
Informed Consent Statement
Not applicable
Data Availability Statement
The original contributions presented in the study are included in the article; further inquiries can be directed to the corresponding author.
Conflicts of Interest
The authors declare no conflict of interest
References
- Dziedziński, M.; Stachowiak, B.; Kobus-Cisowska, J.; Kozłowski, R.; Stuper-Szablewska, K.; Szambelan, K.; Górna, B. Supplementation of beer with Pinus sylvestris L. shoots extracts and its effect on fermentation, phenolic content, antioxidant activity and sensory profiles. Electron. J. Biotechnol. 2023, 63, 10–17. [Google Scholar] [CrossRef]
- Bongaerts, D.; De Roos, J.; De Vuyst, L. Technological and environmental features determine the uniqueness of the lambic beer microbiota and production process. Appl. Environ. Microbiol. 2021, 87, e00612-21. [Google Scholar] [CrossRef] [PubMed]
- Bianco, A.; Fancello, F.; Balmas, V.; Dettori, M.; Motroni, A.; Zara, G.; Budroni, M. Microbial communities and malt quality of durum wheat used in brewing. J. Inst. Brew. 2019, 125, 222–229. [Google Scholar] [CrossRef]
- Walker, G.M. Yest: Physiology and Biotechnology; Wiley: Hobokrn, NJ, USA, 1998. [Google Scholar]
- De Roos, J.; De Vuyst, L. Microbial acidification, alcoholization, and aroma production during spontaneous lambic beer production. J. Sci. Food Agric. 2019, 99, 25–38. [Google Scholar] [CrossRef]
- Vermote, L.; De Roos, J.; Cnockaert, M.; Vandamme, P.; Weckx, S.; De Vuyst, L. New insights into the role of key microorganisms and wooden barrels during lambic beer fermentation and maturation. Int. J. Food Microbiol. 2023, 394, 110163. [Google Scholar] [CrossRef]
- Dysvik, A.; La Rosa, S.L.; De Rouck, G.; Rukke, E.O.; Westereng, B.; Wicklund, T. Microbial dynamics in traditional and modern sour beer production. Appl. Environ. Microbiol. 2020, 86, e00566-20. [Google Scholar] [CrossRef]
- Annemüller, G.; Manger, H.J.; Lietz, P. Die Berliner Weiße; VLB Berlin: Berlin, Germany, 2008. [Google Scholar]
- Tonsmeire, M. American Sour Beer: Innovative Techniques for Mixed Fermentations; Brewers Publications: Boulder, CO, USA, 2014. [Google Scholar]
- Van Oevelen, D.; Spaepen, M.; Timmermans, P.; Verachtert, H. Microbiological aspects of spontaneous wort fermentation in the production of lambic and gueuze. J. Inst. Brew. 1977, 83, 356–360. [Google Scholar] [CrossRef]
- Bokulich, N.A.; Bamforth, C.W. The microbiology of malting and brewing. Microbiol. Mol. Biol. Rev. 2013, 77, 157–172. [Google Scholar] [CrossRef]
- Keersmaecker, J. The mystery of lambic beer. Sci. Am. 1996, 275, 56–62. [Google Scholar] [CrossRef]
- BJCP—Beer Judge Certification Program. Beer Style Guide. Brazil, 2021. Available online: https://www.bjcp.org/bjcp-style-guidelines/ (accessed on 20 June 2024).
- Yakobson, C. Pure culture fermentation characteristics of Brettanomyces yeast species and their use in the brewing industry. In The Brettanomyces Project; Heriot-Watt University, Institute of Brewing and Distilling: Edinburgh, Scotland, 2010. [Google Scholar]
- Morneau, A.D.; Zuehlke, J.M.; Edwards, C.G. Comparison of media formulations used to selectively cultivate Dekkera/Brettanomyces. Lett. Appl. Microbiol. 2011, 53, 460–465. [Google Scholar] [CrossRef]
- Colomer, M.S.; Chailyan, A.; Fennessy, R.T.; Olsson, K.F.; Johnsen, L.; Solodovnikova, N.; Forster, J. Assessing population diversity of Brettanomyces yeast species and identification of strains for brewing applications. Front. Microbiol. 2020, 11, 637. [Google Scholar] [CrossRef] [PubMed]
- Freek Spitaels, F.; Wieme, A.D.; Janssens, M.; Aerts, M.; Landschoot, A.V.; Vuyst, L.; Vandamme, P. The microbial diversity of an industrially produced lambic beer shares members of a traditionally produced one and reveals a core microbiota for lambic beer fermentation. Food Microbiol. 2015, 49, 23–32. [Google Scholar] [CrossRef] [PubMed]
- He, Z.W.; Li, A.H.; Tang, C.C.; Zhou, A.J.; Liu, W.; Ren, Y.X.; Li, Z.; Wang, A. Biochar Regulates Anaerobic Digestion: Insights to the Roles of Pore Size. Chem. Eng. J. 2024, 480, 148219. [Google Scholar] [CrossRef]
- Postigo, V.; Sánchez, A.; Cabellos, J.M.; Arroyo, T. New Approaches for the Fermentation of Beer: Non-Saccharomyces Yeasts from Wine. Fermentation 2022, 8, 280. [Google Scholar] [CrossRef]
- Dysvik, A.; Liland, K.H.; Myhrer, K.S.; Westereng, B.; Rukke, E.-O.; de Rouck, G.; Wicklund, T. Pre-Fermentation with Lactic Acid Bacteria in Sour Beer Production. J. Inst. Brew. 2019, 125, 342–356. [Google Scholar] [CrossRef]
- He, Y.; Zhao, J.; Yin, H.; Deng, Y. Transcriptome Analysis of Viable but Non-Culturable Brettanomyces Bruxellensis Induced by Hop Bitter Acids. Front. Microbiol. 2022, 13, 902110. [Google Scholar] [CrossRef] [PubMed]
- Nasuti, C.; Ruffini, J.; Sola, L.; Di Bacco, M.; Raimondi, S.; Candeliere, F.; Solieri, L. Sour Beer as Bioreservoir of Novel Craft Ale Yeast Cultures. Microorganisms 2023, 11, 2138. [Google Scholar] [CrossRef]
- Lopitz-Otsoa, F.; Rementeria, A.; Elguezabal, N.; Garaizar, J. Kefir: Una Comunidad Simbiótica de Bacterias y Levaduras Con Propiedades Saludables. Rev. Iberoam. Micol. 2006, 23, 67–74. [Google Scholar] [CrossRef] [PubMed]
- Ghesti, G.F.; Carvalho, I.; Carmo, T.; Suarez, P.A.Z. A newer source of microorganism to produce Catharina Sour beers. Food Sci. Technol. 2023, 43, 10–22. [Google Scholar] [CrossRef]
- Iattici, F.; Catallo, M.; Solieri, L. Designing New Yeasts for Craft Brewing: When Natural Biodiversity Meets Biotechnology. Beverages 2020, 6, 3. [Google Scholar] [CrossRef]
- Ciosek, A.; Fulara, K.; Hrabia, O.; Satora, P.; Poreda, A. Chemical Composition of Sour Beer Resulting from Supplementation the Fermentation Medium with Magnesium and Zinc Ions. Biomolecules 2020, 10, 1599. [Google Scholar] [CrossRef] [PubMed]
- Peyer, L.C.; Zannini, E.; Jacob, F.; Arendt, E.K. Growth Study, Metabolite Development, and Organoleptic Profile of a Malt-Based Substrate Fermented by Lactic Acid Bacteria. J. Am. Soc. Brew. Chem. 2015, 73, 303–313. [Google Scholar] [CrossRef]
- Ramanan, M.; Fox, G.P.; Marco, M.L. Beer for Live Microbe Delivery. J. Funct. Foods 2024, 113, 105987. [Google Scholar] [CrossRef]
- Fu, X.; Guo, L.; Li, Y.; Chen, X.; Song, Y.; Li, S. Transcriptional Analysis of Mixed-Culture Fermentation of Lachancea Thermotolerans and Saccharomyces Cerevisiae for Natural Fruity Sour Beer. Fermentation 2024, 10, 180. [Google Scholar] [CrossRef]
- Reitenbach, A.F.; Iwassa, I.J.; Barros, B.C.B. Production of Functional Beer with the Addition of Probiotic: Saccharomyces Boulardii. Res. Soc. Dev. 2021, 10, e5010212211. [Google Scholar] [CrossRef]
Disclaimer/Publisher’s Note: The statements, opinions and data contained in all publications are solely those of the individual author(s) and contributor(s) and not of MDPI and/or the editor(s). MDPI and/or the editor(s) disclaim responsibility for any injury to people or property resulting from any ideas, methods, instructions or products referred to in the content. |
© 2024 by the authors. Licensee MDPI, Basel, Switzerland. This article is an open access article distributed under the terms and conditions of the Creative Commons Attribution (CC BY) license (https://creativecommons.org/licenses/by/4.0/).