Article

Characterization of the Gamma-Aminobutyric Acid (GABA) Biosynthetic Gene Cluster in High GABA-Producing Enterococcus avium G-15

1
Department of Probiotic Science for Preventive Medicine, Graduate School of Biomedical and Health Sciences, Hiroshima University, Kasumi 1-2-3, Minami-ku, Hiroshima 734-8551, Japan
2
Hiroshima Ekibento Co., Ltd., Yaga 5-1-2, Higashi-ku, Hiroshima 732-0042, Japan
*
Author to whom correspondence should be addressed.
Fermentation 2024, 10(8), 379; https://doi.org/10.3390/fermentation10080379
Submission received: 24 June 2024 / Revised: 16 July 2024 / Accepted: 18 July 2024 / Published: 25 July 2024

Abstract

:
We have previously shown that the lactic acid bacterium (LAB) Enterococcus avium G-15 produces gamma-aminobutyric acid (GABA) from monosodium l-glutamate (Glu) at a hyper conversion rate. We have also found a gene cluster, designated as a gad cluster, that consists of four genes for the conversion of Glu to GABA, a Glu–GABA antiporter, and two transcriptional regulatory proteins, GadR1 and GadR2. The present study has been designed to investigate what characteristics of the GadG enzyme may contribute to the high production of GABA and how these two regulators play a role in high GABA productivity. The kinetic study showed that compared with E. coli glutamate decarboxylase (GAD) enzymes, GadG has relatively high Km (1.3–2.4 times) and kcat (1.3–1.6 times) values, indicating that although there are no remarkable differences in kinetic parameters between the three GAD enzymes, GadG may contribute to the high production of GABA in the presence of enough substrates. Further, the G-15 strain lacks the ornithine decarboxylase pathway-based acid resistance mechanism observed in some LAB strains, suggesting that the GAD-based acid resistance system is relatively important and may be vigorously employed in the G-15 strain. The molecular biological analysis of GadR1 revealed that the protein plays a role in GABA production as a transcriptional activator through an indirect pathway.

1. Introduction

Gamma-aminobutyric acid (GABA), one of the non-protein amino acids, plays many important roles; it is hypotensive, diuretic, immune modulating, and tranquilizing [1,2]. Although it has been thought that the GABA molecule itself has a hard time passing through the blood–brain barrier [3,4], the health-promoting effects of dietary GABA have been considered to be due to the inhibitory activity of the peripheral sympathetic nervous system through binding to the GABAA receptor [5,6]. Many foods and supplements on the market contain GABA. GABA is widely distributed not only in animals, but also in plants, including vegetables and fruits [7]. Furthermore, GABA is also produced by microorganisms, including lactic acid bacteria (LABs) that have been traditionally used for preparing fermented foods [8,9]. The biosynthesis of GABA is performed by glutamate (Glu) decarboxylase (GAD, EC 4.1.1.15), which converts intracellular Glu to GABA, followed by the exchange of the produced GABA molecule with extracellular Glu through the Glu–GABA antiporter [10,11]. In addition to those genes, the biosynthetic gene cluster of GABA sometimes includes their regulators [9].
We have worked on the analysis and characterization of plant-derived LAB isolates and the application of their health-promoting properties. Previously, one of the isolates, Enterococcus avium G-15, has been shown to produce GABA from monosodium l-Glu (l-MSG) at a hyper conversion rate [12]. The strain can produce 115.7 ± 6.4 g/L GABA, with an 86.0 ± 5.0% conversion rate under the optimum culture condition using a jar fermentor (maximum datum showed 133.7 g/L GABA production), indicating that the G-15 strain shows a great potential for the production of GABA via the fermentation technique without genetically modified microorganisms. However, work on how E. avium G-15 produces high amount of GABA was still in progress. A study on the whole-genome sequencing of the G-15 strain [13] revealed that the strain has a gene cluster, named a gad cluster, that consists of four genes—gadR2, gadG, gadT, and gadR1—which, respectively, encode a positive regulator containing the Pfam domain HTH_Mga (PF08280) [14], GAD, a Glu–GABA antiporter, and a putative transcriptional regulator that contains a helix–turn–helix (HTH) motif [15] at its C-terminal region and shows homology to other hypothetical transcriptional regulators. It has also been shown that the expressions of gadG and gadT genes are enhanced in the presence of an appropriate concentration of monosodium l-MSG and under anaerobic culture conditions. However, it is still unknown what characteristics of the GadG enzyme may contribute to the high production of GABA, and how those regulators play a role in the regulation of GABA productivity. Because some reports on GABA productivity in LABs have revealed that chloride activates the GAD enzyme [16,17], which is a pyridoxal phosphate (PLP)-dependent enzyme, we confirmed whether the catalytic activity of the GadG enzyme is enhanced in the presence of NaCl or PLP as preliminary experiments in our previous study [12], suggesting that those factors have little effect on GadG activity.
Therefore, to investigate these problems, the present study conducted a kinetic study on GAD enzymes and a molecular biological analysis on the predicted regulator, GadR1. Both results revealed that GadG, which is the G-15-derived GAD enzyme strain, may contribute to the high production of GABA in the presence of enough substrates, and that GadR1 plays a role in GABA production as a transcriptional activator through an indirect pathway. These characteristics may result in a hyper-production of GABA in E. avium G-15 synergistically and contribute to a stable supply of GABA, which accounts for a significant share of the healthcare market.

2. Materials and Methods

2.1. Bacterial Strains, Plasmids, and Culture Conditions

The bacterial strains (Escherichia coli, E. avium, Enterococcus hirae, and Enterococcus mundtii) and plasmids used in the present study are summarized in Table 1. Unless otherwise described, de Man, Rogosa, and Sharpe (MRS) broth (Merck KGaA, Darmstadt, Germany) and Luria–Bertani (LB) broth (Sigma-Aldrich, St. Louis, MO, USA) were used for the cultivation of LABs and E. coli, respectively. If necessary, each medium was supplemented with ampicillin (100 μg/mL for E. coli), chloramphenicol (34 μg/mL for E. coli), erythromycin (300 μg/mL for E. coli and 10 μg/mL for LABs), and 1.5% (w/v) agar. Escherichia coli strains DH5α and BL21 (DE3) pLysS and plasmids pGEM-T (Promega, Madison, WI, USA) and pET-21a(+) (Merck KGaA) were used for protein overexpression. Escherichia coli strains DH5α and HST04 (dam and dcm) (Takara Bio Inc., Kusatsu, Shiga, Japan), which were especially used as transient hosts to prepare the Dam and Dcm methylation-free plasmids for transformation to LAB cells, and plasmids pUC19 and pLES003-b [18] were employed for the construction of artificial gene clusters and a GABA productivity assay. Enterococcus hirae IFO 3128 obtained from National Institute of Technology and Evaluation (NITE) Biological Resource Center (NBRC) was used as recipient strain for LAB transformation.

2.2. DNA Manipulations and Sequencing

The extraction of chromosomal DNA and plasmid from bacterial cells was performed using DNAzol Reagent (Invitrogen, Waltham, MA, USA) and Wizard Plus Minipreps DNA Purification System (Promega), respectively, according to the manufacturer’s instructions. The nucleotide sequences of the constructed plasmids were confirmed with the ABI PRIZM 310 genetic analyzer using the BigDye Terminator v1.1 Cycle Sequencing Kit (Applied Biosystems, Foster City, CA, USA) according to the manufacturer’s protocol.

2.3. Overexpression and Purification of GAD Proteins

The chromosomal DNA of E. coli K12 W3110 and E. avium G-15 were used as a template; three GAD-encoding genes—gadA, gadB, and gadG—were amplified by PCR using Ex-gadA, Ex-gadB, and Ex-gadG primer sets, respectively (Table 2). Each amplified fragment was then cloned into the pGEM-T vector and sequenced. The cloned genes were digested with NdeI and XhoI, and each obtained fragment was subcloned into the same sites of pET-21a(+) to yield pET-gadA, pET-gadB, and pET-gadG. The constructed plasmids were transformed into E. coli BL21 (DE3) pLysS to obtain protein over-expression strains. Each transformant was cultured in 250 mL of LB broth at 37 °C until optical density at 600 nm (OD600) reached about 0.6, and then isopropyl-β-d-thiogalactopyranoside (IPTG) was added to each culture at a final concentration of 1 mM to induce a target gene. After additional cultivation at 37 °C for 4 h, the cells were collected.
The overexpressed proteins were purified using a His-bind resin purification system (Merck KGaA) according to manufacturer’s instruction. Briefly, the cells were washed with 20 mM Tris–HCl (pH 7.9) buffer containing 500 mM NaCl and 5 mM imidazole (binding buffer). The cells were resuspended into the same buffer (10 mL/g wet cell) and disrupted by sonication on ice for 60 min. After removing the cell debris by centrifugation (15,000× g, 4 °C, 20 min), the resulting cell-free supernatant was applied to a Ni(II)-chelated His-bind resin column (1.0 × 10 cm) equilibrated with a binding buffer. The column was washed with 20 mM Tris–HCl (pH 7.9) buffer containing 500 mM NaCl and 60 mM imidazole (wash buffer), and then bound proteins were eluted with a linear gradient of 60–800 mM imidazole. The fractions that contain the GAD proteins were pooled and concentrated by an ultrafiltration unit with a molecular-weight cutoff point of 10 kDa (Amicon Ultra, Merck KGaA).

2.4. Kinetic Study of the GAD Protein

The enzyme assay of each GAD protein was performed as follows: 10 μL of reaction buffer, consisting of 100 mM pyridine–HCl buffer (pH 4.4), 50 mM NaCl, 0.1 M dithiothreitol, and 0.05 mM pyridoxal phosphate, containing 0.1 μg GAD protein was preincubated at 34.5 °C for 30 min, followed by mixing with 10 μL of the same buffer that contains 40 mM monosodium l-Glu. After incubation at the same temperature for appropriate periods, 0.1 M Tris–HCl buffer (pH 8.9) was added into the mixture to stop the enzymatic reaction. The generated GABA was measured spectrophotometrically according to the method described by Jakoby [23], with some modifications. Briefly, 10 μL of each sample was diluted with 40 μL of distilled water and then added to 40 μL of the rection mixture consisting of 250 mM Tris–HCl (pH 8.9), 25 mM α-ketoglutarate, 5 mM β-mercaptoethanol, and β-nicotinamide adenine dinucleotide phosphate, in its oxidized form (β-NADP+), followed by the addition of 10 μL of 2.5 U/mL GABase (from Pseudomonas fluorescens, Sigma-Aldrich). After incubation at room temperature for 40 min, the reaction was terminated by adding 100 μL of distilled water, and the absorbance of the mixture was measured at 340 nm against a reference blank without GABase. The GABA concentrations were determined according to a standard curve prepared by varying the amounts of GABA. The kinetic parameters were determined by the Michaelis–Menten equation and Hanes–Woolf linearization [24,25] using Hyper32 free software (version 1.0) provided by the University of Liverpool, UK.

2.5. Settings and Locations Electrophoretic Mobility Shift Assay (EMSA)

Biotin-labeled DNA fragments, which were designed to contain the promoter region of gadT (239 bp), were prepared by PCR using the 5′-biotinylated primer set EMSA-gadT-F/-R (Table 2). An appropriate amount of purified GadR1 protein (10–40 pmol) was gently mixed with 1 or 10 fmol of each DNA fragment in EMSA buffer (20 mM triethanolamine–HCl (pH 7.0), 20% (v/v) glycerol, 2 mM β-mercaptoethanol, 1 mM dithiothreitol, and 100 mM KCl) containing 50 μg/mL poly(dI/dC) in a volume of 20 μL. After incubation at 25 °C for 15 min, the reaction mixture was gently mixed with 5 μL of loading dye (20% (v/v) glycerol, 0.1% (w/v) xylene cyanol, and 1% (w/v) bromophenol blue) and was then subjected to 6% native polyacrylamide gel electrophoresis using TBE buffer (90 mM Tris–borate (pH 8.3) and 2 M EDTA). After performing electrophoresis at a constant voltage of 100 V at 4 °C for 3 h, the DNA fragments were transferred on a Hybond-N+ membrane (GE Healthcare, Chicago, IL, USA) in 0.5 × TBE buffer using a Trans-Blot SD Semi-Dry Transfer Cell (Bio-Rad Laboratories, Inc., Hercules, CA, USA) at a constant current of 380 mA for 30 min. The membrane-transferred DNA fragments were fixed on the membrane by heat treatment at 80 °C for 2 min.
The biotin-labeled DNA fragments were detected using a LightShift Chemiluminescent EMSA kit (Thermo Fisher Scientific Inc., Waltham, MA, USA) according to the manufacture’s instruction manual. The chemiluminescence was detected by exposing a radiographic film (Fuji Medical X-ray Film, Fujifilm, Tokyo, Japan) for 5 min.

2.6. Construction of Plasmids Carrying a Modified gad Cluster

The primers used for the construction of the following plasmids are summarized in Table 2. The DNA fragment containing the gadR1 gene was amplified from the chromosomal DNA of the G-15 strain by PCR using primer set N-gadTG-F/-R, and then the amplified fragment was digested with SmaI/SacI and inserted into the same site as pLES003-b to generate pLES-gad-A. The gadR1 region was amplified using primer set N-gadR1-F/-R and then digested with XbaI/SmaI to subclone into the plasmid pLES-gad-A to generate pLES-gad-B. The DNA fragment containing gadTG and gadR2 was PCR amplified with a gadTG-gadR2-F/-R primer set and then subcloned into the XbaI/SacI site of pLES003-b, resulting in pLES-gad-C. For the construction of pLES-gad-D, the promoter region of mundticin 15-1A-encoding gene (Pmun), which has been found in E. mundtii 15-1A and confirmed to satisfactorily function in E. hirae IFO 3128 [21], was amplified from the 15-1A strain with the P-gadR1-F/-R primer set and subcloned into the XbaI/BamHI site of pLES003-b (resulting in pre-pLES-gad-D). The promoter-less gadR1-containing DNA fragment was PCR amplified using gadR1-F and N-gadTG-R primers and was then BamHI/SacI-digested and inserted into the same site as pre-pLES-gad-D. On the other hand, the promoter-less gadTG fragment was amplified using gadTG-F and N-gadTG-R primers, and then its KpnI/SacI-digested fragment was inserted into the same site as pLES003-b to generate pre-pLES-gad-E. The gadR1 gene fragment, with its native promoter and Pmun sequence, was amplified using N-gadR1-F/-R and P-gadTG-F/-R primer sets and digested with XbaI/SmaI and SmaI/KpnI, respectively. Each fragment was then inserted into the corresponding site of pre-pLES-gad-E to generate pLES-gad-E. Finally, the PmungadR1 region was XbaI/SmaI-digested from pLES-gad-D and inserted into the same site as pLES-gad-E to construct pLES-gad-F. Before the following electroporation step, each plasmid construct was transformed into E. coli HST04 to prepare methylation-free plasmid.

2.7. Transformation of LAB

The preparation of competent cells was performed basically as reported previously [26,27], with slight modifications. Briefly, the LAB strain was cultured in MRS broth, supplemented with a determined preliminary concentration of glycine that gives 80–90% growth inhibition (measured by OD600) of the culture, until OD600 reached about 0.2 at 37 °C. After cooling on ice for 15 min, the cells were harvested and washed twice with 1/3 volume of chilled electroporation solution (0.625 M sucrose and 1 mM MgCl2 adjusted to pH 4.0 by 1 M HCl). The washed cells were resuspended into 1/60 the original volume of the same solution, and then 100 μL aliquots were dispensed into microcentrifuge tubes and kept at −80 °C until use.
Competent cells were gently mixed with plasmid and were placed into a chilled electroporation cuvette (Bio-Rad Laboratories, Inc.) with a gap width of 0.1 cm. After holding on ice for 2 min, the cells were exposed to a pulse using the Gene Pulser XCell (Bio-Rad Laboratories, Inc.) in the following conditions: field strength, 6.25 kV/cm; capacitance, 25 μF; and resistance, 200 Ω. The pulsed cells were immediately diluted with 900 μL of MRS broth that was pre-heated to 37 °C and then incubated by gently shaking at 37 °C for 6 h. A 100 μL aliquot of the cell suspension was plated onto an MRS agar plate containing erythromycin, and the plate was incubated anaerobically at 37 °C for 2 days.

3. Results

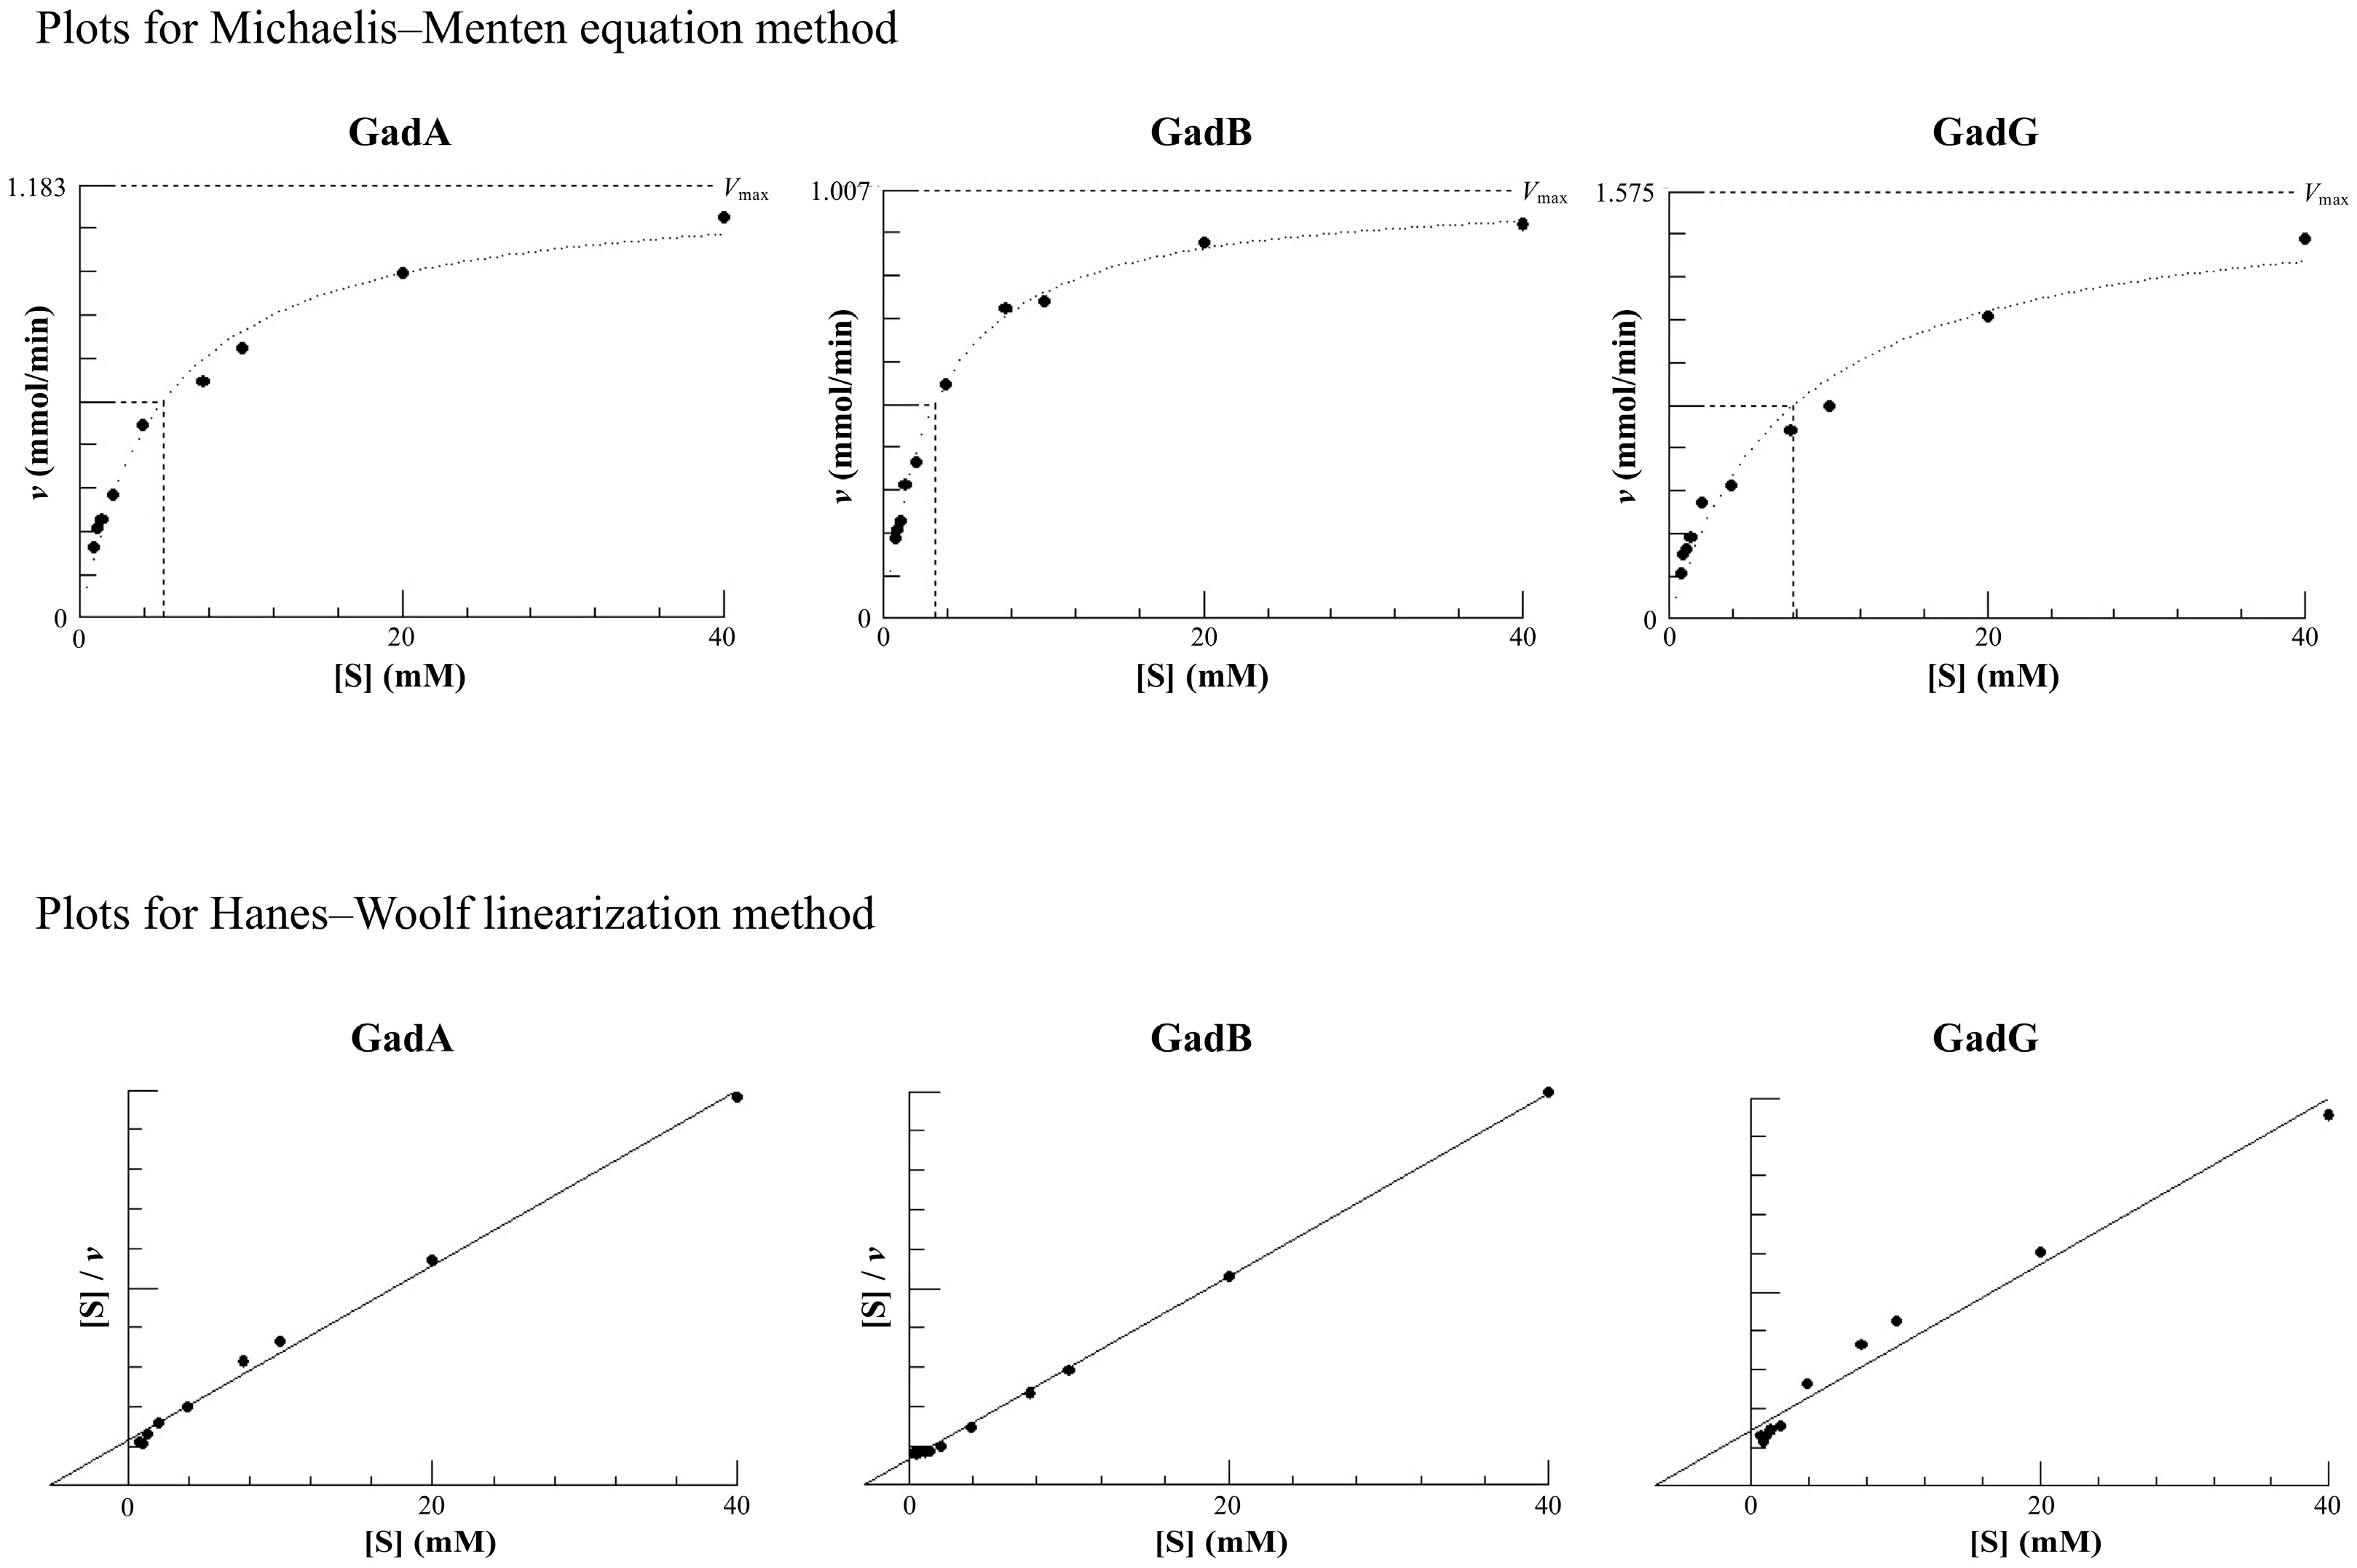
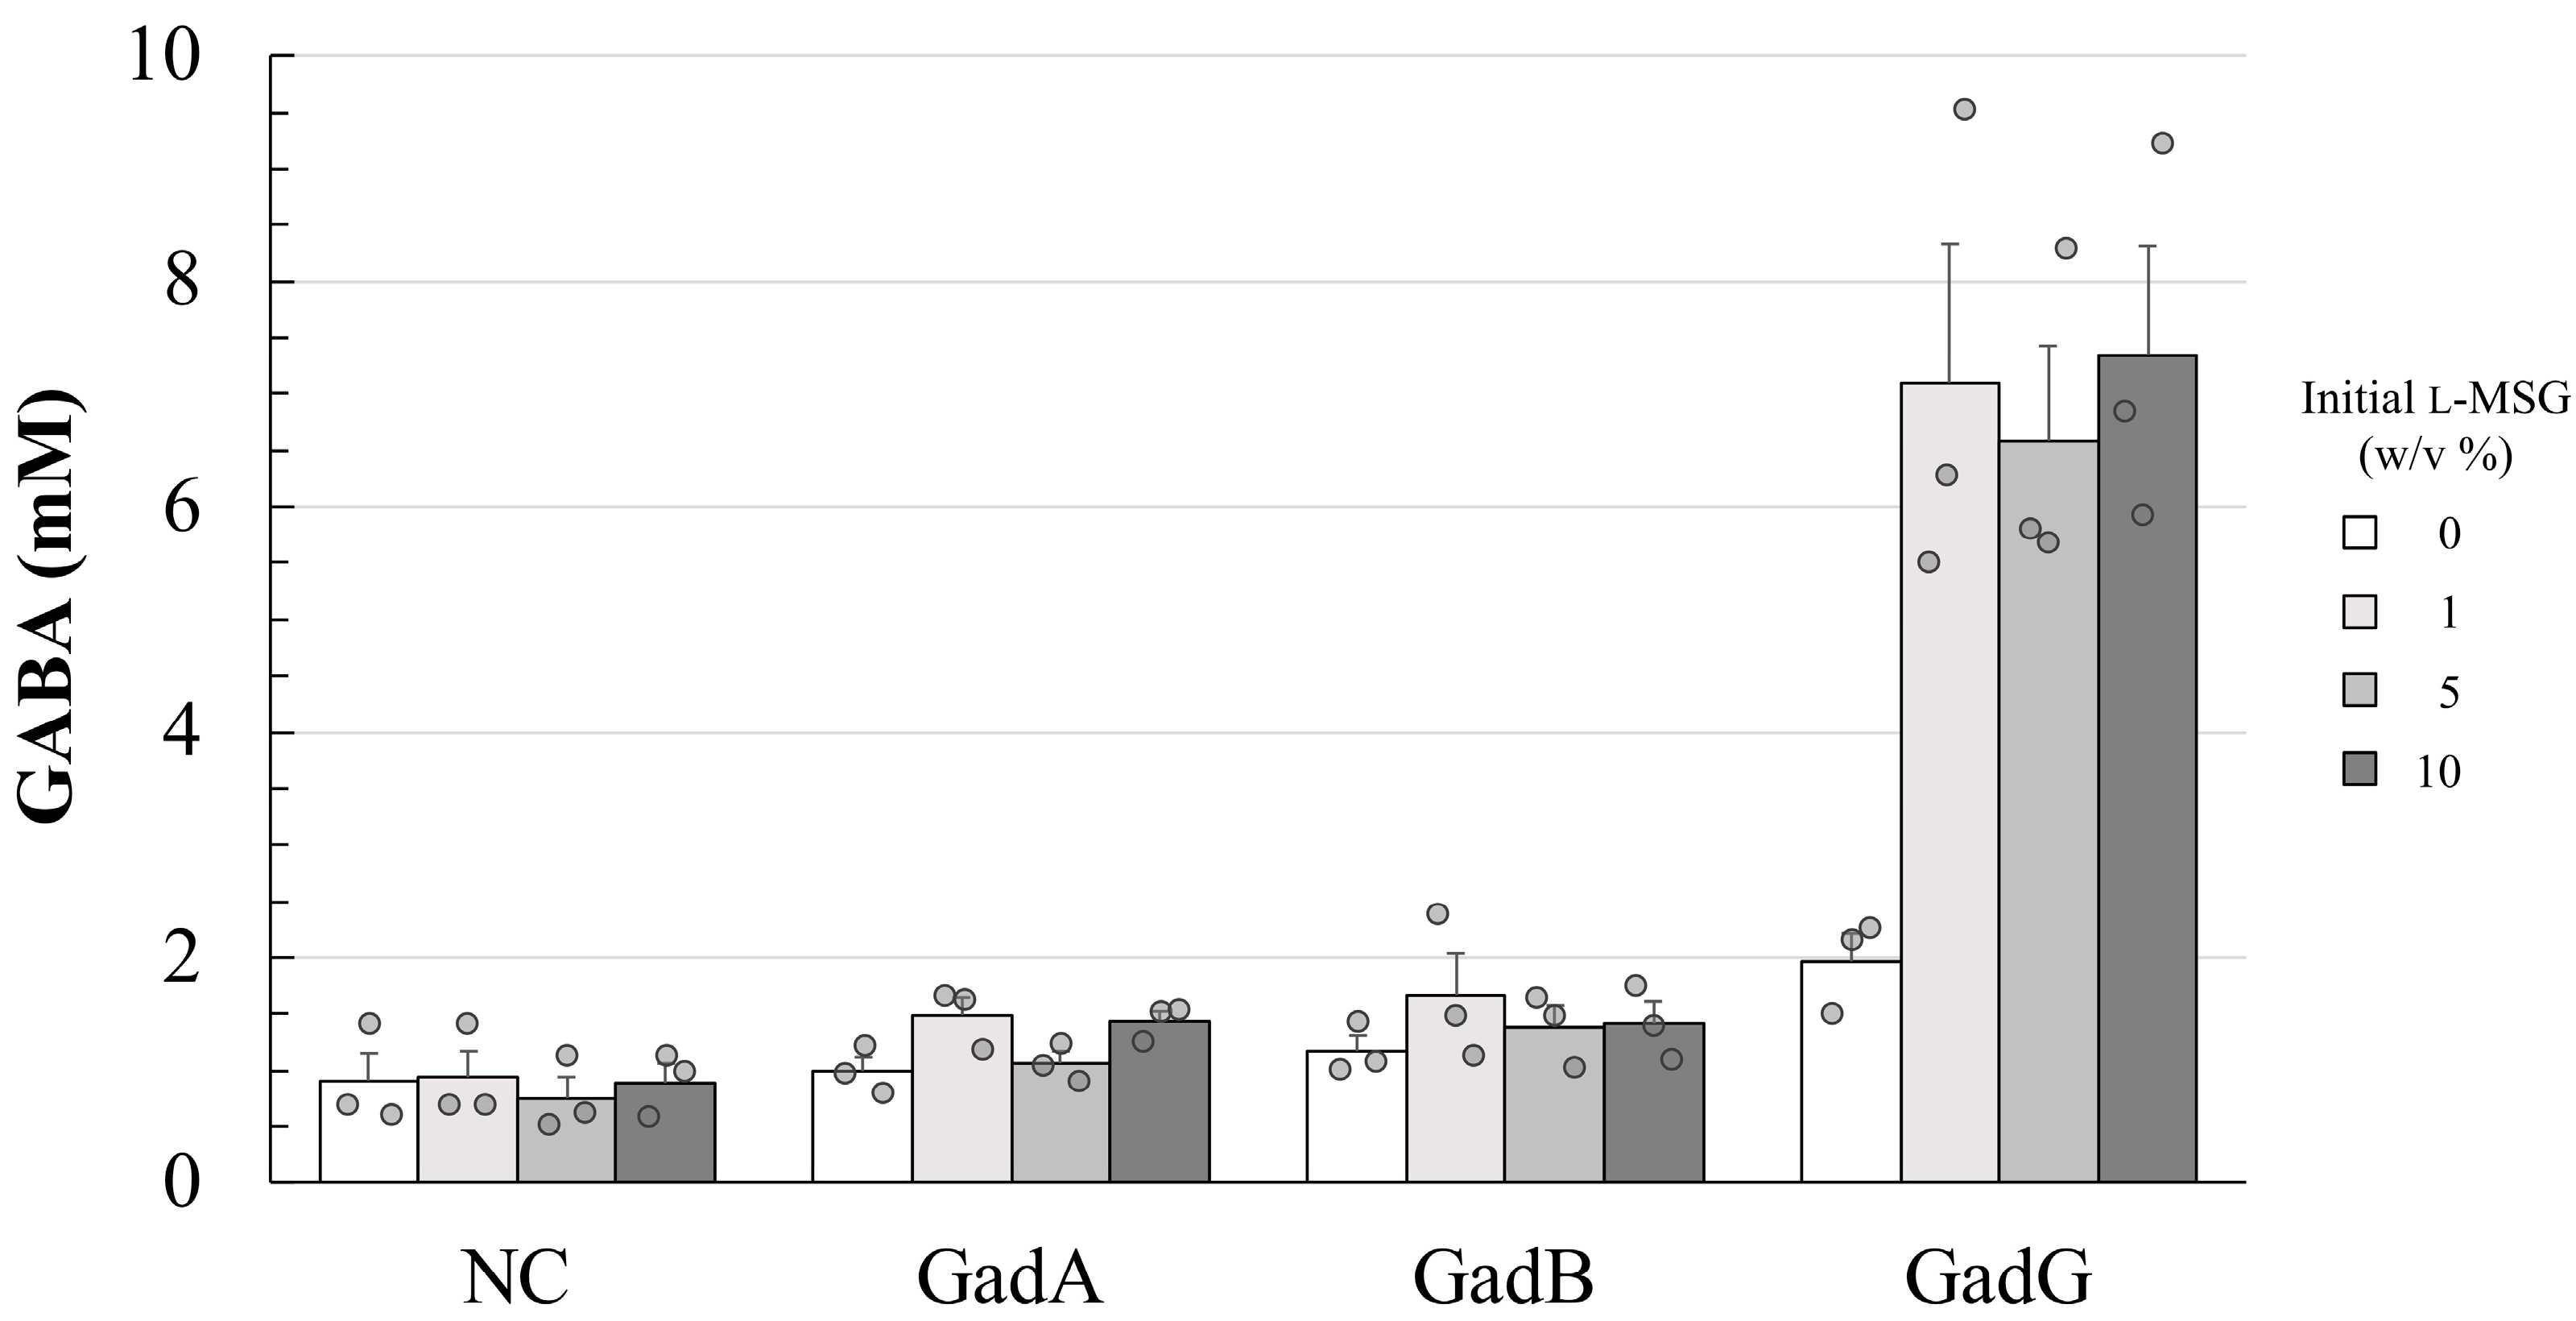
3.1. Kinetic Parameters of Each GAD

Because E. coli-derived GAD enzymes have been well studied, the enzyme was used as the control when comparing the kinetic parameters of the G-15-derived one. In addition, the N-terminal region, rather than the C-terminal one, of the GAD enzymes may have been reported to play an important role in the enzymatic function [28] and thus, each recombinant enzyme was expressed with C-terminal poly-histidine tag, which was introduced for easy purification of the protein. The kinetic parameters of each GAD protein purified as a recombinant protein were determined and compared through two kinds of analyses (Figure 1 and Table 3). From both results, the Km and kcat values of the G-15 strain were 1.5 to 2 times higher than those of GadA and GadB, indicating that the G-15-derived GadG has a somewhat lower substrate affinity, but enzymatic turnover is slightly more rapid. In the supplementary analysis, the GABA productivity of each GAD-expressing recombinant strain was measured and compared (Figure 2), and it was found that the recombinant E. coli strain over-expressing gadG seems to be able to produce more GABA in its culture supernatant than that carrying the E. coli-derived GAD encoding gene. However, there were no unambiguous data on the kinetic parameters of GAD proteins that explained the high production of GABA by the G-15 strain.

3.2. DNA-Binding Assay of Putative Transcriptional Regulator, GadR1

To confirm whether the predicted regulator GadR1 interacts with the upstream region of gadTG, the DNA-binding affinities of GadR1 against the region were measured by EMSA (Figure 3). Even in the presence of more than 10,000 times the excess (molar concentration) protein, the DNA–protein interaction caused no band shifts.

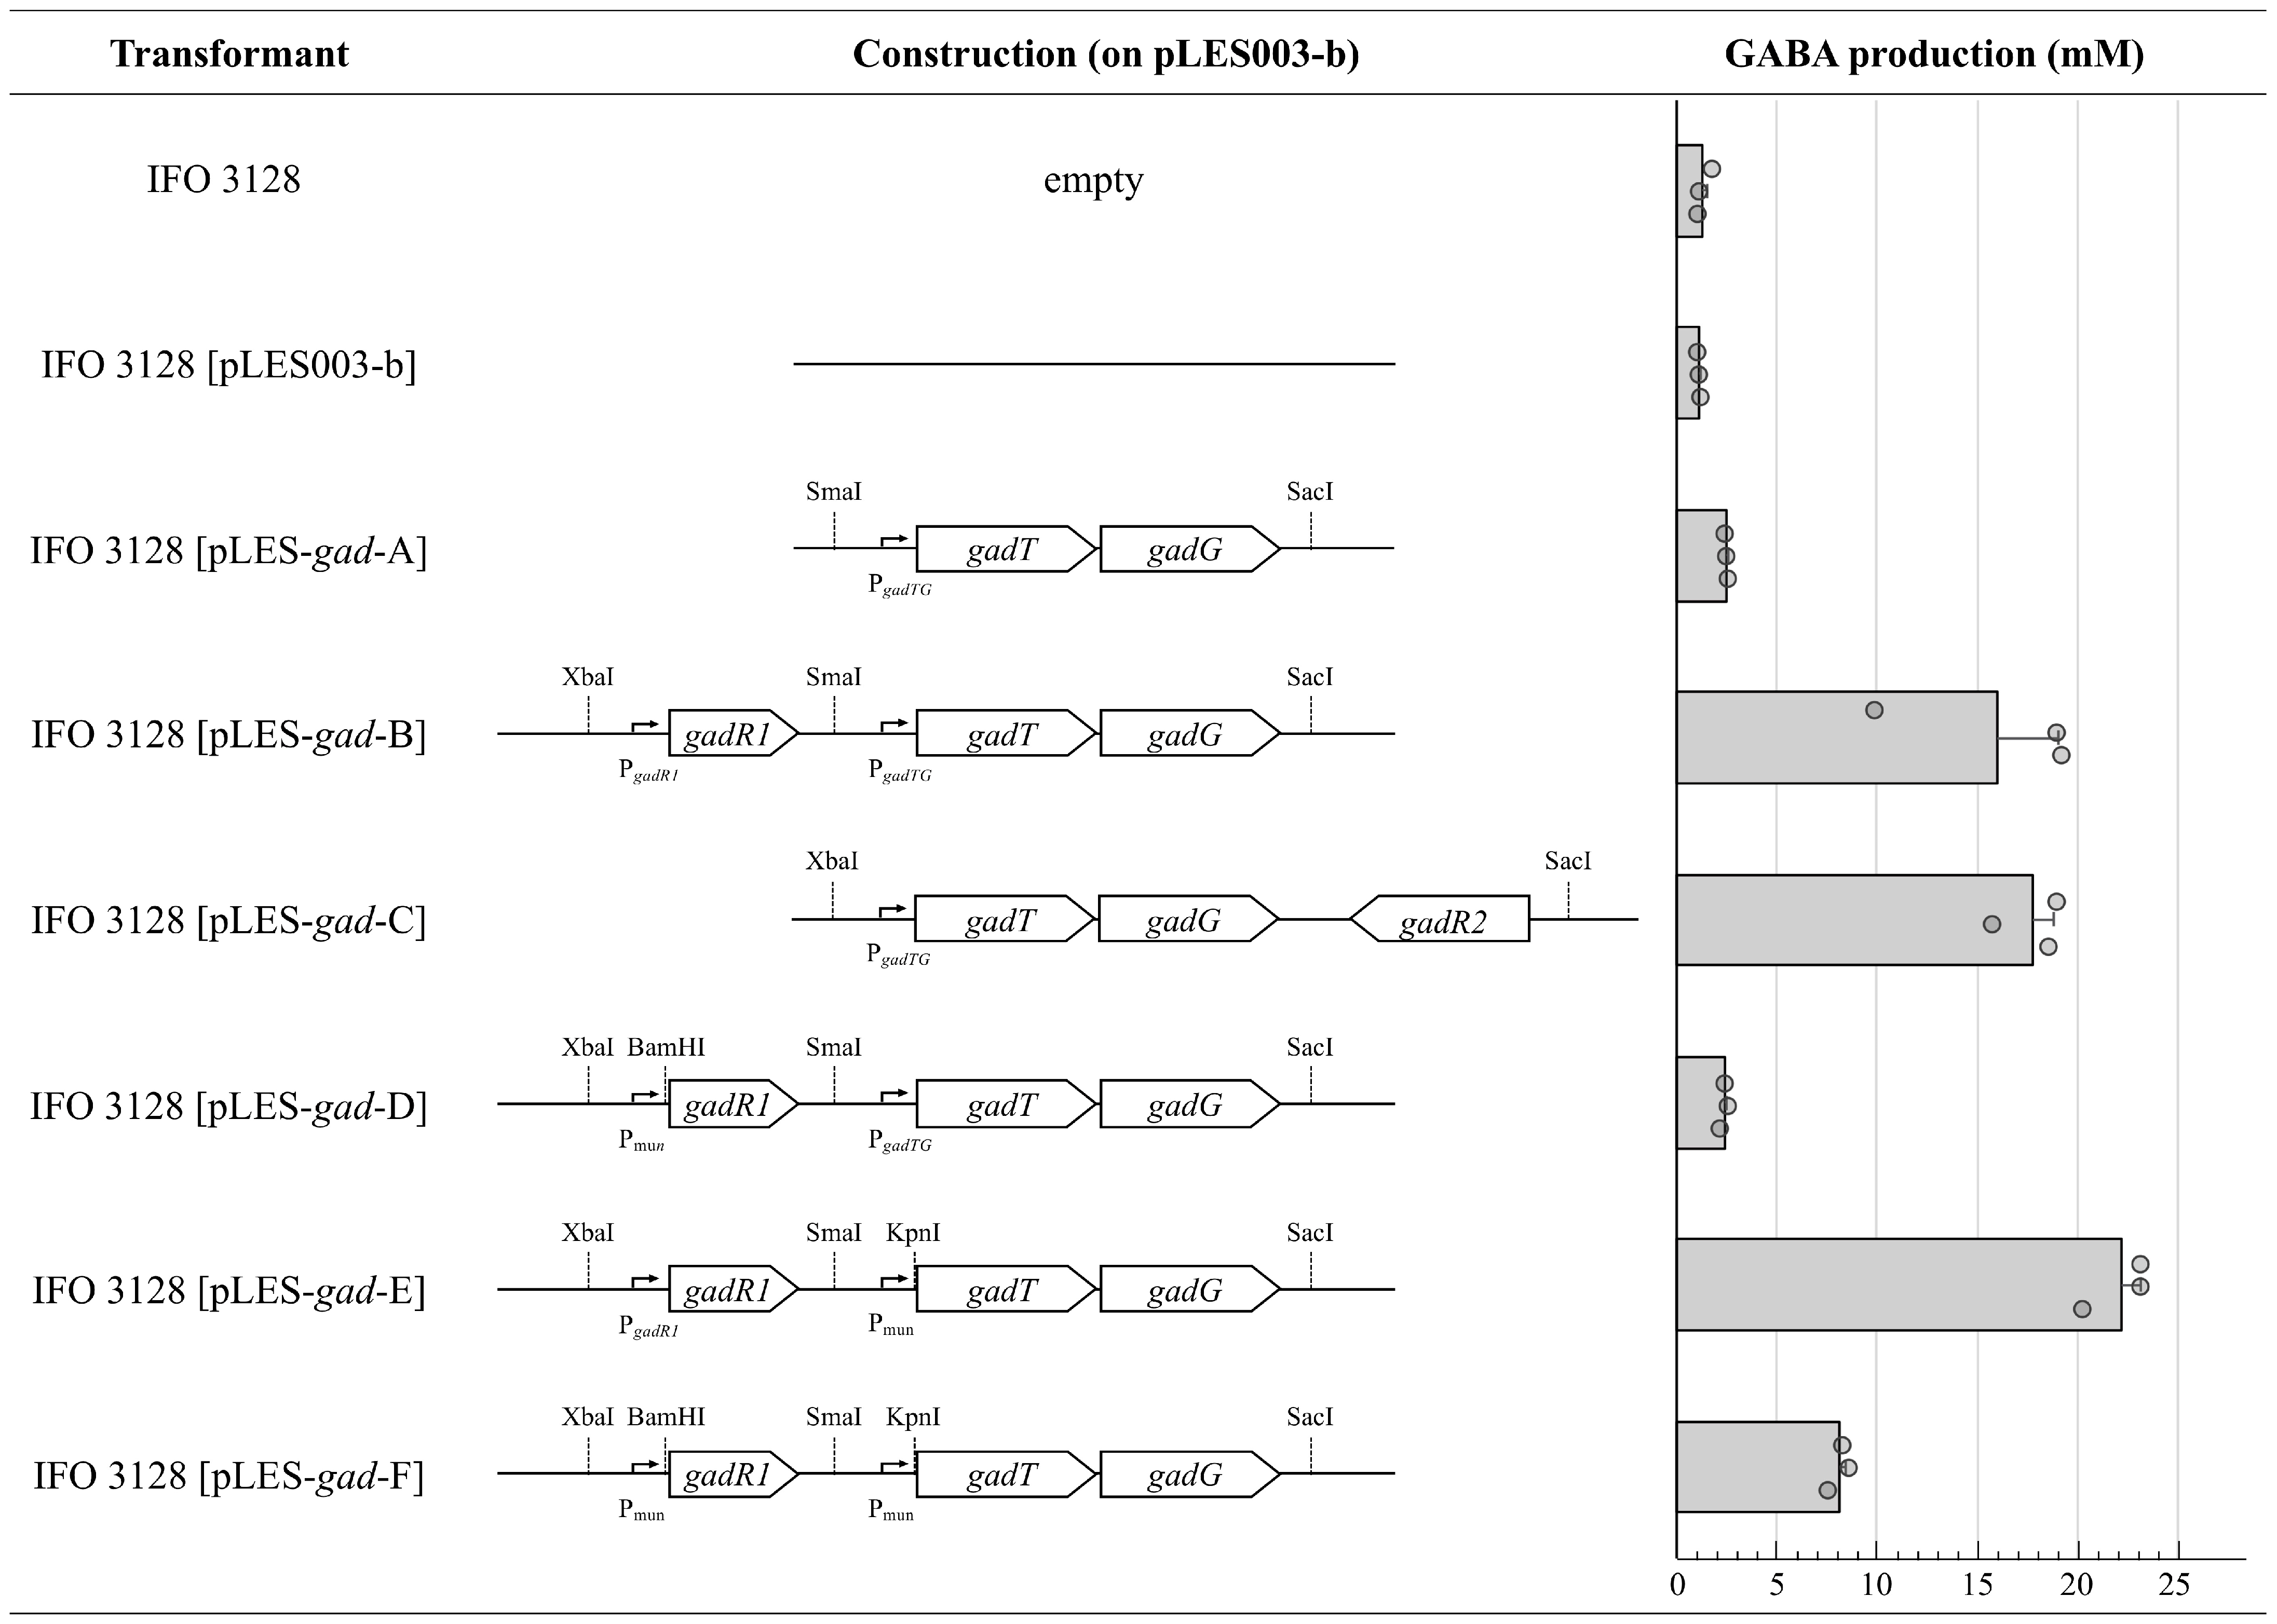
3.3. Effect of Promoter Differences on GABA Productivity

To elucidate whether GadR1 functions as a positive or negative regulator on the GABA production in the G-15 strain, modified gad clusters were constructed on the shuttle vector pLES003-b. The constructed plasmids were transferred into low GABA-producing E. hirae IFO 3128, and then the GABA productivity of each transformant was measured and compared (Figure 4). When only the gadTG operon with its native promoter was introduced to the host cell, GABA productivity was slightly enhanced, but not significantly (pLES-gad-A). The GadR2 protein homologous with positive regulators may greatly contribute to GABA production through GadT and GadG expression (pLES-gad-C). Interestingly, in the presence of gadR1, the transcription of gadTG may increase, resulting in the significant production of GABA (pLES-gad-B). The increment was also observed when the native promoter sequence of gadTG was replaced by Pmun (pLES-gad-E), whereas the replacement of the native promoter to Pmun in gadR1 resulted in a considerable decrease in GABA productivity (pLES-gad-D and pLES-gad-E).

4. Discussion

The kinetic study showed that, when compared with E. coli GAD enzymes, GadG has relatively high Km and kcat values, suggesting that GadG could contribute significantly to GABA production, particularly at high substrate concentrations. Although the high catalytic turnover activity (kcat) indicates rapid turnover once the enzyme is saturated, which can be advantageous for conversion, the high Km implies lower substrate affinity, which may limit efficiency at lower substrate concentrations. In addition, there are no remarkable differences in the kinetic parameters between the three GAD proteins, suggesting that the high production of GABA on the G-15 strain is not only due to the superior characteristics of the GadG enzyme, such as a high affinity with the substrate and a high conversion rate. In our previous study, the expression level of gadG and GABA production had been reported to decrease under an aerobic culture condition, which results in low lactic acid production [12]. The biological meaning of GABA production in bacteria is considered to be one of the acid tolerance mechanisms that adjusts the intracellular pH around the neutral through the consumption of H+, which increases under acid stress, by the production of GABA from glutamate, designated as the GAD system [29]. In fact, the GAD-encoding gene insertional mutant of the Lactococcus lactis strain, named MGNS3i7, has been confirmed to show lower acid resistance than the wild type [16].
In addition to the GAD system, the acid-resistance mechanism using the amino acid metabolism, the arginine deiminase (ADI) system, the ornithine decarboxylase (ODC) pathway, and the lysine-dependent system via the decarboxylation of lysine have been reported [30,31,32,33]. Especially in LABs, the bacteria produce organic acids like lactic acid and acetic acid during fermentation, resulting in acidic conditions. Therefore, LABs have to protect themselves from some hazardous effects caused by an acidic environment—such as the denaturation of proteins and DNA damages [34]—by employing various acid-resistance mechanisms, including the F1-F0-ATPase proton pump and alkaline production systems, in addition to the amino acid metabolism-based systems [35]. The whole-genome sequencing performed in our laboratory revealed that the G-15 strain lacks the ornithine decarboxylase gene [13] that encodes a key enzyme in the ODC pathway-based acid resistance mechanism observed not only in some kinds of LAB strains, but also other bacterial species [33,36,37,38,39,40], suggesting that the GAD-based acid resistance system is relatively important and may be vigorously employed in the G-15 strain. Interestingly, the G-15 strain can also grow under aerobic conditions, but its GABA production and gadTG transcription are remarkably reduced [12]. This may be due to the low lactic acid production resulting from the redirection of carbon flux [41] and not resulting in pH decrease. In fact, the optimum pH of the GadG enzyme was determined to be around 4.4, whereas the enzymatic activity of GadG rapidly declined as the pH increased (Supplementary Figure S1).
Judging from the analysis of the promoter-substituted artificial gad cluster (Figure 4), it is clear that GadR1 and GadR2 are necessary for vigorous GABA production through activating gadTG expression. A BLAST [42] algorithm-based homology search utilizing the non-redundant database provided by the NCBI (National Center for Biotechnology Information) indicates that GadR2 has homology with transcriptional regulators found in many enterococci, and they contain the HTH motif, classified as an Mga-type positive regulator HTH domain [14] at their N-terminal region (HTH_Mga, PF08280). Mga proteins exhibit strong similarities with RofA-like protein (RALP) regulators [43], which are well-characterized as positive regulators of the GAD system in Listeria monocytogenes [44]. Both proteins are about the size of 500 amino acids and contain the HTH domain [45]. Although the gene organization of the gad cluster in LABs is relatively varied and genus- and species-specific [46], the gad cluster in Enterococcus faecium DO also has the same organization, which consists of genes encoding GAD, the Glu–GABA antiporter, and the RALP regulator [47].
It has been found that RALP-type regulators are not present on the gad cluster in Lactococcus lactis subsp. cremoris MG1363, but a positive regulator-encoding gene lies on the cluster upstream of GAD and the Glu–GABA antiporter-encoding genes [48]. The MG1363-derived regulator, which is also designated as “GadR” and contains the HTH motif, has been revealed to act as an activator of the gad gene. In addition, the strong correlation between GABA productivity and intracellular GAD activity, which is directly related to gad gene expression, has been reported. This indicates that the regulation of the gad gene plays an important role in GABA production [49]. Although the presence of chloride ions has been revealed to enhance gad gene expression, the regulatory mechanisms of the gad cluster are still not obvious. The gene organization of the E. avium G-15 gad cluster and products and/or the predicted function of each gene are summarized in Figure 5.
The introduction of gadTG, together with gadR1, into E. hirae IFO 3128 made the host produce higher amounts of GABA than the other transformant that only introduced gadTG. Combined with the EMSA results, it is suggested that GadR1 is unlikely to bind at the promoter region of gadTG; thus, the protein may activate and/or stabilize the expression of gadTG, not through direct interaction, but by an indirect mechanism via a third factor. Although the binding analysis of GadR1 to its promoter region still has not been carried out, the putative consensus binding sequences of SlyA (5′-TTAGCAAGCTAA-3′) and GadE (5′-TTAGGATTTTGTTATTTAAA-3′), which have been reported to act as positive regulators of gad expression [50,51], are not observed in the promoter region of gadTG. In addition, a preliminary EMSA experiment (unpublished data) has confirmed that GadR1 does not bind to the intergenic region between gadT and gadG, indicating that, if there is a latent promoter on the intergenic region, GadR1 may not control the transcription of gadG by direct interaction.
When gadTG is under the control of Pmun, GABA productivities were observed to have increased more than those in their corresponding constructs. This may be because of the higher basal transcription level of the Pmun promoter compared with the native one. On the other hand, the exchange of the gadR1 promoter with Pmun caused a remarkable decrease in GABA productivity, suggesting that an excess amount of GadR1 inhibits GAD production. Many putative proteins show high similarity with GadR1 in different enterococcal species in the NCBI database. In addition to L. lactis, many strains of Levilactobacillus brevis (formerly Lactobacillus brevis) contain a transcriptional regulator-encoding gene corresponding to gadR1 with the same gene organization [52]. Here lies a limitation to our research into the precise mechanism by which GadR1 contributes to GABA production and how it affects the characteristics of the GadT protein, which is another factor playing a role in GABA production as a Glu–GABA antiporter, as the extracellular GABA concentrations are still in progress; therefore, further study will reveal the role of each product in gad cluster regulation and GABA production.

Supplementary Materials

The following supporting information can be downloaded at https://www.mdpi.com/article/10.3390/fermentation10080379/s1, Figure S1: pH profile of the GadR on l-Glu conversion into GABA.

Author Contributions

Conceptualization, M.N. and M.S.; methodology, M.N., M.O. and S.O.; validation, M.O. and S.O.; formal analysis, M.N., M.O. and S.O.; investigation, M.N., M.O., S.O., N.D., E.N. and M.S.; resources, E.N. and M.S.; data curation, M.N., M.O. and S.O.; writing—original draft preparation, M.N.; writing—review and editing, M.N., N.D., E.N. and M.S.; visualization, M.N., M.O. and S.O.; supervision, M.N. and M.S.; project administration, M.S. All authors have read and agreed to the published version of the manuscript.

Funding

This research received no external funding.

Institutional Review Board Statement

Not applicable.

Informed Consent Statement

Not applicable.

Data Availability Statement

The original contributions presented in the study are included in the article/Supplementary Materials, further inquiries can be directed to the corresponding author.

Acknowledgments

We thank the Analysis Center of Life Science, Hiroshima University, for the use of their facilities.

Conflicts of Interest

Author Etsuji Nakashima was employed by the Hiroshima Ekibento Co., Ltd. The remaining authors declare that the research was conducted in the absence of any commercial or financial relationships that could be construed as a potential conflict of interest.

References

  1. Abdoua, A.M.; Higashiguchi, S.; Horie, K.; Kima, M.; Hatta, H.; Yokogoshi, H. Relaxation and immunity enhancement effects of gamma-aminobutyric acid (GABA) administration in humans. Biofactors 2006, 26, 201–208. [Google Scholar] [CrossRef] [PubMed]
  2. Diana, M.; Quílez, J.; Rafecas, M. Gamma-aminobutyric acid as a bioactive compound in foods: A review. J. Funct. Foods 2014, 10, 407–420. [Google Scholar] [CrossRef]
  3. Boonstra, E.; de Kleijn, R.; Colzato, L.S.; Alkemade, A.; Forstmann, B.U.; Nieuwenhuis, S. Neurotransmitters as food supplements: The effects of GABA on brain and behavior. Front. Psychol. 2015, 6, 1520. [Google Scholar] [CrossRef] [PubMed]
  4. Hepsomali, P.; Groeger, J.A.; Nishihira, J.; Scholey, A. Effects of oral gamma-aminobutyric acid (GABA) administration on stress and sleep in humans: A systematic review. Front. Neurosci. 2020, 14, 923. [Google Scholar] [CrossRef] [PubMed]
  5. Hayakawa, K.; Kimura, M.; Kasaha, K.; Matsumoto, K.; Sansawa, H.; Yamori, Y. Effect of a γ-aminobutyric acid-enriched dairy product on the blood pressure of spontaneously hypertensive and normotensive Wistar-Kyoto rats. Br. J. Nutr. 2004, 92, 411–417. [Google Scholar] [CrossRef]
  6. Kawakami, K.; Yamada, K.; Yamada, T.; Nabika, T.; Nomura, M. Antihypertensive effect of γ-aminobutyric acid-enriched brown rice on spontaneously hypertensive rats. J. Nutr. Sci. Vitaminol. 2018, 64, 56–62. [Google Scholar] [CrossRef] [PubMed]
  7. Heli, Z.; Hongyu, C.; Dapeng, B.; Yee Shin, T.; Yejun, Z.; Xi, Z.; Yingying, W. Recent advances of γ-aminobutyric acid: Physiological and immunity function, enrichment, and metabolic pathway. Front. Nutr. 2022, 9, 1076223. [Google Scholar] [CrossRef]
  8. Dhakal, R.; Bajpai, V.K.; Baek, K.H. Production of gaba (γ-aminobutyric acid) by microorganisms: A review. Braz. J. Microbiol. 2012, 43, 1230–1241. [Google Scholar] [CrossRef]
  9. Li, H.; Cao, Y. Lactic acid bacterial cell factories for gamma-aminobutyric acid. Amino Acids 2010, 39, 1107–1116. [Google Scholar] [CrossRef] [PubMed]
  10. Capitani, G.; De Biase, D.; Aurizi, C.; Gut, H.; Bossa, F.; Grütter, M.G. Crystal structure and functional analysis of Escherichia coli glutamate decarboxylase. EMBO J. 2003, 22, 4027–4037. [Google Scholar] [CrossRef]
  11. Ma, D.; Lu, P.; Yan, C.; Fan, C.; Yin, P.; Wang, J.; Shi, Y. Structure and mechanism of a glutamate-GABA antiporter. Nature 2012, 483, 632–636. [Google Scholar] [CrossRef] [PubMed]
  12. Tamura, T.; Noda, M.; Ozaki, M.; Maruyama, M.; Matoba, Y.; Kumagai, T.; Sugiyama, M. Establishment of an efficient fermentation system of gamma-aminobutyric acid by a lactic acid bacterium, Enterococcus avium G-15, isolated from carrot leaves. Biol. Pharm. Bull. 2010, 33, 1673–1679. [Google Scholar] [CrossRef] [PubMed]
  13. Noda, M.; Danshiitsoodol, N.; Inoue, Y.; Okamoto, T.; Sultana, N.; Sugiyama, M. Antibiotic susceptibility of plant-derived lactic acid bacteria conferring health benefits to human. J. Antibiot. 2019, 72, 834–842. [Google Scholar] [CrossRef] [PubMed]
  14. McIver, K.S.; Myles, R.L. Two DNA-binding domains of Mga are required for virulence gene activation in the group A streptococcus. Mol. Microbiol. 2002, 43, 1591–1601. [Google Scholar] [CrossRef] [PubMed]
  15. Pabo, C.O.; Sauer, R.T. Protein-DNA recognition. Annu. Rev. Biochem. 1984, 53, 293–321. [Google Scholar] [CrossRef] [PubMed]
  16. Sanders, J.W.; Leenhouts, K.; Burghoorn, J.; Brands, J.R.; Venema, G.; Kok, J. A chloride-inducible acid resistance mechanism in Lactococcus lactis and its regulation. Mol. Microbiol. 1998, 27, 299–310. [Google Scholar] [CrossRef] [PubMed]
  17. Gut, H.; Pennacchietti, E.; John, R.A.; Bossa, F.; Capitani, G.; De Biase, D.; Grütter, M.G. Escherichia coli acid resistance: pH-sensing, activation by chloride and autoinhibition in GadB. EMBO J. 2006, 25, 2643–2651. [Google Scholar] [CrossRef]
  18. Noda, M.; Miyauchi, R.; Danshiitsoodol, N.; Matoba, Y.; Kumagai, T.; Sugiyama, M. Expression of genes involved in bacteriocin production and self-resistance in Lactobacillus brevis 174A is mediated by two regulatory proteins. Appl. Environ. Microbiol. 2018, 84, e02707-17. [Google Scholar] [CrossRef]
  19. Bachmann, B.J. Pedigrees of some mutant strains of Escherichia coli K-12. Bacteriol. Rev. 1972, 36, 525–557. [Google Scholar] [CrossRef]
  20. Hanahan, D. Studies on transformation of Escherichia coli with plasmids. J. Mol. Biol. 1983, 166, 557–580. [Google Scholar] [CrossRef]
  21. Jeon, H.J.; Noda, M.; Matoba, Y.; Kumagai, T.; Sugiyama, M. Crystal structure and mutagenic analysis of a bacteriocin immunity protein, Mun-im. Biochem. Biophys. Res. Commun. 2009, 378, 574–578. [Google Scholar] [CrossRef] [PubMed]
  22. Yanisch-Perron, C.; Vieira, J.; Messing, J. Improved M13 phage cloning vectors and host strains: Nucleotide sequences of the M13mp18 and pUC19 vectors. Gene 1985, 33, 103–119. [Google Scholar] [CrossRef] [PubMed]
  23. Jakoby, W.B. Enzymes of γ-aminobutyrate metabolism (bacterial). Methods Enzymol. 1962, 5, 765–778. [Google Scholar]
  24. Wilkinson, G.N. Statistical estimations in enzyme kinetics. Biochem. J. 1961, 80, 324–332. [Google Scholar] [CrossRef] [PubMed]
  25. Duggleby, R.G. A nonlinear regression program for small computers. Anal. Biochem. 1981, 110, 9–18. [Google Scholar] [CrossRef]
  26. Dunny, G.M.; Lee, L.N.; LeBlanc, D.J. Improved electroporation and cloning vector system for gram-positive bacteria. Appl. Environ. Microbiol. 1991, 57, 1194–1201. [Google Scholar] [CrossRef] [PubMed]
  27. Thompson, K.; Collins, M.A. Improvement in electroporation efficiency for Lactobacillus plantarum by the inclusion of high concentrations of glycine in the growth medium. J. Microbiol. Methods 1996, 26, 73–79. [Google Scholar] [CrossRef]
  28. Ma, Z.; Richard, H.; Tucker, D.L.; Conway, T.; Foster, J.W. Collaborative regulation of Escherichia coli glutamate-dependent acid resistance by two AraC-like regulators, GadX and GadW (YhiW). J. Bacteriol. 2002, 184, 7001–7012. [Google Scholar] [CrossRef]
  29. Guan, N.; Liu, L. Microbial response to acid stress: Mechanisms and applications. Appl. Microbiol. Biotechnol. 2020, 104, 51–65. [Google Scholar] [CrossRef]
  30. Liu, Y.; Tang, H.; Lin, Z.; Xu, P. Mechanisms of acid tolerance in bacteria and prospects in biotechnology and bioremediation. Biotechnol. Adv. 2015, 33, 1484–1492. [Google Scholar] [CrossRef]
  31. Shabayek, S.; Spellerberg, B. Acid stress response mechanisms of group B Streptococci. Front. Cell. Infect. Microbiol. 2017, 7, 395. [Google Scholar] [CrossRef]
  32. He, A.; Penix, S.R.; Basting, P.J.; Griffith, J.M.; Creamer, K.E.; Camperchioli, D.; Clark, M.W.; Gonzales, A.S.; Chávez Erazo, J.S.; George, N.S.; et al. Acid evolution of Escherichia coli K-12 eliminates amino acid decarboxylases and reregulates catabolism. Appl. Environ. Microbiol. 2017, 83, e00442-17. [Google Scholar] [CrossRef] [PubMed]
  33. Romano, A.; Ladero, V.; Alvarez, M.A.; Lucas, P.M. Putrescine production via the ornithine decarboxylation pathway improves the acid stress survival of Lactobacillus brevis and is part of a horizontally transferred acid resistance locus. Int. J. Food Microbiol. 2014, 175, 14–19. [Google Scholar] [CrossRef] [PubMed]
  34. Gong, L.; Ren, C.; Xu, Y. Deciphering the crucial roles of transcriptional regulator GadR on gamma-aminobutyric acid production and acid resistance in Lactobacillus brevis. Microb. Cell Fact. 2019, 18, 108. [Google Scholar] [CrossRef] [PubMed]
  35. van de Guchte, M.; Serror, P.; Chervaux, C.; Smokvina, T.; Ehrlich, S.D.; Maguin, E. Stress responses in lactic acid bacteria. Antonie Van Leeuwenhoek 2002, 82, 187–216. [Google Scholar] [CrossRef]
  36. Wang, S.; Meng, S.; Yang, X.; Zhang, B.; Zhang, J.H.; Bai, Z.K.; Song, M.X. The mechanism of acid resistance by ornithine decarboxylase in Trichinella spiralis. Exp. Parasitol. 2023, 249, 108503. [Google Scholar] [CrossRef]
  37. Richard, H.; Foster, J.W. Escherichia coli glutamate- and arginine-dependent acid resistance systems increase internal pH and reverse transmembrane potential. J. Bacteriol. 2004, 186, 6032–6041. [Google Scholar] [CrossRef]
  38. Small, P.L. Shigella and Escherichia coli strategies for survival at low pH. Jpn. J. Med. Sci. Biol. 1998, 51, S81–S89. [Google Scholar] [CrossRef]
  39. Tan, Q.; Gou, L.; Fan, T.P.; Cai, Y. Enzymatic properties of ornithine decarboxylase from Clostridium aceticum DSM1496. Biotechnol. Appl. Biochem. 2024, 71, 525–535. [Google Scholar] [CrossRef]
  40. Bao, X.; Wang, F.; Yang, R.; Zhang, Y.; Fu, L.; Wang, Y. Ornithine decarboxylation system of Shewanella baltica regulates putrescine production and acid resistance. J. Food Prot. 2021, 84, 303–309. [Google Scholar] [CrossRef]
  41. Condon, S. Responses of lactic acid bacteria to oxygen. FEMS Microbiol. Rev. 1987, 46, 269–280. [Google Scholar] [CrossRef]
  42. Altschul, S.F.; Gish, W.; Miller, W.; Myers, E.W.; Lipman, D.J. Basic local alignment search tool. J. Mol. Biol. 1990, 215, 403–410. [Google Scholar] [CrossRef] [PubMed]
  43. Fogg, G.C.; Gibson, C.M.; Caparon, M.G. The identification of rofA, a positive-acting regulatory component of prtF expression: Use of an m gamma delta-based shuttle mutagenesis strategy in Streptococcus pyogenes. Mol. Microbiol. 1994, 11, 671–684. [Google Scholar] [CrossRef] [PubMed]
  44. Wu, J.; McAuliffe, O.; O’Byrne, C.P. A novel RofA-family transcriptional regulator, GadR, controls the development of acid resistance in Listeria monocytogenes. mBio 2023, 14, e0171623. [Google Scholar] [CrossRef] [PubMed]
  45. Dramsi, S.; Dubrac, S.; Konto-Ghiorghi, Y.; Da Cunha, V.; Couvé, E.; Glaser, P.; Caliot, E.; Débarbouillé, M.; Bellais, S.; Trieu-Cuot, P.; et al. Rga, a RofA-like regulator, is the major transcriptional activator of the PI-2a pilus in Streptococcus agalactiae. Microb. Drug Resist. 2012, 18, 286–297. [Google Scholar] [CrossRef] [PubMed]
  46. Gu, X.; Zhao, J.; Zhang, R.; Yu, R.; Guo, T.; Kong, J. Molecular analysis of glutamate decarboxylases in Enterococcus avium. Front. Microbiol. 2021, 12, 691968. [Google Scholar] [CrossRef] [PubMed]
  47. Qin, X.; Galloway-Peña, J.R.; Sillanpaa, J.; Roh, J.H.; Nallapareddy, S.R.; Chowdhury, S.; Bourgogne, A.; Choudhury, T.; Muzny, D.M.; Buhay, C.J.; et al. Complete genome sequence of Enterococcus faecium strain TX16 and comparative genomic analysis of Enterococcus faecium genomes. BMC Microbiol. 2012, 12, 135. [Google Scholar] [CrossRef] [PubMed]
  48. Sanders, J.W.; Venema, G.; Kok, J.; Leenhouts, K. Identification of a sodium chloride-regulated promoter in Lactococcus lactis by single-copy chromosomal fusion with a reporter gene. Mol. Gen. Genet. 1998, 257, 681–685. [Google Scholar] [CrossRef]
  49. Laroute, V.; Aubry, N.; Audonnet, M.; Mercier-Bonin, M.; Daveran-Mingot, M.L.; Cocaign-Bousquet, M. Natural diversity of lactococci in γ-aminobutyric acid (GABA) production and genetic and phenotypic determinants. Microb. Cell Fact. 2023, 22, 178. [Google Scholar] [CrossRef]
  50. Zhang, B.; Ran, L.; Wu, M.; Li, Z.; Jiang, J.; Wang, Z.; Cheng, S.; Fu, J.; Liu, X. Shigella flexneri regulator SlyA controls bacterial acid resistance by directly activating the glutamate decarboxylation system. Front. Microbiol. 2018, 9, 2071. [Google Scholar]
  51. Castanie-Cornet, M.P.; Foster, J.W. Escherichia coli acid resistance: cAMP receptor protein and a 20 bp cis-acting sequence control pH and stationary phase expression of the gadA and gadBC glutamate decarboxylase genes. Microbiology 2001, 147, 709–715. [Google Scholar] [CrossRef] [PubMed]
  52. Wu, Q.; Tun, H.M.; Law, Y.S.; Khafipour, E.; Shah, N.P. Common distribution of gad operon in Lactobacillus brevis and its GadA contributes to efficient GABA synthesis toward cytosolic near-neutral pH. Front. Microbiol. 2017, 8, 206. [Google Scholar] [CrossRef] [PubMed]
Figure 1. Plots for the Michaelis–Menten equation and Hanes–Woolf linearization methods of recombining three GAD enzymes, GadA, GadB, and GadG. The determined kinetic parameters are summarized in Table 3.
Fermentation 10 00379 g001
Figure 2. Differences in the GABA production of E. coli transformants with the GadA, GadB, or GadG over-expressing vector. Each E. coli transformant was cultured at 37 °C for 72 h in LB broth, supplemented with 0–10% (w/v) l-MSG. After the cultivation, each culture supernatant was collected, and its GABA concentration was measured, as described in the Materials and Methods section. NC, GadA, GadB, and GadG mean the results obtained from E. coli BL21 (DE3) pLysS carrying no protein-expression vector, pET-gadA, pET-gadB, and pET-gadG, respectively. Data are indicated as the mean ± S.E. (n = 3).
Fermentation 10 00379 g002
Figure 3. Profile of the EMSA of GadR1 together with the biotin-labeled probe prepared from the upstream region of gadTG.
Fermentation 10 00379 g003
Figure 4. Comparison of GABA production of E. hirae IFO 3128 transformed with the indicated plasmids. Each transformant was anaerobically cultured in the presence of 5% (w/v) l-MSG at 37 °C for 72 h, and the GABA concentration of its supernatant was measured as described in the Materials and Methods section. Data are indicated as the mean ± S.E. (n = 3).
Fermentation 10 00379 g004
Figure 5. Gene organization of the gad cluster in E. avium G-15. The gene products and their predicted functions are also indicated.
Fermentation 10 00379 g005
Table 1. Bacterial strains and plasmids used in the present study.
Bacterial Strain/PlasmidsDescriptionResource/References
E. coliK12 W3110Used as a template for PCR to amplify the GAD.[19]
DH5αUsed in construction of plasmid.[20]
BL21(DE3) pLysSUsed as protein over-expressing strain.Promega
HST04 (dam and dcm)Used in preparation of methylation free plasmid.Takara Bio Inc.
E. aviumG-15GABA hyper-producing strain.[12]
E. hiraeIFO 3128Used as a recipient strain for LAB transformation.NBRC
E. mundtii15-1AUsed as a template for PCR to amplify the Pmun.[21]
PlasmidspUC19E. coli cloning vector.[22]
pGEM-TE. coli TA-cloning vector.Promega
pET-21a(+)E. coli over-expression vector.Merck
pLES003-bE. coli–LAB shuttle vector.[18]
Table 2. Primers used in the present study.
PurposeNameSequence (5′→3′)Restriction
Site
Target
Protein
expression
Ex-gadA-FCATATGGACCAGAAGCTGTTAACGGATNdeIgadA (E. coli K12 W3110)
Ex-gadA-RCTCGAGGGTGTGTTTAAAGCTGTTCTGCXhoIgadA (E. coli K12 W3110)
Ex-gadB-FCATATGGATAAGAAGCAAGTAACGGATTNdeIgadB (E. coli K12 W3110)
Ex-gadB-RCTCGAGGGTATGTTTAAAGCTGTTCTGTXhoIgadB (E. coli K12 W3110)
Ex-gadG-FCATATGTTATATGGAAAAGAAAATCGTGANdeIgadG (E. avium G-15)
Ex-gadG-RCTCGAGATGCGTAAATCCGTAAGTTTTGXhoIgadG (E. avium G-15)
EMSAEMSA-gadT-FBiotin-GTAAAACAAAAAGGTTCTAGTTTT
CTTCTG
upstream of gadTG
EMSA-gadT-RAGATACGCTTCTTTCCTTTTCTTTAAT upstream of gadTG
Modified
gad cluster
construction
N-gadTG-FGCCCCCGGGCTACATTTTTTTTATTTTTCTSmaIgadTG (E. avium G-15)
N-gadTG-RCGTAAGAGCTCTCATCGTGTGTGACSacIgadTG (E. avium G-15)
N-gadR1-FGCTCTAGACAACAAGCGGAGGATCAAXbaIgadR1 (E. avium G-15)
N-gadR1-RTCCCCCGGGGCACCTCTTTCCTTACAASmaIgadR1 (E. avium G-15)
gadTG-gadR2-FGCAGGTCGACTCTAGACTTCTGATTCAGA
AGGAGCTA
XbaIgadTG and gadR2
(E. avium G-15)
gadTG-gadR2-RCGGCCAGTGAATTCGAGCTCAAGTTTCTC
CCTTCAAACTCT
SacIgadTG and gadR2
(E. avium G-15)
P-gadR1-FCGTCTAGATAGTTCTTATGTCTTCTTGCXbaIPmun (E. mundtii 15-1A)
P-gadR1-RCGGGATCCAACCTTCTCTCATTTTTTGAACABamHIPmun (E. mundtii 15-1A)
gadR1-FCGCGGATCCATGAAAAAAGTAATCATTTT
GAC
BamHIgadR1 (E. avium G-15)
gadTG-FCGCGGTACCATGAATCAGAAAAAATTATCKpnIgadTG (E. avium G-15)
P-gadTG-FAATCCCGGGTAGTTCTTATGTCTTCTTGCSmaIPmun (E. mundtii 15-1A)
P-gadTG-RACTGGTACCAACCTTCTCTCATTTTTTGAACKpnIPmun (E. mundtii 15-1A)
Underline indicates position of restriction enzyme sites.
Table 3. Kinetic parameters of three kinds of GAD proteins.
by Michaelis–Menten Equationby Hanes–Woolf Linearization
Km (mM)kcat (min−1)kcat/KmKm (mM)kcat (min−1)kcat/Km
GadA5.16231225.1637125
GadB3.25301683.1527171
GadG7.88471096.6839127
Disclaimer/Publisher’s Note: The statements, opinions and data contained in all publications are solely those of the individual author(s) and contributor(s) and not of MDPI and/or the editor(s). MDPI and/or the editor(s) disclaim responsibility for any injury to people or property resulting from any ideas, methods, instructions or products referred to in the content.

