Article

Optimization of Microbial Glycogen Production by Saccharomyces cerevisiae CEY1

1
Department of Food and Nutrition, Chungnam National University, 99 Daehak-ro, Yuseong-gu, Daejeon 34134, Republic of Korea
2
Graduate School of Analytical Science and Technology, Chungnam National University, 99 Daehak-ro, Yuseong-gu, Daejeon 34134, Republic of Korea
3
Department of Chemical & Biological Engineering, Hanbat National University, 125 Dongseo-Daero, Yuseong-gu, Daejeon 34158, Republic of Korea
*
Author to whom correspondence should be addressed.
Fermentation 2024, 10(8), 388; https://doi.org/10.3390/fermentation10080388
Submission received: 10 June 2024 / Revised: 20 July 2024 / Accepted: 26 July 2024 / Published: 29 July 2024
(This article belongs to the Section Industrial Fermentation)

Abstract

:
Glycogen is a highly branched polyglucan utilized as a carbohydrate reserve in major living systems. Industrially, it is used as a prebiotic and in the nanoencapsulation of drugs and nutraceuticals. In this study, optimal fermentation conditions enabling the highest glycogen accumulation in Saccharomyces cerevisiae were experimentally evaluated for possible mass production. Production efficiency was assessed by comparing specific growth rates, specific glycogen production rates, and glycogen yields under each condition. The results demonstrated that fermentation at 30 °C with an aeration rate of 3 vvm using a medium containing 120 g/L glucose without ethanol was optimal for robust cell growth and maximum glycogen yield. Additionally, a rich medium outperformed a minimally defined medium, and a single sugar carbon source, as opposed to mixed sugars, resulted in significantly higher cell growth and glycogen yields (p < 0.05). The optimized fermentation parameters enabled a glycogen production rate of up to 0.232 ± 0.012 g-glycogen/g-cell/h and a glycogen yield of 0.603 ± 0.006 g-glycogen/g-glucose. These results provide meaningful information for future studies and/or large-scale glycogen production using S. cerevisiae.

1. Introduction

Glycogen is a homogeneous polymer of glucose comprising linear α-1,4 glycosidic linkages and α-1,6 linked branches [1,2]. It serves as the main carbon and energy storage form in animals, lower eukaryotes like fungi, and prokaryotic cells, playing an analogous role to that of starch in plants [3,4]. Some plant varieties that have mutations in isoamylase, a debranching enzyme, have also been reported to accumulate glycogen up to 30%, instead of starch.
Glycogen has broad industrial usage, with applications in the food, biopharmaceutical, and cosmetic industries. From a global market volume of 2176.6 tons in 2017, a market report projected a compound annual growth rate of 5.8% over the years 2018–2026 (Credence Research 2020). This growing demand for glycogen has been attributed to both overall growth in the usage of polysaccharides and the structural and physiochemical properties of glycogen, rendering it an advantageous biopolymer over other polyglucans like starch [5,6,7]. Notably, glycogen has been widely used in drug encapsulation and hydrogel formation [8,9,10]. In the food industry, glycogen has been utilized as a prebiotic [11,12] and as a delivery vehicle for bioactive compounds [13]. Oral administration of glycogen exhibits a decrease in the glycemic index compared to the same amount of other carbohydrates. It is also reported that glycogen possesses biofunctional activities such as immunomodulatory effects and antitumor activity, making glycogen a functional food ingredient [14,15].
Traditionally, glycogen is obtained by extraction from natural sources, including plants, shellfish, and animal organs such as the liver [16]. Glycogen has also been produced by various enzymatic processes. One enzymatic approach utilizes α-glucan phosphorylase enzyme (EC 2.4.1.1) and a branching enzyme (EC 2.4.1.18) to produce glycogen from glucose-1-phosphate. An alternative enzymatic approach first produces short-chain amylose from starch or dextrin using the isoamylase enzyme (EC 3.2.1.68) before the addition of a branching enzyme and isomaltase (EC 2.4.1.25) to produce glycogen [17,18]. Although glycogen can also be produced using both engineered and non-engineered microbes, microbial glycogen production has lagged behind other approaches despite the tremendous growth in microbial biotechnology and the expanding industrial relevance of glycogen [19,20].
Saccharomyces cerevisiae accumulates glycogen in preparation for situations in which nutrients, such as carbon and nitrogen sources, are insufficient. Glucose is introduced into the yeast cell via glucose transporter proteins, known as HXTs [21]. Afterward, glucose is phosphorylated to glucose-6-phosphate by hexokinase before conversion to glucose-1-phosphate by phosphoglucomutase and later to UDP-α-glucose by uridine phosphoglucose pyrophosphorylase [22]. Glycogen production begins by autoglucosylation—a process in which short glucosyl chains are formed from UDP-α-glucose by linking to a tyrosine residue of glycogenin—the evolutionarily conserved primer for glycogen synthesis in eukaryotes [23,24]. These short α-1,4 linked glucosyl chains are then elongated by the glycogen synthase enzymes, producing long linear polymers of α-1,4 linked glucosyl units [25]. The elongated chains further undergo ramification through the action of amylo (1,4) → (1,6)-transglucosidase (branching enzyme). During ramification, 6–8 glucosyl units are added to the end of the linear polyglucan forming α-1,6-bonds with an internal glucosyl unit of an adjacent chain to produce the hyper-branched glycogen structure [22]. Though S. cerevisiae can accumulate glycogen by up to 23% of dry cell weight [26], little to no effort has been applied to utilizing the yeast to produce glycogen. In addition, besides the examination of how the glycogen shunt affects yeast ethanolic fermentation, studies on glycogen accumulation are rather scanty [27].
With industrial applications spanning both traditional and modern bioprocesses, the use of S. cerevisiae as a cell factory is considered a major biotechnological development in human history [28]. Before the advent of industrial production of glycogen using S. cerevisiae can be considered, the fermentation conditions under which the yeast cells could accumulate sufficient glycogen for feasible extraction and biotechnological applications must be determined. Consequently, the purpose of this study was the optimization of fermentation conditions affecting both cell growth and glycogen production, aiming to achieve the best productivity of glycogen. To this end, the initial glucose concentration, the type of carbon source, the type of media, the culture temperature, differences in oxygenation levels, and the initial ethanol concentration were experimentally evaluated to determine the effect on cell growth and glycogen production in S. cerevisiae CEY1.

2. Materials and Methods

2.1. Strain and Culture Conditions

S. cerevisiae CEY1 was obtained from the food enzymology laboratory in the Department of Food Science and Technology, Chungnam National University (Daejeon, Republic of Korea). It was isolated from a mutation of S. cerevisiae by UV mutagenesis that exhibited superior glycogen production compared to its parent strain [29]. The stock was maintained by storing at –80 °C in media with 15% (v/v) glycerol. Pre-culturing and sub-culturing of cells were performed on YPD media, which contains 10 g/L yeast extract, 20 g/L peptone, and 20 g/L dextrose. For fermentation, cells were grown in YPD medium equivalent to 10% of the working volume for 24 h. Subsequently, the sub-culture was added to each fermentation medium to ensure that the OD600 reached 0.05. Cultivation was carried out aerobically by preparing 1.5 L of the medium in a fermenter (LiFlus GX, Hanil, Incheon, Republic of Korea), and the agitation speed was maintained at 200 rpm with aeration set to 3 volume of air per volume of liquid per minute (vvm). To maintain a static pH of 6.0 during fermentation, 4N HCl and 4N NaOH were used for the automatic adjustment of pH.

2.2. Fermentation Conditions

The effect of fermentation conditions, including initial glucose concentration, type of carbon source, type of media, initial ethanol concentration, and aeration, was evaluated against a control culture. The control experiments used YPD media, carried out in a 1.5 L fermenter with a glucose concentration adjusted to 50 g/L, a fermentation temperature of 30 °C, an agitation speed of 200 rpm, pH of 6, and 3 vvm aeration. To determine the effect of initial glucose concentration, fermentation was done with YPD media glucose concentrations adjusted to 20, 40, 80, 120, 200, and 300 g/L through the addition of external glucose. The effect of the type of carbon source was evaluated by adding maltose syrup (mixed sugar) to YP media in place of glucose used as the single carbon source control. To examine the effect of the culture temperature, separate fermentation experiments were conducted with all other factors held constant aside from the temperatures. Tested temperatures were 10, 20, 30, 37, and 40 °C. The effect of the type of media on glycogen production during growth on YPD (a rich media) and YNB (a minimally defined medium consisting of ammonium sulfate as the nitrogen source, vitamins, trace elements, and salts) was also compared. Additionally, the effect of varying initial ethanol concentration in the growth medium on glycogen production was evaluated by adjusting the initial ethanol concentration from 0 to 10, 20, and 30 g/L before cultivation and comparing results across the various ethanol concentrations tested. The effect of the amount of oxygen availed for respiration was evaluated by varying oxygenation levels, such that fermentations were carried out at 3 vvm, 1 vvm, 0 vvm, and anaerobically, and glycogen production was comparatively analyzed.

2.3. Analysis of Substrates and Metabolites Produced during Fermentation

Cell-free supernatant from the fermentation culture media, taken out at different periods, was analyzed to monitor substrates and produced metabolites. Centrifugation of the culture media to obtain cell-free supernatant was carried out at 13,000 rpm. The supernatant was then sterilized using a 0.45 μm filter and diluted before HPLC analyses. The High-Performance Liquid Chromatography system (HPLC 1260 Agilent Technologies, Santa Clara, CA, USA) was fitted with a refractive index (RI) detector and a Rezex ROA-organic acid H+ (8%) column (Phenomenex, Torrance, CA, USA). The analysis column was held at 40 °C with 0.005 N H2SO4 as the mobile phase. The injection volume was 20 μL, and the flow rate was set at 0.6 mL/min.

2.4. Cell Growth and Quantitation of Glycogen Production

Cell growth was measured at 600 nm wavelength using a UV/Vis spectrophotometer (Optizen 2120UV, Mecasys, Daejeon, Republic of Korea). S. cerevisiae cells were cultured at 30 °C in YPD liquid medium and harvested by centrifugation at 12,000 rpm for 1 min. The cells were then dried in an oven at 85 °C for 24 h, after which the dry weight of the yeast cells was measured (Figure S1). Glycogen was measured indirectly using Krisman’s method [30]. Briefly, the glycogen standard (glycogen from oyster, Kanto Chemical, Tokyo, Japan) was first used to generate the standard curve for quantifying glycogen in cultured cells. The standard or analysis samples were mixed with Krisman’s iodine reagent (6 mM potassium iodide, 0.4 mM iodine, saturated calcium chloride) and allowed to react for 20 min before measuring the absorbance at 460 nm wavelength using a UV/Vis spectrophotometer. The linear range of the standard curve was 0.15–1.00 mg/mL.

2.5. Fermentation Kinetics

The specific growth rate (μ) was calculated by employing the natural logarithmic values of OD600 and the time (t) taken during the exponential growth phase using the following formula:
μ = 1 X d X d t
where X denotes the cell growth value, and t represents time. Additionally, the specific glycogen production rate (qglycogen) was determined as the ratio of glycogen accumulated to that of cell growth, using the following equation:
q glycogen = 1 X d P d t
where P denotes the glycogen production value. Furthermore, the glycogen yield was quantified against the amount of glucose used, as described by the following equation:
Glycogen   yield = Amount   of   glycogen   produced   ( g -glycogen ) Amount   of   glucose   used   ( g -glucose )
Calculating the glycogen yield offers comprehensive insights into how effectively glucose is converted into glycogen during the fermentation process, contributing to a deeper understanding of the metabolic dynamics of S. cerevisiae CEY1.

2.6. Statistical Analyses

All experiments were conducted in triplicate, and the results are presented as mean ± standard deviations. Data analyses were performed using IBM SPSS Statistics 26.0 (SPSS Inc., Chicago, IL, USA). The significance of differences in fermentation parameters was assessed using one-way analysis of variance (ANOVA) with Duncan’s multiple range test as a post hoc. An independent t-test was employed to determine the significance of differences for pairwise comparisons between YPD and YNB media. The significance threshold used was p-value < 0.05.

3. Results

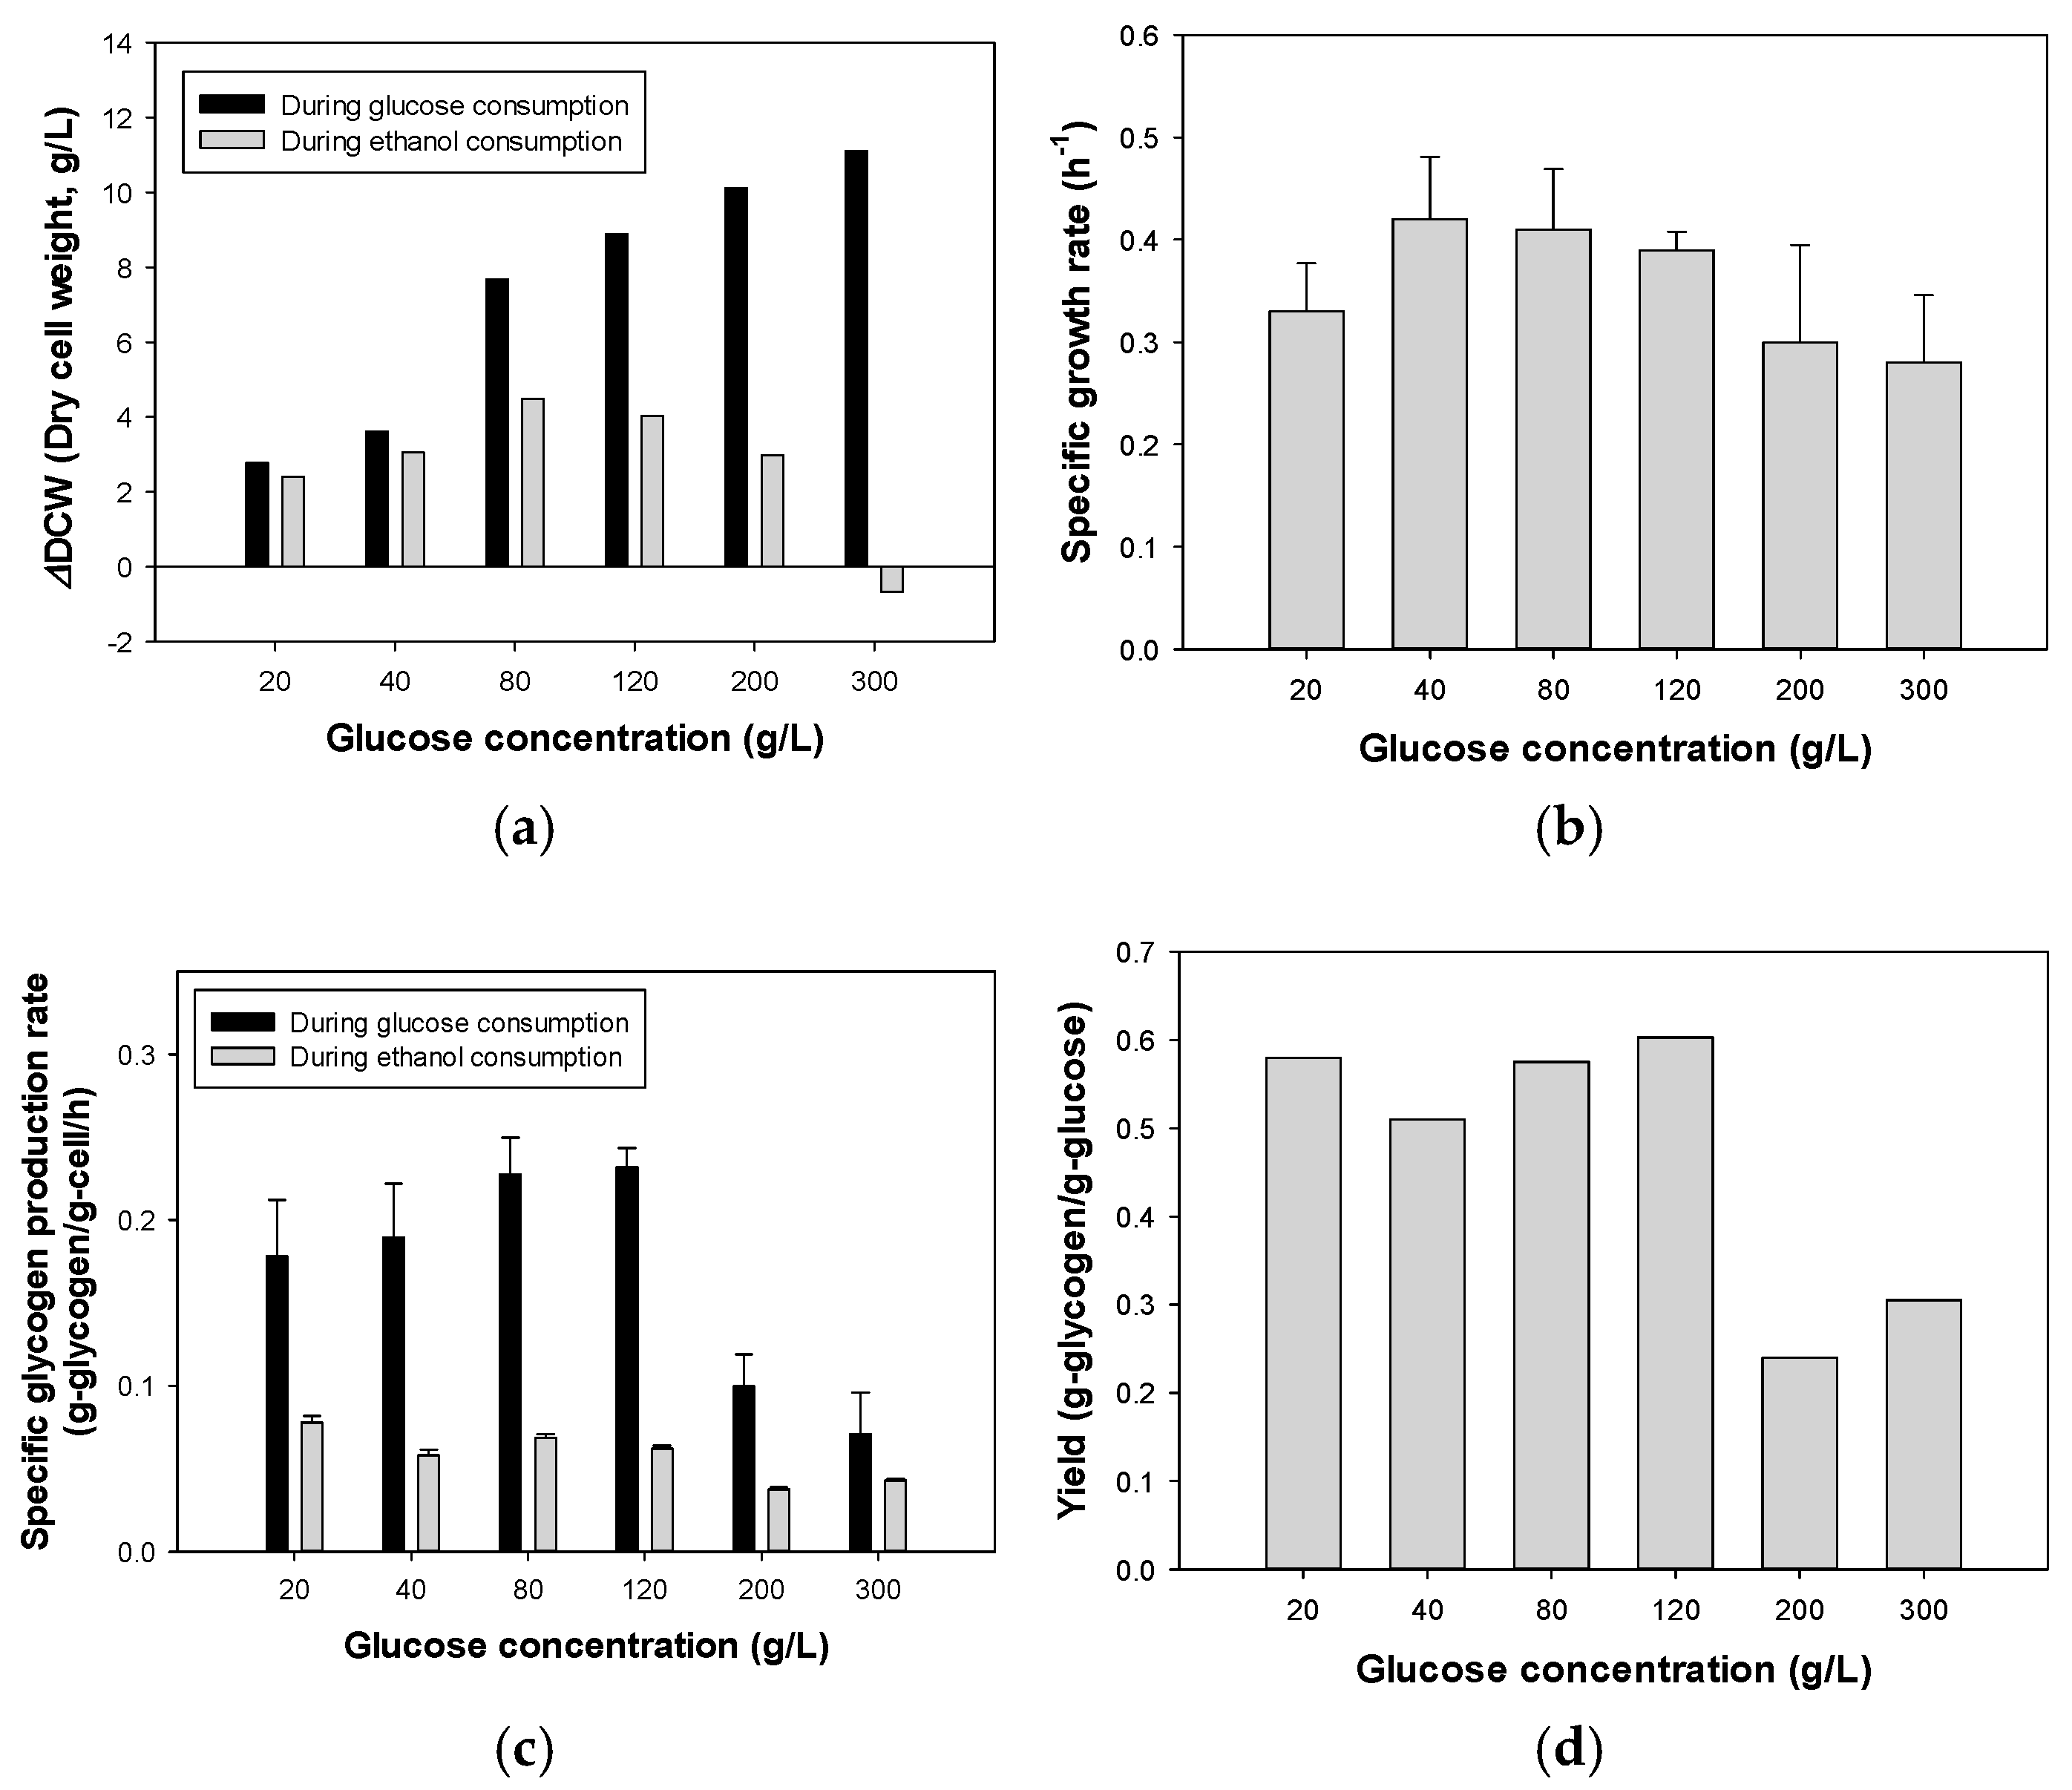
3.1. Effect of Initial Glucose Concentration on Glycogen Production

A detailed description of experimental results related to the effect of initial glucose concentration on various parameters, such as cell growth, specific growth rate, glycogen production, and glycogen yield, is provided below. As the initial glucose concentration in the media increased, so did cell growth. The highest maximum cell optical density was recorded for cells cultured at an initial glucose concentration of 300 g/L. It was observed that once all the glucose in the medium was consumed, the ethanol produced by the initial glucose was also consumed subsequently (Figure S2). It was found that the specific growth rate during glucose consumption was higher than the specific growth rate during ethanol consumption (Figure 1a and Figure S3). In other words, the cells exhibited a form of diauxic growth. The maximum cell optical density increased with the initial glucose amount, reaching a peak at a concentration of 120 g/L. However, a notable decline was observed at higher glucose concentrations (≥200 g/L), as illustrated in Figure 1a.
The specific growth rate (μ) reached its highest value in media with an initial glucose concentration of 40 g/L at 0.42 ± 0.07 /h. Similar values were maintained within the range of 40–120 g/L of initial glucose concentration. However, as depicted in Figure 1b, at higher concentrations (200 g/L and 300 g/L), the specific growth rate was 29% and 33% lower, respectively, than that observed in cells cultured with an initial glucose concentration of 40 g/L.
The production rate of glycogen increased with the initial glucose concentration, reaching its peak at 0.232 g-glycogen/g-cell/h at 120 g/L. However, beyond this concentration, the glycogen production rate sharply decreased as the glucose concentration increased. Additionally, the glycogen production rate decreased at all glucose concentrations when ethanol was consumed, compared to when glucose was used as a carbon source (Figure 1c). The glycogen yield showed maximum values at concentrations of 20 g/L and 120 g/L. However, at 20 g/L, the rate of glucose consumption was slower compared to 120 g/L, leading to the highest fermentation efficiency and the maximum glycogen yield observed at 120 g/L (Figure 1d).

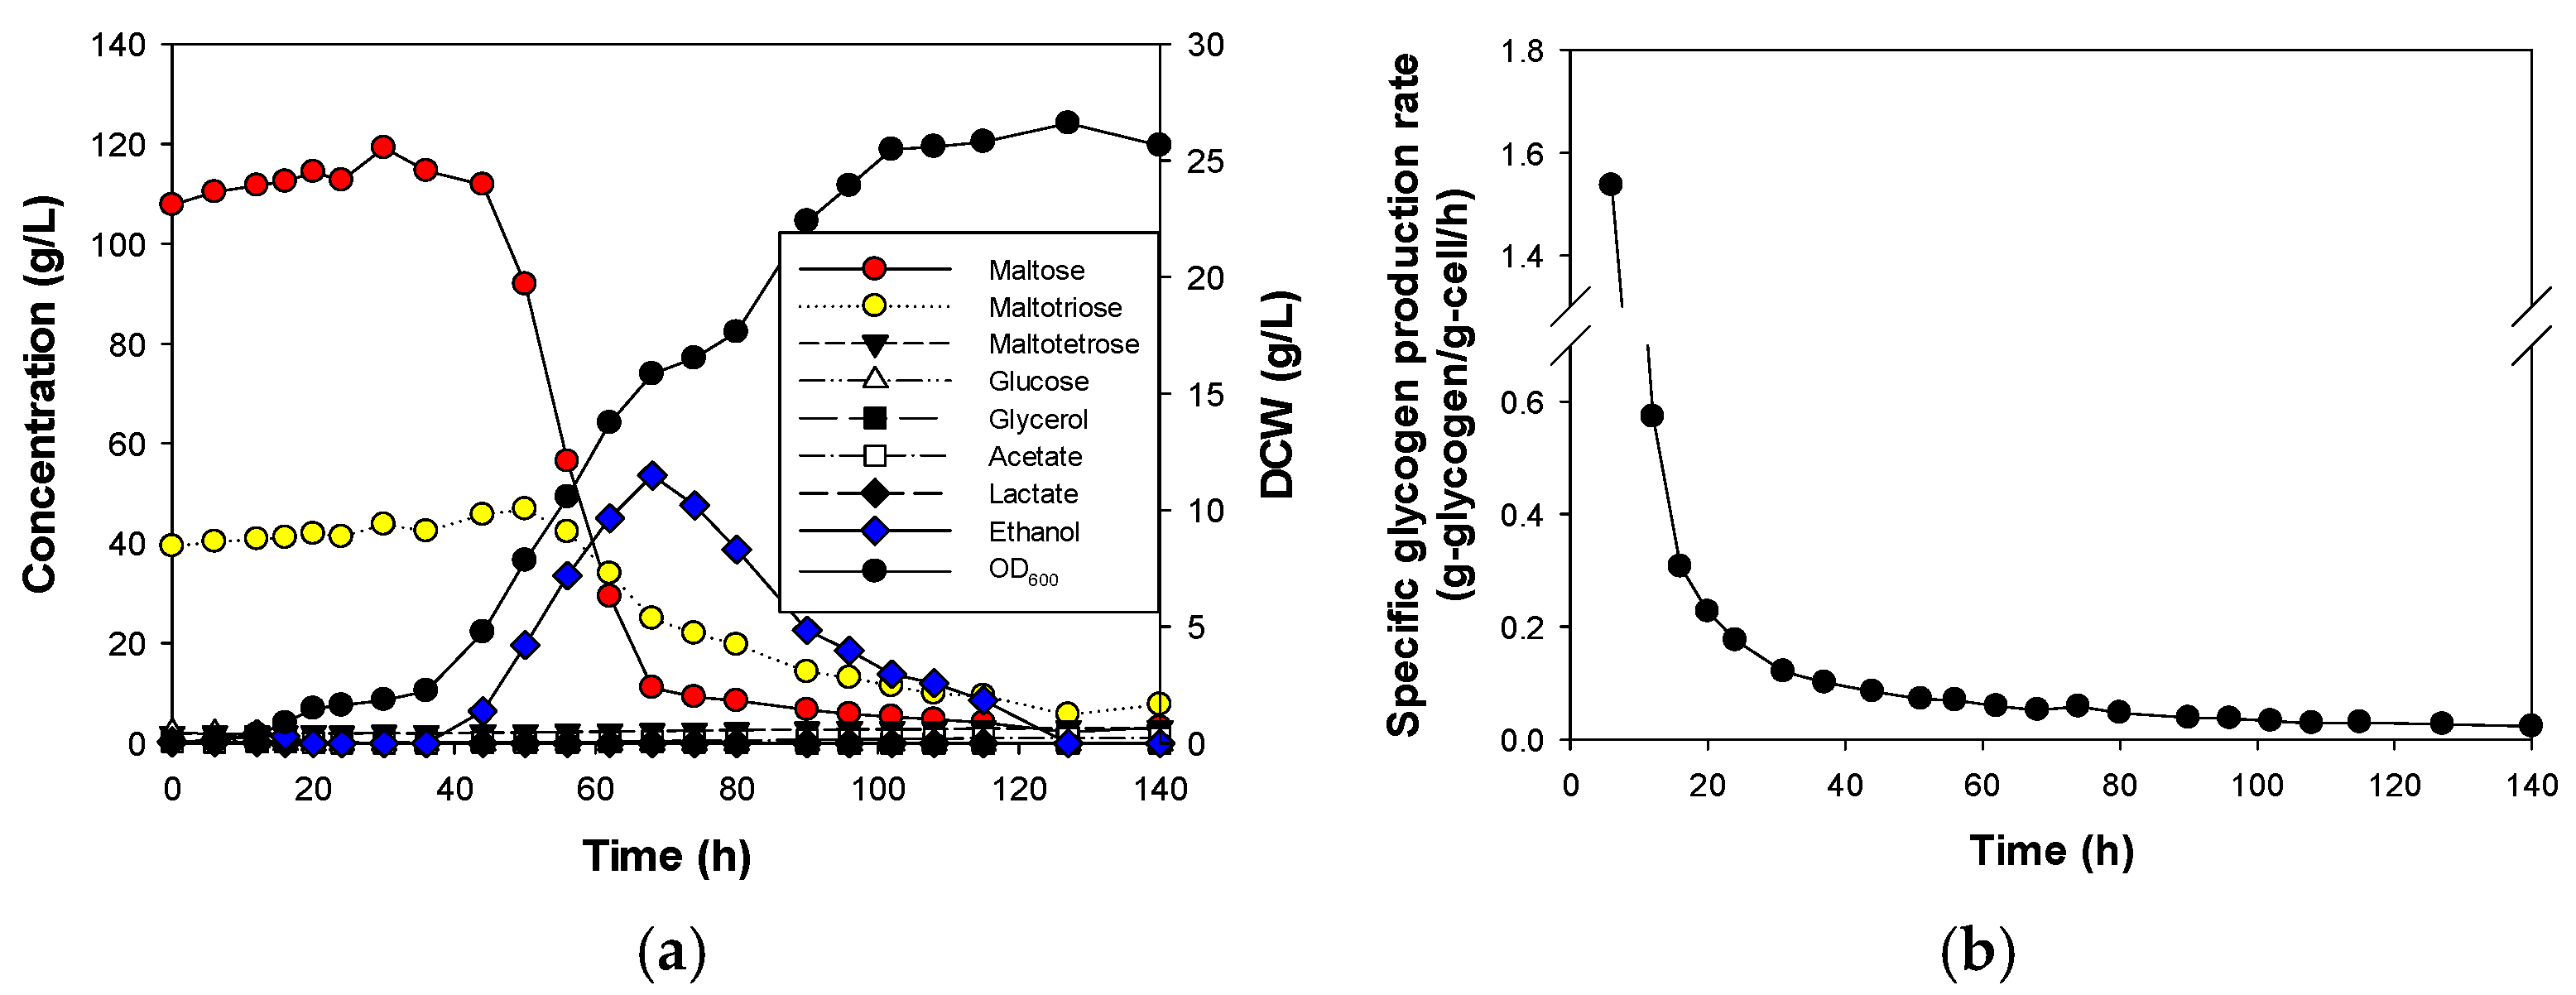
3.2. Effect of Mixed Sugar Fermentation on Glycogen Production

Compared to single sugar fermentation, the overall effect of mixed sugar fermentation was marked by multiple lag durations as yeast cells adjusted and switched from consuming each of the sugars present. Initially, cells consumed the residual glucose from the maltose syrup before sequentially utilizing other sugars, as illustrated in Figure 2a. The specific growth rate was 0.231 /h, which was 47% lower than that observed when glucose was the sole carbon source. Following glucose depletion, a 10 h acclimatization period (20–30 h) preceded the consumption of maltose. An additional 12 h lag phase (68–80 h) was then observed after maltose was fully consumed, preceding the concurrent consumption of the last portion of the syrup, maltotetrose, along with ethanol reuptake (Figure S4). As a result, the glycogen production rate varied significantly depending on the substrate used as the carbon source. The specific glycogen production rate was highest when residual glucose was used as a carbon source (0.227 ± 0.053 g-glycogen/g-cell/h), decreasing significantly when maltose and maltotetrose plus ethanol were consumed, as depicted in Figure 2b. However, there was no significant difference in the glycogen production rate when maltose was used compared to when maltotetrose and ethanol were used.

3.3. Effect of the Type of Media Used for Fermentation on Glycogen Production

Fermentation under standard conditions containing 50 g/L of glucose resulted in a specific growth rate of 0.427 ± 0.005 /h in the YPD medium, significantly higher than that in YNB media by 43% (p = 0.025) (Figure 3(i) and Figure S5). The glycogen yield was also reduced by 63% in the YNB medium, reaching a value of 0.193 g-glycogen/g-glucose (p = 0.004). However, the difference in the specific glycogen production rate was not statistically significant, whether using rich or defined media (p > 0.05). When the initial glucose concentration of either medium was elevated to 100 g/L, the total glycogen yield remained 50% lower in the YNB medium compared to the 0.583 g-glycogen/g-glucose obtained from the YPD medium (Figure 3(i)). Both the glycogen yield and specific growth rate were significantly higher in the YPD medium than in YNB media with similar glucose concentrations (Figure 3(i)). Thus, irrespective of the glucose concentration, the overall growth performance and glycogen accumulation in S. cerevisiae CEY1 were consistently found to be significantly reduced when the defined medium was used instead of rich media.

3.4. Effect of Temperature on Glycogen Production

Both the specific glycogen production rate and glycogen yield showed statistically significant differences with varying fermentation temperatures (p < 0.001). The specific glycogen production rate ranged between 0.022 ± 0.002 and 0.190 ± 0.036 g-glycogen/g-cell/h; notably, no glycogen production was observed at 40 °C (Figure 3(ii)). At 30 °C, the production rate (0.190 ± 0.036 g-glycogen/g-cell/h) was the highest productivity rate. Similarly, following the trend observed with the specific growth rate (Figure S6), the glycogen yield was highest at 30 °C (0.456 ± 0.061 g-glycogen/g-glucose), a statistically significant difference from values at lower or higher temperatures (p < 0.001). Compared to fermentation at 30 °C, glycogen yields in cells cultured at 10 °C and 20 °C decreased by 62% and 47%, respectively, and by 11% at 37 °C (Figure 3(ii)).
It was observed that both the specific growth rate (0.405 ± 0.064 /h) and glycogen yield (0.456 ± 0.061 g-glycogen/g-glucose) reached their peaks at 30 °C. This suggests that 30 °C is the optimal temperature for overall performance during glycogen production (Figure 3(ii)). Temperatures above or below 30 °C were found to markedly reduce both cell growth and the specific growth rate. For example, at 20 °C and 37 °C, the specific growth rate decreased by 72% and 64%, respectively, compared to 30 °C, and it further dropped to <0.03 /h for fermentation at both 10 °C and 40 °C (Figure 3(ii)).

3.5. Effect of Initial Ethanol Concentration on Glycogen Production

The results unveiled statistically significant differences in the specific growth rate, glycogen production rate, and glycogen yield based on the initial ethanol concentration (Figures S7 and S8). The specific growth rate peaked at 0.405 ± 0.064 /h when the initial ethanol concentration was 0 g/L and gradually decreased with increasing concentrations. Consequently, the specific growth rate reduced by 37%, 49%, and 65%, respectively, as the initial ethanol concentration changed from 0 g/L to 10, 20, and 30 g/L (Figure 3(iii)). Changes in the initial ethanol concentration also affected the average consumption time for glucose, cell mass, and ethanol production. An increase in the initial ethanol concentration prolonged the average time taken to consume all available glucose from the growth medium and increased cell density, but decreased ethanol production (Table 1). At an ethanol concentration of 30 g/L, HPLC data indicated an active withdrawal of both ethanol and glucose from the fermentation media, suggesting that dual substrate usage was possibly responsible for the observed trend of increasing cell growth with higher initial ethanol concentrations (Table 1).
Glycogen productivity peaked at 0.197 ± 0.039 g-glycogen/g-cell/h when the initial ethanol concentration was 10 g/L and decreased as the concentration exceeded 20 g/L. Compared to the culture with an initial ethanol concentration of 0 g/L, which had a specific glycogen production of 0.190 ± 0.035 g-glycogen/g-cell/h, the productivity decreased by 12% at 20 g/L and 32% at 30 g/L (Figure 3(iii)). Although the average glycogen yield did not exhibit a statistically significant difference (p = 0.117) based on the initial ethanol concentration, glycogen yield values ranged from 0.420 ± 0.004 g-glycogen/g-glucose at 10 g/L of initial ethanol concentration to 0.488 ± 0.004 g-glycogen/g-glucose when the initial ethanol concentration was 20 g/L (Figure 3(iii)). Overall, an initial ethanol concentration of 0 g/L demonstrated the fastest growth rate and relatively high glycogen production rate, as well as a moderate substrate consumption time.

3.6. Effect of Aeration on Glycogen Production

It was observed that the specific growth rate exhibited a statistically significant difference based on the amount of air injected (p < 0.001). The highest specific growth rate, recorded at 3 vvm, reached 0.427 ± 0.005 /h. This rate decreased by 16%, 22%, and 66% as the air injection amount decreased to 1 vvm, 0 vvm, and eventually to anaerobic fermentation, respectively (Table 2). While the specific growth rate did not show a significant difference when the air injection amount was reduced from 1 vvm to 0 vvm, a sharp decline in the growth rate was observed when the inflow of air was fully blocked (from 0 vvm to anaerobic), indicating a statistically significant difference (p < 0.001).
The glucose consumption time increased as the amount of air injected decreased, implying a limitation in fully utilizing glucose as the air injection into the fermenter was reduced. Overall, the time taken to consume glucose increased from 14 h at 3 vvm to 22 h during anaerobic cultivation. Concurrently, cell mass decreased as growth conditions became more anoxic, with the cell optical density dropping from a maximum of 20 at 3 vvm to 12.09 during anaerobic fermentation.
The glycogen production rate decreased by 17% and 12% when the air injection amount was reduced from 3 vvm to 1 vvm and 0 vvm, respectively. Although glycogen productivity in fully anaerobic fermentation was higher than in fermentation with 1 vvm and 0 vvm, this difference was not statistically significant compared to the glycogen production rate at 3 vvm (Table 2). In anaerobic conditions, glycolysis occurs more actively than in aerobic conditions to produce ATP [31]. It can be assumed that the surplus metabolites produced during the glycolysis process resulted in an increase in glycogen productivity.
The highest glycogen yield (0.456 ± 0.061 g-glycogen/g-glucose) was achieved at 3 vvm. Notably, a significant variation in glycogen yield was observed when the injected air was reduced from 3 vvm to anaerobic fermentation, with reduction rates of 12%, 43%, and 39% in cultures at 1 vvm, 0 vvm, and anaerobic fermentation, respectively. As outlined in Table 2, the glycogen yield did not show any statistically significant differences when fermentation was carried out with air inflow reduced to 0 vvm or under a fully anaerobic state.

4. Discussion

Similar to other yeasts, S. cerevisiae is known to store carbohydrates primarily as trehalose and glycogen [27]. Notably, glycogen has been identified as the primary reserve carbohydrate in S. cerevisiae [32]. Previous studies have demonstrated that accumulated glycogen exists in two pools: an intracellular soluble glycogen pool and a cell wall-bound insoluble glycogen pool [33,34]. These two pools combined can result in a net glycogen amount of up to 23% of the dry cell weight for some strains [27].
Fermentation variables, including temperature, pH, oxygenation levels, and available nutrients, can profoundly influence the outcomes of biochemical production when using microbes like S. cerevisiae [35,36]. Despite this, factors affecting glycogen accumulation in S. cerevisiae have remained largely unexplored in most research on the yeast. This study aims to fill this gap by investigating how various fermentation conditions impact glycogen production in S. cerevisiae CEY1. Specifically, the study compares the specific growth rate, specific glycogen production rate, and glycogen yield obtained under each condition.
Previously, glycogen accumulation in S. cerevisiae was reported to be maximum at a sugar concentration of 10% (w/v) [34]. However, the findings of this study differ slightly, as raising the initial glucose concentration in the growth media accelerated glycogen synthesis, achieving maximum glycogen yield and productivity at 120 g/L (12%) of glucose. Conversely, when examining the correlation between glucose flux and glycogen accumulation, Paalman and colleagues found that external glucose concentration as well as glucose flux and glucose-6-phosphate did not appear to correlate with the accumulation of reserve carbohydrates such as trehalose and glycogen in S. cerevisiae [37]. The findings in this study are contrary to the earlier study by Dake and colleagues [34], both of which demonstrate a significant effect of externally added glucose on the amount of accumulated glycogen. Additionally, this study showed that increasing external glucose concentration enhanced glycogen accumulation in S. cerevisiae, but only up to an initial glucose amount of 120 g/L, beyond which the stored glycogen amount decreased significantly. This reduction is likely due to very high gravity fermentation, producing greater amounts of ethanol at higher initial glucose concentrations [38,39]. A high glucose amount, such as that present when the initial glucose concentration of the media was raised to and above 200 g/L, can also osmotically stress the cells, causing inhibitory effects on both growth and metabolism and resulting in an overall reduced efficiency in glycogen production [40].
Additionally, this study used maltose syrup comprising maltose, residual glucose, and maltotetrose to investigate the effect of mixed sugar utilization on glycogen accumulation in S. cerevisiae. Unlike many other studies employing S. cerevisiae with mixed sugars to produce various biochemicals [41,42,43], no synergistic effects were observed. Most studies report overall inefficiency because the microbe sequentially utilizes each sugar, resulting in varying growth rates, productivity, and glycogen yields at the moment of consuming each sugar [43,44]. This phenotypic behavior is attributed to carbon catabolite repression [45], as evident in this work as well. Residual glucose was consumed first, followed by the sequential utilization of remnant sugars, leading to overall inefficient fermentation (Figure S2).
Glycogen accumulation in S. cerevisiae is also said to be largely dependent on nutrients, but very few studies have explored precisely how the type and amounts of nutrients affect glycogen storage [26,46]. Therefore, we aimed to understand how glycogen production is affected during growth under each type of medium, comparing the specific growth rate, glycogen production rate, and yields across two types of media containing an initial glucose concentration of 50 g/L. We also assessed glycogen accumulation in each medium with glucose concentration adjusted to the predetermined optimal initial concentration of 120 g/L. Despite reports suggesting that nutrient limitation enhances glycogen synthesis [26], our results revealed a contrary finding. Regardless of the glucose concentration, the overall growth performance and glycogen accumulation in S. cerevisiae CEY1 were significantly reduced when a defined medium was used compared to nutrient-rich media like YPD. We speculate that the enhanced cell growth and glycogen accumulation in nutrient-rich media like YPD are possibly due to both the availability and the variety of nutrients present, in contrast to when cells are cultured in the minimally defined medium, YNB. In general, during times of abundance, microorganisms store excess carbon by synthesizing intracellular reserves such as glycogen and starch. They use these reserves to survive for extended periods in the absence of external nutrients [47]. Although nascent and largely indefinite on the amount of each nutrient present, especially in the YPD media, our data offer insightful knowledge on this important aspect, opening a pathway for further research in the future.
Ethanol, especially at higher concentrations, is said to be detrimental to the cell growth and cellular viability of S. cerevisiae, in addition to having a significant effect on glycogen accumulation [48,49]. The results of this study demonstrated a decline in the specific glycogen production rate as well as the specific growth rate with an increasing concentration of initial ethanol in the growth media of S. cerevisiae. The highest glycogen productivity and growth rates were obtained in media with no externally added ethanol, while initial ethanol concentrations above 10 g/L significantly reduced the specific growth rates by 37%, 49%, and 65% at initial ethanol concentrations of 10, 20, and 30 g/L, respectively. An earlier study conducted to investigate the effect of ethanol on glycogen pools in S. cerevisiae strain 3441 reported a depletion of glycogen at ethanol concentrations of more than 10% [50]. Furthermore, Dake and colleagues showed that 2–8% of externally added ethanol increased glycogen storage, while higher ethanol concentrations of 10–12% had a diminutive effect on glycogen storage [33]. Though the obtained glycogen yield in this study did not significantly change depending on the initial ethanol concentration, the overall effects of a reduction in the specific growth rate, lower specific glycogen production rate, as well as a longer glucose consumption time at higher ethanol concentrations, collaborate with the findings of the above studies. It further suggests that glycogen production using S. cerevisiae would most likely be efficient and maximized by maintaining a low ethanol concentration in the growth medium.
The maintenance of both energy requirements and basic cell functions in S. cerevisiae is dependent on temperature, which affects, among other aspects, the working of various enzymes, such as those that metabolize glucose and glycogen [51,52]. Due to the effect on various biosynthetic and catabolic enzymes, the synthesis of various metabolites using microbes such as S. cerevisiae consequently requires an optimum temperature for maximum production. The optimization of culture temperature in this study revealed 30 °C as the most optimal temperature for glycogen production, a finding strikingly similar to an earlier study that reported the optimal temperature for glycogen formation in the filamentous fungus Neurospora crassa to be 30 °C [53]. Similarly, another study found glycogen formation in S. cerevisiae to be greater at lower temperatures, while trehalose formation was maximized as temperatures rose closer to 40 °C [54]. In the latter study, maximum glycogen synthesis was primarily strain-specific; however, overall glycogen formation in the tested strains was relatively high at 30°C. Thus, both our data and these studies seem to agree that 30 °C offers the optimal temperature for glycogen formation.
The amount of oxygen available during fermentation affects respiration, the process by which energy is produced from the catabolic breakdown of substrates such as glucose [55]. To date, however, studies specific to the effect of aeration on glycogen accumulation in S. cerevisiae remain elusive. Nonetheless, it is known that under anaerobic respiration, ethanol is majorly produced from either the breakdown of glucose or glycogen [50], suggesting a possibility that glycogen accumulation remains low during anaerobic fermentation. This study investigated the effect of changes in oxygen content on cell growth and glycogen production in S. cerevisiae CEY1. Fermentation was conducted under different conditions, ranging from anaerobic to 3 vvm, and the results of cell growth, glycogen production rate, and yield were compared under each state. Collectively, it was shown that even though the glycogen production rate was not significantly affected by oxygenation levels, the total amount of glycogen obtained reduced as the conditions for cultivating S. cerevisiae became more anoxic. The yeast cells also grew at a slower rate, eventually taking longer to metabolize glucose for cell growth and glycogen accumulation. Both the highest yield of glycogen and the specific growth rate occurred at 3 vvm of air. As a result, it was concluded that cultivating the cells at 3 vvm offered the best respiratory environment for both fast growth and metabolism, leading to the highest yield of glycogen.
Various studies exist that utilize a range of microorganisms for the production of glycogen, with a particular focus on research using microalgae and cyanobacteria (Table 3). A direct comparison is challenging due to the significant differences in strains and carbon sources. However, the results obtained from this study suggest that it is possible to produce high concentrations of glycogen.
In conclusion, this study optimized the fermentation conditions for maximum glycogen production using S. cerevisiae strain CEY1. Overall, fermentation carried out with the nutrient-rich YPD medium, at 30 °C, pH of 6.0, an initial glucose concentration of 120 g/L as the sole carbon source, aeration of 3 vvm, and 0 g/L of initial ethanol concentration produced the maximum glycogen yield, endearing these conditions against other tested variations. The optimized fermentation conditions enabled a glycogen production rate of up to 0.232 ± 0.012 g-glycogen/g-cell/h and a glycogen yield of 0.603 ± 0.006 g-glycogen/g-glucose. These values represent an increase of 1.22-fold in productivity and 1.18-fold in yield, respectively, compared to the standard condition of YPD medium containing 50 g/L glucose. These findings are vital for possible industrial glycogen production using S. cerevisiae and can further inform the design and conduct of future research on glycogen production using the microbe.

Supplementary Materials

The following supporting information can be downloaded at: https://www.mdpi.com/article/10.3390/fermentation10080388/s1, Figure S1: The dry cell weight (DCW) determination of S. cerevisiae CEY1; Figure S2: Fermentation profiles of glycogen production at varying glucose concentrations; Figure S3: Cell growth at varying glucose concentrations; Figure S4: Cell growth during fermentation using maltose syrup as a substrate; Figure S5: Cell growth at varying media types; Figure S6: Cell growth at varying temperature; Figure S7: Fermentation profiles of glycogen production at varying initial ethanol concentrations; Figure S8: Cell growth at varying initial ethanol concentrations.

Author Contributions

H.C. and J.K. conceived and designed this study. H.C. conducted experiments. H.C. analyzed data. G.M., C.S.K., and I.-S.Y. wrote the manuscript. C.S.K., I.-S.Y., T.N.S.D., and H.K. edited and corrected the manuscript. J.K. and C.S.K. supervised the entire work and revised the manuscript. All authors have read and agreed to the published version of the manuscript.

Funding

This work was supported by the research fund of Chungnam National University.

Institutional Review Board Statement

Not applicable.

Data Availability Statement

Data will be made available on request.

Conflicts of Interest

The authors declare no conflicts of interest.

References

  1. Preiss, J. Glycogen: Biosynthesis and regulation. EcoSal Plus 2014, 6. [Google Scholar] [CrossRef]
  2. Prats, C.; Graham, T.E.; Shearer, J. The dynamic life of the glycogen granule. J. Biol. Chem. 2018, 293, 7089–7098. [Google Scholar] [CrossRef] [PubMed]
  3. Ball, S.; Colleoni, C.; Cenci, U.; Raj, J.N.; Tirtiaux, C. The evolution of glycogen and starch metabolism in eukaryotes gives molecular clues to understand the establishment of plastid endosymbiosis. J. Exp. Bot. 2011, 62, 1775–1801. [Google Scholar] [CrossRef] [PubMed]
  4. Wang, L.; Liu, Q.; Tan, X.; Yang, T.; Tang, D.; Wang, W.; Wise, M.J. Bacterial glycogen as a durable energy reserve contributing to persistence: An updated bibliography and mathematical model. bioRxiv 2019, 536110. [Google Scholar] [CrossRef]
  5. Gopinath, V.; Saravanan, S.; Al-Maleki, A.; Ramesh, M.; Vadivelu, J. A review of natural polysaccharides for drug delivery applications: Special focus on cellulose, starch and glycogen. Biomed. Pharmacother. 2018, 107, 96–108. [Google Scholar] [CrossRef] [PubMed]
  6. Jirátová, M.; Pospíšilová, A.; Rabyk, M.; Pařízek, M.; Kovář, J.; Gálisová, A.; Hrubý, M.; Jirák, D. Biological characterization of a novel hybrid copolymer carrier system based on glycogen. Drug Deliv. Transl. Res. 2018, 8, 73–82. [Google Scholar] [CrossRef] [PubMed]
  7. Kasaai, M.R. A comparative study of molecular structures, solution properties and food applications for three branched polysaccharides: Amylopectin, glycogen, and dextran. Curr. Trends Polym. Sci. 2012, 16, 49–63. [Google Scholar]
  8. Gálisová, A.; Jirátová, M.; Rabyk, M.; Sticová, E.; Hájek, M.; Hrubý, M.; Jirák, D. Glycogen as an advantageous polymer carrier in cancer theranostics: Straightforward in vivo evidence. Sci. Rep. 2020, 10, 10411. [Google Scholar] [CrossRef] [PubMed]
  9. Hu, X.; Liu, Y.; Chen, Y.; Zhang, T.; Miao, M. Fabrication, structure and functional characterizations of pH-responsive hydrogels derived from phytoglycogen. Foods 2021, 10, 2653. [Google Scholar] [CrossRef]
  10. Rosales, T.K.O.; Hassimotto, N.M.A.; Lajolo, F.M.; Fabi, J.P. Nanotechnology as a tool to mitigate the effects of intestinal microbiota on metabolization of anthocyanins. Antioxidants 2022, 11, 506. [Google Scholar] [CrossRef]
  11. Martinez-Garcia, M.; Kormpa, A.; van der Maarel, M.J. The glycogen of Galdieria sulphuraria as alternative to starch for the production of slowly digestible and resistant glucose polymers. Carbohyd Polym. 2017, 169, 75–82. [Google Scholar] [CrossRef]
  12. Mirmonsef, P.; Hotton, A.L.; Gilbert, D.; Burgad, D.; Landay, A.; Weber, K.M.; Cohen, M.; Ravel, J.; Spear, G.T. Free glycogen in vaginal fluids is associated with Lactobacillus colonization and low vaginal pH. PLoS ONE 2014, 9, e102467. [Google Scholar] [CrossRef]
  13. Chen, Y.; Xue, J.; Wang, T.; Hu, Q.; Luo, Y. Carboxymethylation of phytoglycogen and its interactions with caseinate for the preparation of nanocomplex. Food Hydrocoll. 2020, 100, 105390. [Google Scholar] [CrossRef]
  14. Furuyashiki, T.; Ogawa, R.; Nakayama, Y.; Honda, K.; Kamisoyama, H.; Takata, H.; Yasuda, M.; Kuriki, T.; Ashida, H. Enzymatically synthesized glycogen reduces lipid accumulation in diet-induced obese rats. Nutr. Res. 2013, 33, 743–752. [Google Scholar] [CrossRef]
  15. Kakutani, R.; Adachi, Y.; Kajiura, H.; Takata, H.; Ohno, N.; Kuriki, T. Stimulation of macrophage by enzymatically synthesized glycogen: The relationship between structure and biological activity. Biocatal. Biotransform. 2008, 26, 152–160. [Google Scholar] [CrossRef]
  16. Powell, P.O.; Sullivan, M.A.; Sweedman, M.C.; Stapleton, D.I.; Hasjim, J.; Gilbert, R.G. Extraction, isolation and characterisation of phytoglycogen from su-1 maize leaves and grain. Carbohydr. Polym. 2014, 101, 423–431. [Google Scholar] [CrossRef]
  17. Kajiura, H.; Kakutani, R.; Akiyama, T.; Takata, H.; Kuriki, T. A novel enzymatic process for glycogen production. Biocatal. Biotransform. 2008, 26, 133–140. [Google Scholar] [CrossRef]
  18. Kajiura, H.; Takata, H.; Akiyama, T.; Kakutani, R.; Furuyashiki, T.; Kojima, I.; Harui, T.; Kuriki, T. In vitro synthesis of glycogen: The structure, properties, and physiological function of enzymatically-synthesized glycogen. Biologia 2011, 66, 387–394. [Google Scholar] [CrossRef]
  19. Ugalde, J.E.; Parodi, A.J.; Ugalde, R.A. De novo synthesis of bacterial glycogen: Agrobacterium tumefaciens glycogen synthase is involved in glucan initiation and elongation. Proc. Natl. Acad. Sci. USA 2003, 100, 10659–10663. [Google Scholar] [CrossRef] [PubMed]
  20. Wang, L.; Liu, Q.; Tan, X.; Wang, Z.; Wang, M.; Wise, M.J.; Li, C.; Ma, C.; Li, E.; Deng, B. Molecular structure of glycogen in Escherichia coli. Biomacromolecules 2019, 20, 2821–2829. [Google Scholar] [CrossRef] [PubMed]
  21. Özcan, S.; Johnston, M. Function and regulation of yeast hexose transporters. Microbiol. Mol. Biol. Rev. 1999, 63, 554–569. [Google Scholar] [CrossRef] [PubMed]
  22. François, J.; Parrou, J.L. Reserve carbohydrates metabolism in the yeast Saccharomyces cerevisiae. FEMS Microbiol. Rev. 2001, 25, 125–145. [Google Scholar] [CrossRef] [PubMed]
  23. Lomako, J.; Lomako, W.M.; Whelan, W.J. Glycogenin: The primer for mammalian and yeast glycogen synthesis. Biochim. Biophys. Acta-Gen. Subj. 2004, 1673, 45–55. [Google Scholar] [CrossRef] [PubMed]
  24. Torija, M.-J.; Novo, M.; Lemassu, A.; Wilson, W.; Roach, P.J.; François, J.; Parrou, J.-L. Glycogen synthesis in the absence of glycogenin in the yeast Saccharomyces cerevisiae. FEBS Lett. 2005, 579, 3999–4004. [Google Scholar] [CrossRef] [PubMed]
  25. Wang, L.; Liu, Q.; Wu, X.; Huang, Y.; Wise, M.J.; Liu, Z.; Wang, W.; Hu, J.; Wang, C. Bioinformatics analysis of metabolism pathways of archaeal energy reserves. Sci. Rep. 2019, 9, 1034. [Google Scholar] [CrossRef] [PubMed]
  26. Lillie, S.H.; Pringle, J.R. Reserve carbohydrate metabolism in Saccharomyces cerevisiae: Responses to nutrient limitation. J. Bacteriol. 1980, 143, 1384–1394. [Google Scholar] [CrossRef]
  27. Paulillo, S.C.d.L.; Yokoya, F.; Basso, L.C. Mobilization of endogenous glycogen and trehalose of industrial yeasts. Braz. J. Microbiol. 2003, 34, 249–254. [Google Scholar] [CrossRef]
  28. Kavšček, M.; Stražar, M.; Curk, T.; Natter, K.; Petrovič, U. Yeast as a cell factory: Current state and perspectives. Microb. Cell Fact. 2015, 14, 94. [Google Scholar] [CrossRef]
  29. Eom, S.J.; Park, J.T.; Kang, M.C.; Lee, N.H.; Song, K.M. Use of ultrasound treatment to extract mannan polysaccharide from Saccharomyces cerevisiae. J. Food Process Eng. 2022, 45, e14105. [Google Scholar] [CrossRef]
  30. Krisman, C.R. A method for the colorimetric estimation of glycogen with lodine. Anal. Biochem. 1962, 4, 17–23. [Google Scholar] [CrossRef]
  31. Parapouli, M.; Vasileiadis, A.; Afendra, A.S.; Hatziloukas, E. Saccharomyces cerevisiae and its industrial applications. AIMS Microbiol. 2020, 6, 1–31. [Google Scholar] [CrossRef]
  32. Van Dijck, P.; Colavizza, D.; Smet, P.; Thevelein, J.M. Differential importance of trehalose in stress resistance in fermenting and nonfermenting Saccharomyces cerevisiae cells. Appl. Environ. Microbiol. 1995, 61, 109–115. [Google Scholar] [CrossRef]
  33. Dake, M.S.; Jadhv, J.P.; Patil, N.B. Variations of two pools of glycogen and carbohydrate in Saccharomyces cerevisiae grown with various ethanol concentrations. J. Ind. Microbiol. Biot. 2010, 37, 701–706. [Google Scholar] [CrossRef]
  34. Dake, M.S.; Patil, N.B. Effect of ethanol on three pools of glycogen in top flocculating strain of Saccharomyces cerevisiae-3441. Asian J. Microbiol. Biotechnol. Environ. Sci. 2016, 18, 227–232. [Google Scholar]
  35. Comer, A.D.; Abraham, J.P.; Steiner, A.J.; Korosh, T.C.; Markley, A.L.; Pfleger, B.F. Enhancing photosynthetic production of glycogen-rich biomass for use as a fermentation feedstock. Front. Energy Res. 2020, 8, 93. [Google Scholar] [CrossRef] [PubMed]
  36. Liszkowska, W.; Berlowska, J. Yeast fermentation at low temperatures: Adaptation to changing environmental conditions and formation of volatile compounds. Molecules 2021, 26, 1035. [Google Scholar] [CrossRef] [PubMed]
  37. Paalman, J.W.; Verwaal, R.; Slofstra, S.H.; Verkleij, A.J.; Boonstra, J.; Verrips, C.T. Trehalose and glycogen accumulation is related to the duration of the G1 phase of Saccharomyces cerevisiae. FEMS Yeast Res. 2003, 3, 261–268. [Google Scholar] [PubMed]
  38. Joannis-Cassan, C.; Riess, J.; Jolibert, F.; Taillandier, P. Optimization of very high gravity fermentation process for ethanol production from industrial sugar beet syrup. Biomass Bioenergy 2014, 70, 165–173. [Google Scholar] [CrossRef]
  39. Rivera, E.C.; Yamakawa, C.K.; Saad, M.B.; Atala, D.I.; Ambrosio, W.B.; Bonomi, A.; Junior, J.N.; Rossell, C.E. Effect of temperature on sugarcane ethanol fermentation: Kinetic modeling and validation under very-high-gravity fermentation conditions. Biochem. Eng. J. 2017, 119, 42–51. [Google Scholar] [CrossRef]
  40. Dakal, T.C.; Solieri, L.; Giudici, P. Adaptive response and tolerance to sugar and salt stress in the food yeast Zygosaccharomyces rouxii. Int. J. Food Microbiol. 2014, 185, 140–157. [Google Scholar] [CrossRef]
  41. Chen, Y.; Wu, Y.; Zhu, B.; Zhang, G.; Wei, N. Co-fermentation of cellobiose and xylose by mixed culture of recombinant Saccharomyces cerevisiae and kinetic modeling. PLoS ONE 2018, 13, e0199104. [Google Scholar] [CrossRef] [PubMed]
  42. Hoang Nguyen Tran, P.; Ko, J.K.; Gong, G.; Um, Y.; Lee, S.M. Improved simultaneous co-fermentation of glucose and xylose by Saccharomyces cerevisiae for efficient lignocellulosic biorefinery. Biotechnol. Biofuels 2020, 13, 12. [Google Scholar] [CrossRef] [PubMed]
  43. Gao, M.; Ploessl, D.; Shao, Z. Enhancing the co-utilization of biomass-derived mixed sugars by yeasts. Front. Microbiol. 2019, 9, 3264. [Google Scholar] [CrossRef]
  44. Phowchinda, O.; Strehaiano, P. Utilization of mixed sugars for alcoholic fermentation by Saccharomyces cerevisiae. Sci. Technol. Asia 1999, 4, 23–31. [Google Scholar]
  45. Gancedo, J.M. Yeast carbon catabolite repression. Microbiol. Mol. Biol. Rev. 1998, 62, 334–361. [Google Scholar] [CrossRef] [PubMed]
  46. Anderson, C.; Tatchell, K. Hyperactive glycogen synthase mutants of Saccharomyces cerevisiae suppress the glc7-1 protein phosphatase mutant. J. Bacteriol. 2001, 183, 821–829. [Google Scholar] [CrossRef] [PubMed]
  47. Duveau, F.; Cordier, C.; Chiron, L.; Le Bec, M.; Pouzet, S.; Seguin, J.; Llamosi, A.; Sorre, B.; Di Meglio, J.M.; Hersen, P. Yeast cell responses and survival during periodic osmotic stress are controlled by glucose availability. eLife 2024, 12, RP88750. [Google Scholar] [CrossRef] [PubMed]
  48. Thomas, D.S.; Hossack, J.; Rose, A. Plasma-membrane lipid composition and ethanol tolerance in Saccharomyces cerevisiae. Arch. Microbiol. 1978, 117, 239–245. [Google Scholar] [CrossRef] [PubMed]
  49. Nagodawithana, T.; Whitt, J.; Cutaia, A. Study of the feedback effect of ethanol on selected enzymes of the glycolytic pathway. J. Am. Soc. Brew. Chem. 1977, 35, 179–183. [Google Scholar] [CrossRef]
  50. Abbott, D.A.; Van Den Brink, J.; Minneboo, I.M.; Pronk, J.T.; Van Maris, A.J. Anaerobic homolactate fermentation with Saccharomyces cerevisiae results in depletion of ATP and impaired metabolic activity. FEMS Yeast Res. 2009, 9, 349–357. [Google Scholar] [CrossRef]
  51. Postmus, J.; Canelas, A.B.; Bouwman, J.; Bakker, B.M.; van Gulik, W.; de Mattos, M.J.T.; Brul, S.; Smits, G.J. Quantitative analysis of the high temperature-induced glycolytic flux increase in Saccharomyces cerevisiae reveals dominant metabolic regulation. J. Biol. Chem. 2008, 283, 23524–23532. [Google Scholar] [CrossRef] [PubMed]
  52. François, J.; Villanueva, M.E.; Hers, H.G. The control of glycogen metabolism in yeast: 1. Interconversion in vivo of glycogen synthase and glycogen phosphorylase induced by glucose, a nitrogen source or uncouplers. Eur. J. Biochem. 1988, 174, 551–559. [Google Scholar] [CrossRef] [PubMed]
  53. Noventa-Jordão, M.A.; de Lourdes, M.; Polizeli, T.M.; Beatriz; Bonini, M.; Jorge, J.A.; Terenzi, H.F. Effects of temperature shifts on the activities of Neurospora crassa glycogen synthase, glycogen phosphorylase and trehalose-6-phosphate synthase. FEBS Lett. 1996, 378, 32–36. [Google Scholar] [CrossRef] [PubMed]
  54. Lip, K.Y.F.; García-Ríos, E.; Costa, C.E.; Guillamón, J.M.; Domingues, L.; Teixeira, J.; van Gulik, W.M.J.B.R. Selection and subsequent physiological characterization of industrial Saccharomyces cerevisiae strains during continuous growth at sub- and- supra optimal temperatures. Biotechnol. Rep. 2020, 26, e00462. [Google Scholar] [CrossRef]
  55. Furukawa, K.; Heinzle, E.; Dunn, I. Influence of oxygen on the growth of Saccharomyces cerevisiae in continuous culture. Biotechnol. Bioeng. 1983, 25, 2293–2317. [Google Scholar] [CrossRef] [PubMed]
  56. Dephilippis, R.; Sili, C.; Vincenzini, M. Glycogen and Poly-Beta-Hydroxybutyrate Synthesis in Spirulina-Maxima. J. Gen. Microbiol. 1992, 138, 1623–1628. [Google Scholar] [CrossRef]
  57. Yao, C.H.; Ai, J.N.; Cao, X.P.; Xue, S.; Zhang, W. Enhancing starch production of a marine green microalga through nutrient limitation. Bioresour. Technol. 2012, 118, 438–444. [Google Scholar] [CrossRef]
  58. Aikawa, S.; Nishida, A.; Ho, S.H.; Chang, J.S.; Hasunuma, T.; Kondo, A. Glycogen production for biofuels by the euryhaline cyanobacteria Synechococcus sp. strain PCC 7002 from an oceanic environment. Biotechnol. Biofuels 2014, 7, 88. [Google Scholar] [CrossRef]
Figure 1. Results of fermentation with varying initial glucose concentrations in Saccharomyces cerevisiae CEY1. (a) Dry cell weight, (b) Specific growth rate, (c) Specific glycogen production rate, and (d) Glycogen yield. The ΔDCW (dry cell wight, g/L) denotes the difference in DCW between the initiation and exhaustion of each carbon source (glucose or ethanol). In panels (a,c), the black bar strictly indicates values in the glucose phase, while the gray bar represents values strictly during the ethanol consumption phase. The error bars indicate the standard deviation.
Fermentation 10 00388 g001
Figure 2. Results of fermentation using mixed sugar (maltose syrup) in S. cerevisiae CEY1. (a) Fermentation profiles and (b) Specific glycogen production rate (g-glycogen/g-cell/h). Two independent fermentation experiments were conducted, and the error was less than 1% RSD (relative standard deviation).
Fermentation 10 00388 g002
Figure 3. Results of the effect of the type of media (i), temperature (ii), and the initial ethanol concentration (iii) on glycogen production in S. cerevisiae CEY1. (a) Specific growth rate, (b) Specific glycogen production rate, and (c) Glycogen yield. The error bars indicate the standard deviation.
Fermentation 10 00388 g003
Table 1. Cell growth, time for glucose consumption, and ethanol production at each initial ethanol concentration. Measurements of cell growth and ethanol production were conducted using samples collected upon the depletion of glucose.
Initial Ethanol
Concentration (g/L)
Dry Cell Weight (g/L)Glucose Consumption Time (h)Ethanol Production (g/L)
03.6681018.9
103.9761012.3
205.012145.8
305.37618−4.5
Table 2. Effect of varying aeration parameters on glycogen production in S. cerevisiae CEY1.
Aeration (vvm)Specific Growth Rate (/h)Specific Glycogen Production Rate
(g-glycogen/g-cell/h)
Glycogen Yield
(g-glycogen/g-glucose)
30.427 ± 0.0050.199 ± 0.0150.456 ± 0.061
10.354 ± 0.0030.164 ± 0.0020.403 ± 0.002
00.337 ± 0.0190.174 ± 0.0040.258 ± 0.007
anaerobic0.137 ± 0.0020.193 ± 0.0010.278 ± 0.004
Values: mean ± standard deviation.
Table 3. Comparison of glycogen production using microorganisms.
SpeciesGlycogen Content
(% of Dry Cell Weight)
Carbon SourceTiter (g/L)Ref.
Arthrospira maxima SOSA 1870.0200 mM HCO30.91[56]
Tetraselmis subcordiformis47.83% CO22.7[57]
Synechococcus sp. PCC 700249.82% CO23.5[58]
751% CO23.7[35]
S. cerevisiae CEY169.1120 g/L Glucose11.8 *This study
* Glycogen concentration was calculated based on the amount produced during glucose consumption.
Disclaimer/Publisher’s Note: The statements, opinions and data contained in all publications are solely those of the individual author(s) and contributor(s) and not of MDPI and/or the editor(s). MDPI and/or the editor(s) disclaim responsibility for any injury to people or property resulting from any ideas, methods, instructions or products referred to in the content.

