Abstract
This study aimed to evaluate the sulfur hexafluoride (SF6) tracer technique for estimating methane (CH4) emissions in dual-flow continuous culture systems (DFCCS). In experiment 1 (Exp1), fermenters were filled with water, and known CH4 concentrations (0, 1.35, 2.93, or 4.43 g/d) were injected using permeation tubes with SF6 release rates (3.30 or 9.65 mg/d). Headspace gas was collected using canisters, and the SF6 technique estimated CH4 recovery. Experiment 2 (Exp2) involved a DFCCS fermentation trial with ruminal fluid from three Holstein cows, testing diets with soybean meal or its partial replacement (50%) by Chlorella or Spirulina. Headspace gas was collected at intervals post-feeding. Standard curves for SF6 and CH4 quantification were inadequate for DFCCS samples, with the CH4:SF6 ratio differing from standards, indicating the data needs further SF6 release rate evaluation. In Exp1, a high correlation (r = 0.97) was found between infused and calculated CH4, indicating good repeatability. Low and high SF6 rates performed similarly at low CH4 infusion, but high SF6 overestimated CH4 at high infusion. Exp2 showed CH4 emissions irrespective of SF6 rate and indicated reduced CH4 emissions and increased NDF degradation with algae-containing diets. Further evaluation of the SF6 tracer technique is warranted for DFCCS.
1. Introduction
The 6th assessment from the Intergovernmental Panel on Climate Change reported that global greenhouse gas emission continues to rise [1]. Agriculture, forestry, and the land use sector is the second greatest contributor, accounting for 22% of total emissions. Among its sub-sectors, livestock production, particularly ruminant production, is one of the largest anthropogenic greenhouse gas contributors, responsible for 22.7% of the total greenhouse gas in this category. Given these numbers and increased societal negative perception of ruminant production, efforts have been made with the goal of reducing the enteric CH4 emissions from ruminant production [2]. Nonetheless, ruminants may lose 2–12% of the overall gross energy consumed because of the synthesis of ruminal CH4 [3,4].
To develop strategies to mitigate enteric CH4 production, a reliable technique is required to quantify CH4 emissions. Several techniques are available to estimate CH4 emission from ruminants, including enclosed techniques (e.g., respiration calorimetry), prediction equations, isotopic tracer techniques, and the use of inert tracer gas (e.g., sulfur hexafluoride [SF6]) techniques [5]. Some of these techniques are costly, labor-intensive, and may limit the number of animals feasible to be used [6]. To address these issues, the SF6 tracer technique was developed [7], proving to be a reliable method for in vivo measurement of CH4 production [8,9].
Another challenge in animal production research is related to the use of animals in research. According to the National Research Council [10], laboratories and research institutes must apply the 3Rs alternatives—replacement, reduction, and refinement—which guide researchers to optimize animal use in research. Consequently, several alternative methods have been developed to minimize animal use, notably in vitro methodologies. Although not capable of fully replacing the use of animals, it offers additional capabilities to maximize data collection that are complimentary to in vivo assessments. In the context of evaluating ruminal metabolism and enteric CH4 production, numerous in vitro techniques have been developed [11].
These in vitro techniques can be classified into two main classes: batch culture and continuous culture (CC), and both are focused on evaluating the endpoint degradation of nutrients and fermentation kinetics. While batch culture is a technique that does not permit media renewal, CC does, supporting microbial adaptation to the system and offering a more robust approach. In a meta-analysis carried out by our research group [12], it has been demonstrated that the dual-flow continuous culture system (DFCCS) is effective in depicting the treatment effects on ruminal nutrient degradability and microbial protein synthesis efficiency when compared to in vivo omasal sampling, and is considered a reliable method to evaluate ruminal fermentation. A critical factor in the DFCCS is measuring gas production, specifically CH4, due to the non-hermetic nature of most of the DFCCS. Wenner et al. [13] reported a method to estimate CH4 production from DFCCS; however, such a technique requires the utilization of sensors that are costly and require the DFCCS to be hermetically closed.
Because measuring CH4 is a pressing global issue, most DFCCS, which are robust in vitro systems, are not equipped for reliably measuring CH4, and the SF6 tracer technique is widely used in vivo. The adaptation of the SF6 tracer technique to DFCCS would expand the ability of researchers to reliably measure CH4 in ways that better represent in vivo conditions.
To the best of our knowledge, this study is the first attempt to evaluate the SF6 tracer technique to estimate CH4 production within in vitro systems. Thus, the objective of the current assessment was to evaluate the SF6 tracer technique to estimate enteric CH4 production using a DFCCS and to investigate the effects of levels of SF6 release rates and CH4 recovery/production. To achieve such goals, two experiments were conducted. In experiment 1, known quantities of CH4 were injected into the fermenters, and two levels of SF6 release were used to estimate CH4 recovery. In experiment 2, CH4 emissions were determined using SF6 when a typical dairy diet was provided. It was hypothesized that the SF6 tracer technique is a suitable method to estimate CH4 production in DFCCS, regardless of the SF6 release rate.
2. Materials and Methods
The estimation of enteric CH4 was carried out using the SF6 tracer technique, described by Johnson et al. [7] and Jonker and Waghorn [9], then adapted to a DFCCS. To test the utilization of SF6 to estimate CH4 in a DFCCS, a pretrial and a fermentation trial were performed. For the scope of this article, we are going to refer to the experiments as experiment 1 (Exp1) and 2 (Exp2), respectively. The collection of ruminal inoculum from ruminally cannulated cows used in Exp2 was performed in accordance with guidelines from the Institutional Animal Care and Use Committee of the University of Florida.
2.1. Experiment 1—Experimental Design
A DFCCS with eight fermenters (experimental units) containing only deionized water instead of ruminal content was used. In addition, artificial saliva injection was replaced with deionized water to avoid any confounding effects. The system was set up with only deionized water to prevent any fermentation and intrinsic CH4 production, which enabled us to carry out a recovery test with known CH4 concentrations. The experimental design was a split-plot, where the whole plot was considered a group of 4 fermenters, and the subplot was an individual fermenter within each plot. The first experimental factor (randomly applied to the whole plot) was the SF6 release rate, composed of a low (3.30 ± 0.73 mg/d) or a high (9.65 ± 0.59 mg/d) release rate. The second experimental factor (randomly applied to the subplot) was the level of CH4 injection (0, 1.35 ± 0.13, 2.93 ± 0.35, or 4.43 ± 0.25 g/d) to simulate an increasing level of methanogenesis. Levels of CH4 injection were based on recent literature values [14,15,16] that reported CH4 emissions of up to 49 mL/g of DMI. In order to cover a wide range of possible CH4 emissions, the highest levels were designed to mimic a CH4 emission of 60 mL of CH4/g of DMI. The experiment was conducted over two 5 d periods, including a 2 d of adaptation followed by 3 d of gas collection. Crossover of the first treatment factor was applied to the whole plot in the second experimental period, and the treatments applied to the subplot were randomly assigned within each main plot.
The gas injected into the fermenters was acquired from Gasco®, providing a 99.999% CH4 purity level (MEUHPA16, Oldsmar, FL, USA). Regulation of gas release was achieved through the utilization of a central gas regulator (Model 90005520, Portagas®, Pasadena, TX, USA) connected to a central pipe, which enables individual connecting pipes equipped with 2-way flow control valves to supply the correct amount of CH4 into each individual fermenter (Figure 1). To ensure that the CH4 infusion rate was adequate, CH4 flow checking was carried out daily for each fermenter at 0800, 1100, 1300, and 1600 h using a manual bubble flowmeter (20562, MilliporeSigma, St. Louis, MO, USA), resulting in continuous release rates of approximately 0, 1.5, 3.0, and 4.5 mL/min according to the experimental treatments. Any necessary CH4 flow adjustments to assure accuracy were made accordingly.
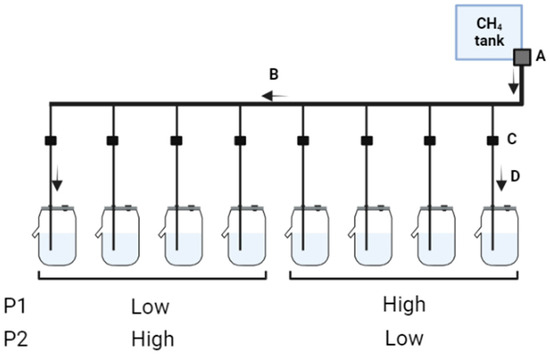
Figure 1.
Schematic representation of CH4 infusion system. A—the central gas regulator that is responsible for the regulation of CH4 infusion from the gas cylinder to the central pipe, B—the central pipe connects the gas regulator to each connecting pipe, C—2-way flow control valves responsible for the fine adjustments of CH4 flow into each fermenter, and D—individual connecting pipes that conduct CH4 flow from the central pipes into each fermenter. Fermenters were divided into two groups (main plots) before the first period (P1), and each group of fermenters received contrasting SF6 release rates. In the second period (P2) a treatment crossover of contrasting SF6 release rates was carried out.
2.2. Experiment 2—Experimental Design
Implementation of the SF6 tracer technique to estimate CH4 emissions in a DFCCS was applied in an experimental setting, in which a control diet with soybean meal (SBM) as the main source of protein and two other diets containing the partial replacement of the SBM with algal biomass were tested. Algal biomass was derived from either Chlorella pyrenoidosa (CHL) or Spirulina platensis (SPI) species, and the experiment was carried out in a split-plot design, where the main plot was the SF6 release rate (3.30 ± 0.73 or 9.65 ± 0.59 mg/d) and the split-plot was arranged into a 3 × 3 Latin square design, with 3 treatments and 3 fermentation periods, comprised of 7 d of adaptation followed by 3 d of gas collection. Dietary treatments contained (all in DM basis) 16.0 ± 0.10% crude protein, 2.50 ± 0.11% ether extract, 34.9 ± 0.65% NDF, 18.6 ± 0.10% ADF, 31.0 ± 0.17% starch, and 1.78 ± 0.01 Mcal/kg net energy for lactation, detailed information about the ingredient and diets composition and algae sources can be found in the companion manuscript [17]. The algae inclusion rates were based on our previous studies [17,18]. The SF6 permeation tubes utilized for Exp2 were identical to the ones used on Exp1; however, each permeation tube was randomly assigned to each fermenter, while the same permeation tube was kept on the selected fermenter across the experimental periods.
Three ruminally cannulated lactating Holstein dairy cows were used to serve as ruminal content donors. The cows were situated at the Dairy Research Unit of the University of Florida in a free-stall barn alongside the rest of the herd, receiving a total mixed ratio containing 50% corn silage. On the first day of each experimental period, the ruminal content was collected from the cows 2 h after the morning feeding, filtered through 4 layers of cheesecloth, and stored in a prewarmed thermos. The inoculum was transported within 30 min of the collection to the laboratory and incubated into the prewarmed DFCCS. All procedures and analytical methods used for Experiment 2 are described in our companion paper [17]. Briefly, for the analysis of nutrient degradability, 24 h effluents from day 8 to 10 were collected, and a subsample was freeze-dried. Feed and dried effluent samples were analyzed for DM, OM, and NDF, and the degradability of these nutrients was calculated from the difference in input and output from the fermenters.
2.3. SF6 Permeation Tube Preparation and Collection Canister
The permeation tubes and the canisters used for the collection during Exp1 were previously described by Henry et al. [19]. Briefly, permeation tubes consisted of brass tube bodies (volume = 1.86 mL), nylon washers, and a Teflon membrane, secured with a porous (2-μm porosity) stainless steel frit and a brass nut. Permeation tubes were filled with ~2.3 g of SF6, kept at 39 °C, and weighed 12 times within 38 d for determination of SF6 release rate. To select contrasting release rates of SF6, a batch of 50 permeation tubes was prepared, and their release rate was characterized at 38 d, as described earlier. From this batch, 8 permeation tubes with high or low release rates were selected for the current study.
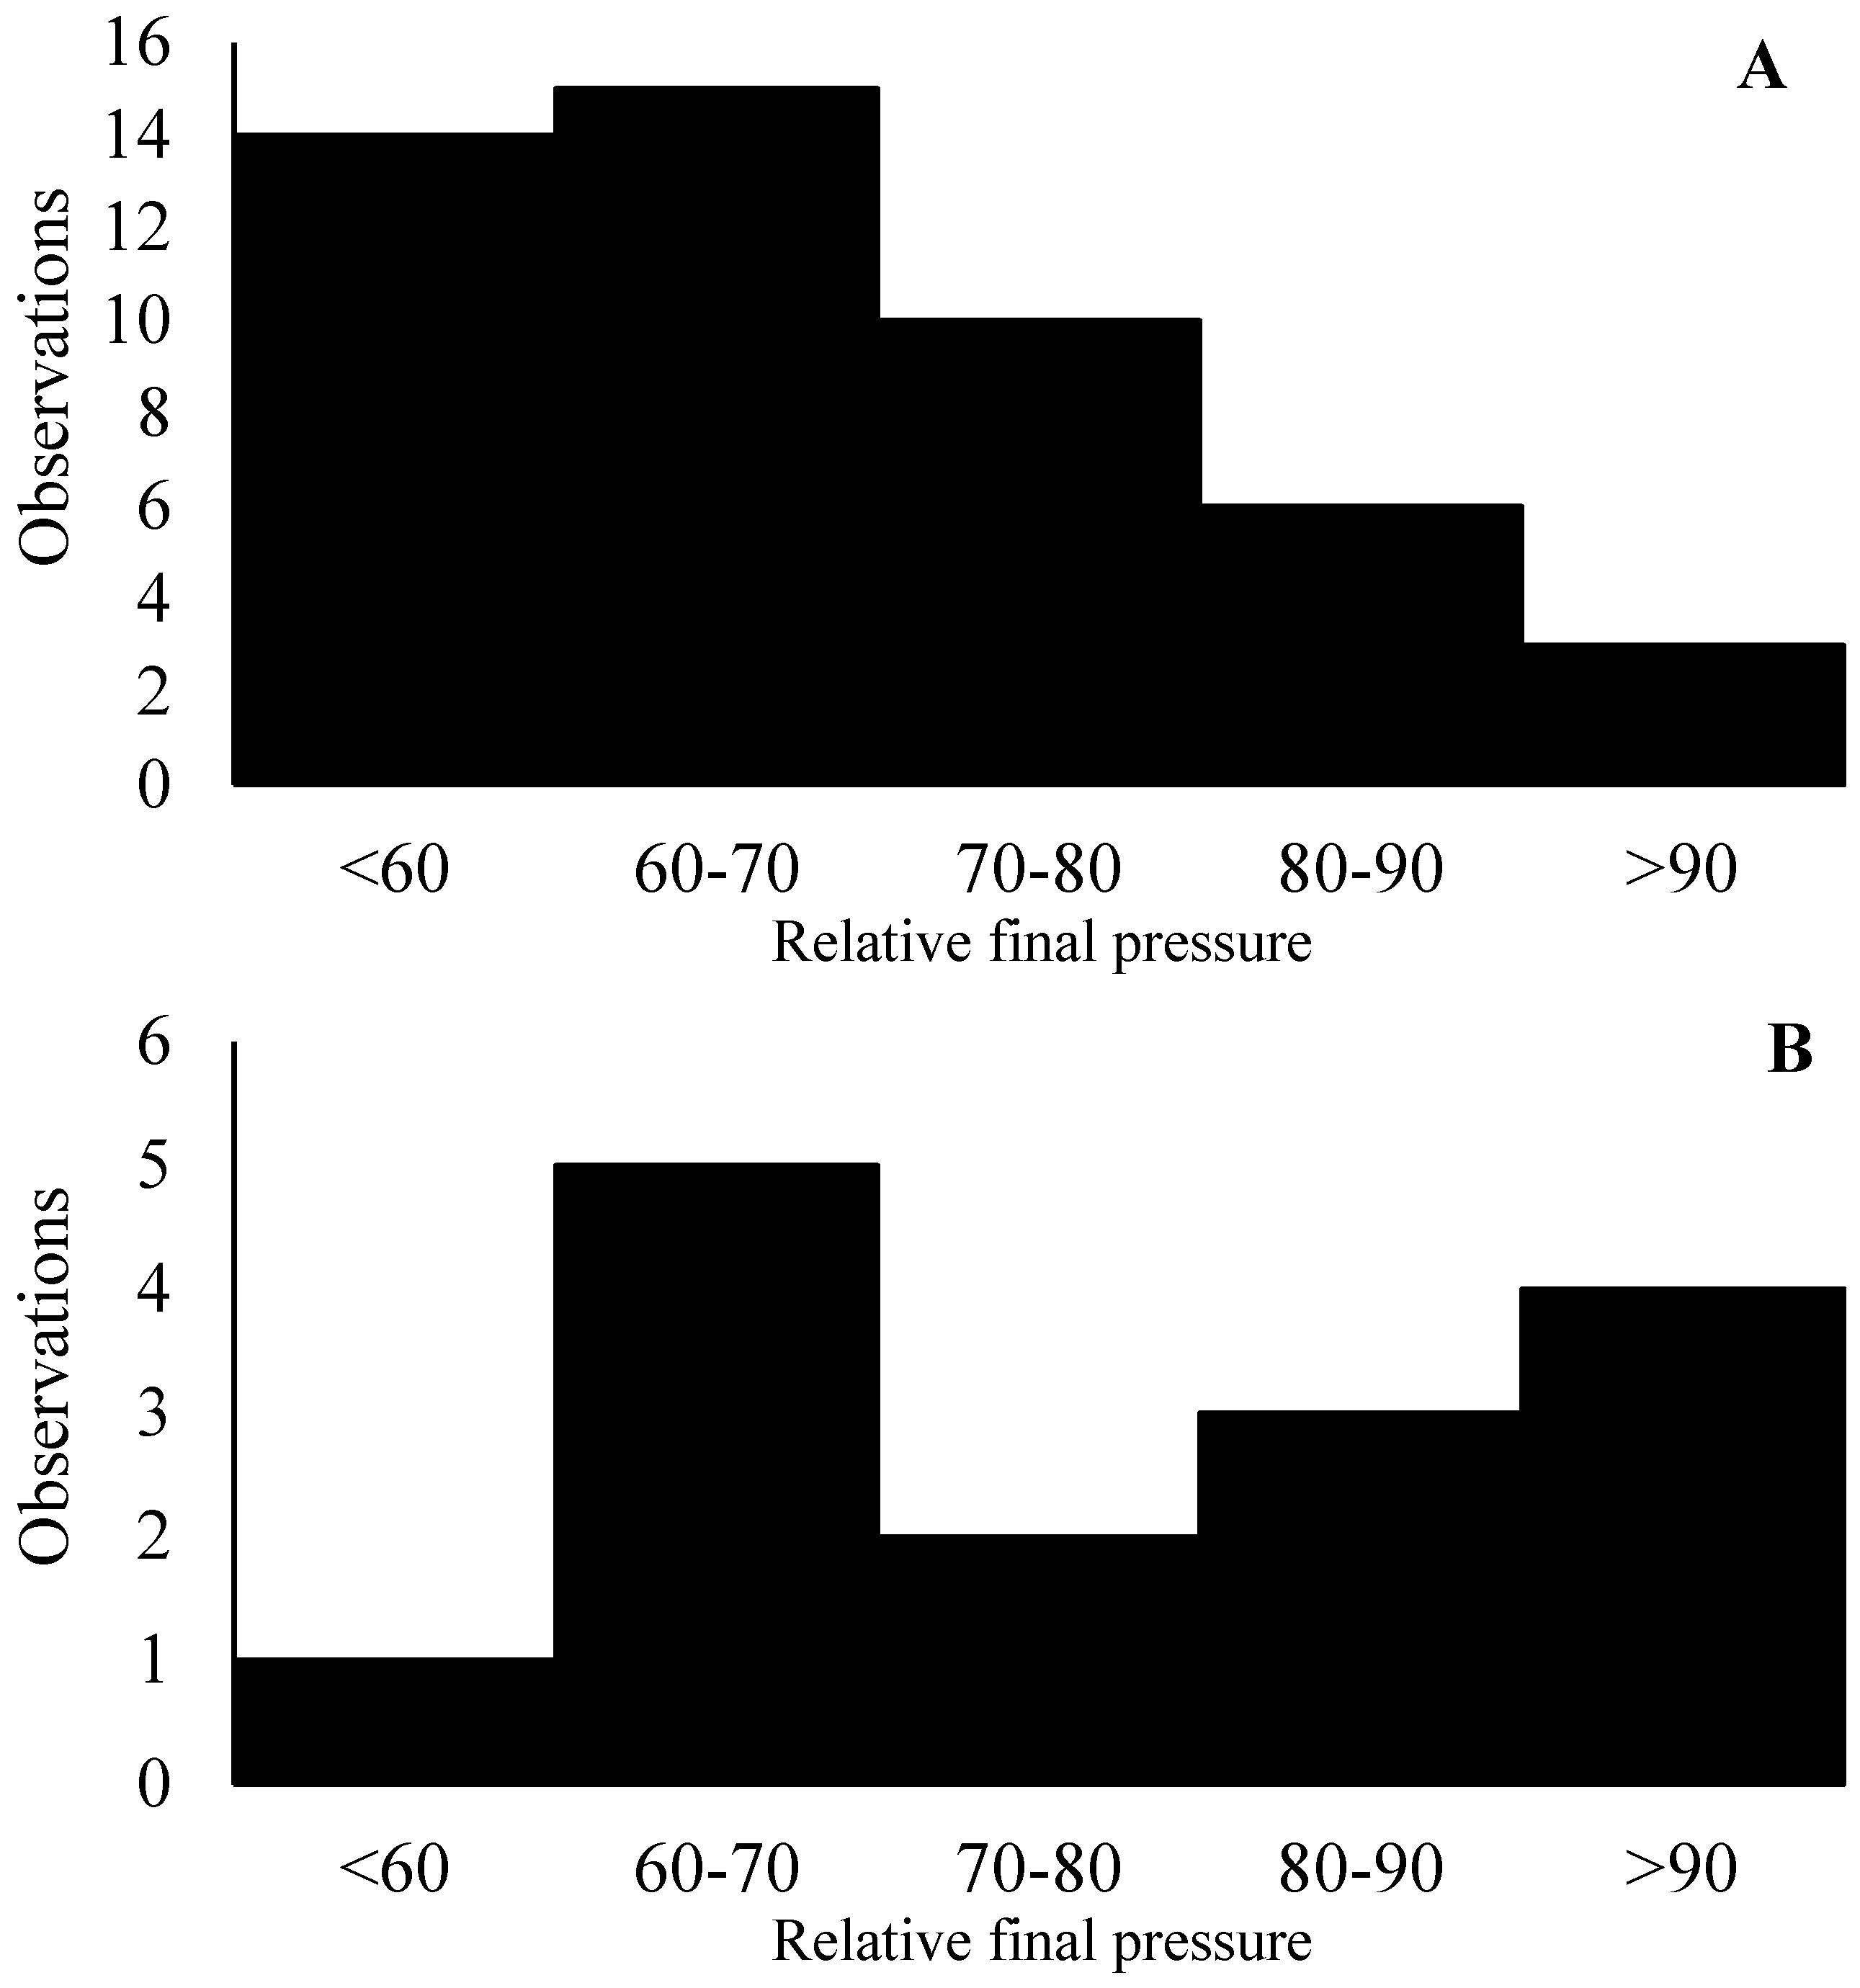
During Exp1 (deionized water only), gas collection canisters were used. The equipment was constructed of polyvinyl chloride pipe to have a final volume of 2 L. Samples were collected by evacuating the collection canisters to 68.6 cm of Hg and connecting the canister to the lid of the fermenters, which were equipped with a crimped capillary tube that was positioned to sample directly from the top of the headspace of the fermenter. The volume of the collection canisters and the crimped capillary tubes were designed to allow half of the vacuum to remain after 24 h. Following detachment from the fermenters, the canister was pressurized with nitrogen to one atmosphere, and then, a 50 mL gas sample was collected and stored in hermetically sealed and previously evacuated 125 mL glass bottles [20]. Among the 48 observations during Exp1, more than 60% had the canisters’ relative final pressure ranging between 50 and 70% of the initial pressure, which is in line with previous observations in the DiLorenzo lab (Figure 2A). Approximately 18% of the observations exceeded 80% of the initial pressure, which could indicate a clog in the collection system during the day.
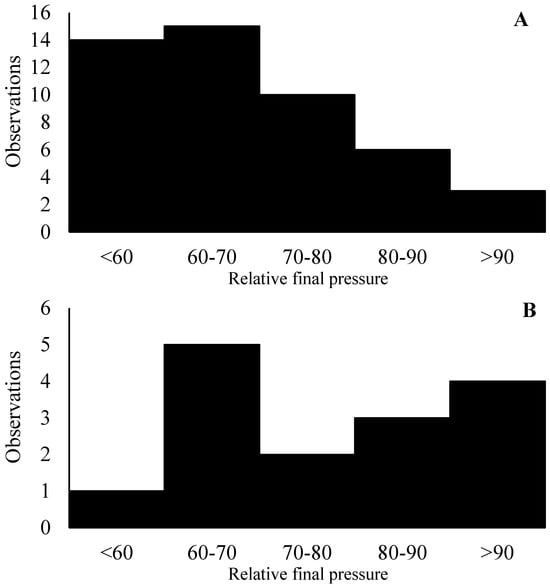
Figure 2.
Distribution of the relative final pressure of the canisters during experiments 1 (n = 48) and 2 (n = 16). The X-axis represents the distribution of the relative final pressure of canisters. The Y-axis represents the number of observations.
During Exp2, the rate of clogged collection systems (relative pressure greater than 80%) was much greater, almost 50% (Figure 2B), during collection d 1 and 2 of the first period. Aiming to minimize such issues, starting from collection d 3 onwards, a gas spot sampling directly from the headspace of the fermenters was performed. The lid of the fermenters had two open holes that were closed with a rubber stopper, one of which was used to introduce substrate into the fermenter and the second for gas spot sampling. The rubber stopper had a 0.5 cm diameter hole in the center, which allowed access to the headspace without completely opening the fermenter or removing the rubber stopper. Prior to any ruminal fluid collection from the fermenter or opening the feeding system, a needle connected to a 50 mL syringe was placed into the rubber stopper’s hole, and a sample of the headspace gas was collected after gently mixing the headspace gas by hermetically pumping out and in the headspace gas three times. Six 10 mL spot gas samples were collected daily and pooled into hermetically closed and previously evacuated 125 mL glass bottles. This change in collection protocol due to clogging issues indicates that the use of canisters similar to the ones used in in vivo experiments might not be adequate for our application, and further research on this matter is warranted.
2.4. Dual-Flow Continuous Culture System
The experiment was carried out in a DFCCS, similar to the one developed by Hoover et al. [21], and used in recent studies in our current laboratory [22,23,24], in which a schematic representation is shown in Figure 3. The fermenter bases were manufactured at the Ohio State University and described in Wenner et al. [25]. The fermenter setup consisted of a glass jar measuring 15 cm in width, 22 cm in height, and 0.5 cm in glass thickness (approximately 1800 mL volume). The circular steel lid of the jars has a diameter of 15 cm with multiple apertures to accommodate the central mixer, liquid outflow filter, temperature sensor, heater, artificial saliva infuser, and two nitrogen infusers, one releasing nitrogen gas into the liquid phase at the bottom of the jar, while the other releases the nitrogen into the headspace of the jar.

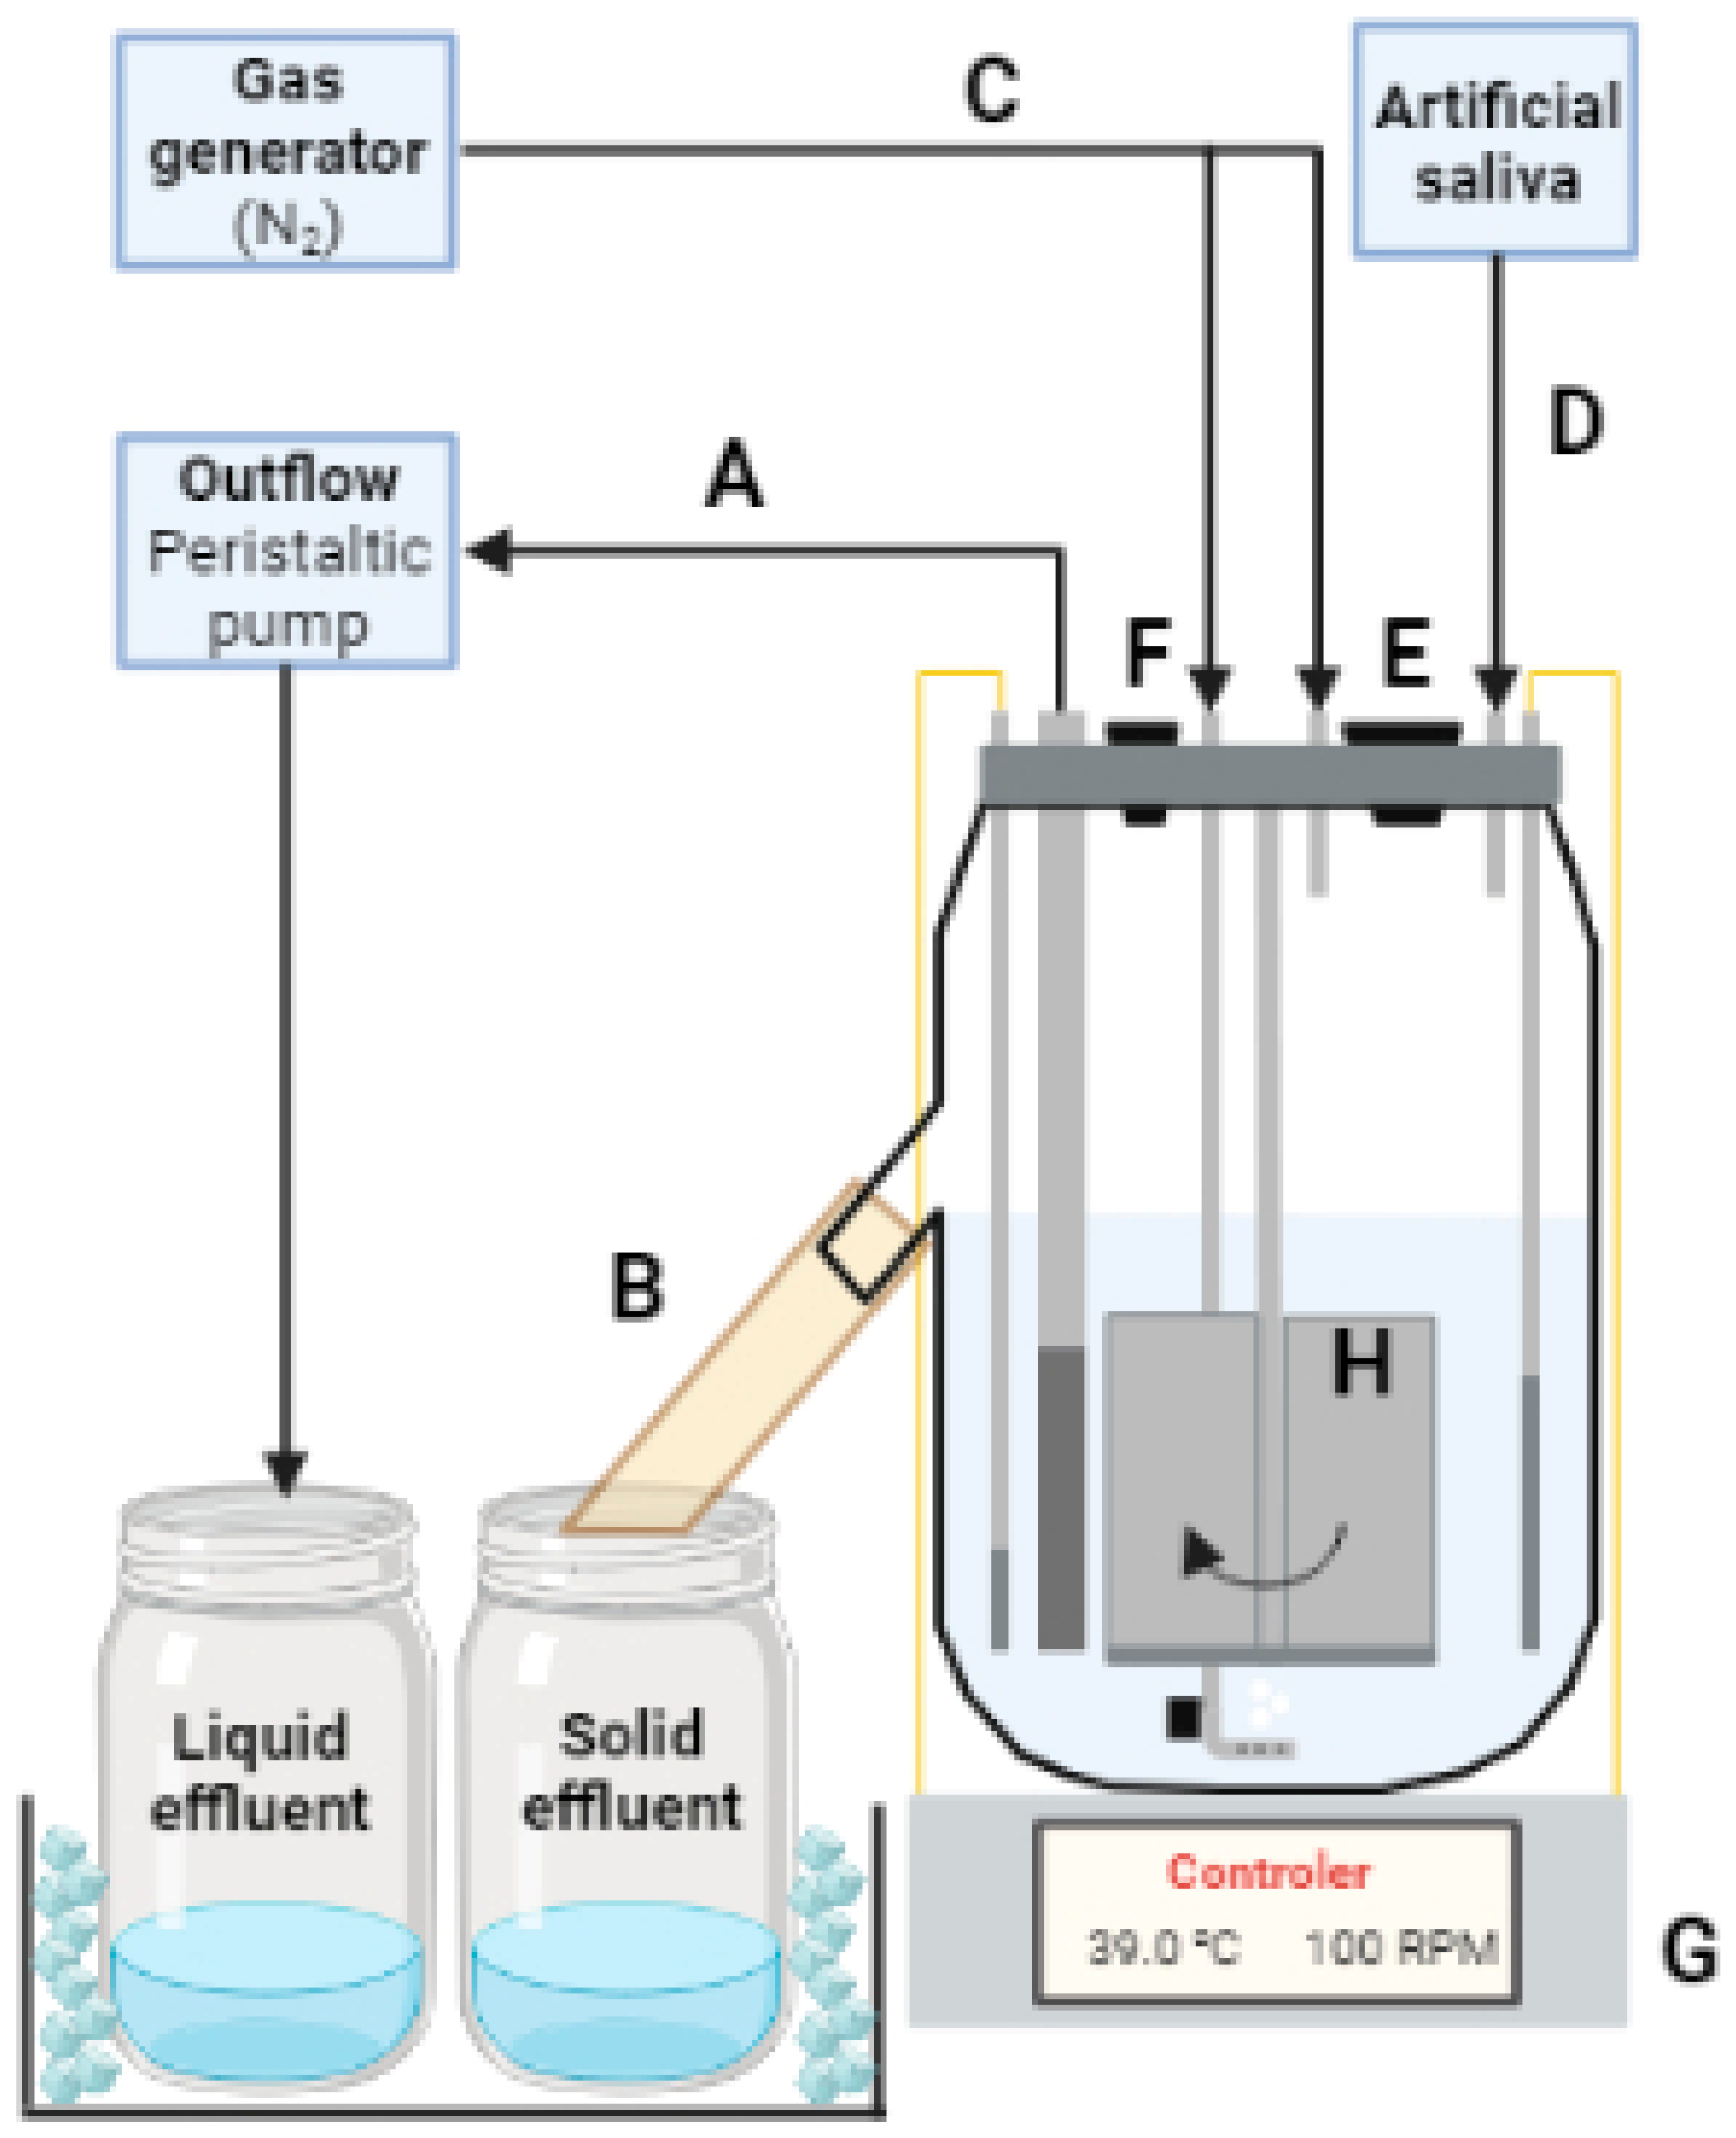
Figure 3.
Schematic representation of the Department of Animal Sciences, University of Florida, dual-flow continuous culture system. A—liquid outflow effluent that passes through the 1 mm pore-size stainless steel mesh is pumped out of the fermenter by a peristaltic pump and stored into a container immersed in a cold-water bath; B—liquid and solid particles that are not pumped out by the peristaltic pump can leave the fermenters by flowing out through the solid outflow; C—gas generator pumps nitrogen gas into the fermenters (headspace and liquid phase) to keep the anaerobiosis within the fermenters; D—artificial saliva is stored in a container and is pumped into the fermenters at a rate of 3 mL/min; E—opening for feeding of the fermenters; F—opening for additional collections, for instance, this opening was used for collection of headspace gas sample during experiment 2; G—base of the fermenter that contains the temperature controller and is responsible for the temperature maintenance, in additional, a magnetic stirrer device is located in the base of the fermenter, which propels the central mixer (H) at a set rotation.
The central mixer consists of a 20 cm central steel bar equipped with 4 flat acrylic blades attached to the bottom, measuring 10 cm in height and 3 cm in width each, and a magnet that is responsible for the stirring action of the equipment. At the base of the fermenters, a magnetic stirrer device is located, which propels the central mixer, and a rotation controller is also present, which allows agitation of the fermenter’s content at 100 rotations per minute. In addition, in the base of the fermenters, a temperature controller is present, which is attached to an immersible temperature sensor and heater. The temperature sensor is responsible for detecting the current temperature of the liquid fraction inside the jar; the controller located in the base of the fermenter will then turn on or off the heater to increase or decrease the temperature of the liquid according to a pre-determined setting (39 °C).
To keep the anaerobic environment within the jar, two nitrogen gas apparatuses were attached to the lid of the fermenters, maintaining pressure inside of the jar to inhibit atmospheric oxygen from entering the jar. Each nitrogen infuser continuously releases 300 mL of nitrogen gas into the headspace and liquid phase. The artificial saliva injector is an apparatus also located on the lid of the fermenter. The saliva is stored in a 50 L tank and individually transferred to each fermenter at a rate of 3 mL/min by a peristaltic pump.
The lid also has a liquid outflow apparatus composed of an 18 cm long and 1 cm diameter polyvinyl chloride pipe. In the 1/3 bottom (6 cm) of the pipe, 4 transversal lines of 0.5 cm wholes were placed and covered with a 1 mm pore-size stainless steel mesh. This design allows the retention of solid particles (that cannot pass through the mesh) within the jar, enabling the liquid fraction (that can pass through the mesh) to flow into the liquid effluent container at a rate of 1.7 mL/min. Additionally, a 2 cm diameter opening is positioned 11 cm from the bottom of the jar, facilitating the collection of solid fractions into a separated solid effluent container. Both effluent containers are maintained in a cold-water bath at 4 °C. The solid passage rate is regulated by the difference between the inlet of artificial saliva and feed, subtracted from the liquid outflow.
2.5. CH4 and SF6 Analyses
To address the high concentration of CH4 and SF6 from the collected samples, a serial dilution with N2 gas using a 50 mL syringe to achieve a dilution of 1:150 and 1:2000 (v:v) was carried out for Exp1 and Exp2, respectively. Subsequently, CH4 and SF6 concentrations were analyzed by gas chromatography (Trace 1310 Gas Chromatograph, Thermo Scientific, Waltham, MA, USA). The analysis involved different detection techniques utilizing a flame ionization detector for CH4 and an electron capture detector for SF6 analysis. A capillary column (HayeSep Q and Porapak Q 0.5 m × 2.0 mm, 80/100, SilcoSteel, Restek Corp., Centre County, Bellefonte, PA, USA) facilitated the separation process. Injector, column, and detector temperatures for CH4 analysis were 80, 160, and 200 °C, respectively. For SF6, temperatures were 80, 60, and 250 °C for the injector, column, and detector, respectively. The carrier gas used for both CH4 and SF6 was N2. Three gas mix standards were used for the analyses. The concentration of CH4 and SF6 in the standards was 4.27, 50.7, and 101.4 ppm and 30.2, 110, and 518 ppt, respectively.
The emission of CH4 from fermenters in relation to the SF6 tracer gas captured in the samples was calculated according to Johnson et al. [7] following the equation:
where QCH4 is considered the CH4 emission per fermenter (mg/d), QSF6 is the SF6 release rate (mg/d), CH4 is the concentration of CH4 in the sample (ppm), and SF6 is the concentration of SF6 in the sample (ppt).
2.6. Statistical Analysis
Exp1 was conducted in a split-plot design where groups of fermenters (n = 2) were considered whole plots, and individual fermenters (n = 4) were considered subplots. In the first experimental period, the level of SF6 release was randomly assigned to the whole plot, and a crossover of treatments was carried out during the second period. Within each fermenters group (whole plot), the level of CH4 infusion was randomly assigned to individual fermenters within each experimental period. Normality of residuals and homogeneity of variance were examined after model fitting for each continuous dependent variable using the Shapiro–Wilk test from the UNIVARIATE procedure of SAS 9.4 (SAS Institute Inc., Cary, NC, USA), and maximum studentized residue of ±4 was allowed.
Pearson correlation between CH4 infusion and recovery was carried out using the Corr procedure of SAS 9.4. Statistical analysis of CH4 recovery was performed using a multiple regression approach from the MIXED procedure of SAS 9.4 using the backward elimination process. The final model was composited of the SF6 release as a categorical variable and CH4 infusion as a continuous predictor, using the model:
where Yijkl was the observation ijkl, µ was the overall mean, Di was the fixed effect of day of collection (i = 1–3), Sj was the fixed effect of SF6 release rate (j = 1–2), Ck was the continuous fixed effect of CH4 infusion (k = 1–4), Ck × Ck was the quadratic continuous fixed effect of CH4 infusion, Sj × Ck was the interaction fixed effect of SF6 release rate and the continuous fixed effect of CH4 infusion, Pl was the random effect of the experimental period (l = 1–2), and eijkl is the random residual.
Yijkl = µ + Di + Sj + Ck + Ck × Ck + Sj × Ck + Pl + eijkl
In addition, CH4 production and SF6 concentration were analyzed using both SF6 release and CH4 infusion as categorical variables using the model:
where Yijkl was the observation ijkl, µ was the overall mean, Di was the fixed effect of day of collection (i = 1–3), Sj was the fixed effect of SF6 release rate (j = 1–2), Ck was the categorical fixed effect of CH4 infusion (k = 1–4), Sj × Ck was the interaction fixed effect of SF6 release rate (j = 1–2) and the categorical fixed effect of CH4 infusion (k = 1–4), Pl was the random effect of the experimental period (l = 1–2), and eijkl was the random residual. Orthogonal contrasts were used to depict the effect of CH4 and SF6 release rate, where we conducted a contrast to evaluate the effects of SF6 release rate (Low vs. High) and the polynomial contrast to evaluate the linear and quadratic effect of CH4 release.
Yijkl = µ + Di + Sj + Ck + Sj × Ck + Pl + eijkl
Exp2 was conducted in a split-plot design, where the main plot was the SF6 release rate and the split-plot was arranged into a 3 × 3 Latin Square design, where the fermenter within the period was the experimental unit. Statistical analysis of the CH4 emission, yield per unit of degraded nutrient, and SF6 concentration were performed using the MIXED procedure of SAS 9.4, using the model:
where Yijkl was the observation ijkl, µ was the overall mean, Ti was the fixed effect of treatment (i = 1–3), Sj was the fixed effect of SF6 release rate (j = 1–2), Ti × Sj was the fixed effect of the interaction between treatment (i = 1–3) and SF6 release rate (j = 1–2), Dk was the random effect of day of collection (k = 1–3), Pl was the random effect of the period (l = 1–3), and eijkl was the random residual. Orthogonal contrasts were used to depict the treatment and SF6 release rate, where we conducted a contrast between low vs. high SF6 release rate, control vs. algae-containing feed, and CHL vs. SPI. To depict the interaction effect, contrasts between control vs. algae-containing feed and CHL vs. SPI were carried out at each level of the SF6 release rate. Significance was declared at p ≤ 0.05, and the tendency was declared at 0.05 < p ≤ 0.10 or 0.05 < p ≤ 0.20 for main and interaction effects, respectively.
Yijkl = µ + Ti + Sj + Ti × Sj + Dk + Pl + eijkl
3. Results
3.1. CH4 and SF6 Analyses
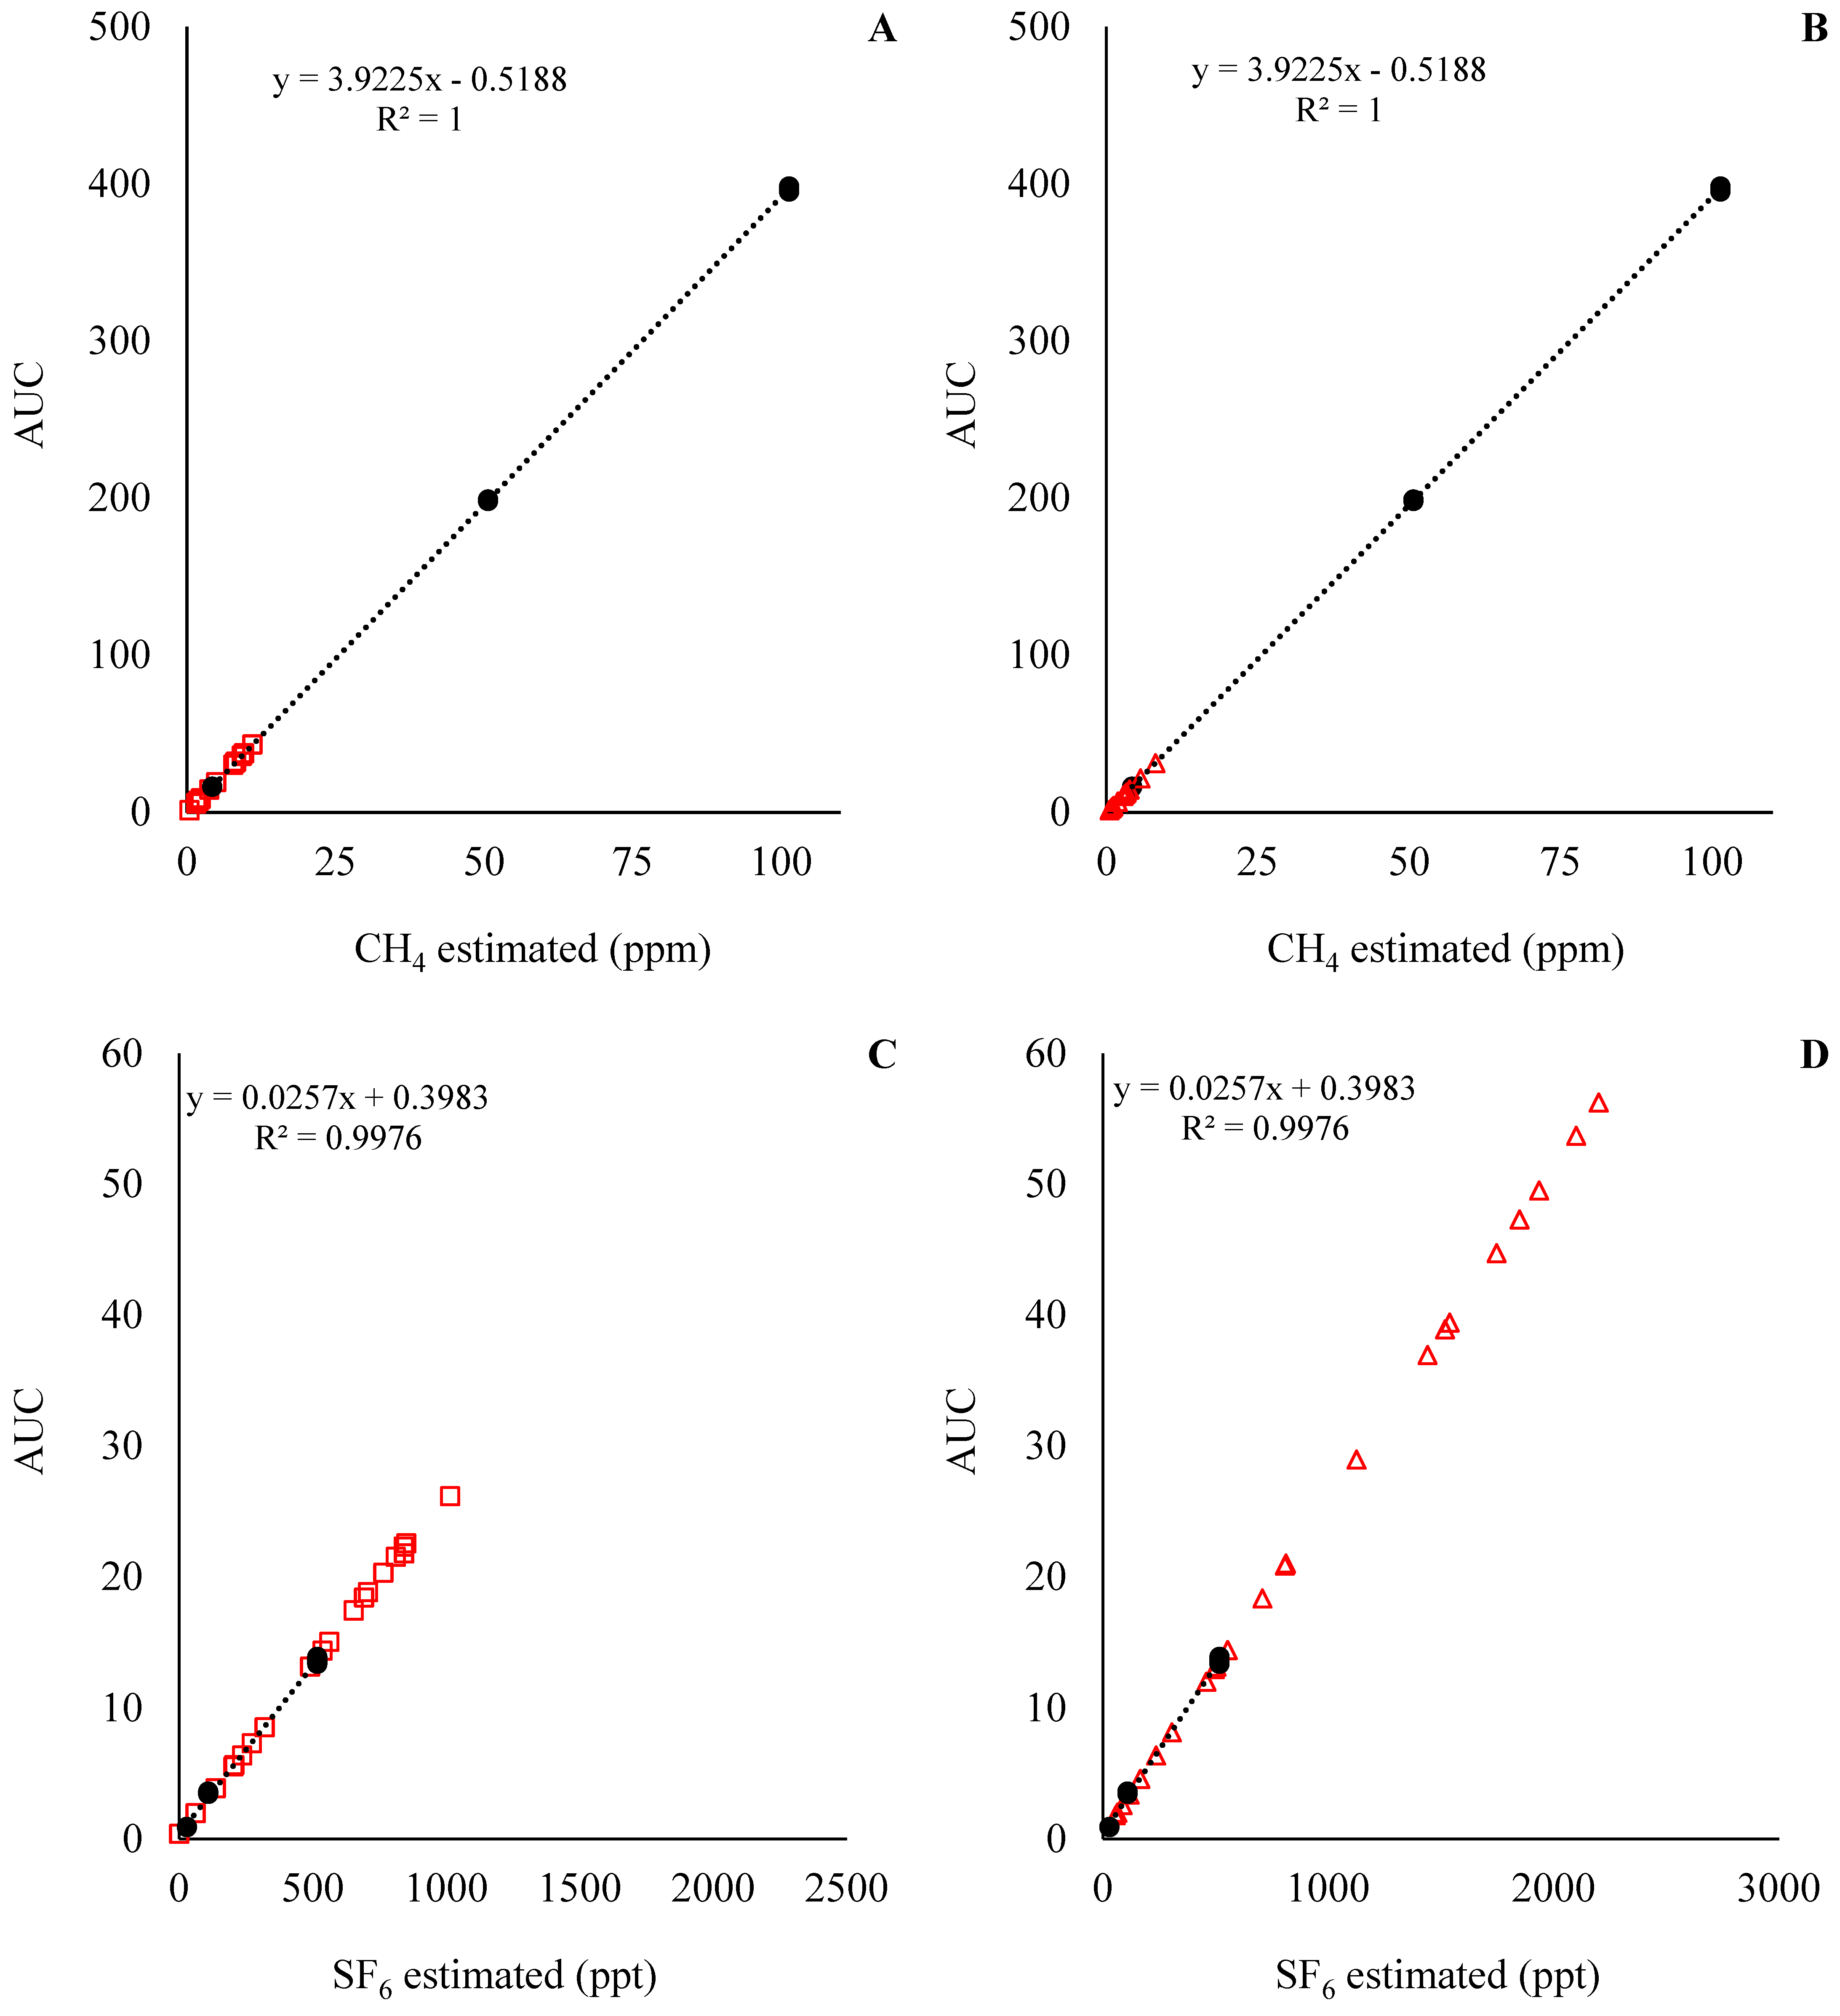
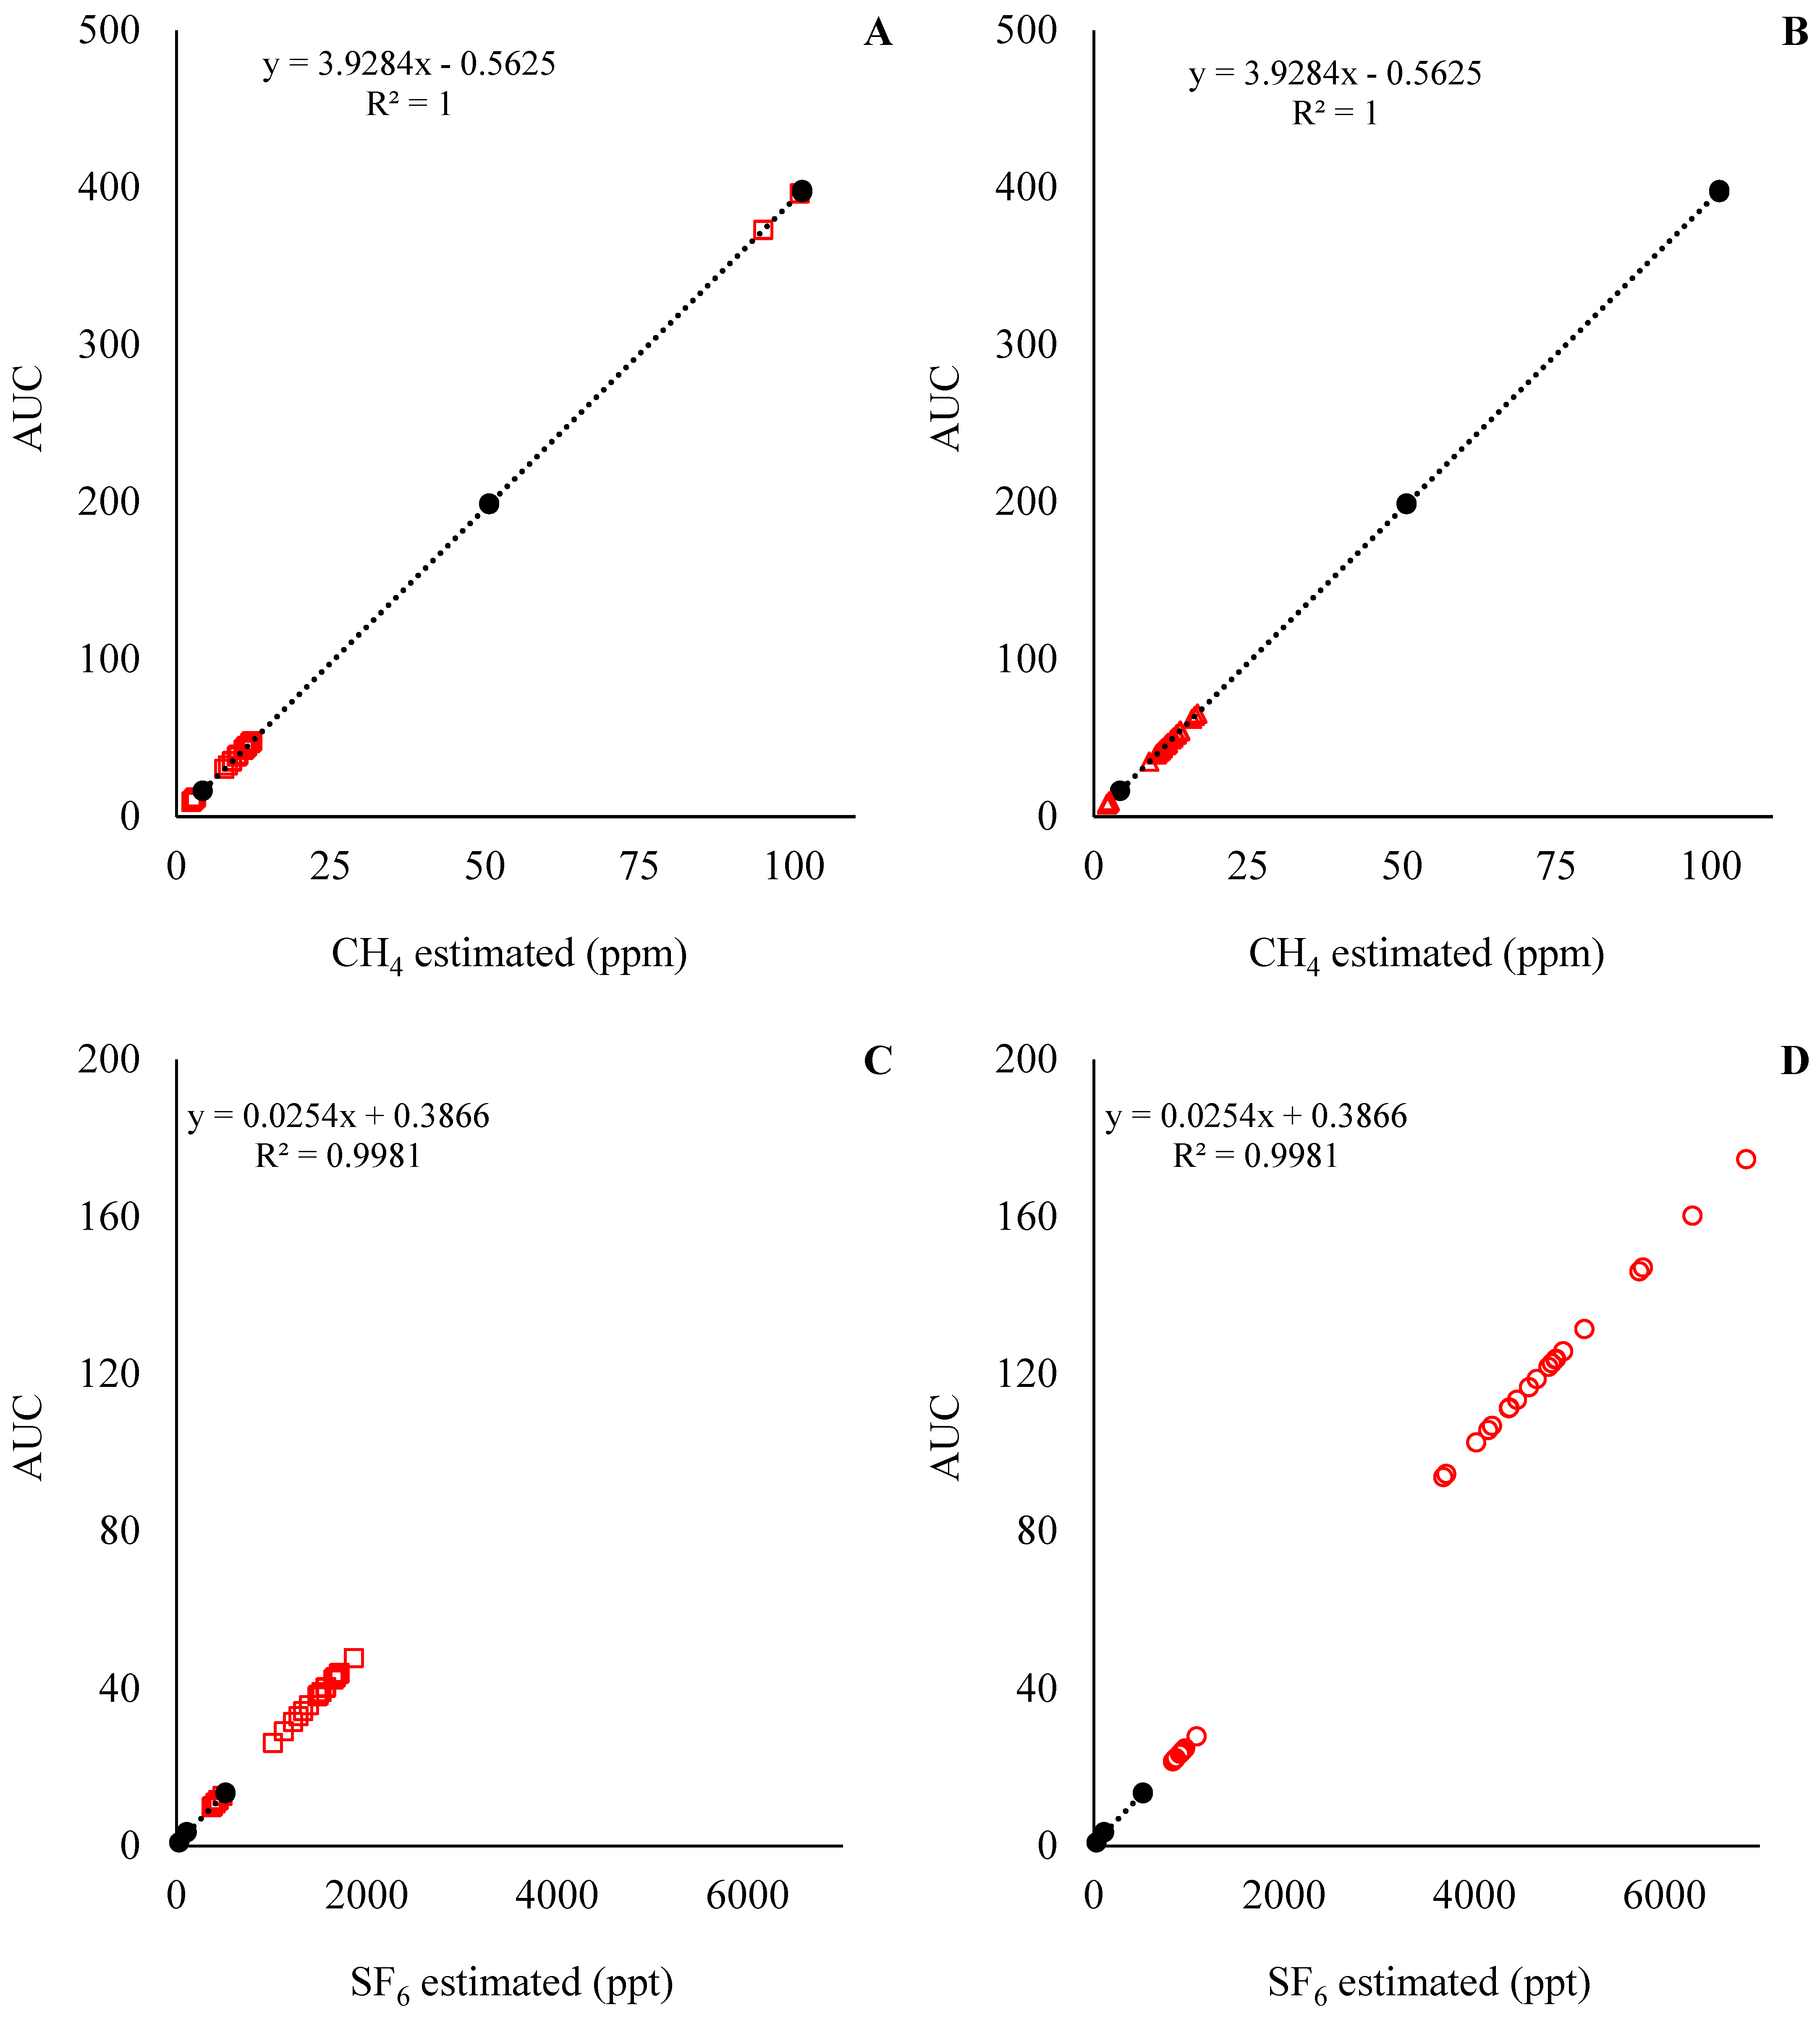
The standard curve for the predicted CH4 and SF6 concentrations for Exp1 and Exp2 are presented in Figure 4 and Figure 5, respectively. With the standard curves commonly used for the estimation of CH4 emissions in in vivo settings, the concentration of CH4 and SF6 was underestimated and overestimated, respectively. This means that during the analysis of the samples, the concentration of CH4 in the samples was below the analytical limits of the standards (Figure 4A,C and Figure 5A,C), while the concentration of SF6 in the samples was above the analytical limits of the standards (Figure 4B,D and Figure 5B,D). Those results indicate that an adjustment of SF6 released inside the fermenters is required. For instance, the ratio between CH4:SF6, in mg units, for the standards was on average 266, while the CH4:SF6 ratio in Exp1 samples was 1146 ± 390 and 386 ± 180, and in Exp2 it was 709 ± 74.3 and 262 ± 31.3 for the low and high SF6 release rate, respectively.
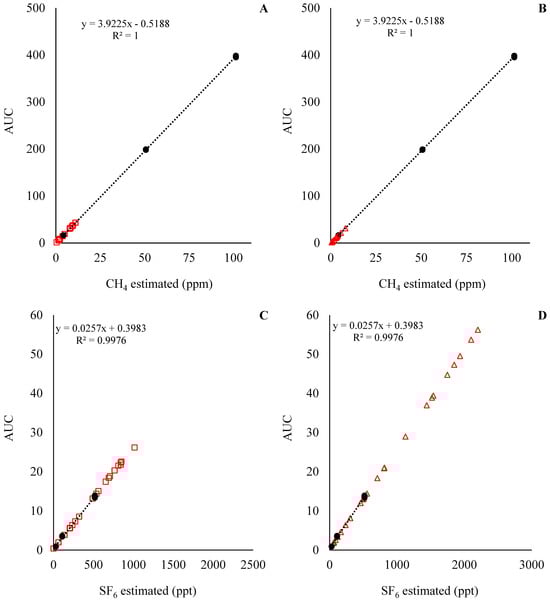
Figure 4.
CH4 and SF6 analyses for experiment 1. At the top left of the graphics is presented equation and R2 for the standard curve; in addition, the Y-axis is the area under the curve (AUC) used to estimate CH4 and SF6 concentrations. Solid circles (●) represent the observations for the standard curve, and the dashed line is the fitted standard curve. Open squares (□) represent the samples from the low SF6 release rate, and open triangles (Δ) represent the samples from the high SF6 release rate.
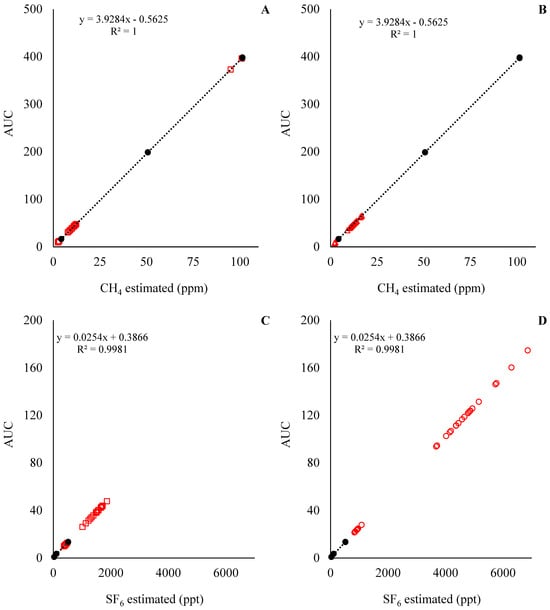
Figure 5.
CH4 and SF6 analyses for experiment 2. At the top left of the graphics is presented equation and R2 for the standard curve; in addition, the Y-axis is the area under the curve (AUC) used to estimate CH4 and SF6 concentrations. Solid circles (●) represent the observations for the standard curve, and the dashed line is the fitted standard curve. Open squares (□) represent the samples from the low SF6 release rate, and open triangles (Δ) represent the samples from the high SF6 release rate.
3.1.1. Experiment 1
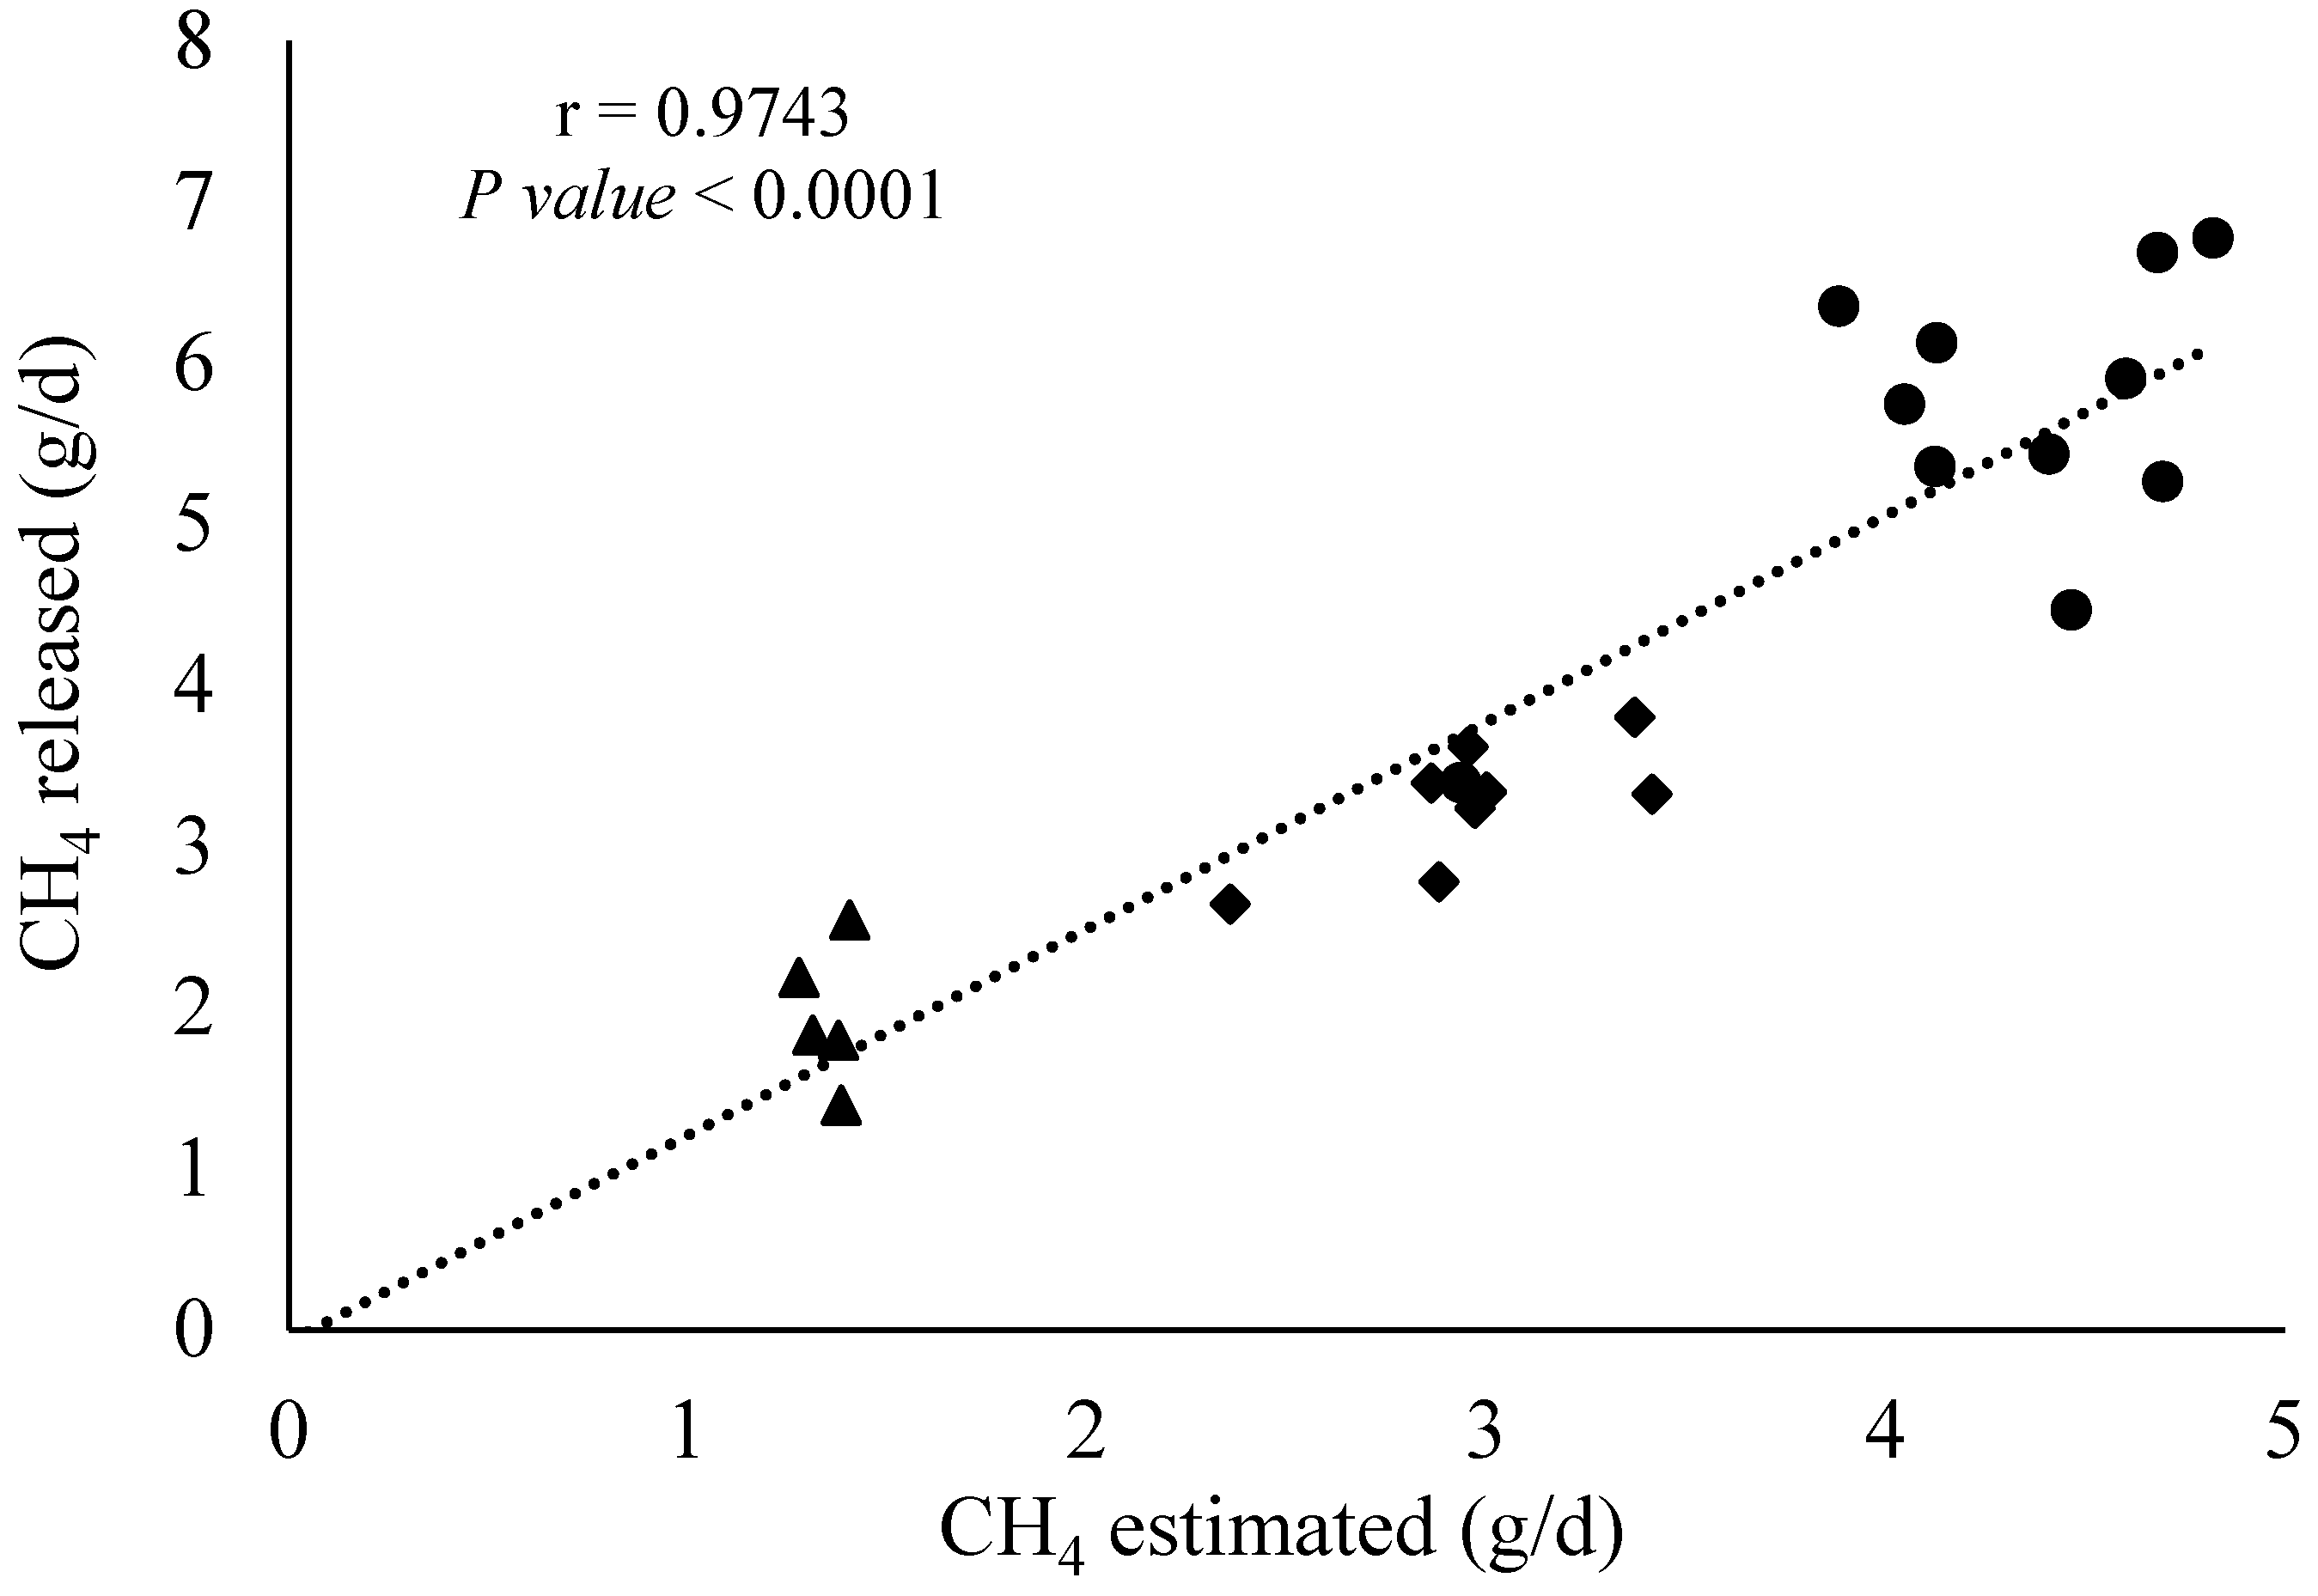
Correlation analysis between the CH4 infusion rate within the fermenters and the estimated CH4 emissions (in g/d) using the SF6 tracer technique is presented in Figure 6. The correlation coefficient (r) from the Pearson analysis using the whole dataset (n = 36 observations) demonstrated that those two variables are positively correlated (r = 0.97 and p < 0.001). To check if the correlation was influenced by all observations, the data corresponding to the treatment zero CH4 infusion was removed, while a similar pattern (r = 0.92 and p < 0.001) for the remaining 24 observations was observed.
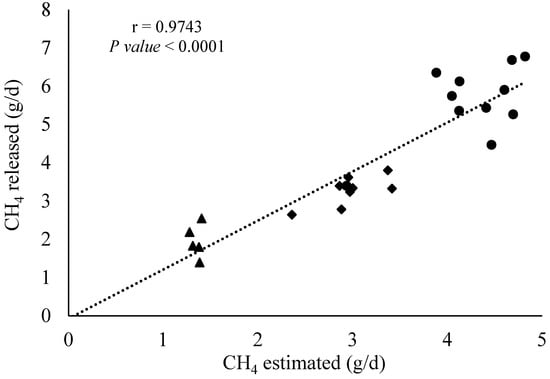
Figure 6.
Pearson correlation analysis between CH4 infused and estimated by the SF6 tracer technique (n = 36 observations). Triangle, diamond, and circles represent CH4 infused between 0.93–1.61, 2.06–3.41, and 3.88–4.82 g/d, respectively.
Multiple regression analysis, where CH4 and SF6 release were used as a predictor of CH4 recovery, was evaluated. A tendency for an interaction effect between the SF6 release and the quadratic term of CH4 (p = 0.13) suggests that the CH4 recovery predicted was dependent on the SF6 released within the fermenter. By assessing the regression lines, at low levels of CH4 infusion, a similar CH4 recovery was predicted; however, with increasing levels of CH4 infusion, a discrepancy between CH4 recovery predicted from low and high SF6 release can be noticed. This suggests that a high SF6 release rate overestimated the CH4 compared to the actual CH4 recovery in scenarios with high CH4 infusion. In addition, there was a linear (p < 0.001) and a quadratic (p < 0.01) effect for CH4 infusion. The coefficients for the linear and quadratic effects were 0.9256 ± 0.1109 and 0.000073 ± 0.000024 (coefficient ± standard error). The regression analysis indicates that the SF6 tracer technique overestimates the CH4 recovery; for instance, CH4 infusion between 0.93 to 1.61, 2.06 to 3.41, and 3.88 to 4.82 g/d overestimated the CH4 recovery by 5.85, 20.0, and 31.4%, respectively. Those results indicate that the SF6 tracer technique would not be efficient for measuring CH4 emission in scenarios with high CH4 emission. In addition, the effect of the days of collection was evaluated, and no statistical differences were observed, which indicates consistency across collection days.
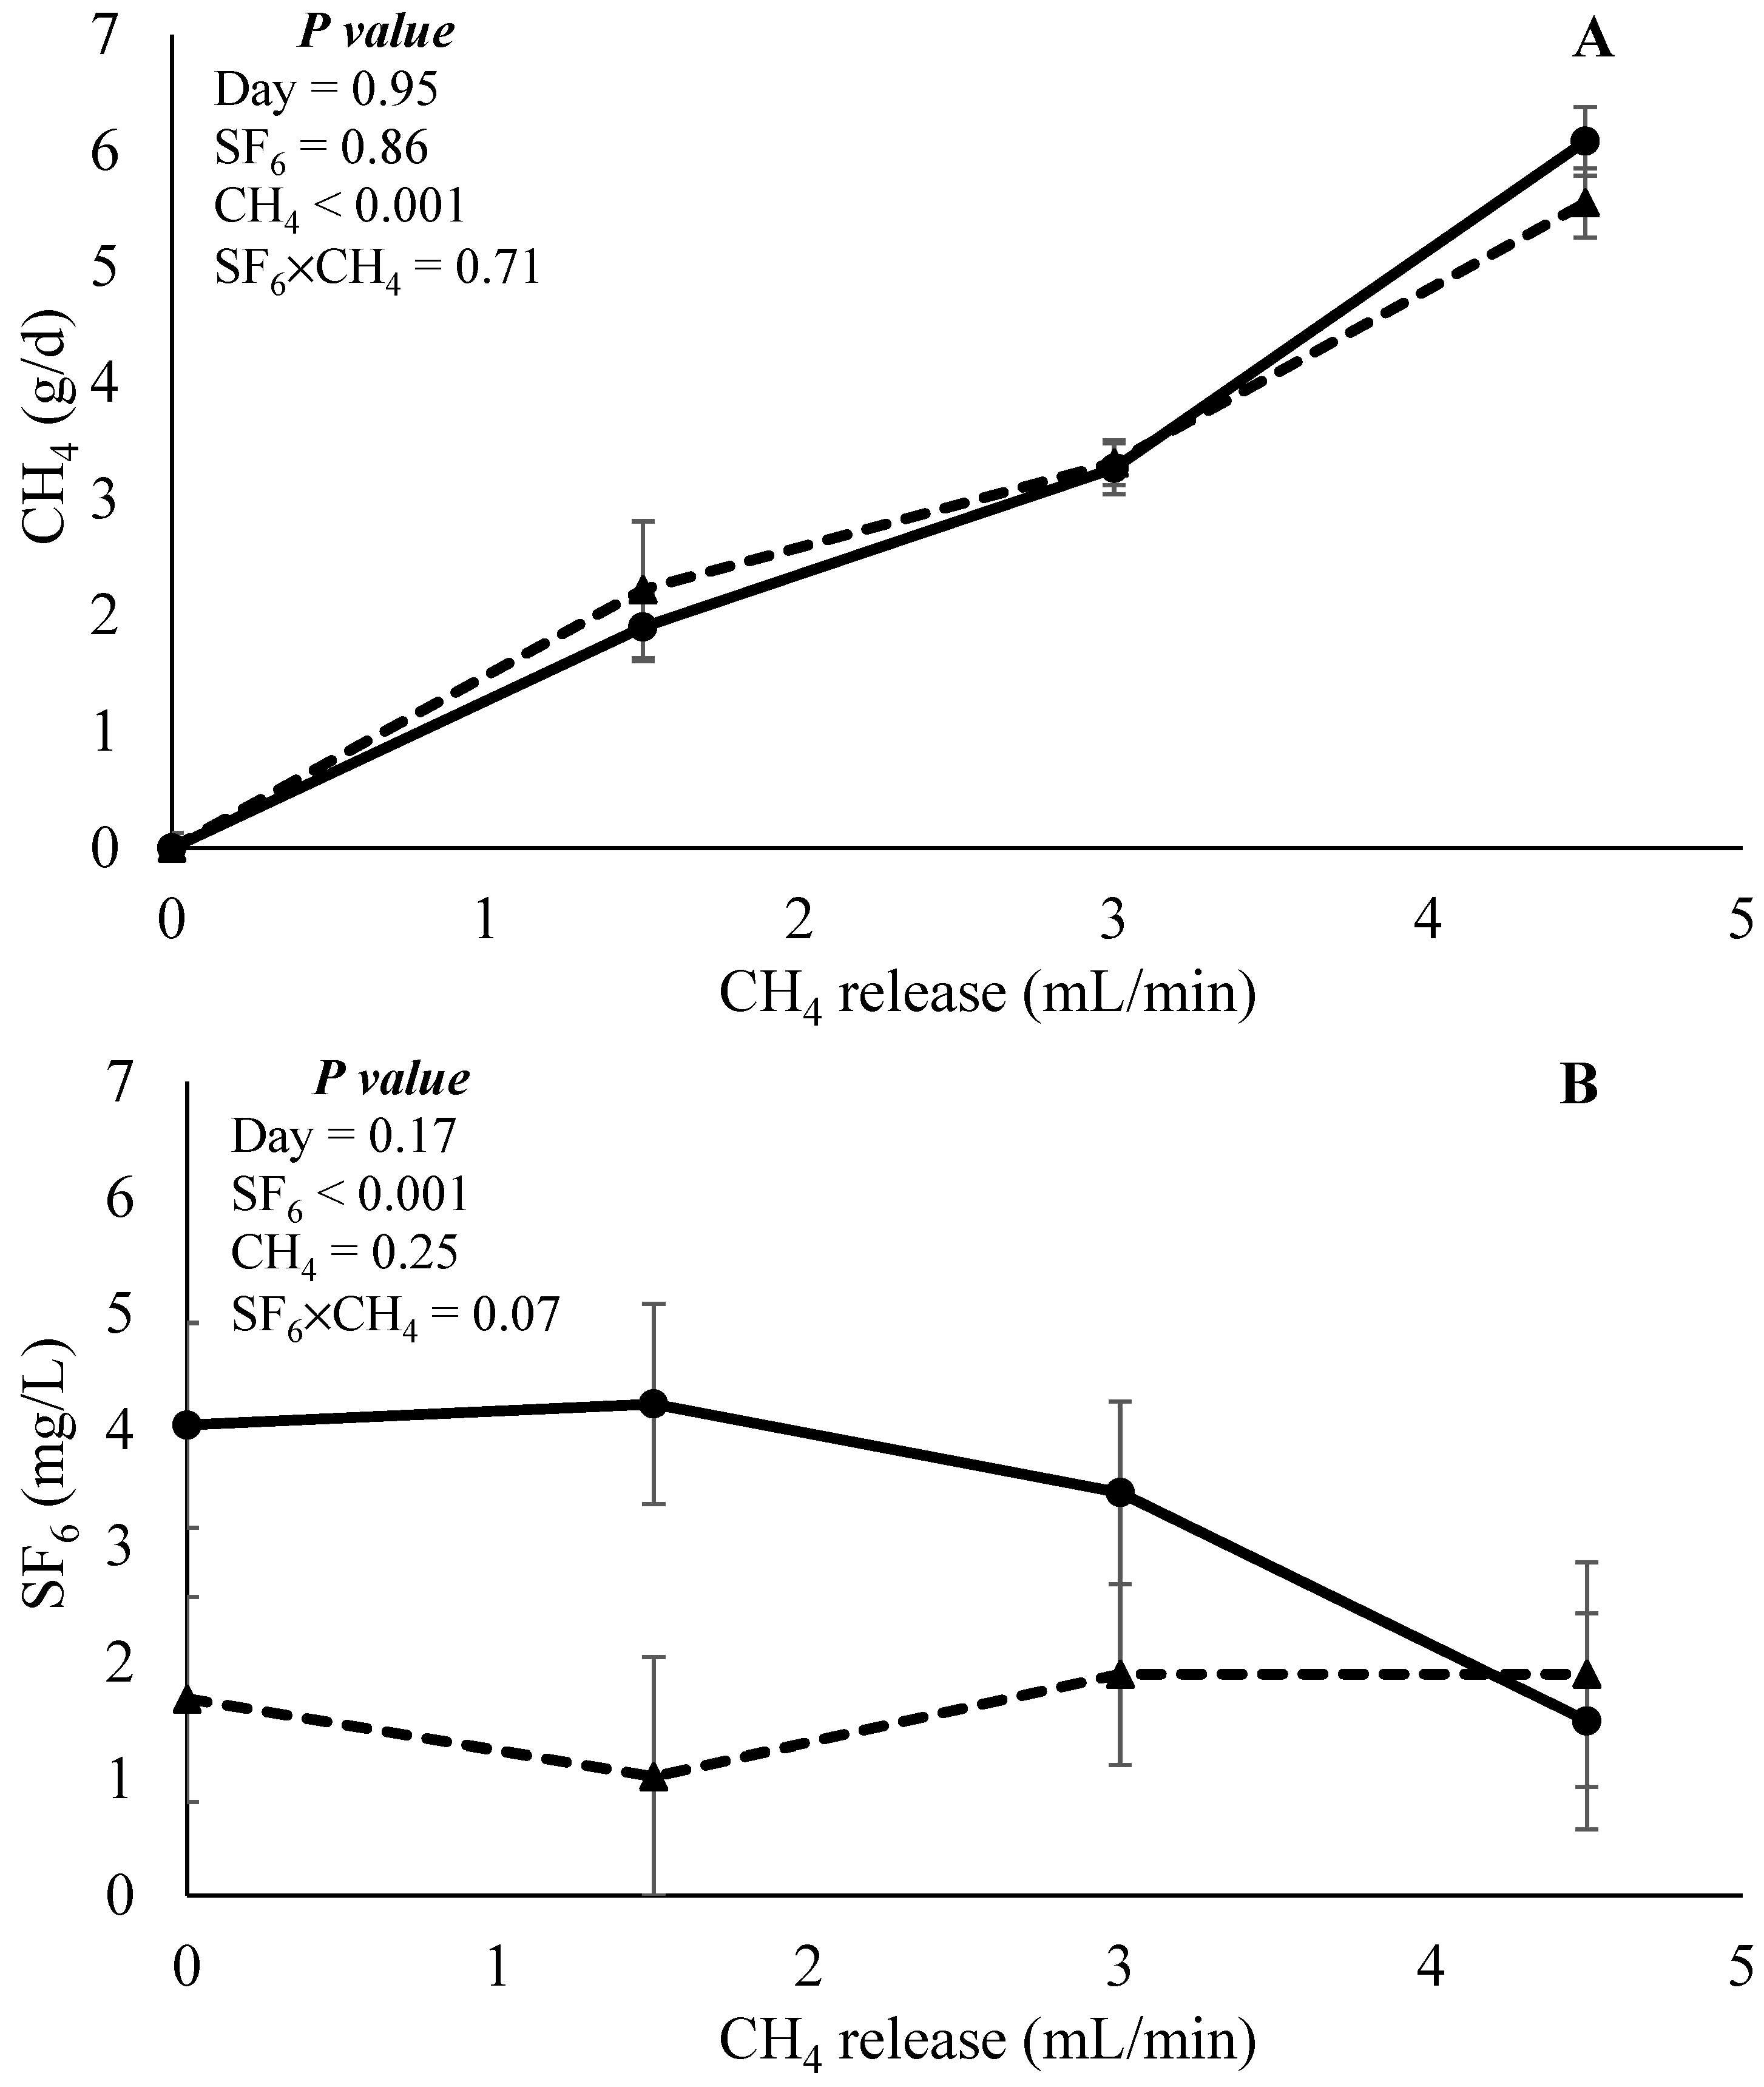
The effects of CH4 and SF6 released as categorical data on CH4 recovery and SF6 concentration are presented in Figure 7. In both response variables, the day was not affected (p > 0.17). No interaction effect (p = 0.71) between CH4 and SF6 released, nor was the effect of SF6 released (p = 0.86) observed for CH4 recovery. The main effect of CH4 infusion (p < 0.001) was observed. Orthogonal contrast indicated a positive linear effect (p < 0.001) on CH4 recovery. Results indicated that, independently of the SF6 released, the technique is adequate to detect different levels of CH4 recovery in in vitro continuous culture systems. When SF6 concentration was evaluated, an interaction effect (p = 0.07) between CH4 and SF6 release was observed. Low SF6 release enabled a similar SF6 concentration of the samples regardless of the level of CH4 infusion. However, high SF6 release had a quadratic response (contrast p < 0.001), which suggests that the concentration of the sample SF6 reduces with an increase in CH4 infusion. This may indicate that the high SF6 release rate is not adequate in scenarios of high CH4 recovery.

Figure 7.
Effects of interaction between CH4 and SF6 release on the estimation of CH4 recovery (g/d) and concentration of SF6 (mg/L). Solid triangles (▲) and circles (●) represent low and high SF6 release, respectively, in experiment 1.
3.1.2. Experiment 2
The CH4 emission (in g/d) and SF6 concentration obtained from the Exp2 evaluating the effects of partial replacement of SBM with CHL or SPI on a DFCCS is presented in Figure 8. There was no interaction effect between the treatment and SF6 release for both CH4 emission (p = 0.27) and SF6 concentration (p = 0.46), neither a main effect for treatment (p = 0.31 and 0.79, respectively), except by a tendency (p = 0.06) for a main effect of SF6 release on SF6 concentration, in which the concentration of SF6 was lower for the low SF6 release in comparison to the high SF6 release (0.22 and 0.41 mg/L, respectively). When contrasts were applied, regardless of the SF6 release rate, a tendency (contrast control vs. algae, p = 0.10) was observed for the algae-containing diets to have a reduction in daily CH4 yield when compared to the control diets (2.28 vs. 2.53 g/d).
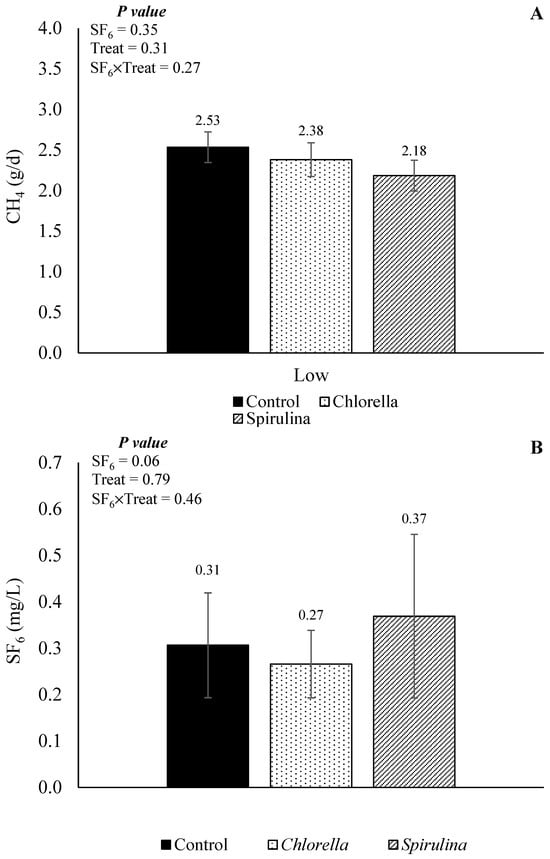
Figure 8.
Effects of SF6 release and partial replacement of soybean meal (control) with Chlorella or Spirulina in CH4 production (A) and concentration of SF6 (B) in the sample.
Besides CH4 yield, the nutrient degradability in grams and CH4 production per unit of nutrient degraded is presented in Table 1. Replacing SBM with algae in the diet did not affect the total DM (contrasts p = 0.62) and OM (contrasts p = 0.35) degraded, nor did CH4 per unit of digestible DM (contrasts p = 0.17) and digestible OM (contrasts p = 0.20). However, algae-containing diets enabled an increase in NDF degradation (contrasts p < 0.01), which resulted in a reduction in the CH4 per unit of NDF degraded (contrasts p < 0.001). No effect (p ≥ 0.20) of algae species was observed.

Table 1.
Effects of partial replacement of soybean meal with Chlorella or Spirulina on CH4 production and true degradability of dry matter (DMD), organic matter (OMD), and neutral detergent fiber (NDFD).
4. Discussion
4.1. SF6 Marker to Estimate CH4 Emissions in DFCCS
The main goal of this study was to evaluate the SF6 tracer technique to estimate CH4 recovery and yield in a DFCCS. To the best of our knowledge, this is the first attempt to use the SF6 tracer technique to estimate CH4 production within in vitro systems, which would allow the system to measure enteric CH4 emissions from different diets. We have demonstrated that this technique may be a useful tool to estimate CH4 emission and yield from DFCCS; however, some adjustments during gas collection or CH4 analysis are required to improve the methodology.
For instance, a greater level of SF6 release enabled a better CH4:SF6 ratio, which was close to the ratio obtained from the standards. A greater CH4:SF6 ratio could generate variability in the data due to issues related to the standard curve fitting and the analytical process. In addition, due to the fact that the collection of gas was carried out directly from the headspace of the fermenters, the sample was concentrated, and serial dilutions were required to adequately fit the samples to the capability of the GC standard curves. This process of serial dilution may be another factor that could contribute to potential analytical bias in the data.
Pinares-Patino et al. [26] have conducted a study to evaluate the effects of the rate of SF6 release (1.90, 3.62, 5.28, or 11.1 mg/d) for the estimation of CH4 emission in vivo. Authors reported no effects of SF6 release rate on CH4 concentration (48.0 ppm); however, there was a positive linear effect of SF6 release rate on the SF6 concentration (119, 238, 279, and 524 ppt, respectively) and a negative linear effect of SF6 release on CH4:SF6 ratio (455, 266, 225, and 105, respectively). When evaluating the effects of the SF6 release rate upon CH4 emission and yield by unit of dry matter intake, the authors reported a positive linear effect for both variables. Those results suggest that CH4 emission and yield per unit of degraded nutrients are dependent on the SF6 release rate, where a greater SF6 release rate may estimate greater values of CH4 yield. In another study, Martin et al. [27] evaluated the interaction effects of the site of collection (breath gas or ruminal gas) and the rate of SF6 release on the estimation of CH4 emission in non-lactating cannulated Holstein cows. Authors reported no interaction effects between those two factors; in addition, a high SF6 release rate (3.15 mg/d) enabled a greater estimation of CH4 emission (105.3 vs. 118.1 L/8-h period) when compared to a low SF6 release rate (1.58 mg/d). Current study results partially corroborate the findings of Pinares-Patino et al. [26] and Martin et al. [27]. It was demonstrated that at low levels of CH4 production, the effects of SF6 release rate are small; however, when the technique is used on scenarios with a high CH4 production, high levels of SF6 release rate would estimate a greater CH4 emission than low SF6 release rate.
The CH4 recovery estimated by the SF6 tracer demonstrated that the technique overestimates CH4 recovery in scenarios with high production of CH4. This may be due to the frequency of CH4 flow used and the accuracy of the method. We evaluated the flow of CH4 infusion four times daily, and adjustments were made accordingly; however, the flow between analyses could have oscillated, increasing the release rate within the fermenters, which could explain the greater CH4 estimations from the SF6 tracer technique. Also, we could attribute those effects to noise during the collection or analyses. For instance, a better collection system, scaling off SF6 release, and sample dilution process should be considered and further modified to improve the accuracy of the technique to estimate CH4 emission.
Another important point observed from the results of SF6 concentration is that an interaction effect between CH4 and SF6 release was observed, indicating that when high CH4 was released into the fermenter, a low SF6 was recovered. This is an interesting result with an unclear explanation, and further studies are required to investigate that response. One explanation that we could propose to explain this result is the high dilution rate of the SF6 gas within the fermenter jar; since a greater CH4 was released within the jar, a more diluted sample was obtained.
4.2. Effects of the Partial Replacement of SBM with Algae Biomass
Current results demonstrated that algae-containing diets tended to reduce CH4 yield and improved NDF degradation, consequently reducing CH4 production by unit of NDF. In a previous study [18] conducted by the current research team, the effects of the replacement of SBM with algae biomass on carbohydrate-contrasting diets were evaluated. It was demonstrated that a partial replacement of SBM with algae biomass can have a linear reduction in the degradability of nutrients such as DM, OM, and NDF. However, when CH4 was evaluated, a linear reduction in CH4 yield and production by unit of NDF and a tendency for a negative linear effect in CH4 production per unit of DM and OM were observed. Such a linear effect observed in the before mentioned study could be mainly attributed to the effect of the replacement of SBM with SPI, which enabled the greatest reduction in CH4 yield. Those results reported in our companion study in a batch culture trial corroborated our findings, which further indicate the reliability of the SF6 technique to measure CH4 in DFCCS.
In the current companion paper [17], which contains the kinetics and daily metabolite production, as well as the degradability of nutrients and nitrogen metabolism, it was demonstrated that partial replacement of SBM with algae had the potential to reduce the degradability of the CP and improve the efficiency of nitrogen utilization, along with an increase in the degradability of NDF. In another experiment, the co-digestion of switchgrass and Spirulina was carried out with the objective of evaluating the kinetics of CH4 production [28]. The author reported a positive linear correlation between the level of Spirulina inclusion and CH4 yield, which was attributed to the fact that the biomass of the switchgrass used was mostly undegradable carbohydrates, while the Spirulina was composed of more digestible nutrients.
Regarding the utilization of the SF6 tracer technique to estimate CH4 production in DFCCS, it is important to note that the collection scheme for the experiment using ruminal content (experiment 2) had to be modified. That modification in the collection protocol was carried out because of the high incidence of collection system clogs due to the humidity in the headspace of the fermentation jar. Evaluation of a system to reduce the humidity of the collected gas should be carried out in future studies. Despite clogging issues in the collection system that prevented the collection using the canisters, the utilization of spot sampling overcame these issues and did not affect the validity and effectiveness of the technique to estimate CH4 production.
5. Conclusions
This study revealed novel insights into the estimation of CH4 using the SF6 tracer technique in a DFCCS. Notably, samples generated from DFCCS may not be appropriate for the traditional standard curves used for in vivo settings, which could lead to an underestimation of CH4 and an overestimation of SF6 concentrations. This highlights the need for an adjustment in the SF6 release within fermenters, which would allow the use of those standard curves. Moreover, while the SF6 tracer technique can efficiently detect varying levels of CH4 yield to a certain extent, it tends to overestimate CH4 yield in scenarios with higher CH4 emissions and when permeation tubes with a high rate of SF6 release are used. Future studies should focus on evaluating lower levels of SF6 release into the fermenters individually or developing a system attached to the nitrogen infusion apparatus that could be used to deliver the tracer gas marker efficiently into the fermenters. In addition, further investigation is required on the collection system during a fermentation trial, in which a greater number of collections may induce the clogging of the system due to the humidity of the gas in the headspace of the fermenters. A water trap device would be needed to improve the viability of gas collection directly from the headspace of the fermenters. These findings underscore the importance of refining and calibrating measurement techniques for accurate CH4 yield estimations in various scenarios.
Author Contributions
Conceptualization, R.R.L. and A.P.F.; methodology, R.R.L., J.V., A.M., S.S.d.S., K.S., J.A.-C., D.V., N.D., J.O.S. and A.P.F.; formal analysis, R.R.L.; investigation, R.R.L., G.S.-S., J.V., A.M., S.S.d.S., K.S. and J.A.-C.; data curation, R.R.L. and A.P.F.; writing—original draft preparation, R.R.L. and A.P.F.; writing—review and editing, R.R.L., G.S.-S., D.V., N.D., J.O.S. and A.P.F.; visualization, R.R.L. and A.P.F.; supervision, A.P.F.; project administration A.P.F.; funding acquisition, A.P.F. All authors have read and agreed to the published version of the manuscript.
Funding
This research was funded by the National Science Foundation (NSF) to Antonio P. Faciola (CBET—1856009).
Institutional Review Board Statement
The study was conducted in accordance with guidelines from the Institutional Animal Care and Use Committee of the University of Florida.
Informed Consent Statement
Not applicable.
Data Availability Statement
The raw data used in this study is available from the corresponding author upon reasonable request.
Acknowledgments
The authors acknowledge the University of Florida Department of Chemistry, and especially Stanley Pych, for the support with the repair and maintenance of the electronic equipment.
Conflicts of Interest
The authors declare no conflicts of interest.
References
- Bashmakov, I.; Nilsson, L.; Acquaye, A.; Bataille, C.; Cullen, J.; de la Rue du Can, S.; Fischedick, M.; Geng, Y.; Tanaka, K. Climate Change 2022: Mitigation of Climate Change. Contribution of Working Group III to the Sixth Assessment Report of the Intergovernmental Panel on Climate Change; Lawrence Berkeley National Laboratory: Berkeley, CA, USA, 2022. [Google Scholar]
- Beauchemin, K.A.; Ungerfeld, E.M.; Eckard, R.J.; Wang, M. Review: Fifty Years of Research on Rumen Methanogenesis: Lessons Learned and Future Challenges for Mitigation. Animal 2020, 14, s2–s16. [Google Scholar] [CrossRef] [PubMed]
- Gerber, P.J.; Hristov, A.N.; Henderson, B.; Makkar, H.; Oh, J.; Lee, C.; Meinen, R.; Montes, F.; Ott, T.; Firkins, J.; et al. Technical options for the mitigation of direct methane and nitrous oxide emissions from livestock: A review. Animal 2013, 7 (Suppl. 2), 220–234. [Google Scholar] [CrossRef] [PubMed]
- Subepang, S.; Suzuki, T.; Phonbumrung, T.; Sommart, K. Enteric methane emissions, energy partitioning, and energetic efficiency of zebu beef cattle fed total mixed ration silage. Asian-Australas. J. Anim. Sci. 2019, 32, 548–555. [Google Scholar] [CrossRef] [PubMed]
- Tedeschi, L.O.; Abdalla, A.L.; Álvarez, C.; Anuga, S.W.; Arango, J.; Beauchemin, K.A.; Becquet, P.; Berndt, A.; Burns, R.; De Camillis, C.; et al. Quantification of methane emitted by ruminants: A review of methods. J. Anim. Sci. 2022, 100, 197. [Google Scholar] [CrossRef]
- Makkar, H.P.S.; Vercoe, P.E. (Eds.) Measuring Methane Production from Ruminants; Springer: Dordrecht, The Netherlands, 2007; ISBN 978-1-4020-6132-5. [Google Scholar]
- Johnson, K.; Huyler, M.; Westberg, H.; Lamb, B.; Zimmerman, P. Measurement of methane emissions from ruminant livestock using a sulfur hexafluoride tracer technique. Environ. Sci. Technol. 1994, 28, 359–362. [Google Scholar] [CrossRef]
- Berndt, A.; Boland, T.M.; Deighton, M.H.; Gere, J.I.; Grainger, C.; Hegarty, R.S.; Iwaasa, A.D.; Koolaard, J.P.; Lassey, K.R.; Luo, D.; et al. Guidelines for Use of the Sulphur Hexafluoride (SF6) Tracer Technique to Measure Enteric Methane Emissions from Ruminants; Ministry for Primary Industries: Wellington, New Zealand, 2014; p. 166. [Google Scholar] [CrossRef]
- Poteko, J.; Schrade, S.; Zeyer, K.; Mohn, J.; Zaehner, M.; Zeitz, J.O.; Kreuzer, M.; Schwarm, A. Guidelines for Use of SF6 Tracer Technique to Measure Enteric CH4 from Ruminants, 2nd ed.; Jonker, A., Waghorn, G., Eds.; Ministry for Primary Industries: Wellington, New Zealand, 2020; ISBN 978-1-99-004337-6. [Google Scholar]
- National Research Council (US) Committee for the Update of the Guide for the Care and Use of Laboratory. Animals Guide for the care and use of laboratory animals. In The National Academies Collection: Reports funded by National Institutes of Health, 8th ed.; National Academies Press: Washington, DC, USA, 2011; ISBN 0309154006. [Google Scholar]
- Yáñez-Ruiz, D.R.; Bannink, A.; Dijkstra, J.; Kebreab, E.; Morgavi, D.P.; O’Kiely, P.; Reynolds, C.K.; Schwarm, A.; Shingfield, K.J.; Yu, Z.; et al. Design, implementation and interpretation of in vitro batch culture experiments to assess enteric methane mitigation in ruminants—A review. Anim. Feed Sci. Technol. 2016, 216, 1–18. [Google Scholar] [CrossRef]
- Brandao, V.L.N.; Marcondes, M.I.; Faciola, A.P. Comparison of microbial fermentation data from dual-flow continuous culture system and omasal sampling technique: A meta-analytical approach. J. Dairy Sci. 2020, 103, 2347–2362. [Google Scholar] [CrossRef]
- Wenner, B.A.; de Souza, J.; Batistel, F.; Hackmann, T.J.; Yu, Z.; Firkins, J.L. Association of aqueous hydrogen concentration with methane production in continuous cultures modulated to vary pH and solids passage rate. J. Dairy Sci. 2017, 100, 5378–5389. [Google Scholar] [CrossRef]
- Ramayo-Caldas, Y.; Zingaretti, L.; Popova, M.; Estellé, J.; Bernard, A.; Pons, N.; Bellot, P.; Mach, N.; Rau, A.; Roume, H.; et al. Identification of rumen microbial biomarkers linked to methane emission in Holstein dairy cows. J. Anim. Breed. Genet. 2020, 137, 49–59. [Google Scholar] [CrossRef]
- Alvarado-Bolovich, V.; Medrano, J.; Haro, J.; Castro-Montoya, J.; Dickhoefer, U.; Gómez, C. Enteric methane emissions from lactating dairy cows grazing cultivated and native pastures in the high Andes of Peru. Livest. Sci. 2021, 243, 104385. [Google Scholar] [CrossRef]
- Civiero, M.; Delagarde, R.; Berndt, A.; Rosseto, J.; de Souza, M.N.; Schaitz, L.H.; Ribeiro-Filho, H.M.N. Progressive inclusion of pearl millet herbage as a supplement for dairy cows fed mixed rations: Effects on methane emissions, dry matter intake, and milk production. J. Dairy Sci. 2021, 104, 2956–2965. [Google Scholar] [CrossRef] [PubMed]
- Lobo, R.R.; Siregar, M.U.; da Silva, S.S.; Monteiro, A.R.; Salas-Solis, G.; Vicente, A.C.S.; Vinyard, J.R.; Johnson, M.L.; Ma, S.; Sarmikasoglou, E.; et al. Partial replacement of soybean meal with microalgae biomass on in vitro ruminal fermentation may reduce ruminal protein degradation. J. Dairy Sci. 2024, 107, 1460–1471. [Google Scholar] [CrossRef] [PubMed]
- Lobo, R.R.; Almeida, E.; Monteiro, A.; Silva, S.S.; Salas-Solis, G.; Coronella, C.J.; Hiibel, S.R.; Faciola, A.P. Replacing soybean meal with microalgae biomass in diets with contrasting carbohydrate profile can reduce in vitro methane production and improve short-chain fatty acids production. J. Dairy Sci. 2024, 108, 5542–5555. [Google Scholar] [CrossRef] [PubMed]
- Henry, D.D.; Ciriaco, F.M.; Araujo, R.C.; Fontes, P.L.P.; Oosthuizen, N.; Rostoll-Cangiano, L.; Sanford, C.D.; Schulmeister, T.M.; Dubeux, J.C.B.; Cliff Lamb, G.; et al. Effects of bismuth subsalicylate and encapsulated calcium-ammonium nitrate on enteric methane production, nutrient digestibility, and liver mineral concentration of beef cattle. J. Anim. Sci. 2020, 98, 234. [Google Scholar] [CrossRef] [PubMed]
- Bitsie, B.; Osorio, A.M.; Henry, D.D.; Silva, B.C.; Godoi, L.A.; Supapong, C.; Brand, T.; Schoonmaker, J.P. Enteric methane emissions, growth, and carcass characteristics of feedlot steers fed a garlic- and citrus-based feed additive in diets with three different forage concentrations. J. Anim. Sci. 2022, 100, 139. [Google Scholar] [CrossRef] [PubMed]
- Hoover, W.H.; Crooker, B.A.; Sniffen, C.J. Effects of Differential Solid-Liquid Removal Rates on Protozoa Numbers in Continous Cultures of Rumen Contents. J. Anim. Sci. 1976, 43, 528–534. [Google Scholar] [CrossRef]
- Agustinho, B.C.; Ravelo, A.; Vinyard, J.R.; Lobo, R.R.; Arce-Cordero, J.A.; Monteiro, H.F.; Sarmikasoglou, E.; Bennett, S.; Johnson, M.L.; Vieira, E.R.Q.; et al. Effects of replacing magnesium oxide with calcium-magnesium carbonate with or without sodium bicarbonate on ruminal fermentation and nutrient flow in vitro. J. Dairy Sci. 2022, 105, 3090–3101. [Google Scholar] [CrossRef]
- Ravelo, A.D.; Calvo Agustinho, B.; Arce-Cordero, J.; Monterio, H.F.; Bennet, S.L.; Sarmikasoglou, E.; Vinyard, J.; Vieira, E.R.Q.; Lobo, R.R.; Ferraretto, L.F.; et al. Effects of partially replacing dietary corn with molasses, condensed whey permeate, or treated condensed whey permeate on ruminal microbial fermentation. J. Dairy Sci. 2022, 105, 2215–2227. [Google Scholar] [CrossRef]
- Vinyard, J.R.; Ravelo, A.; Sarmikasoglou, E.; Monteiro, H.F.; Arce-Cordero, J.A.; Johnson, M.L.; Agustinho, B.C.; Lobo, R.R.; Yungmann, M.G.; Winter, A.H.R.; et al. Effects of exogenous amylolytic or fibrolytic enzymes inclusion on in vitro fermentation of lactating dairy cow diets in a dual-flow continuous-culture system. J. Dairy Sci. 2023, 106, 1002–1012. [Google Scholar] [CrossRef]
- Wenner, B.A.; Kesselring, E.; Antal, L.; Henthorne, T.; Carpenter, A.J. Dual-flow continuous culture fermentor system updated to decrease variance of estimates of digestibility of neutral detergent fiber. Appl. Anim. Sci. 2021, 37, 445–450. [Google Scholar] [CrossRef]
- Pinares-Patiño, C.S.; Machmüller, A.; Molano, G.; Smith, A.; Vlaming, J.B.; Clark, H. The SF6 tracer technique for measurements of methane emission from cattle—Effect of tracer permeation rate. Can. J. Anim. Sci. 2008, 88, 309–320. [Google Scholar] [CrossRef]
- Martin, C.; Koolaard, J.; Rochette, Y.; Clark, H.; Jouany, J.P.; Pinares-Patiño, C.S. Effect of release rate of the SF6 tracer on methane emission estimates based on ruminal and breath gas samples. Animal 2012, 6, 518–525. [Google Scholar] [CrossRef]
- El-Mashad, H.M. Kinetics of methane production from the codigestion of switchgrass and Spirulina platensis algae. Bioresour. Technol. 2013, 132, 305–312. [Google Scholar] [CrossRef] [PubMed]


Disclaimer/Publisher’s Note: The statements, opinions and data contained in all publications are solely those of the individual author(s) and contributor(s) and not of MDPI and/or the editor(s). MDPI and/or the editor(s) disclaim responsibility for any injury to people or property resulting from any ideas, methods, instructions or products referred to in the content. |
© 2024 by the authors. Licensee MDPI, Basel, Switzerland. This article is an open access article distributed under the terms and conditions of the Creative Commons Attribution (CC BY) license (https://creativecommons.org/licenses/by/4.0/).