Article

Physicochemical and Biochemical Changes in Cocoa during the Fermentation Step

by
Franco Lucio Ruiz-Santiago
1,2,
Facundo Joaquín Márquez-Rocha
3,*,
Pedro García-Alamilla
4,*,
Areli Carrera-Lanestosa
4,
Carolina Ramírez-López
1,
Erik Ocaranza-Sánchez
1 and
David Jesús Jiménez-Rodríguez
5
1
Instituto Politécnico Nacional, Centro de Investigación en Biotecnología Aplicada, Ex-Hacienda San Juan Molino, Carr. Estatal Santa Inés Tecuexcomac-Tepetitla, Santa Inés Tecuexcomac CP 90700, Tlaxcala, Mexico
2
División de Procesos Industriales, Universidad Tecnológica de Tabasco, Carr. Villahermosa-Teapa km 14.6, Parrilla II, Centro CP 86288, Tabasco, Mexico
3
Unidad Profesional Interdisciplinaria de Ingeniería Campus Hidalgo, Instituto Politécnico Nacional Distrito de Educación, Salud, Ciencia, Tecnología e Innovación, San Agustín Tlaxiaca CP 42162, Hidalgo, Mexico
4
División Académica de Ciencias Agropecuarias, Universidad Juárez Autónoma de Tabasco, Carr. Villahermosa-Teapa km 25 Ranchería La Huasteca, Centro CP 86298, Tabasco, Mexico
5
Centro Mexicano Para la Producción más Limpia, Unidad Tabasco, Instituto Politécnico Nacional, Cunduacán CP 86691, Tabasco, Mexico
*
Authors to whom correspondence should be addressed.
Fermentation 2024, 10(8), 405; https://doi.org/10.3390/fermentation10080405
Submission received: 10 June 2024 / Revised: 5 July 2024 / Accepted: 24 July 2024 / Published: 6 August 2024
(This article belongs to the Section Fermentation for Food and Beverages)

Abstract

:
The physicochemical and biochemical changes during the fermentation of four clones and two native varieties of Theobroma cacao L. were studied. Fermentation was performed in traditional wood cubes. During fermentation, the cotyledon pH decreased, and the temperature increased to more than 10 °C above the ambient temperature (47 °C). The fermentation index (FI) increased in the clones C1, C4, C8, C9, and Guayaquil (G) to close to one at 120 h of fermentation. For the FI of the cocoa Criollo (Cr), a value of 2.5 was proposed according to the spectrophotometric scan performance. The total polyphenol content increased in all the samples from 21 (C8) to 70 (Cr) % in a comparison of the TPC at T0 and T120, respectively. The total flavonoid content increased from 16 (C8) to 51% in Guayaquil (G) during the fermentation period. In the case of the methylxanthines, such as theobromine and caffeine, both quantities decreased. The theobromine content decreased in all the samples from 6 (G) to 31% (C8). The caffeine content decreased in all the samples from 3% in Cr to 25% in C1 and G after fermentation. The antioxidant capability did not change after 120 h of fermentation, and the amount of methylxanthines did not affect the antioxidant potential of the fermented cocoa. The FTIR scan of the fat-free cocoa showed significant differences between the unfermented and fermented beans, and several peaks assigned to carbohydrates and proteins decreased.

1. Introduction

Cocoa’s flavor is formed when roasting fermented, but not unfermented, beans [1,2]. The characteristic chocolate flavor notes are generated by Maillard reactions, which involve the amino groups of amino acids, including peptides and reducing sugars [3]. Cocoa flavor development is influenced by the genetic characteristics of Theobroma cacao, post-harvest processing (fermentation, drying, and roasting), and manufacturing [4].
Cocoa is a fruit of tropical origin whose seeds are used to make chocolate, which is consumed worldwide due to its pleasant flavor, aroma, and nutritional properties [5]. In recent years, cocoa beans and chocolate have been studied for their contribution to health due to the prevention of neurodegenerative diseases, cancer, diabetes, and high blood pressure [6,7,8]. Cocoa contains a large number of bioactive compounds; antioxidants are important molecules that are representative of these compounds.
Its chemistry is complex, and over 600 chemical substances in 18 classes have been identified in roasted cocoa; among these are the phenolic and alkaloid compounds to which the antioxidant effect is attributed. Roasting cocoa is a thermal process that allows the bean to convert into chocolate because of aroma precursors developed during the fermentation process [5]. The fermentation process is the key step for developing sensory properties based on microbiological, enzymatic, and other biochemical activities, which lead to many changes in the cotyledon. The other important factors, such as the genotypes, the environmental conditions, the soil characteristics, and post-harvest operations, are aspects that influence the quality and final composition of dry cocoa beans [9].
Fermentation as a post-harvest step is the biochemical transformation of cocoa bean compounds at the cotyledon level via the action of enzymes [10]. The process begins when the yeasts metabolize the mucilage into alcohol, and via the action of acetic and lactic bacteria, it is transformed into acetic acid, diffusing into the grain. Because of this process, there are physicochemical changes in pH, acidity, and temperature that are the engine for biochemical transformations. This is how the acetic acid that diffuses into the cotyledon causes the death of the embryo; the storage structures of the cells are broken, and polyphenols and reserve proteins are released, followed by biochemical reactions that produce flavor and aroma precursors, as well as the color of the grain [4].
There are also chemical changes, such as brown coloration outside of the grains (which may be due to the presence of quinones) and purple tonality inside (which may be due to the transformation and degradation of anthocyanins); the contents of theobromine and caffeine are also modified. These latter changes contribute to the astringency and bitterness of chocolate and are visually used to assess the degree of fermentation [11,12,13,14]. The antioxidants in food are important since they inhibit oxidative degradation and determine its quality to some degree. The FRAP, ABTS, and DPPH methods have allowed us to evaluate the antioxidant capability of cocoa beans after the fermentation of beans of different geographical origins, such as Ecuador, Ghana, Ivory Coast, Cameroon, Nigeria, Sulawesi, and Malaysia, and the results have shown that there is no pattern of behavior, though the antioxidant activity level decreases during the process, but not significantly [15,16,17].
A reduction in productivity has been observed in cocoa crops in Mexico recently. This is possibly caused by the advanced age of the plantations, their susceptibility, and the presence of diseases, which has inspired research that considers the genetic improvement in native materials. Several clones have been developed and evaluated in terms of disease resistance and productivity, although few studies have been conducted in terms of evaluating the content of bioactive compounds, their variability during post-harvest operations, and sensory characteristics [18,19,20,21,22].
Due to the importance of the cocoa fermentation process in the generation of the precursors of flavor, aroma, and health benefits, it is necessary to know (1) how the phenolic compounds, flavonoids, and methylxanthines (theobromine and caffeine) change; (2) whether the antioxidant capacity is affected; and (3) what vibrational changes occur in the functional groups in fat-free cocoa. These three aspects were studied during the fermentation step.

2. Materials and Methods

2.1. Cocoa Material

Four hybrid cocoa clones developed and released by the Instituto Nacional de Investigaciones Forestales, Agrícolas y Pecuarias (INIFAP) Unidad Huimanguillo, Tabasco, México, were used. The assignment of names based on when they were planted are as follows: INIFAP1 (C1), INIFAP4 (C4), INIFAP8 (C8), and INIFAP9 (C9) (Table 1). In addition, two native genotypes were used (Guayaquil (G) and Criollo (Cr) (Figure S1, Supplementary Materials). The harvesting and processing of the samples were carried out at a cocoa farm in San Juan, located in the Ranchería Caobanal, 2ª sección, Huimanguillo, Tabasco, Mexico, with the following coordinates: 17°35′31.5′′ N 93°26′04.7′′ W. The harvesting of the cocoa was carried out manually twenty-four hours before shelling in January 2022; only the mature ears free of pest damage were used.

2.2. Assembly of the Fermentation Process

In this study, micro-fermentation using small sample insertion was used, as suggested by (patent: WO2013025621 A1) Seguine E. et al. [23]. Fermentation was carried out in a wooden box of 100 × 100 × 90 cm. First, 100 kg of blended cocoa beans was placed in the box (step 1, Figure S2). Then, 2 kg of cocoa beans of each selected material were placed in mesh bags (20 × 30 cm) and correctly identified (step 2, Figure S2). Then, all the mesh bags with the selected material were placed on the blended cocoa beans that had been properly separated (roughly 15 cm, step 3, Figure S2). Promptly, another 100 kg of blended cocoa beans were placed on the mesh bags containing the selected material (step 4, Figure S2). The fermentation began by covering all the materials in the wooden box with banana leaves (step 5, Figure S2). Additionally, the box was covered with thin plastic mesh to avoid contact with insects (step 6, Figure S2, Supplementary Materials).

2.3. Sample Preparation

Using the quartet technique, a sample of 150 g was analyzed in this study using different methods. The grains were peeled to separate the husk and remove the germ, and they were then ground (Hamilton Beach, 80350 R, Glen Allen, VA, USA) and sieved through a mesh of No. 40 (Gilson, V8BF#40, Middleton, WI, USA) to allow for homogenization for the laboratory determinations.

2.4. Physicochemical Parameter Determination

2.4.1. pH Determination

For the determination of the pH, the Mexican NMX-F-317-NORMEX-2013 method was used. A total of 5 g of sample was mixed in 50 mL of distilled water. The mixture was stirred for 5 min. The resulting mixture was filtered into a Buchner funnel using Whatman 1 filter paper, and the solid-free solution was analyzed with a pH meter (HACH, Model: HACHQ40, Loveland, CO, USA).

2.4.2. Total Acidity Determination

The total acidity was measured as described by the Mexican official norm: NMX-F-102-NORMEX-2010. A total of 5 g of ground sample was mixed in 20 mL of distilled water. Titration was performed with 0.1 N NaOH to a pH of 8.3 using a pH meter (HACH, Model: HACHQ40, Loveland, CO, USA). Acidity was quantified as the volume spent to achieve pH = 8.3.

2.4.3. Moisture Determination

Humidity was measured using the methodology described by the Mexican official norm: NOM-116-SSA1-1994. A total of 5 g of ground sample was taken and dried in an oven with convective hot air flowing (FELISA, Model: FE-292AD, Guadalajara, México) at 100 °C for 5 h.

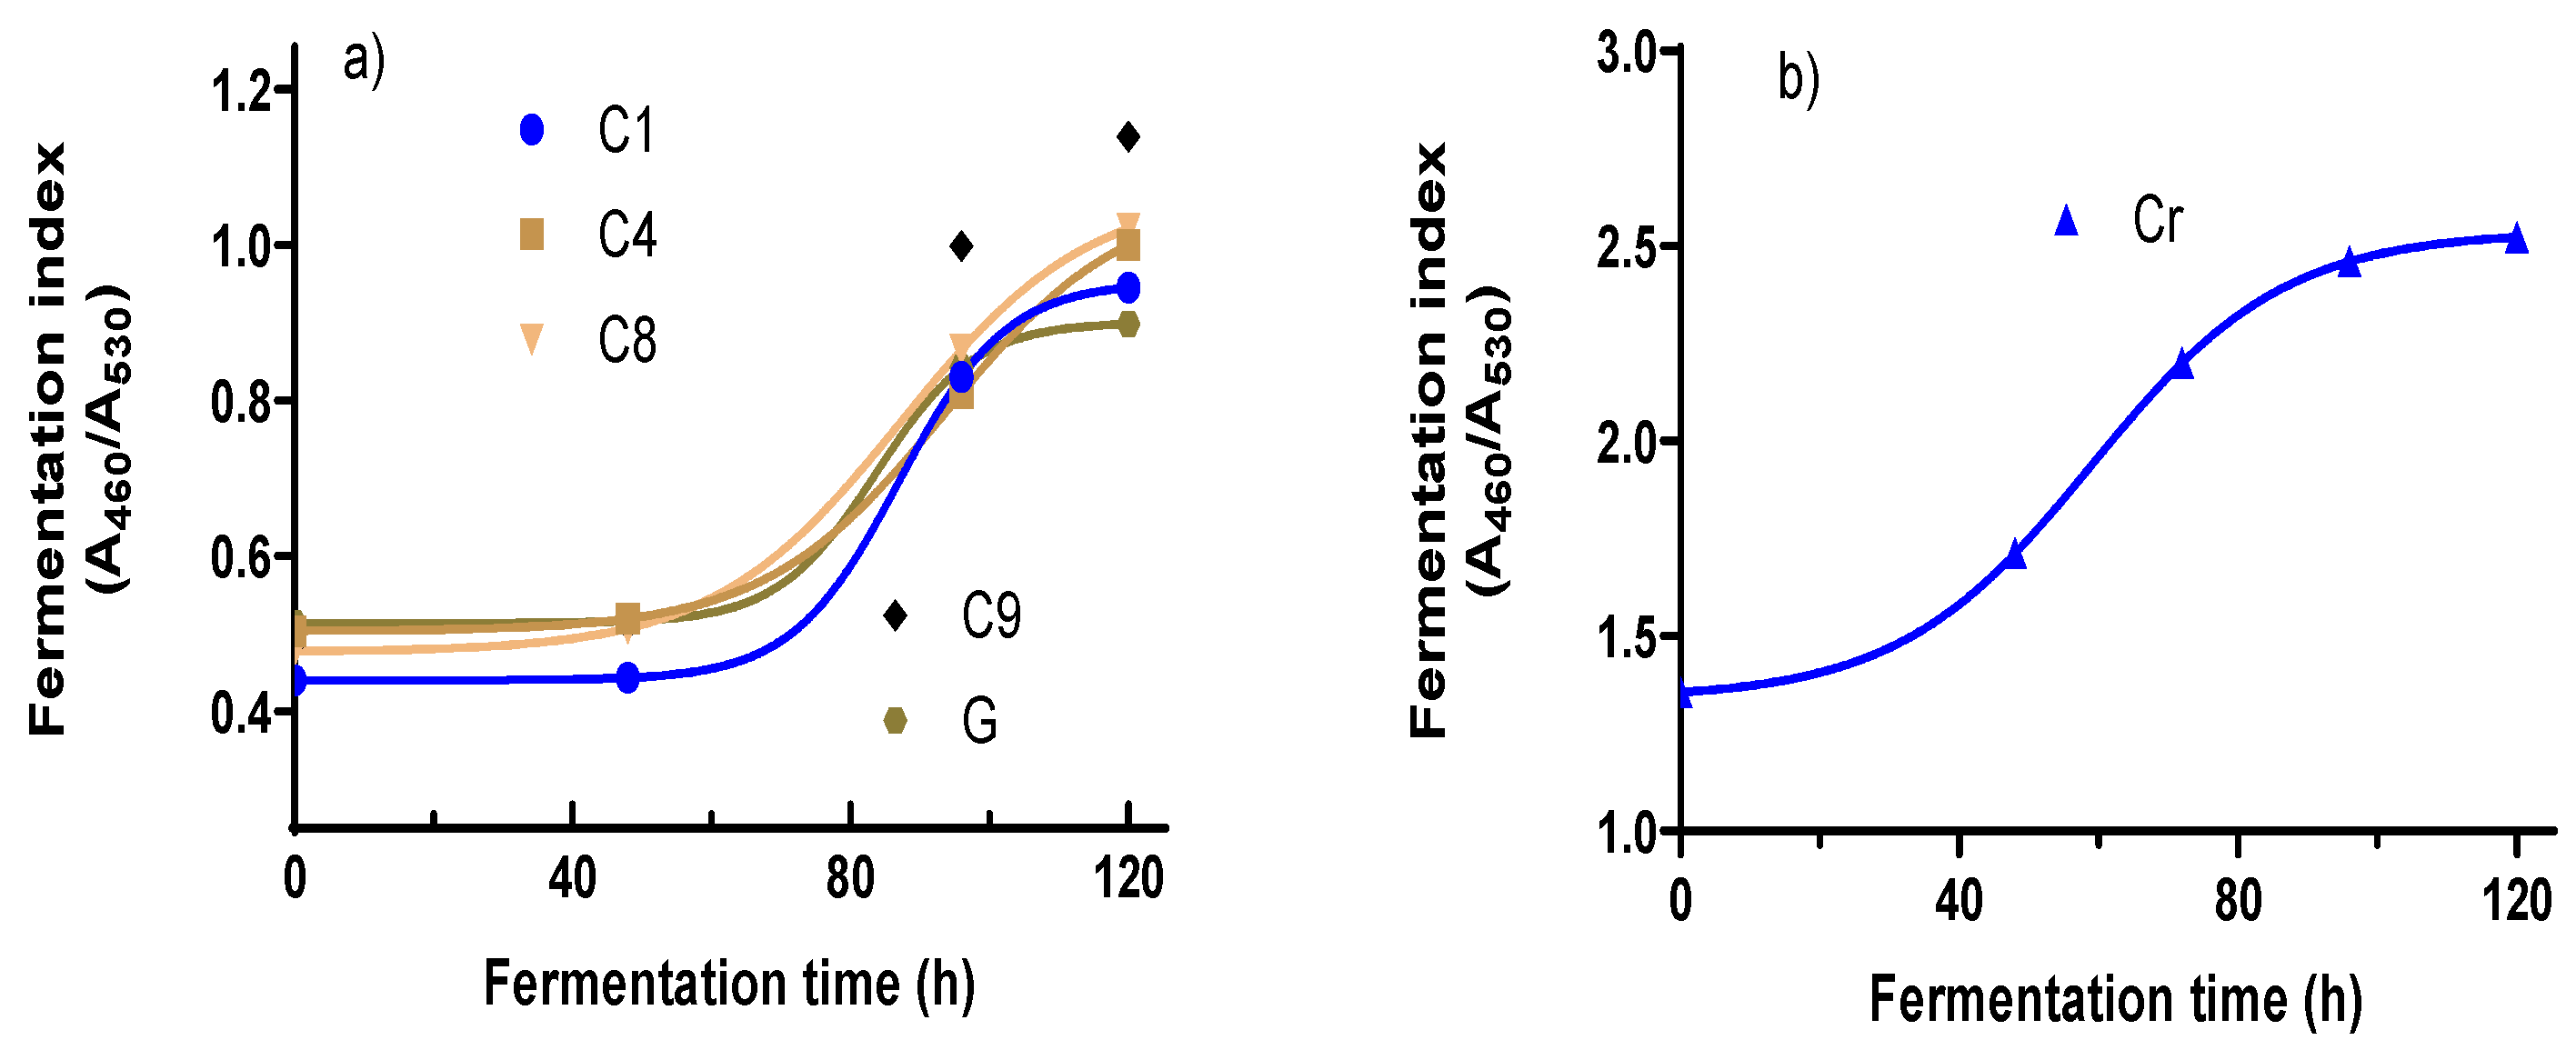
2.4.4. Fermentation Index (FI)

The FI was determined according to the method described by Gourieva and Tserrevitinov [24] and mentioned by Ooi, Ting, and Siow [25] and García-González et al. [26]. In this procedure, 0.2 g of ground cocoa bean was used and placed in falcon tubes. Then, the ground powder was mixed with 20 mL of a solution of methanol/hydrochloric acid (97:3). The mixture was homogenized and left at 8 °C for 19 h. Then, it was centrifuged at 6000 rpm for 20 min at 4 °C. The supernatant was measured at absorbance at 460 and 530 nm using a spectrophotometer (LAMBDA 365 UV/VIS, Perkin Elmer, Waltham, MA, USA), and the absorbance spectrum was determined as well from 350 to 700 nm. The FI is the absorbance ratio between 460 nm and 530 nm. This was determined in triplicate for all the samples at all the times (T0, T48, T96, and T120).

2.5. Biochemical Determinations

2.5.1. Total Phenolic Content (TPC)

The phenolic compounds were determined using the method reported by Singlenton and Rossi [27] and modified by Othman et al. [15] for aqueous extracts. A sample of 0.2 g of dehydrated (oven dried method) and defatted cotyledon (Soxhlet method) was extracted with 2 mL of distilled water at room temperature for 2 h using an orbital stirrer (Thermo Scientific, 2346, Chengdu, China) at 200 rpm. The mixture was centrifuged at 10,000 rpm for 15 min in a centrifuge (HERMLE, Z236K, Gosheim, Germany). A total of 200 μL of supernatant was taken and mixed with 1.5 mL of Folin–Ciocalteu, in addition to 1.5 mL of sodium bicarbonate at 0.55 M. The resulting mixture was kept in darkness for 90 min., After this, absorbance was recorded (Thermo Fisher Scientific, GENESYS 10S, Chengdu, China) at 725 nm. A calibration curve was produced in the range from 0 to 0.2 mg mL−1, with gallic acid expressed as gallic acid equivalents per gram (GAE g−1).

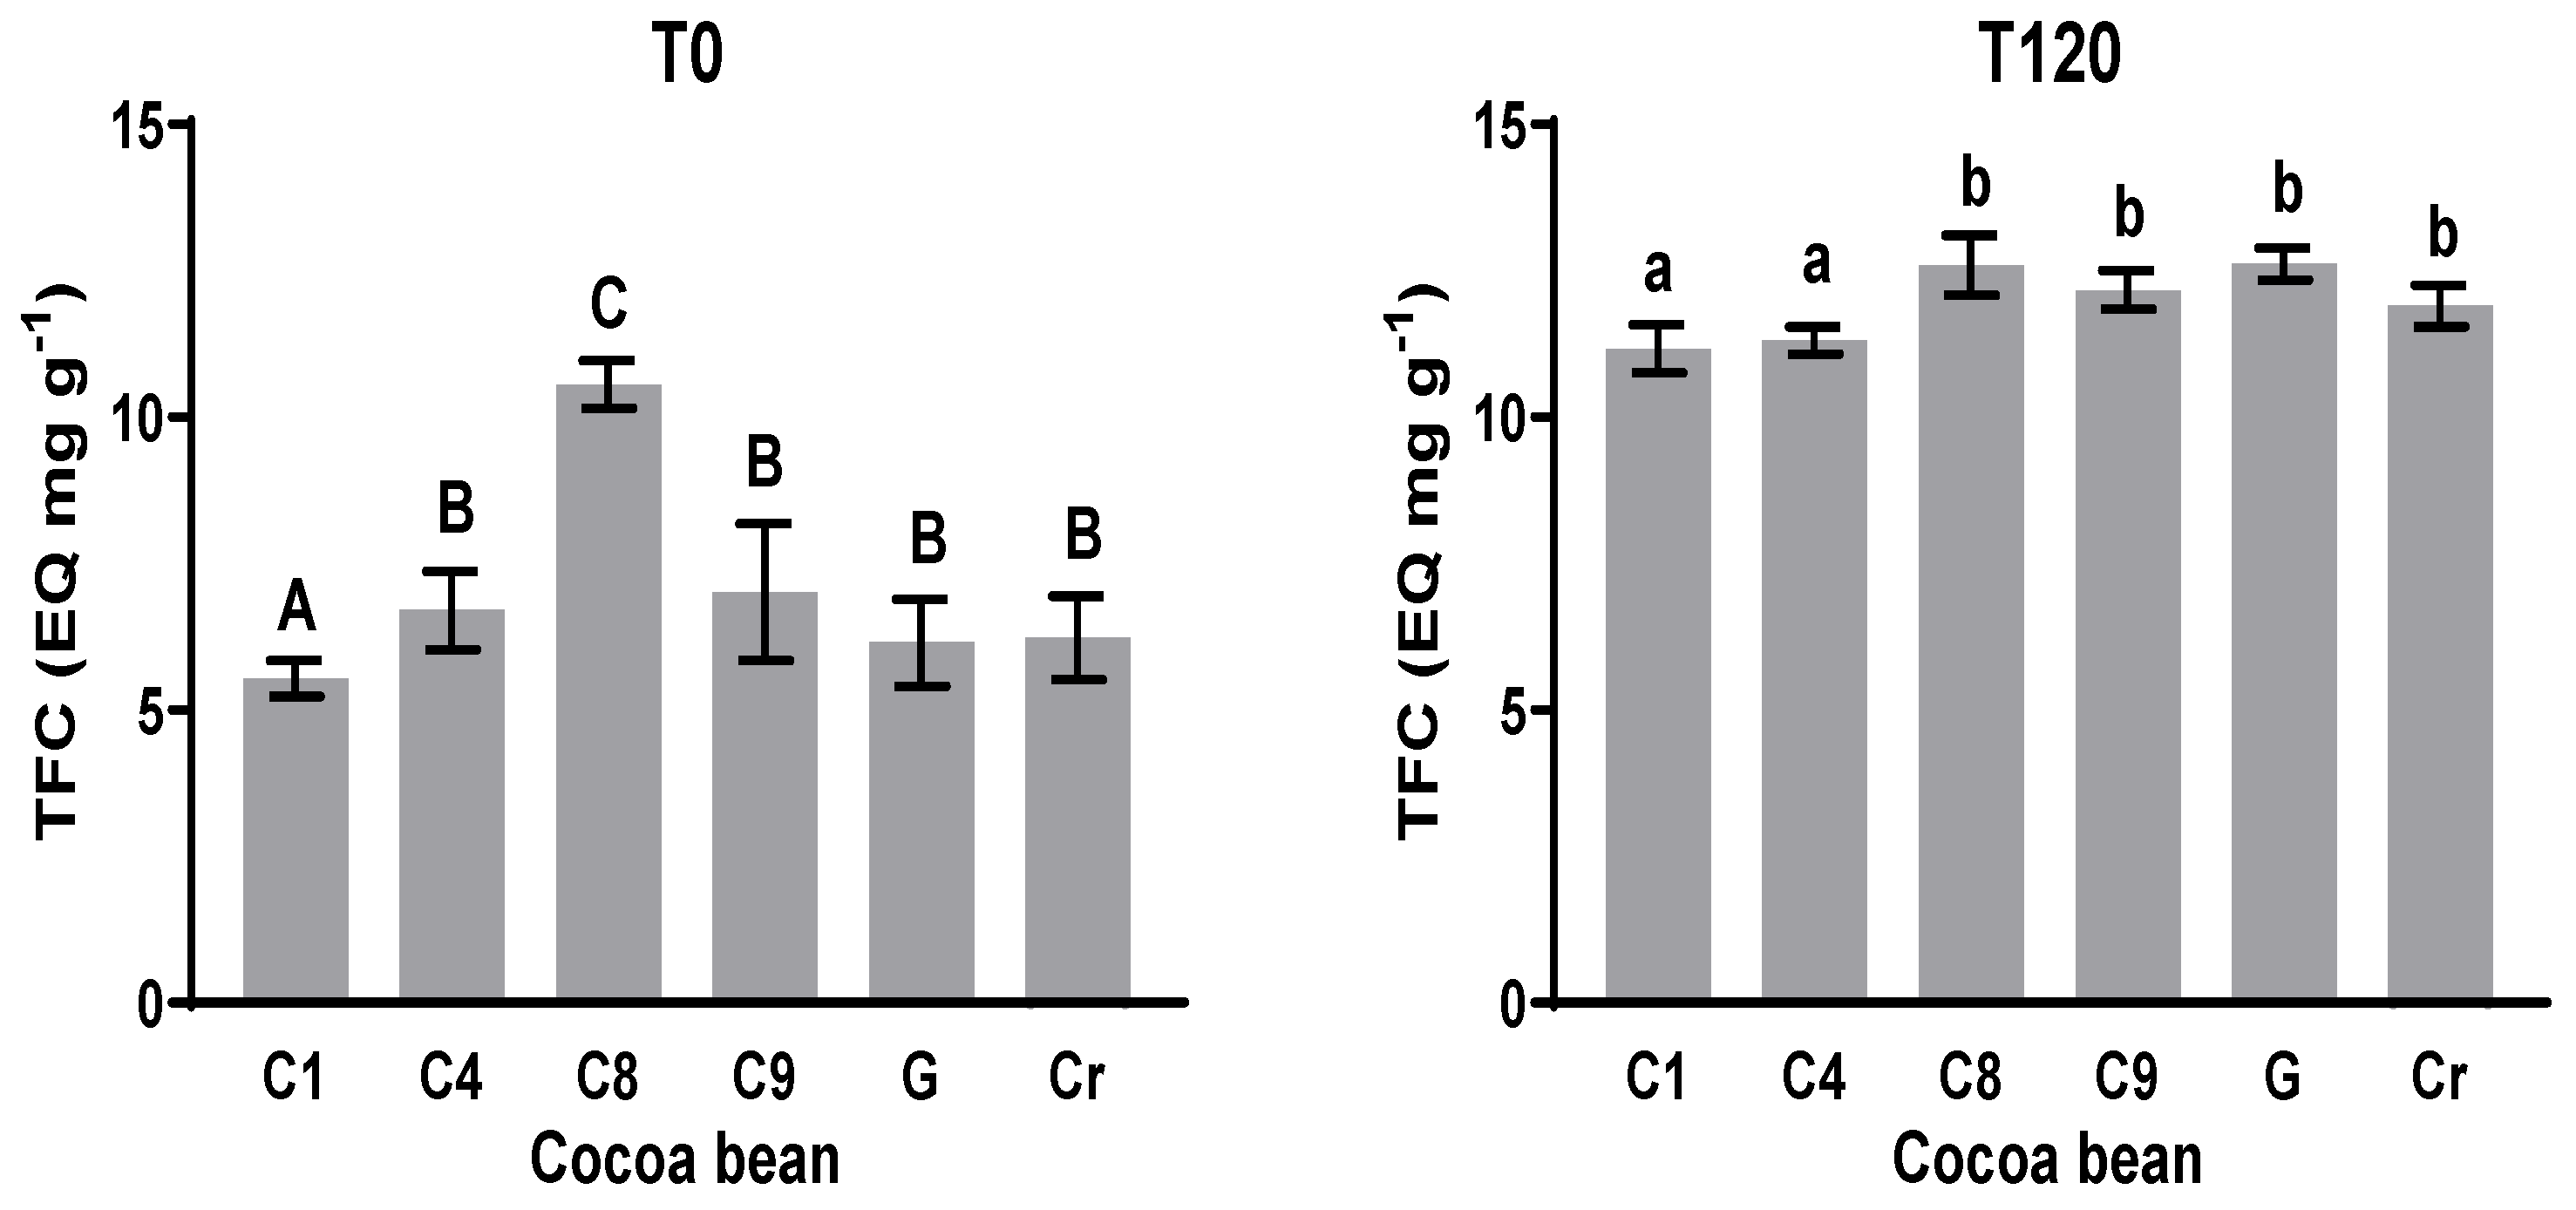
2.5.2. Total Flavonoids Content (TFC)

The method described by Zhishen, Mengcheng, and Jianming [28] was used. A sample of 0.2 g of dehydrated and defatted (Soxhlet method) cotyledon was extracted with 2 mL of distilled water at room temperature for 2 h using an orbital stirrer (Thermo Scientific, 2346, China) at 200 rpm. The mixture was centrifuged at 1000 rpm for 15 min in a centrifuge (HERMLE, Z236K, Gosheim, Germany). A total of 0.2 mL of supernatant (extract) was placed with 0.80 mL of deionized water and 0.15 mL of NaNO2 solution. After 5 min, 0.15 mL of 10% AlCl3 solution was added; at 6 min, 2.0 mL of 4% NaOH was added. Then, deionized water was added to the solution to total 5 mL. The absorbance of the final mixture was determined at 410 nm against a reaction target using a UV-Vis spectrophotometer (Thermo Fisher Scientific, GENESYS 10S, Chengdu, China). A calibration curve was prepared with Quercetin in the range from 0 to 1 mg mL−1 and is expressed as sample Quercetin equivalents/g (mg EQ g−1).

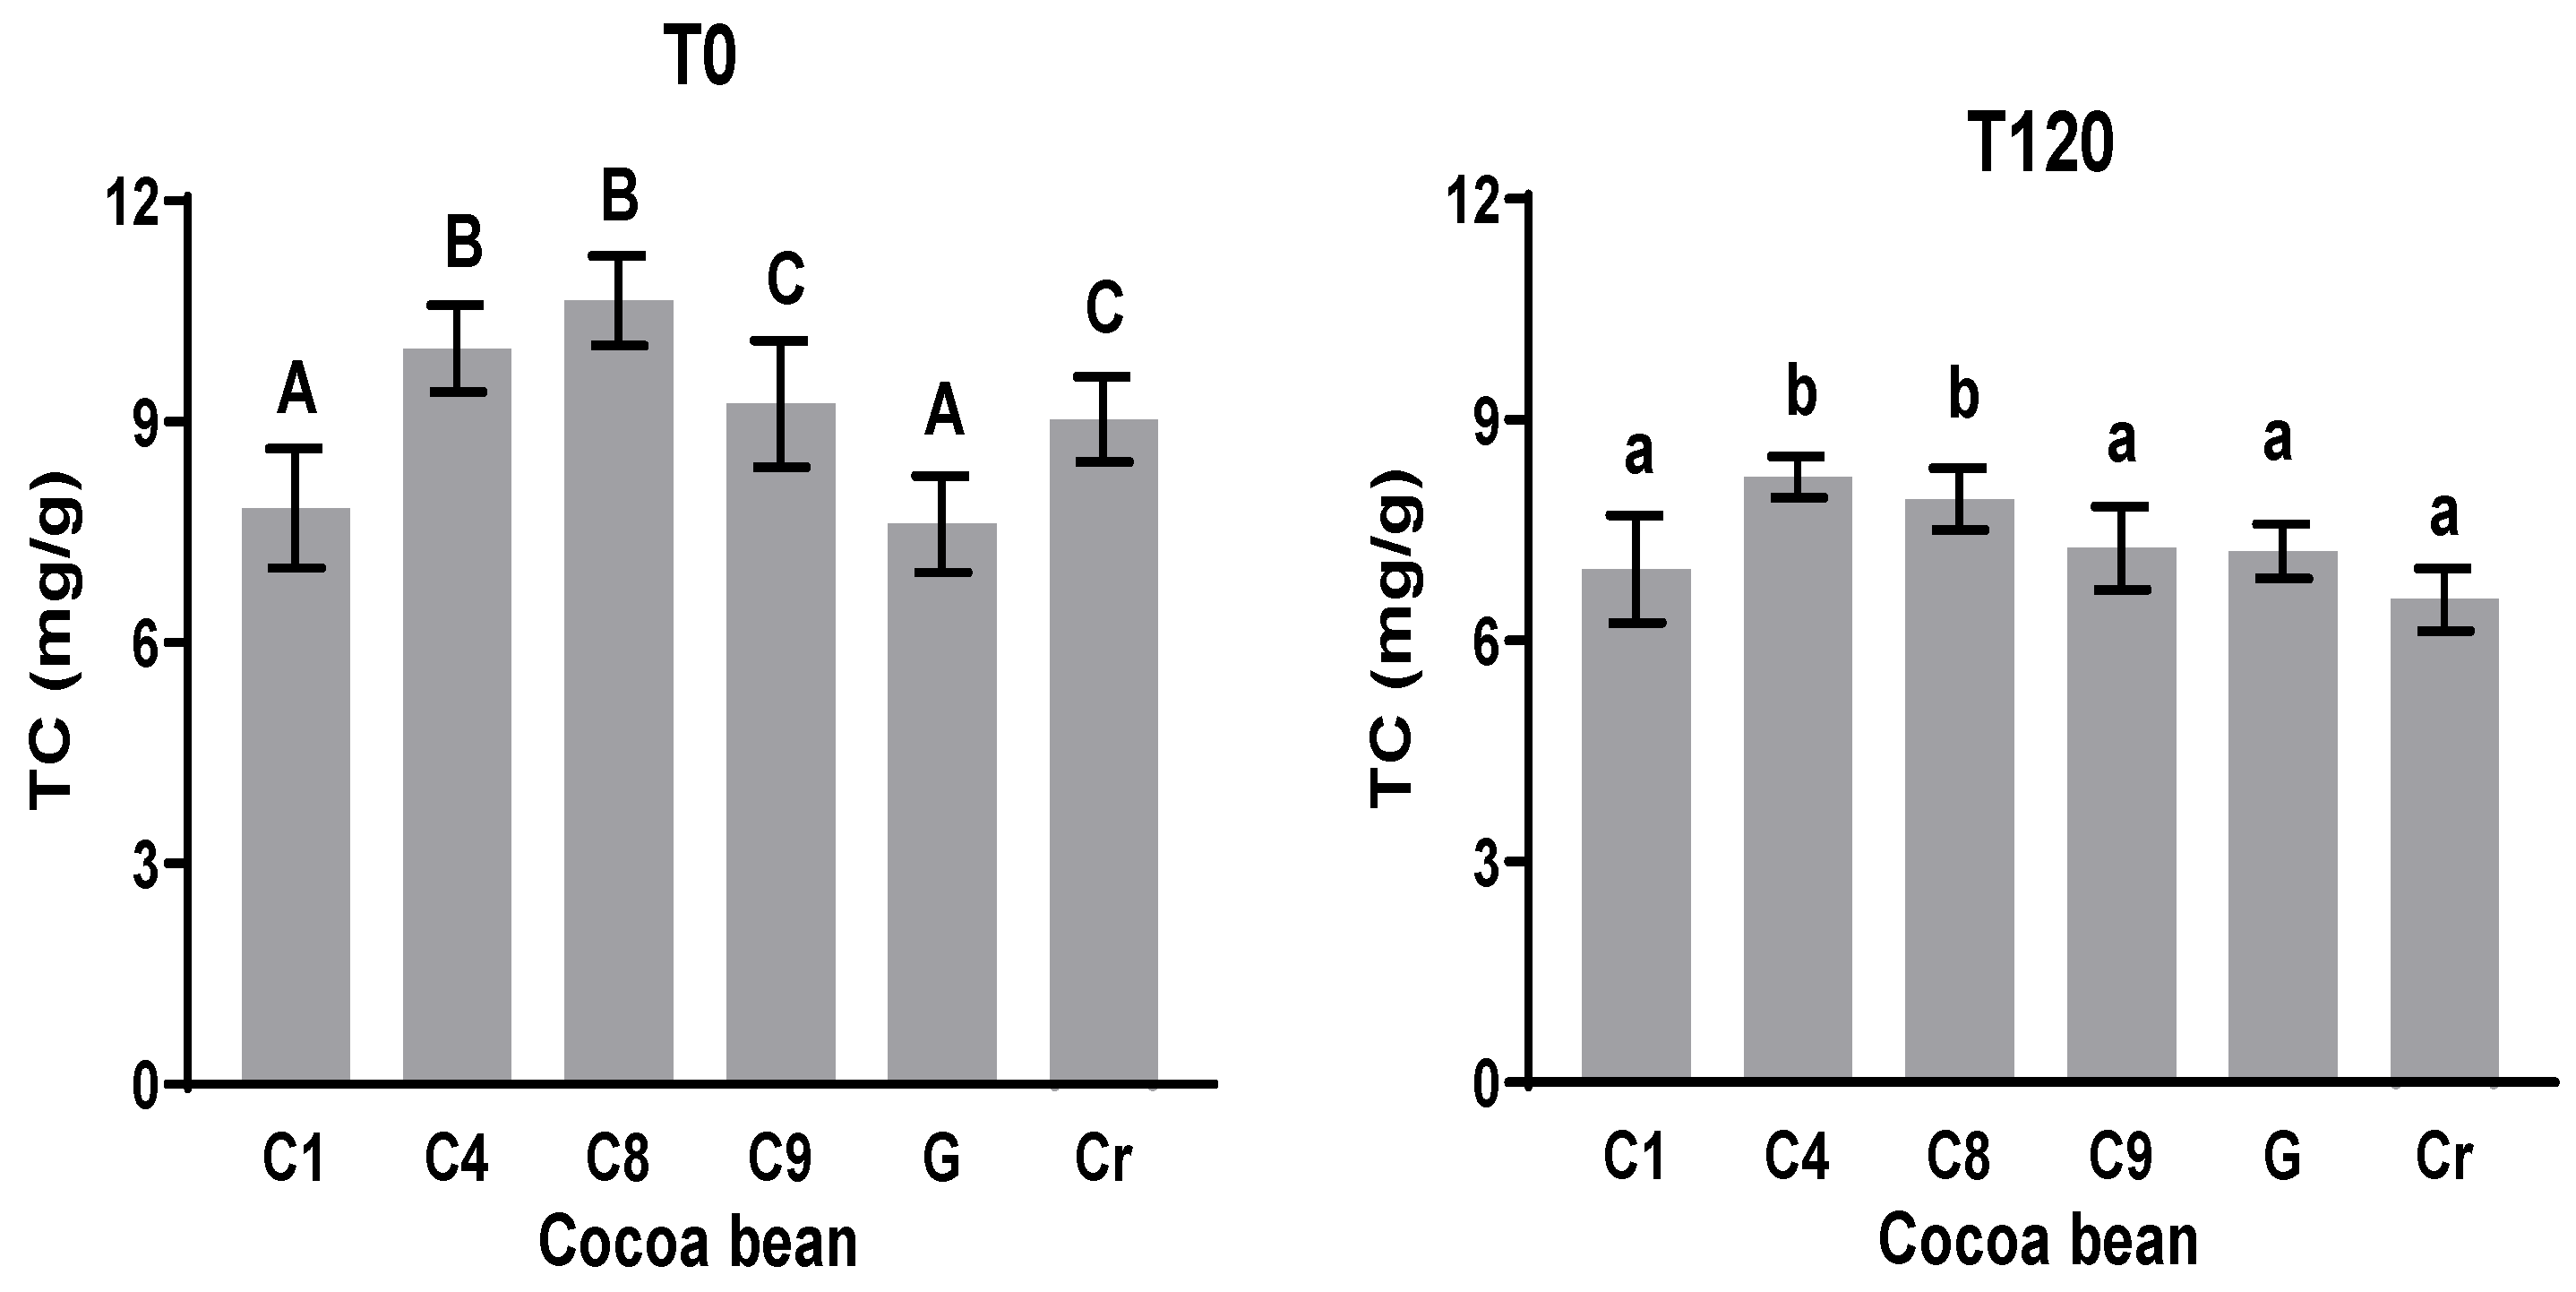
2.5.3. Methylxanthine Contents (Theobromine (TC) and Caffeine (CC))

The technique described by Peralta-Jiménez and Cañizares-Macías [29] was used. A sample of 0.25 g of dehydrated and defatted cocoa was mixed with 25 mL of deionized water at 80 °C, and ultrasonic probe extraction was performed (BIOBASE, UCD-250, Jinan, China) at 240 W for 180 s. A total of 1.25 mL of Carrez 1 reagent was added to the extract, left to cool, and then filtered. Between 1.25 and 2 g of NaHCO3 was added to the filtrate, and then it was filtered a second time. The filtrate was adjusted to 25 mL with boiled distilled water; 5 mL of the filtrate was taken and adjusted to a pH between 12.5 and 12.7. After this, 5 mL of chloroform was added and placed in the ultrasonic probe at 80 °C at 160 W per 30 s for extraction, and then the mixture was centrifuged (HERMLE, Z236K, Gosheim, Germany) for 10 min at 10,000 rpm. A total of 80 μL of the aqueous phase was adjusted to 2 mL with bi-distillated water. The absorbance of theobromine was recorded at 272.7 nm using a UV-Vis spectrophotometer (Thermo Fisher Scientific, GENESYS 10S, Chengdu, China). For caffeine determination, 200 μL of the organic phase was adjusted to 2 mL with chloroform, and the absorbance was measured at 275 nm. For determinations, curves of the standard solutions of 0–50 μg of theobromine and caffeine were produced.

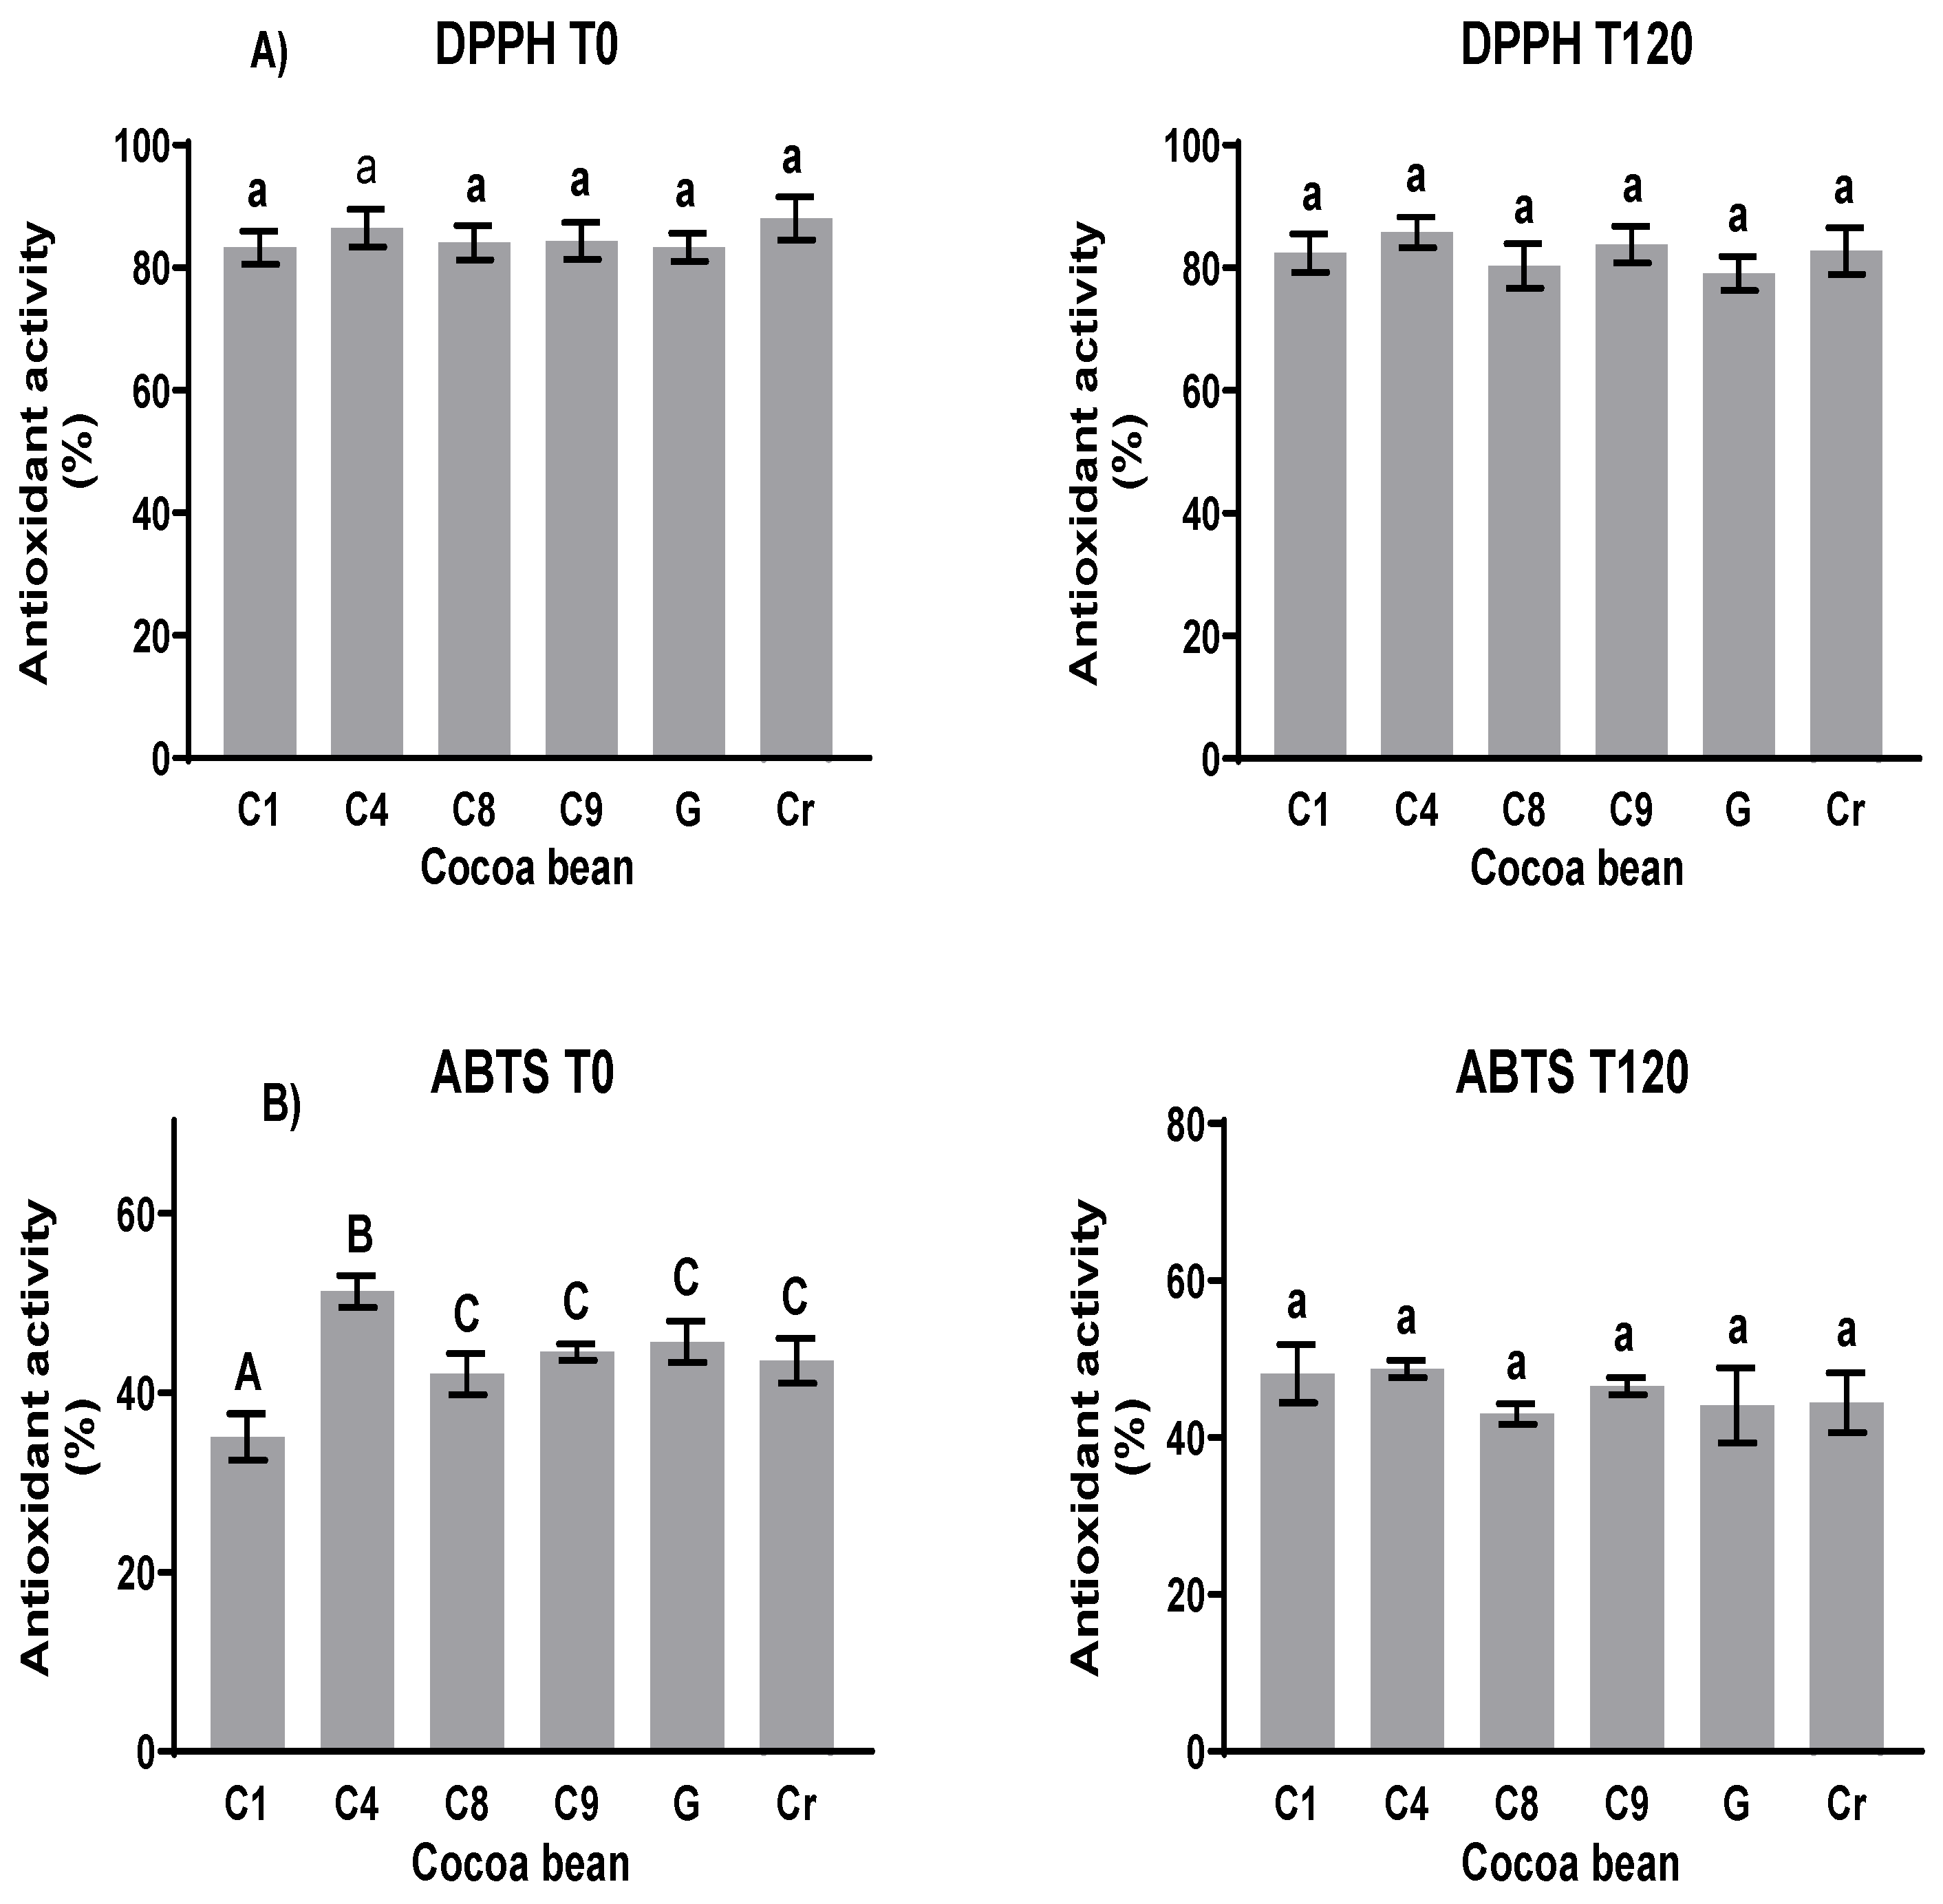
2.5.4. Antioxidant Activity Determination

The determination of antioxidant activity was performed using three methods: DPPH according to Lai et al. [30], ABTS by RE et al. [31], and the ferric reducing antioxidant power (FRAP) assay according to the instructions provided by Sigma-Aldrich (Cat. No. MAK369, Sigma-Aldrich assay kit). For determinations, the extracts were prepared in a ratio of 1:25 of the defatted sample with 70% aqueous solution with ethanol, and then stirred for 2 h at 50 °C using an orbital stirrer (Thermo Scientific, Model 2346, Chengdu, China). The mixture was filtered using a Buchner funnel, and the filtrate obtained was used for the determination of antioxidant activity.

2.5.5. Cocoa FTIR-ATR Analysis

For the FT-IR analysis of cocoa, 0.1 g of the sample was deposited directly on a diamond ATR glass plate, which was carefully cleaned with acetone to eliminate the presence of residues between measurements and dried in the environment after each experiment to ensure undesirable substances were removed. The spectra were observed using an FTIR spectrometer (Model Frontier, Perkin Elmer, Buckinghamshire, UK) coupled to an attenuated total reflectance (ATR) accessory equipped with a ZnSe reflection crystal. The spectra were obtained in triplicate for all the samples and averaged with 32 scans/sample in the range from 4000 to 400 cm−1 at a resolution of 4 cm−1. With the spectra obtained, baseline correction, noise level reduction (13-point smoothing), and normalization were carried out using the Spectrum 10 software of the FTIR Perkin-Elmer spectrophotometer. Twelve spectra were exported in .csv format for the data matrix for chemometric analysis. The absorbance values of the FTIR spectra were used as variables during the classification of the fat samples from different regions using ACP chemometrics.

2.6. Statistical Analyses

The trials were conducted in triplicate, and the results were analyzed using the statistical model of the comparison of means in the MINTAB program 17 (Minitab Statistical Software). Tukey’s test with a 5% significance level was performed for the separation of the means.

3. Results

3.1. pH Changes

Biochemical changes in both sides of the cocoa beans occurred during fermentation; the pH changed in both sides of the shell. The pH of the pulp can be described in three stages: in the first 36 h, the pH ranged from low to <4; the second phase was dominated by lactic acid bacteria; and in the third phase, the conversion of alcohol to acetic acid occurred [2]. In the cotyledon, there were three pH changes; in the first 48 h, the pH decreased from 6.7–7.0 to 6.5–6.7; in the second stage, the pH decreased from 6.5–6.7 to 5.3–5.5; and in the third step, the pH decreased from 5.3–5.5 to 5.0–5.3 (Figure S3a, Supplementary Material). The acidity in the first 48 h (T48) increased slightly from 0.28 to 0.3 ± 0.05; at T96, the acidity significantly increased to values of 0.93 ± 0.05; and at the end of fermentation (T120), the acidity increased to 1.15 ± 0.05 (Supplementary Materials, Figure S3b).

3.2. Fermentation Index (FI)

The FIs for all four clones and two cocoa varieties were determined throughout the fermentation period every 48 h. Figure 1 shows the changes in absorbance of the A460/A530 ratios of the cocoa bean samples at different fermentation times. For the Criollo (Cr) variety, the absorbance at 530 nm did not change, while the absorbance at 460 nm increased; for this reason, the A460/A530 ratio increased to a value close to 2.5 (Figure 1b). The absorbance spectrum for all the samples showed clearly how the absorbances at 460 and 530 vary during the fermentation period in the clones (C1, IC4, CP8, and C9) and G. The clones (C1, C4, C8, and C9) and the native variety of Guayaquil (G) followed the same absorbance behavior at 460 nm, which increased, while the absorbance at 530 decreased according to the FI (Supplementary Materials, Figure S4). That of the Criollo (Cr) variety FI increased during fermentation; however, the absorbance at 530 did not change (Figure S4).
The results analyzed for all the clones and the native varieties G and Cr are shown. The FI increased moderately for all the clones after the first 48 h (about 2 days). Then, in the next 48 h (96 h of fermentation), the FI increased significantly; this might be attributed to the biochemical changes in some components in the cotyledon. One documented change is the hydrolysis from anthocyanins to anthocyanidin via the action of glycosidases; the anthocyanidins formed oxidized to the quinone compounds. This reaction contributes to the formation of the brown color characteristic of a fermented grain, coinciding with the data obtained by Torres et al. [32]; Horta-Tellez et al. [33]; and Zapata, S., Tamayo, A. [34]. The change in color might relate to the biochemical characteristics of the genetic origins of each variety.
FI values smaller than 1 indicate insufficient fermentation, values between 1 and 1.2 indicate correct fermentation, and values above 1.2 indicate over-fermented cocoa, as indicated by Teneda [35]. According to this statement, the native variety Guayaquil and the clone C1 showed FI values of 0.89 and 0.94, respectively; these two samples needed more time to ferment. The clones C4 and C8 reached a value of one after 120 h (about 5 days). C9 reached a value of one from 96 h (about 4 days); this indicates that this clone fermented 24 h early (Torres et al. [32] and Teneda [35]). This determination has not been confirmed for the native variety Criollo according to what was mentioned by Elwers et al. [36]; they point out that these varieties, although rich in polyphenolic antioxidants, have no or almost no anthocyanins. However, from the data obtained in this work for the Criollo variety, the absorbance at 460 nm decreased during fermentation; even the absorbance at 530 nm no changes were observed. According to these results, the FI for Cr may denote that a smaller value of 2.4 indicates insufficient fermentation, values between 2.4 and 2.5 denote correct fermentation, and values up to 2.5 indicate over-fermentation.

3.3. Total Polyphenol Content (TPC)

The TPC more significantly increased at T120 (120 h of fermentation) as compared with that at the initial time (Figure 2 T0) in all the cases. The TPC at T0 in C1, C4, C9, G, and Cr showed no significant statistical difference (p < 0.05); values from 20.2 to 20.4 mg EAG g−1 were recorded. For C8 at T0, a value of 67.02 mg EAG g−1 was recorded (Figure 2 T0), which shows a significant statistical difference with the others. In all the cocoa samples, the TPC at T0 showed an increase in comparison with the TPC at T120, with significant statistical differences in each sample. The clones C1, C4, and G exhibited no significant statistical difference in TPC at the final time (T120), with values between 53.4 and 84.2 mg EAG g−1. These data suggest that during the fermentation period, the phenolic compounds suffered chemical transformation according to Zapata, S., Tamayo, A. [34], and Niemenak et al. [37]. The influence of the final TPC and the formation of new compounds via biochemical reactions during fermentation may have an important impact on the final aromatic and bioactive characteristics of cacao and the fermented product, respectively. One of these modifications is the formation of polymeric proanthocyanidins (Niemenak et al. [37]) as reactions which involve polyphenol compounds.
The changes in the content of polyphenols can be attributed to biochemical reactions during the fermentation process because these compounds undergo oxidation to form quinones, as described by Wollgast and Anklam [38]. The other aspects to consider regarding the TPC in cacao are its geographical origin, the degree of maturity at the time of harvest, the variety, and the post-harvest operations. These influence the content of phenolic compounds [39]. However, during fermentation, very important changes occurred in the phenolic compounds.

3.4. Total Flavonoids Content (TFC)

The total flavonoids content (TFC) was measured at the initial T0 and final times T120 (Figure 3). The TFC value at T0 was between 5.5 and 10.6 mg EQ g−1; it was between 11.2 and 12.6 mg EQ g−1 at T120. The values at T0 in comparison with the values of TFC at T120 show a significant statistical difference in all the cases. The TFCs for C1 and C8 were smallest and largest at T0, respectively. The values for C4, C9, G, and Cr showed no significant statistical difference at T0. The TFC values at T120 of C1 and C4 showed no significant differences, while the TFC values of C8, C9, G, and Cr showed no significant statistical difference at T120. In the case of C8, there was a statistical difference between T0 and T120, but the difference was less noticeable than the others.
Polyphenols, such as catechin, epicatechin, anthocyanidins, cyanidin-3-galactoside, and cyanidin-3 arabinoside, have been documented in the cotyledon of cacao, but the concentration seems to be genotype-dependent. These purple pigments are hydrolyzed by glycosidases, resulting in the bleaching of the cotyledon [39]. According to HPLC analysis, epicatechin is the most represented component of this fraction and was not affected like the methylxanthines were; from these data, it can be assumed that the TFC increased during fermentation until T120. Neither catechin nor epicatechin were found in Cr using HPLC.

3.5. Methylxanthines (Theobromine (TC) and Caffeine (CC))

Methylxanthines in cacao are formed mainly by theobromine and caffeine. The amount of these compounds seems to be modified during the post-harvest processes. In this work, the initial and final amounts of methylxanthines were quantified. Theobromine at T0 varies from 7.6 to 10.6 mg g−1, while theobromine at T120 varies from 3.0 to 3.7 mg g−1. The amount of theobromine decreases significantly in all the samples. The theobromine amount at time 0 (T0) showed significant differences in all the samples, except for C9 and Cr, with a theobromine content of approximately 7.7 mg g−1. However, C8 showed more theobromine than the others did (10.6 mg g−1), as observed in Figure 4. The theobromine content decreased in all the samples, with the lowest content in Cr of 6.6 mg g−1. The theobromine content slightly decreased by 5% in the G variety. The percentage of reduction in this alkaloid during fermentation agrees with the report of Camino et al. [40], in which between 20 and 25% of theobromine was lost during the fermentation step. In this work, 25% of theobromine out of the initial content was lost in C8.
The caffeine concentrations (CCs) of all the samples at T0 and T120 during the fermentation process are shown in Figure 5. The caffeine content varied from 3.1 to 4.1 mg g−1 at the initial time T0 in the unfermented samples, highlighting the value of 4.1 mg g−1 presented by the Cr variety. After fermentation (T120), all the samples showed a reduced concentration between 3 and 26%. The largest reduction in caffeine quantity (26%) was observed in the Cr sample, and G experienced the lowest reduction (3%). For the clones C1, C4, C8, and C9, the CC showed no significant statistical differences at T120. This behavior coincides with those observed by Rojas-Rojas, Hernández-Aguirre, and Mencía-Guevara [41], where up to 24% of this alkaloid was lost after fermentation.
The initial theobromine and caffeine contents of the cocoa clones and natives vary according to the variety and agroclimatic conditions (Kongor et al. [9] and Vázquez-Ovando et al. [42]). These values are higher when fermentation begins, and their reduction after fermentation is mainly due to diffusion, as well as the exudates during the fermentation process [43].

3.6. Antioxidant Capability Determination

The antioxidant activity values (Figure 6A) determined via the DPPH test were between 80 and 87% at the beginning of fermentation (T0) and 80 and 88% at the end (T120). The new cocoa clones that presented a greater unfermented capture capacity were C4 with 85.3% and G with 86.1%. After fermentation, there were no significant statistical changes in the antioxidant activity of the clones. Regarding the natives, the capture capacity of G reduced by more than 6%. In the ABTS test (Figure 6), the values were between 39 and 55% at the beginning and between 38 and 54% at the end. Among the clones, C8 had a lower capture capacity of 46%, while the rest of the clones had values above 53%, and the native clones had a greater capture capacity of 52%. After fermentation, the capture capacity was reduced for both the clones and natives by about 5%.
The electron capture capabilities of the clones and native cocoa according to the three methods used in this work are shown. No significant changes in antioxidant activity using the DPPH method were observed during the fermentation process. Using the ABTS method, only that of C4 decreased after fermentation. These results contrast with those of Ortiz et al. [44] using the ABTS and FRAP methods; during the fermentation process, the antioxidant activity decreased. Although the antioxidant activity was determined using the FRAP method in this study, those of the two clones decreased and those of the others increased (Figure S6). The DPPH and ATBS radical scavenging activities reflect the hydrogen-donating capacity of cocoa due to the presence of bioactive substances. FRAP evaluation determines the antioxidant potential according to the reducing power. A study performed by Rajurkar and Hande [45] revealed that the phenolic compounds exhibited a much higher correlation with reducing power than with DPPH free radical scavenging activity. Thus, it could be assumed that the phenolic compounds from fermented cocoa beans provide antioxidant protection directly through the reduction in the oxidized intermediate in the chain reaction.

3.7. FTIR-ATR Spectroscopy of Fat-Free Cocoa

The cocoa samples were analyzed using FTIR-ATR after the defatting treatment. Each cocoa bean type was analyzed at T0 and T120 of the fermentation period. All the samples showed a similar profile at T0 or T120. In Figure 7, the scan profiles of C1 and G are shown in two wavenumber ranges. In each wavenumber range, a pronounced difference was observed between T0 and T120 (Figure 7). The important changes in picks 400–650, 1048–1160, and 1377–1407 showed significant reductions at time T120. However, the peak at 1744 cm−1 increased at T120, corresponding to the N-H and C = O bending vibrations (Table 2). The wavenumber from 1800 to 3400 cm−1 exhibits a decrease from 3009 to 3347 cm−1 at time T120. The ranges from 2853 to 2928 increased at 2852 and 2918 for the CH2 and CH3 stretching vibrations (Figure 7).
The functional groups can be assigned to a range of wavenumbers. At 3000–3350, O-H and N-H stretching signals appeared; in the defatted cocoa, a peak at 3280 was detected, and it decreased at T120 in all the samples. The other FTIR scans of the defatted cocoa C4, C8, C9, and Cr are shown in Figure S6.

4. Conclusions

During the fermentation process, the cotyledon of the cocoa bean undergoes physicochemical and biochemical changes. The pH of the cotyledon decreases for two reasons; one is the acidification of the cotyledon due to acetic acid entering the seeds, and the other is enzyme activity effects on the lipids, proteins, and carbohydrates. The fermentation index (FI) goes from 0.47 ± 0.04 to 1.001 ± 0.12 in all the INIFAP clones and Guayaquil, while for Criollo, FI values from 1.3 to 2.5 were recorded. The number of compounds absorbed at 460 nm increased, and those absorbed at 530 nm decreased in the clones and Guayaquil. Moreover, in the Criollo beans, the number of compounds absorbed at 460 nm increased, but in the compounds absorbed at 530, no changes were observed. With these data, a final FI of 2.5 for the Criollo variety indicates a successful fermentation. The increase in total phenolic compounds is likely due to an increase in the flavonoid content. According to the DPPH and ABTS determination methods, the antioxidant capability was not affected after 120 h of fermentation. However, for the Criollo variety, a significant difference was observed using the FRAP method, perhaps due to its redox reducing capacity. The amount of methylxanthines did not affect the antioxidant potential of the fermented cocoa. The FTIR scan of the fat-free cocoa showed significant differences between the unfermented and fermented beans, and several peaks assigned to carbohydrates and protein decreased. The changes in the proteins and carbohydrates might be due to the enzymatic activity during the fermentation period.

Supplementary Materials

The following supporting information can be downloaded at https://www.mdpi.com/article/10.3390/fermentation10080405/s1. Figure S1: The pods of the types of cocoa used; Figure S2: Fermentation system; Figure S3: (a) Changes in pH (a) and acidity (b) in the cotyledon during fermentation; Figure S4: (a) UV-VIS spectra of C1 during the fermentation time: C4, C8, C9, and G showed similar spectra. (b) UV-VIS spectra of Cr during fermentation time (in the absorbance at 530, no changes were observed); Figure S5: Antioxidant activity of cocoa material determined using the FRAP method; Figure S6: FTIR scanning of defatted cocoa. (a–d) Scan profiles for the 2600–3600 cm−1 segment for C4, C8, C9, and Cr samples, respectively. (e–h) Scan profiles for the 400–1800 segment cm−1 for C4, C8, C9, and Cr samples, respectively.

Author Contributions

Conceptualization, F.L.R.-S. and P.G.-A.; data curation, E.O.-S. and D.J.J.-R.; formal analysis, F.L.R.-S. and D.J.J.-R.; funding acquisition, F.J.M.-R.; investigation, F.L.R.-S.; methodology, A.C.-L. and C.R.-L.; project administration, F.J.M.-R.; resources, F.J.M.-R. and P.G.-A.; supervision, P.G.-A.; validation, F.J.M.-R. and P.G.-A.; visualization, E.O.-S.; writing—original draft, F.L.R.-S.; writing—review and editing, F.J.M.-R. All authors have read and agreed to the published version of the manuscript.

Funding

This work was financed by Fondo Mixto of CONACYT-Gobierno de Tabasco No. TAB-2018-01-01-84312 and Internal Project-IPN, SIP-20210919.

Institutional Review Board Statement

Not applicable.

Informed Consent Statement

Not applicable.

Data Availability Statement

The original contributions presented in the study are included in the article/Supplementary Material, further inquiries can be directed to the corresponding author.

Acknowledgments

We thank the División Academica de Ciencias Agricolas of the Universidad Juárez Autónoma de Tabasco and the Instituto Politécnico Nacional for the support with infrastructure for the experimental realization of this project. The authors thank IBB Blanca Estela Rodríguez González for HPLC analysis. The authors thank the Sistema Nacional de Investigadores (SNII).

Conflicts of Interest

The authors declare no conflicts of interest.

References

  1. Voigt, J.; Heinrichs, H.; Voigt, G.; Biehl, B. Cocoa-Specific Aroma Precursors Are Generated by Proteolytic Digestion of the Vicilin-like Globulin of Cocoa Seeds. Food Chem. 1994, 50, 177–184. [Google Scholar] [CrossRef]
  2. Barišić, V.; Kopjar, M.; Jozinović, A.; Flanjak, I.; Ačkar, D.; Miličević, B.; Šubarić, D.; Jokić, S.; Babić, J. The Chemistry behind Chocolate Production. Molecules 2019, 24, 3163. [Google Scholar] [CrossRef] [PubMed]
  3. Schnermann, P.; Schieberle, P. Evaluation of Key Odorants in Milk Chocolate and Cocoa Mass by Aroma Extract Dilution Analyses. J. Agric. Food Chem. 1997, 45, 867–872. [Google Scholar] [CrossRef]
  4. Voight, J.; Lieberei, R. Biochemistry of Cocoa Fermentation. In Cocoa and Coffee Fermentations; Fleet, G.H., Schwan, R.F., Eds.; CRC Press: Boca Raton, FL, USA, 2015; pp. 194–216. Available online: https://www.worldcat.org/title/cocoa-and-coffee-fermentations/oclc/893680375 (accessed on 21 February 2023).
  5. Escobar, S.; Santander, M.; Zuluaga, M.; Chacon, I.; Rodriguez, J.; Vaillant, F. Fine Cocoa Beans Production: Tracking Aroma Precursors through a Comprehensive Analysis of Flavor Attributes Formation. Food Chem. 2021, 365, 130627. [Google Scholar] [CrossRef]
  6. Ozturk, G.; Young, G.M. Food Evolution: The Impact of Society and Science on the Fermentation of Cocoa Beans. Compr. Rev. Food Sci. Food Saf. 2017, 16, 431–455. [Google Scholar] [CrossRef] [PubMed]
  7. Gibson, M.; Newsham, P. Chocolate/Cacao. In Food Science and the Culinary Arts; Academic Press: Cambridge, MA, USA, 2018; pp. 341–352. [Google Scholar] [CrossRef]
  8. Hernández, C. Análisis de La Composición Química Del Cacao, Extracción y Estudio de Compuestos Antioxidantes En Genotipos Del Banco de Germoplasma de México. Ph.D. Thesis, Universidad de Sevilla, Sevilla, Spain, 2018. Available online: https://idus.us.es/handle/11441/82298 (accessed on 1 July 2024).
  9. Kongor, J.E.; Hinneh, M.; de Walle, D.V.; Afoakwa, E.O.; Boeckx, P.; Dewettinck, K. Factors influencing quality variation in cocoa (Theobroma cacao) bean flavour profile—A review. Food Res. Int. 2016, 82, 44–52. [Google Scholar] [CrossRef]
  10. Dos Santos, C.M.; de Cerqueira e Silva, A.B.; de Lima Silva Marques, E.; Rezende, R.P.; Pirovani, C.P.; Ferreira, A.C.R.; Andrade, L.M.; Wellington da Cruz Santos, D.; Díaz, A.M.; Soares, M.R.; et al. Biotechnological Starter Potential for Cocoa Fermentation from Cabruca Systems. Braz. J. Dev. 2021, 7, 60739–60759. [Google Scholar] [CrossRef]
  11. Kadow, D. The Biochemistry of Cocoa Flavor—A Holistic Analysis of Its Development along the Processing Chain. J. Appl. Bot. Food Qual. 2020, 93, 300–312. [Google Scholar] [CrossRef]
  12. Ordoñez-Araque, R.H.; Landines-Vera, E.F.; Urresto-Villegas, J.C.; Caicedo-Jaramillo, C.F. Microorganisms during Cocoa Fermentation: Systematic Review. Foods Raw Mater. 2020, 8, 155–162. [Google Scholar] [CrossRef]
  13. Diaz-Muñoz, C.; De Vuyst, L. Functional Yeast Starter Cultures for Cocoa Fermentation. J. Appl. Microbiol. 2021, 133, 39–66. [Google Scholar] [CrossRef]
  14. Fernández-Niño, M.; Rodríguez-Cubillos, M.J.; Herrera-Rocha, F.; Anzola, J.M.; Cepeda-Hernández, M.L.; Mejía, J.L.A.; Chica, M.J.; Olarte, H.H.; Rodríguez-López, C.; Calderón, D.; et al. Dissecting Industrial Fermentations of Fine Flavour Cocoa through Metagenomic Analysis. Nat. Sci. Rep. 2021, 11, 1–14. [Google Scholar] [CrossRef] [PubMed]
  15. Othman, A.; Ismail, A.; Ghani, N.A.; Adenan, I. Antioxidant Capacity and Phenolic Content of Cocoa Beans. Food Chem. 2007, 100, 1523–1530. [Google Scholar] [CrossRef]
  16. Calixto-Cotos, M.R.; Chire-Fajardo, G.C.; Orihuela-Rivera, C.A. Antioxidants Properties of Chocolates Sold in Peru. Acta Agron. 2018, 67, 479–485. [Google Scholar] [CrossRef]
  17. Ramos-Escudero, F.; Casimiro-Gonzales, S.; Fernández-Prior, A.; Chávez, K.C.; Gómez-Mendoza, J.; de la Fuente-Carmelino, L.; Muñoz, A.M. Colour, Fatty Acids, Bioactive Compounds, and Total Antioxidant Capacity in Commercial Cocoa Beans (Theobroma Cacao L.). LWT Food Sci. Technol. 2021, 147, 111629. [Google Scholar] [CrossRef]
  18. Cueto-Moreno, J.; Aguirre-Medina, J.F.; Zamarripa-Colmenero, A.; Iracheta-Donjuan, L.; De los Santos, A.O. El Mejoramiento del Cultivo de Cacao (Theobroma cacao L.) en México; INIFAP: Tuxtla Chico, Mexico, 2007.
  19. Mendoza, A.; Gallardo, R.; Avendaño, C. El Mundo del Cacao (Theobroma cacao L.). Agroproductividad 2011, 4, 2. [Google Scholar]
  20. Solis, J.L.; Zamarripa, A.; Pecina, V.; Garrido, E.; Hernández, E. Evaluación Agronomica de Híbridos de Cacao (Theobroma Cacao L.) Para Selección de Alto Rendimiento y Resistencia en Campo a Monoliasis. Rev. Mex. Cienc. Agrícolas 2015, 6, 71–82. [Google Scholar]
  21. Rivera-Torrez, D.L.; Lagunes-Galvez, L.M.; Azpeitia-Morales, A.; Garcia-Alamilla, P. Reproductive and Morphological Phenology of Eight Mexican Cacao Clones (Theobroma cacao L.). AgroProductividad 2022, 15, 157–167. [Google Scholar] [CrossRef]
  22. Bordiga, M.; Locatelli, M.; Travaglia, F.; Coïsson, J.D.; Mazza, G.; Arlorio, M. Evaluation of the Effect of Processing on Cocoa Polyphenols: Antiradical Activity, Anthocyanins and Procyanidins Profiling from Raw Beans to Chocolate. Food Sci. Technol. 2015, 50, 840–848. [Google Scholar] [CrossRef]
  23. Seguine, E.; Mills, D.; Marelli, J.-P.; Motomayor-Arias, J.-C.; Da Silvia Coelho, I. Micro-Fermentation of Cocoa. U.S. Patent 2,0140,199,437A1, 17 July 2014. WO 2013/025621 Al, issued 2013. [Google Scholar]
  24. Gourieva, K.B.; Tserrevitinov, O.B. Method of evaluating of degree of fermentation of cocoa beans. USRR Patent 646254, 5 February 1979. [Google Scholar]
  25. Ooi, T.S.; Ting, A.S.Y.; Siow, L.F. Influence of Selected Native Yeast Starter Cultures on the Antioxidant Activities, Fermentation Index and Total Soluble Solids of Malaysia Cocoa Beans: A Simulation Study. Food Sci. Technol. 2020, 122, 108977. [Google Scholar] [CrossRef]
  26. García-González, E.; Ochoa-Muñoz, A.; Montalvo-Rodriguez, C.; Ordoñez-Narváez, A.; Londoño-Hernández, L. Sucesión Microbiana Durante la Fermentación Espontánea de Cacao en Unidades Productivas. Cienc. Desarro. 2021, 12, 21–30. [Google Scholar] [CrossRef]
  27. Singleton, V.L.; Rossi, J.A. Colorimetry of total phenolics with phosphomolybdic-phosphotungstic acid reagents. Am. J. Enol. Vitinicult. 1965, 16, 144–158. [Google Scholar] [CrossRef]
  28. Zhishen, J.; Mengcheng, T.; Jianming, W. The Determination of Flavonoid Contents in Mulberry and Their Scavenging Effects on Superoxide Radicals. Food Chem. 1999, 64, 555–559. [Google Scholar] [CrossRef]
  29. Peralta-Jiménez, L.; Cañizares-Macías, M.P. Ultrasound-Assisted Method for Extraction of Theobromine and Caffeine from Cacao Seeds and Chocolate Products. Food Bioprocess Technol. 2013, 6, 3522–3529. [Google Scholar] [CrossRef]
  30. Lai, L.S.; Chou, S.T.; Chao, W.W. Studies on the Antioxidative Activities of Hsian-Tsao (Mesona procumbens Hemsl) leaf gum. J. Agric. Food Chem. 2001, 49, 963–968. [Google Scholar] [CrossRef] [PubMed]
  31. Re, R.; Pellegrini, N.; Proteggente, A.; Pannala, A.; Yang, M.; Rice-Evans, C. Antioxidant activity applying an improved abts radical cation decolorization assay. EMPA Act. 1999, 26, 1231–1237. [Google Scholar] [CrossRef] [PubMed]
  32. Torres, O.; de Fariñas, L.G.; de Bertorelli, L.O.; Trujillo, A. Efecto Del Tiempo Transcurrido Entre La Cosecha y El Desgrane de La Mazorca Del Cacao Tipo Forastero de Cuyagua Sobre Características Del Grano En Fermentación. Agron. Trop. 2004, 54, 7430776. [Google Scholar]
  33. Horta-Tellez, H.; Sandoval-Aldana, A.; García-Muñoz, M.; Cerón-Salazar, I. Evaluation of the Fermentation Process and Final Quality of Five Cacao Clones from Departament Of Huila, Colombia. DYNA 2019, 86, 233–239. [Google Scholar] [CrossRef]
  34. Zapata, S.; Tamayo, A.; Rojano, B. Efecto de La Fermentación Sobre la Actividad Antioxidante de Diferentes Clones de Cacao Colombiano. Rev. Cuba. Plantas Med. 2013, 18, 391–404. [Google Scholar]
  35. Teneda-Llerena, W.F. Mejoramiento del Proceso de Fermentación del Cacao (Theobroma cacao L.) Variedad Nacional y Variedad CCN51; Editorial; Universidad Internacional de Andalucía: Sevilla, Spain, 2016. [Google Scholar] [CrossRef]
  36. Elwers, S.; Zambrano, A.; Rohsius, C.; Lieberei, R. Differences between the Content of Phenolic Compounds in Criollo, Forastero and Trinitario Cocoa Seed (Theobroma cacao L.). Eur. Food Res. Technol. 2009, 229, 937–948. [Google Scholar] [CrossRef]
  37. Niemenak, N.; Rohsius, C.; Elwers, S.; Ndoumou, D.O.; Lieberei, R. Comparative Study of Different Cocoa (Theobroma cacao L.) Clones in Terms of Their Phenolics and Anthocyanins Contents. J. Food Compos. Anal. 2006, 19, 612–619. [Google Scholar] [CrossRef]
  38. Wollgast, J.; Anklam, E. Review on Polyphenols in Theobroma cacao: Changes in Composition during the Manufacture of Chocolate and Methodology for Identification and Quantification. Food Res. Int. 2000, 33, 423–447. [Google Scholar] [CrossRef]
  39. Melo, T.S.; Pires, T.C.; Engelmann, J.V.P.; Monteiro, A.L.O.; Maciel, L.F.; da Silva Bispo, E. Evaluation of the Content of Bioactive Compounds in Cocoa Beans during the Fermentation Process. J. Food Sci. Technol. 2021, 58, 1947–1957. [Google Scholar] [CrossRef] [PubMed]
  40. Camino, C.; Espin, S.; Samaniego, I.; Carpio, C. Comparación de los Niveles de Grasa, Alcaloides y Polifenoles Totales en Almendras de Cacao Nacional Fino de Aroma de Diferentes Zonas del Litoral Ecuatoriano. Aliment. Cienc. Ing. 2014, 22, 34–40. Available online: https://repositorio.iniap.gob.ec/bitstream/41000/3280/1/iniapscCD69.pdf (accessed on 23 July 2024).
  41. Rojas-Rojas, K.; Hernández-Aguirre, C.; Mencía-Guevara, A. Transformaciones Bioquímicas Del Cacao (Theobroma cacao L.) Durante Un Proceso de Fermentación Controlada. Agron. Costarric. 2021, 45, 53–65. [Google Scholar] [CrossRef]
  42. Vázquez-Ovando, A.; Ovando-Medina, I.; Adriano-Anaya, L.; Betancur-Ancona, D.; Salvador-Figueroa, M. Alcaloides y Polifenoles del Cacao, Mecanismos que Regulan su Biosíntesis y sus Implicaciones en el Sabor y Aroma. Arch. Latinoam. Nutr. 2016, 656, 239–254. [Google Scholar]
  43. Lima, L.J.R.; Almeida, M.H.; Nout, M.J.R.; Zwietering, M.H. Theobroma cacao L., ‘the Food of the Gods’: Quality Determinants of Commercial Cocoa Beans, with Particular Reference to the Impact of Fermentation. Crit. Rev. Food Sci. Nutr. 2011, 51, 731–761. [Google Scholar] [CrossRef] [PubMed]
  44. Ortiz, J.; Chungara, M.; Ibieta, G.; Alejo, I.; Tejeda, L.; Peralta, C.; Aliaga-Rossel, E.; Mollinedo, P.; Peñarrieta, J.M. Determinación de Teobromina, Catequina, Capacidad Antioxidante Total y Contenido Fenólico Total en Muestras Representativas de Cacao Amazónico Boliviano y su Comparación antes y después del Proceso de Fermentación. Rev. Boliv. Química 2019, 36, 40–50. [Google Scholar] [CrossRef]
  45. Rajurkar, N.S.; Hande, S.M. Estimation of phytochemical content and antioxidant activity of some selected traditional indian medicinal plants. Indian J. Pham. Sci. 2011, 73, 146–151. [Google Scholar] [CrossRef]
Figure 1. Fermentation index of clones and native varieties during the fermentation step. (a) FI changes for C1, C4, C8, C9, and G; (b) FI for changes for Cr variety.
Fermentation 10 00405 g001
Figure 2. Total polyphenol content before (T0) and after (T120) fermentation of clones and natives. Means with the same letter are not significantly different according to ANOVA with Tukey’s test (p < 0.05) for each sample.
Fermentation 10 00405 g002
Figure 3. Total flavonoid content (TFC) at initial and final times during fermentation process. Means with the same letter are not significantly different according to ANOVA with Tukey’s test (p < 0.05) for each sample.
Fermentation 10 00405 g003
Figure 4. Theobromine content (TC) at initial and final times during fermentation process. Different letters between columns indicate significant differences (p < 0.05) for each sample.
Fermentation 10 00405 g004
Figure 5. Caffeine content (CC) before and after fermentation of clones and native varieties. Different letters between columns indicate significant differences (p < 0.05) for each sample.
Fermentation 10 00405 g005
Figure 6. Capture electron capability of clones and natives before and after fermentation. (A) DPPH and (B) ABTS methods. Different letters between columns indicate significant differences (p < 0.05) for each sample.
Fermentation 10 00405 g006
Figure 7. FTIR-AT scanning of defatted cocoa. (a,b) Scan profile for segment 2600–3600 cm−1 for C1 and G samples, respectively. (c,d) Scan profile for segment 400–1800 cm−1 for C1 and G samples, respectively.
Fermentation 10 00405 g007
Table 1. Genotype characteristics of the clones.
CloneOrigin
INIFAP 1 (C1)The parents are RIM 76A X EET 400. The RIM 76A genotype corresponds to a clonal selection of a Criollo genotype from Mexico, and with respect to the EET 400 genotype, it is a commercial clonal hybrid from Ecuador.
INIFAP 4 (C4)The parents are RIM 75 X POUND 7. The RIM 75 genotype corresponds to a clonal selection of a Criollo genotype from Mexico, and with respect to the POUND 7 genotype, it corresponds to a clonal selection from Trinidad and Tobago.
INIFAP 8 (C8)The parents are RIM 76A X EET 48. The RIM 76A genotype corresponds to a clonal selection of a Criollo genotype from Mexico, and with respect to the EET 48 genotype, it corresponds to a clonal selection from Ecuador
INIFAP 9 (C9)The parents are RIM 75 X SPA 9. The RIM 75 genotype corresponds to a clonal selection of a Criollo genotype from Mexico, and with respect to the SPA 9 genotype, it corresponds to a clonal selection from Colombia.
Table 2. Functional groups found in cocoa during fermentation period. Changes after 120 h (T120).
Number of WavenumbersFTIR Range Peaks (cm−1)Functional GroupsT0 Peaks T120 Peaks
13000–3350O-H and N-H stretching32803280↓
22853–2928CH2 and CH3 stretching vibrations29182852↑
28522852↑
31634–1744N-H bending vibrations, C=O bending vibrations17441744↑
16461646↓
41540–1550Aromaticity15501550↓
51399–1457CH3 lipids/proteins and COO- of amino acids14471447↓
61377–1407Primary or secondary O-H bending (in-plane), and phenol or tertiary alcohol (O-H bend)13801380↓
12241224↓
71048–1160C-O stretching vibrations11431143↓
10481048↓
8721–997C-H bending vibrations763763↓
9400–700 513513↓
Disclaimer/Publisher’s Note: The statements, opinions and data contained in all publications are solely those of the individual author(s) and contributor(s) and not of MDPI and/or the editor(s). MDPI and/or the editor(s) disclaim responsibility for any injury to people or property resulting from any ideas, methods, instructions or products referred to in the content.

