Article

Investigation of Biofilm Formation on Air Cathodes with Quaternary Ammonium Compounds in Microbial Fuel Cells

1
Institute of Chemical and Electrochemical Process Engineering, Clausthal University of Technology, 38678 Clausthal-Zellerfeld, Germany
2
Environmental Technology Research Center, Clausthal University of Technology, 38678 Clausthal-Zellerfeld, Germany
*
Author to whom correspondence should be addressed.
Fermentation 2024, 10(8), 408; https://doi.org/10.3390/fermentation10080408
Submission received: 9 July 2024 / Revised: 30 July 2024 / Accepted: 2 August 2024 / Published: 7 August 2024
(This article belongs to the Special Issue Advance in Microbial Electrochemical Technologies)

Abstract

:
The use of gas diffusion electrodes (GDEs) in microbial fuel cells (MFCs) can improve their cell performance, but tends to cause fouling. In order to allow long-term stable operation, the search for antifouling methods is necessary. Therefore, an antibacterial coating with ammonium compounds is investigated. Within the first 30 days of operation, the maximum measured power density of a GDE with antibacterial ionomer was 606 mW m−2. The GDE without an antifouling treatment could only reach a maximum of 284 mW m−2. Furthermore, there was an optimum in the loading amount with ionomer below 2.6 mg cm−2. Further investigations showed that additional aeration of the GDEs by a fan had a negative effect on their performance. Despite the higher performance, the antibacterial coating could not prevent biofilm growth at the surface of the GDE. The thickness of the biofilm was only reduced by 14–16%. However, the weight of the biofilm on the treated GDEs was 62–80% less than on a GDE without an antifouling treatment. Consequently, the coating cannot completely prevent fouling, but possibly leads to a lower density of the biofilm or prevents clogging of the pores inside the electrodes and improves their long-term stability.

1. Introduction

Energy-efficient and resource-conserving water management can make an important contribution to energy transition in the future. Due to their ability to purify wastewater and generate electricity at the same time, microbial fuel cells (MFCs) have increasingly become the focus of research. However, there are still many challenges that must be overcome to enable a technical and commercialized application of MFCs. In particular, increasing performance while using low-cost materials is crucial for large-scale application [1]. In the past, the oxygen reduction reaction (ORR) at the cathode has been found to be a limiting factor with respect to energy production [2,3,4]. Due to the low oxygen solubility in water, mass transport limits the ORR. One possibility to enhance mass transfer and power output is the use of a single-chamber system with gas diffusion electrodes (GDEs) instead of the two-chamber system [5].
However, long-term operation of MFCs using GDEs often shows a decrease in performance over time [6,7]. This effect is caused by electrode aging due to the formation of a biofilm on the GDEs and salt deposits [8,9]. The biofilm on the GDEs can influence the performance of the MFCs in different ways. For example, it forms a diffusion barrier for the transfer of protons to the cathode or hinders the transport of hydroxide ions. An accumulation of hydroxide ions at the cathode reduces its potential, and thus the overall performance of the cell. It is also possible that the aerobic bacteria from the biofilm consume some of the available oxygen and consequently less is available for the ORR. Finally, extracellular secretions such as proteins or polysaccharides that adhere to the microorganisms can also limit the catalytic activity by blocking the functional groups, changing the pore composition or the hydrophilicity [10].
For example, An et al. report an increase in charge transfer resistance by a factor of 11 within an operating time of six months. Here, the biofilm is responsible for 37% of the charge transfer resistance and another 53% is due to salt deposits on the GDE. Both lead to a reduction in performance of 36% [11].
Li et al. also document a decrease in performance of 38% within six months with an increase in the charge transfer resistance by a factor of 2.4. In addition, reduced oxygen permeability is observed as a result of biofilm growth. The mass transfer coefficient drops by 84% over six months. By removing the biofilm from the surface, the coefficient can be increased by 25% in relation to the initial value and the performance also increases by 12%. Further cleaning of the GDE in an ultrasonic bath leads to a 2.3-fold increase in oxygen diffusion and the power density also increases by 30%. Accordingly, biofouling within the GDE pores in particular leads to increased charge transfer resistance and contributes significantly to the reduction in cell performance [12].
Kiely et al. also report an increase in performance of up to 26% after the biofilm that had grown on the cathode for one year was removed. A performance increase of 118% was achieved when the GDEs were completely replaced [13].
In addition to the long-term observations, there are also studies that demonstrate a loss of performance of the MFCs within a very short time. For example, performance losses of up to 69% were measured within five weeks due to biofilm formation on the cathodes [14]. Oliot et al. report biofilm growth after just ten days, whereby a renewal of the GDE leads to a 4.3-fold increase in cell performance [15].
In order to improve the long-term stability of the GDEs, antifouling strategies become increasingly important. There is a distinction between in situ and non in situ methods. In the case of non in situ methods, for example, the GDE is removed from the MFC and subjected to heat and ultrasonic concussion [12]. It is also reported that the removal of the GDE and washing with a weak acid solution can restore the performance of AC cathodes to >85% of the initial maximum power densities [16]. Washing with NaOH could lead to a short-term improvement of the performance by approx. 320 mW m−2 [9].
Successful in situ methods include, for example, increasing the hydrophilicity and lowering the surface potential of GDEs by using the amphiphilic binder LA132 which leads to a 47.5% reduction in the protein content of the cathodic biofilm [17]. In addition, the use of biocidal agents is a way to influence biofilm growth in situ. It has already been shown that a polymer/nanosilver composite coating enhances antibacterial activity and can be used in many applications like medical devices or food package [18]. In the field of MFCs, the use of silver as biocidal agent is also already known. For example, it has been reported that coating with an Ag-Pt alloy can prevent the formation of biofilm over an operation time of 40 days [19]. The use of silver/ferrous sulfide/partly-graphitizes carbon catalysts results in maximum measured power densities of 1361 ± 20 mW m−2, which is higher than those without additional coating (483 ± 14 mW m−2) [20]. Using enrofloxacin, a reduction of biomass content of 60.2% was observed [10]. In addition, silver nanoparticles in the GDEs lead to 5.7-fold higher power density compared to an untreated GDE [21]. Quaternary ammonium salts are also capable of killing bacteria through simple electrostatic adsorption and insertion into cell membranes [22]. The introduction of quaternary ammonium into membranes for water treatment is therefore a well-known method of preventing biofouling [23,24]. As previously shown, the use of a membrane based on those antibacterial functional groups could improve the performance of an MFC by 180 mW m−2 compared to an MFC without an antifouling strategy [25]. Li et al. showed that quaternary ammonium compounds can also be introduced directly into the catalyst layer of the GDE by forced evaporation, thereby reduce its fouling. Within two months, the maximum power density of the GDE with quaternary ammonium decreased by 21% compared to the performance decrease of 31% in the control group without biocidal agents. In this context, an average biofilm thickness of 0.2 mm was observed on the GDE with antibacterial components, while the biofilm of the untreated GDE was approximately 1 mm [26].
In this work, the antifouling effect of an ionomer consisting of a polyaromatic polymer with quaternary ammonium functional groups is investigated. This ionomer can easily be applied to the GDE as an additional layer and allows a simple manufacturing process. Different loadings as well as two different application methods of the ionomer are considered. In addition, the extent to which additional aeration promotes biofilm growth and whether the biofilm contributes to the electrical resistance of the system is examined.

2. Materials and Methods

2.1. Preparation of the Gas Diffusion Electrodes

All GDEs used were self-made by applying a catalytic coating to a stainless steel mesh with a mesh size of 100 µm × 100 µm and a wire diameter of 65 µm (DIN 1.4301/AISI 304, Spörl KG Präzisionsdrahtweberei, Sigmaringendorf, Germany). The coating contained catalysts and PTFE (TF 5135GZ, Dyneon GmbH, Neuss, Germany) in a ratio of 6:4. For catalysts, a mixture of Printex 6L carbon (Orion Engineered Carbons S.A., Houston, TX, USA), MnO2 and MoS2 (Carl Roth GmbH + Co. KG, Karlsruhe, Germany) in a ratio of 30:2:1 was used. Various studies have already shown manganese oxide to be a promising alternative to the cost-intensive platinum catalyst [27,28,29]. It has also been shown that the long-term stability of the catalyst can be increased by combining it with MoS2 [30]. All components were dispersed with a 1 wt.% methylcellulose solution (Walocel MKX 70,000 PP01, Dow Deutschland Anlagengesellschaft mbH, Bomlitz, Germany), isopropanol and deionized water using an ultrasonic sonotrode (Hielscher Ultrasonics GmbH, Teltow, Germany). Once the suspension was prepared, it was applied to the mesh with a dimension of 20 cm × 23 cm. An automatic spraying machine spread the coating evenly to both sides of the mesh using an ultrasonic nozzle (Hielscher Ultrasonics GmbH, Teltow, Germany). After the spraying process, the electrode was initially pressed at a pressure of 28.5 kg cm−2 for one minute. In a next step, the closing force was increased to 127 kg cm−2 for five minutes. During the entire process, the temperature was 130 °C. In the end, the electrode was sintered in stages up to a temperature of 330 °C. The heating rate used was 3 °C per minute, whereby the temperatures 200 °C, 250 °C, 300 °C and 330 °C were kept constant for 15 min. For sample preparation, the manufactured GDE was cut into five parts, each with a size of 25 cm2. As the spraying process has been proven to ensure a uniform coating, all samples had a loading of 9.0 mg cm−2 and consistent physical and electrochemical properties. One of the GDE samples remained untreated, while the other four electrodes were additionally treated with the ionomer Fumion® FAA-3 (Fumatech BWT GmbH, Bietigheim-Bissingen, Germany). The ionomer consists of a poly(p-phenylene ether) with quaternary ammonium functional groups. It is not soluble in water, does not decompose to or emit toxic products, and therefore fulfills the demands for use in MFCs. Kenawy et al. give a comprehensive overview of the requirements for antimicrobial polymers and factors affecting the antimicrobial activity [31].
The ionomer was previously dissolved at 5% in propanol and butanol in a ratio of 1:1 and then applied to the GDEs at different loadings (0.9 mg cm−2, 1.6 mg cm−2 and 2.6 mg cm−2) using a brush. To compare different application methods, a GDE was also sprayed with the ionomer solution (0.8 mg cm−2 (*S)).

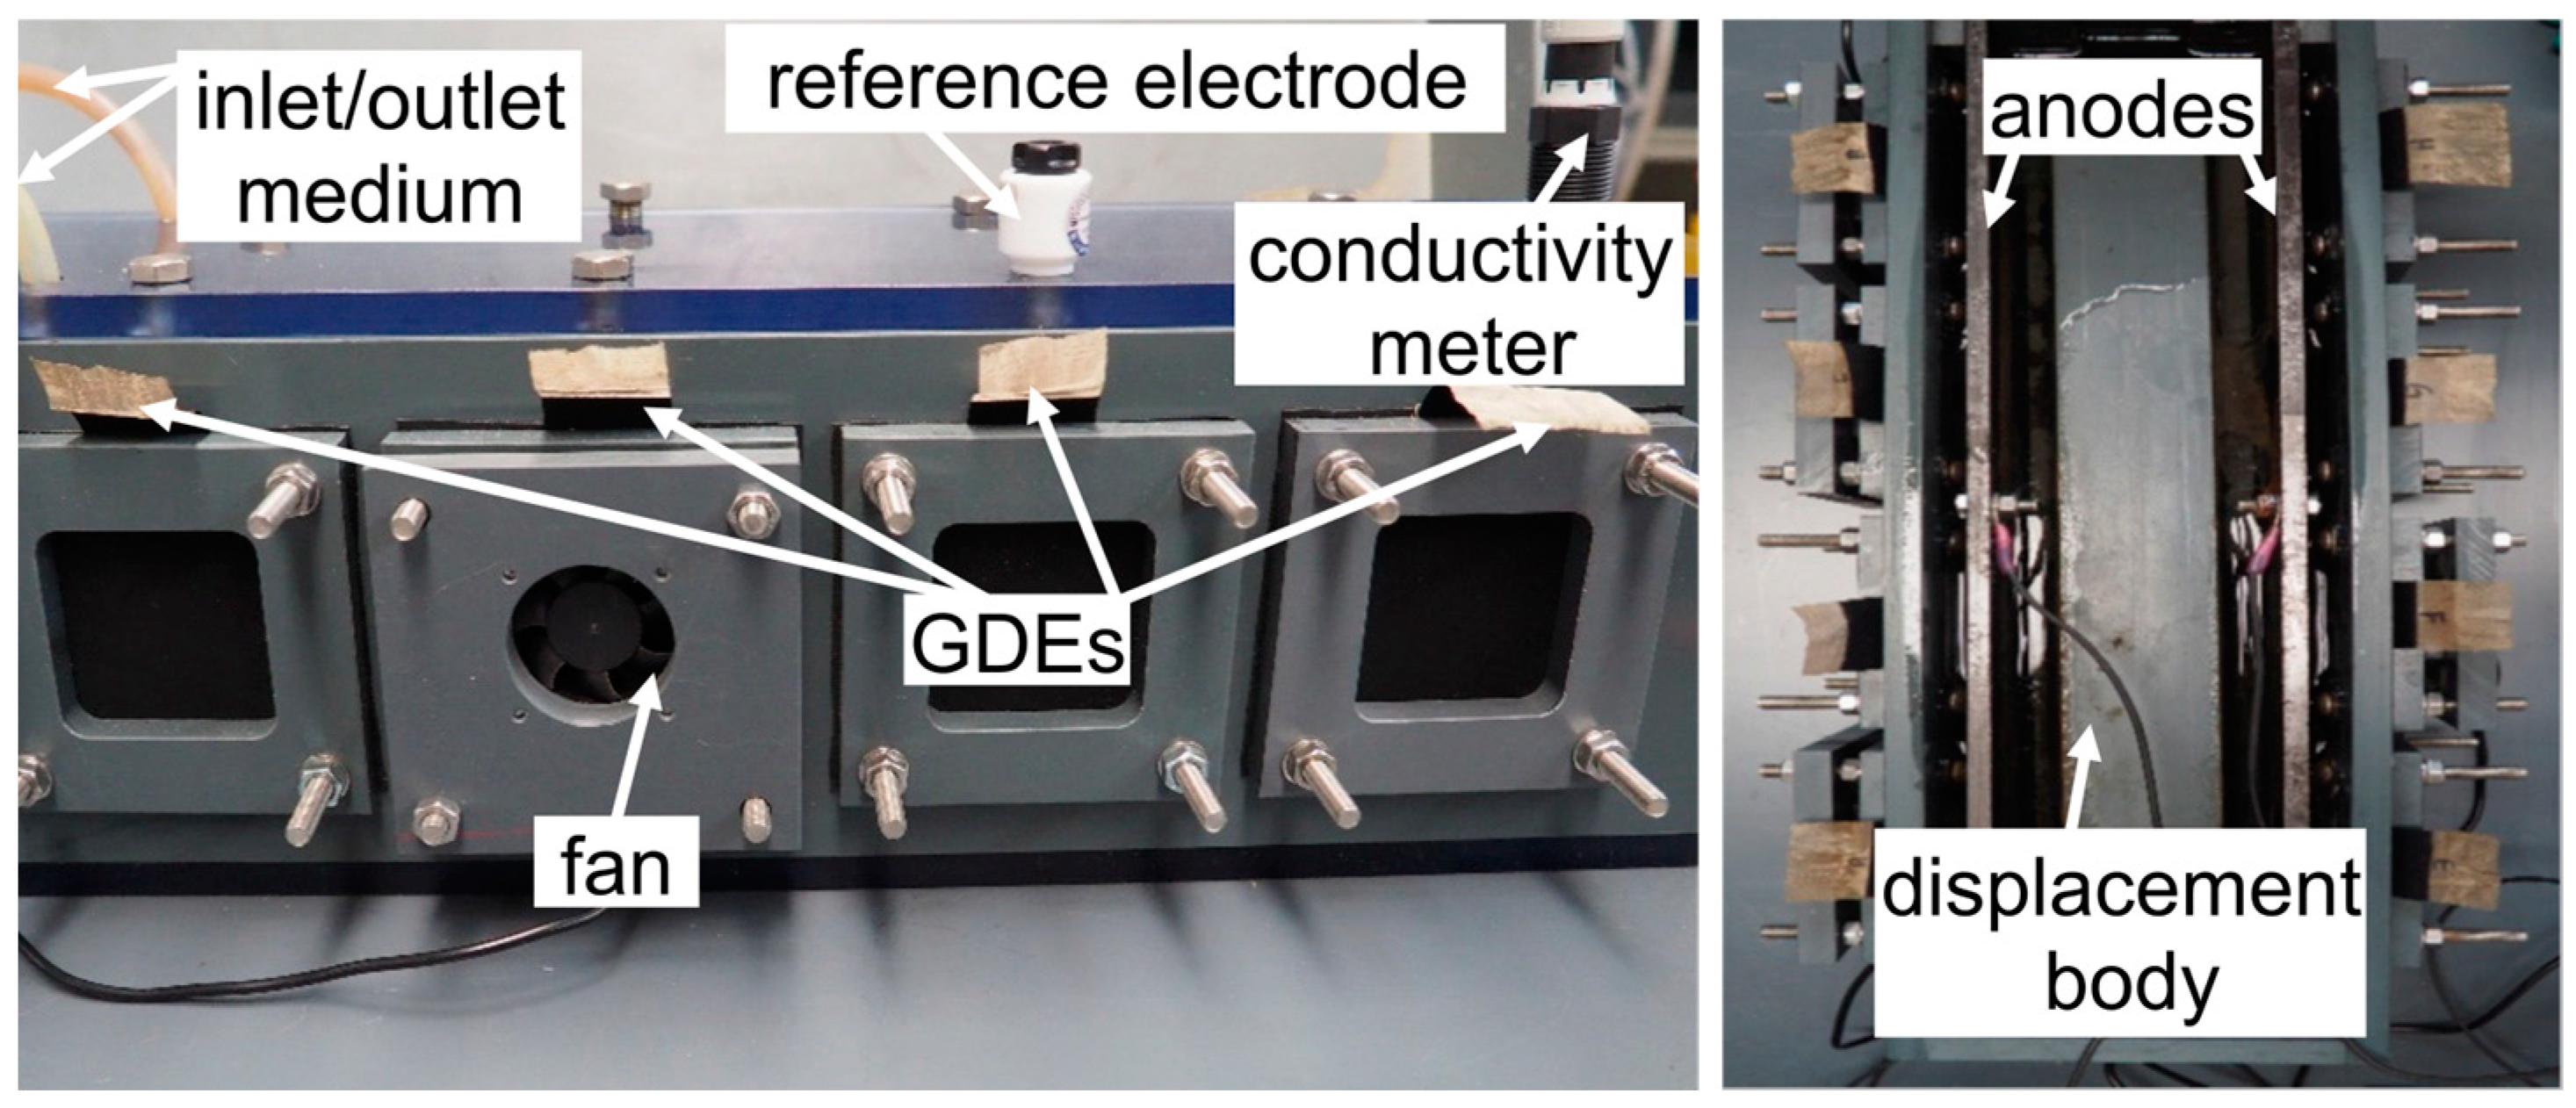
2.2. Reactor Design and Components

The inner dimensions of the reactor were 12 cm (height), 43 cm (width) and 10 cm (depth). On each of the two long sides were four slots of 5 cm × 5 cm for the insertion of the GDEs. Inside the reactor, opposite the GDEs, there were two anode plates made of a compound material with 86% graphite and 14% polypropylene as binder, called PPG86 (Eisenhuth GmbH & Co. KG, Osterode am Harz, Germany). All GDEs were connected to the respective anodes via a 10 kΩ resistor. Between each GDE and the opposite anode was a thread in the top of the reactor for placement of the hydrogen reference electrode (Gaskatel, Kassel, Germany). The reactor was filled with a displacement body to reduce the dead volume and with approx. 1.8 l wastewater from the wastewater treatment plant in Goslar. As feed, 10 mL of a solution containing 1% sodium acetate and 1% glucose was added each day. The medium was circulated using a peristaltic squeeze pump to ensure good mixing. For additional ventilation, some of the GDEs were equipped with fans (Eluteng, Wuhan, China). Figure 1 shows a photo of the reactor with all major components marked.

2.3. Measurement and Calculation

Using an Interface 1010E potentiostat (Gamry, Warminster, PA, USA), current–voltage characteristics were recorded between the GDE and a reference electrode over a period of one to three months. Therefore, the current was increased in 0.01 mA steps up to a current of 0.1 mA, then the step size was raised up to 0.1 mA and from 0.5 mA it was measured in 0.45 mA steps. Afterwards the power curve was calculated from the measurement data and the maximum power density was determined and plotted over time. In addition, electrochemical impedance spectroscopy (EIS) was made in a frequency range from 150 kHz to 0.2 Hz to identify the ohmic resistance. EIS tests were performed at an AC signal of 5 mV of amplitude. Additionally, the conductivity of the electrolyte was measured. The addition of feed solution increased the conductivity of the electrolyte over time. This inevitably led to a decrease in the electrical resistance of the system. In order to detect the possible influence of biofilm growth on the electrical resistance of the system, the influence of electrolyte conductivity had to be eliminated. For this purpose, the base resistance of the system at different conductivities was determined at the beginning of the experiment and a regression function was created. For an untreated GDE, the regression function is shown in Equation (1).
Rbase = 148,786.0337 × κ−1.1272
This allows calculation of the base resistance of the system for each conductivity. The difference between the calculated value and the measured value corresponds to the electrical resistance of the biofilm, as seen in the following Equation (2).
Rbiofilm = Rmeasured − Rbase
For the evaluation of the biofilm, the removed GDEs were cut in the middle and the cross sections were viewed under a microscope (VHX-7000, Keyence Corporation, Osaka, Japan). The thickness of the sample was measured over a length of 5 cm at 40 different measurement points according to Figure 2. To determine the thickness of the biofilm, the thickness of the GDE was subtracted. All GDEs considered were 275 ± 7 µm thick. In addition, the weight increase of the GDE caused by the biofilm was determined. For this purpose, the weight of the samples (dry state) was measured before and after the experiment. All approaches described were carried out once to examine their feasibility and effectiveness.

3. Results

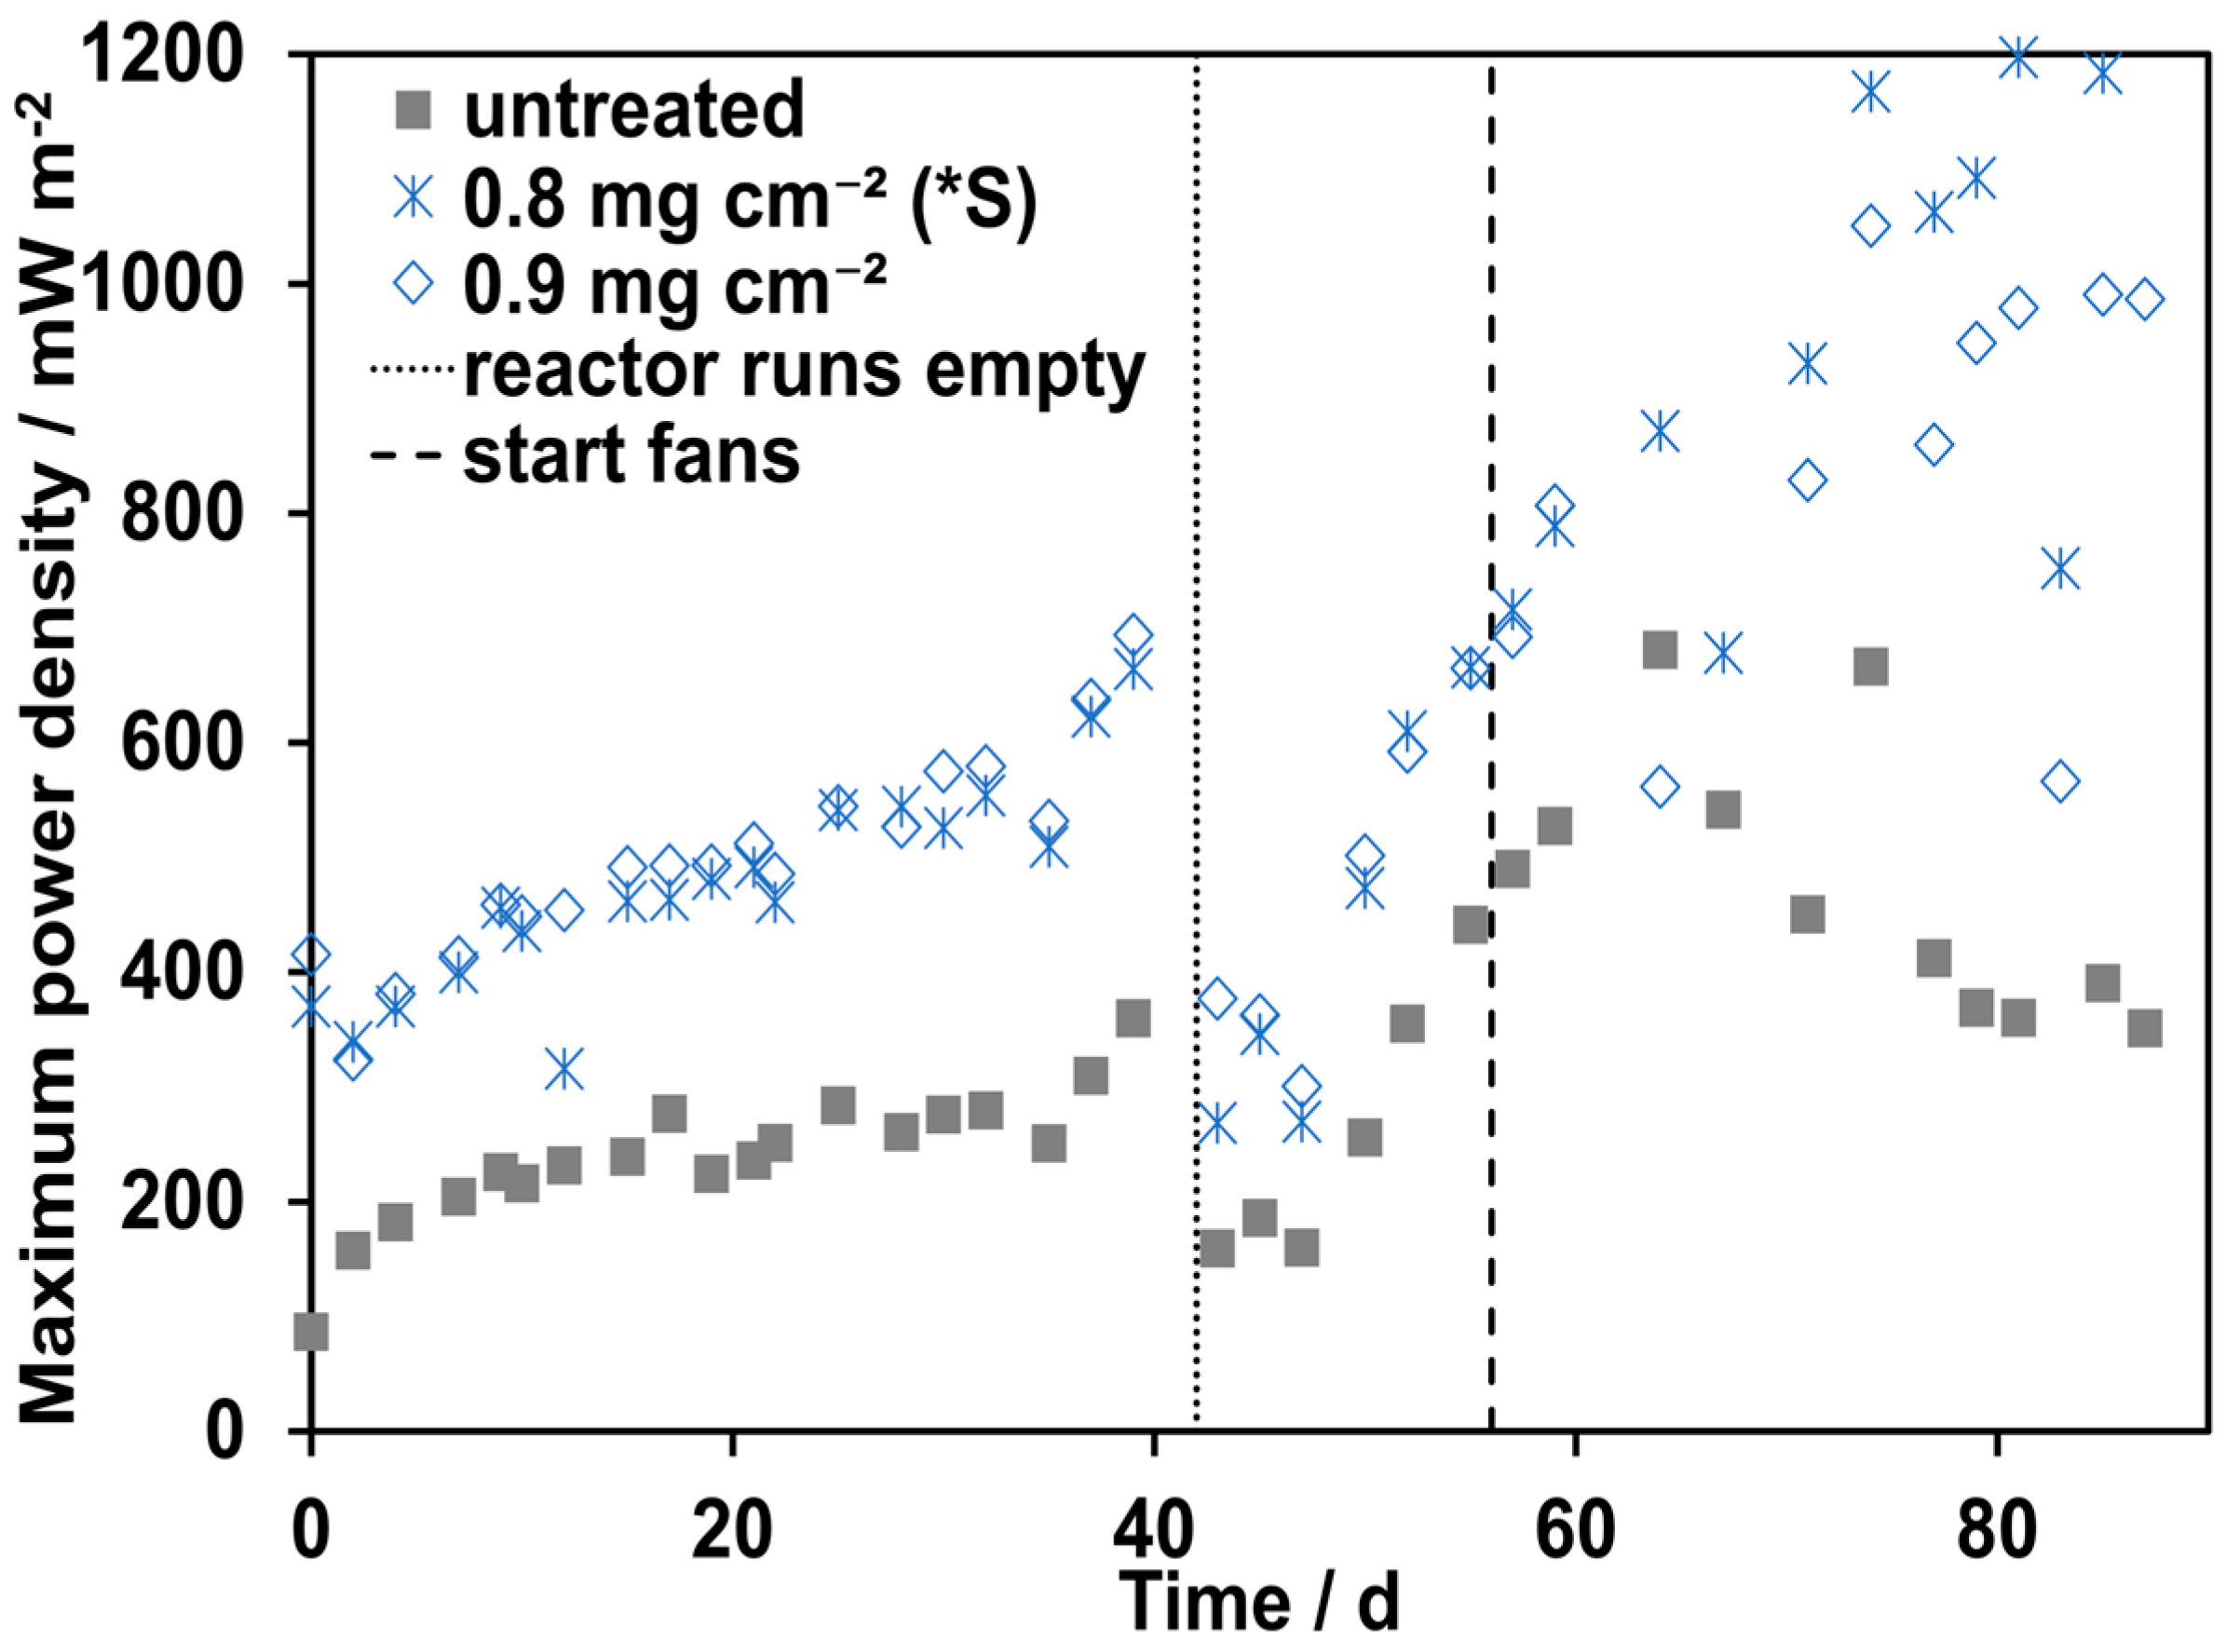
3.1. Influence of Different Ionomer Loadings

Figure 3 shows the maximum power densities determined for an untreated GDE and the three electrodes brushed with ionomer. The power densities of all electrodes showed an increasing trend over the period of one month. This increase in performance is mainly due to the increasing conductivity of the electrolyte as a result of the added nutrient solution. In this context, the two GDEs with the lowest ionomer loadings displayed the highest power densities with values ranging from 397 mW m−2 to 606 mW m−2 (1.6 mg cm−2) and 324 mW m−2 to 575 mW m−2 (0.9 mg cm−2). Meanwhile, the maximum power densities of the GDE with the highest loading of ionomer (2.6 mg cm−2) were significantly lower, with values ranging from 315 mW m−2 to 411 mW m−2. The lowest power densities were found for the untreated GDE. Here, the maximum value measured was 284 mW m−2. The ionomer treatment therefore positively influences the performance of the GDEs, with an optimum in the loading amount.

3.2. Influence of the Application Method and Additional Aeration

For the comparison of the two application methods, Figure 4 shows the power density curves of the sprayed as well as the brushed GDEs. In addition, the development of the performance of the GDE without an antifouling method is shown. Two vertical lines indicate special occurrences. One shows day 42 on which the reactor ran empty inadvertently due to a pump defect and was refilled. The second occurrence was on day 56 when the fans were switched on. It should be noted that only the untreated GDE and the brushed GDEs were additionally ventilated. The sprayed GDE was not equipped with a fan for comparison.
Within the first 40 days, all three curves displayed an increasing trend in performance. The brushed electrode showed an increase of 370 mW m−2 while the power density of the sprayed electrode increased by 325 mW m−2. Meanwhile, the performance increase of the GDE without ionomer was 273 mW m−2. Thereby, the power densities of the GDEs with ionomer ran about 166 mW m−2 to 330 mW m−2 above the GDE without an antifouling method. On day 42, a power drop of 395 mW m−2 (0.8 mg cm−2 (*S)), 317 mW m−2 (0.9 mg cm−2) and 201 mW m−2 (untreated) was noted. As a result of the reactor running empty, the GDEs probably dried out for a short period of time, negatively affecting their performance. However, a few days after refilling the reactor, all GDEs were able to regenerate and the values of power density before the pump failure were reached again. During the first 55 days without additional aeration, the power densities of the sprayed as well as the brushed GDEs ran almost congruently. Only after switching on the fans did the curves begin to diverge. The power density of the aerated GDE with the antifouling method was approx. 200 mW m−2 below the power density of the electrode without additional aeration and the antifouling method. It is possible that the additional oxygen influx favors the colonization of aerobic microorganisms, which leads to a lower power output. This was also confirmed by the behavior of the GDE without an antifouling method. Here, a decrease in performance was observed after the fans were started.

3.3. Influence of the Biofilm on the Electrical Resistance of the System

It has already been confirmed that fouling of the GDE affects the performance of the MFC [25]. In order to check to what extent the decrease in performance can be explained by an increase in electrical resistance due to biofilm growth, the development of the resistance over time was measured. Figure 5 shows the development of the individual resistances for the untreated GDE and the conductivity of the electrolyte.
The conductivity of the electrolyte increased continuously over time due to the addition of sodium acetate as a feed medium. The system resistance calculated by the regression function consequently decreased. The EIS measurements show that the resistances measured over a period of 90 days are congruent with the calculated values. Consequently, there is no contribution of biofilm to the total resistance. Thus, the power decreases of the GDEs caused by the biofilm are primarily due to limiting transport processes and/or parallel reactions and not by the resistance of the biofilm.

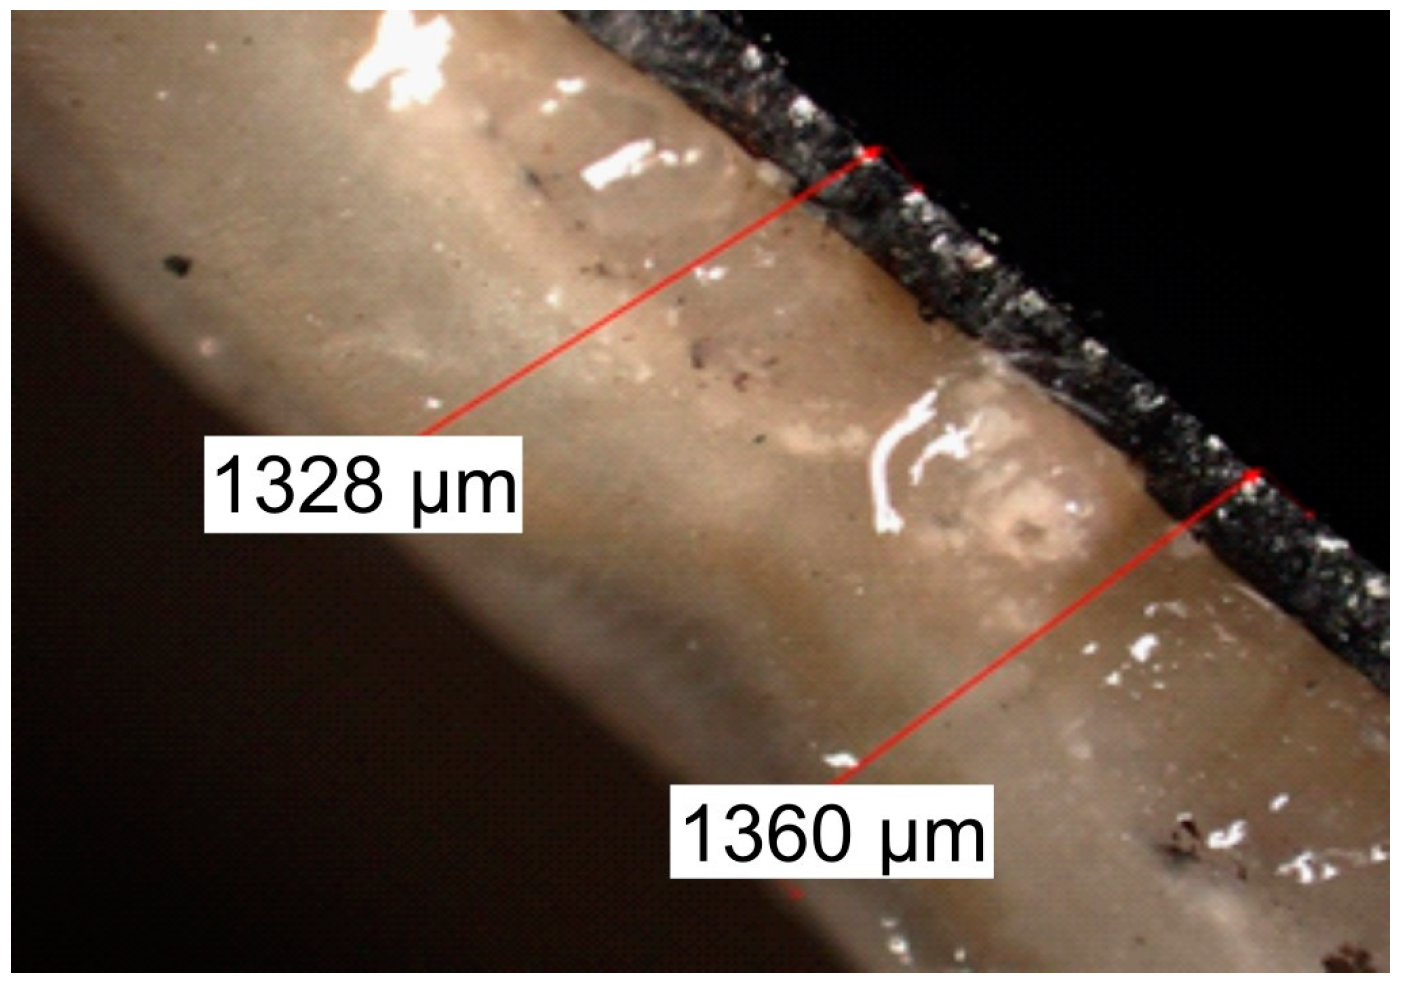
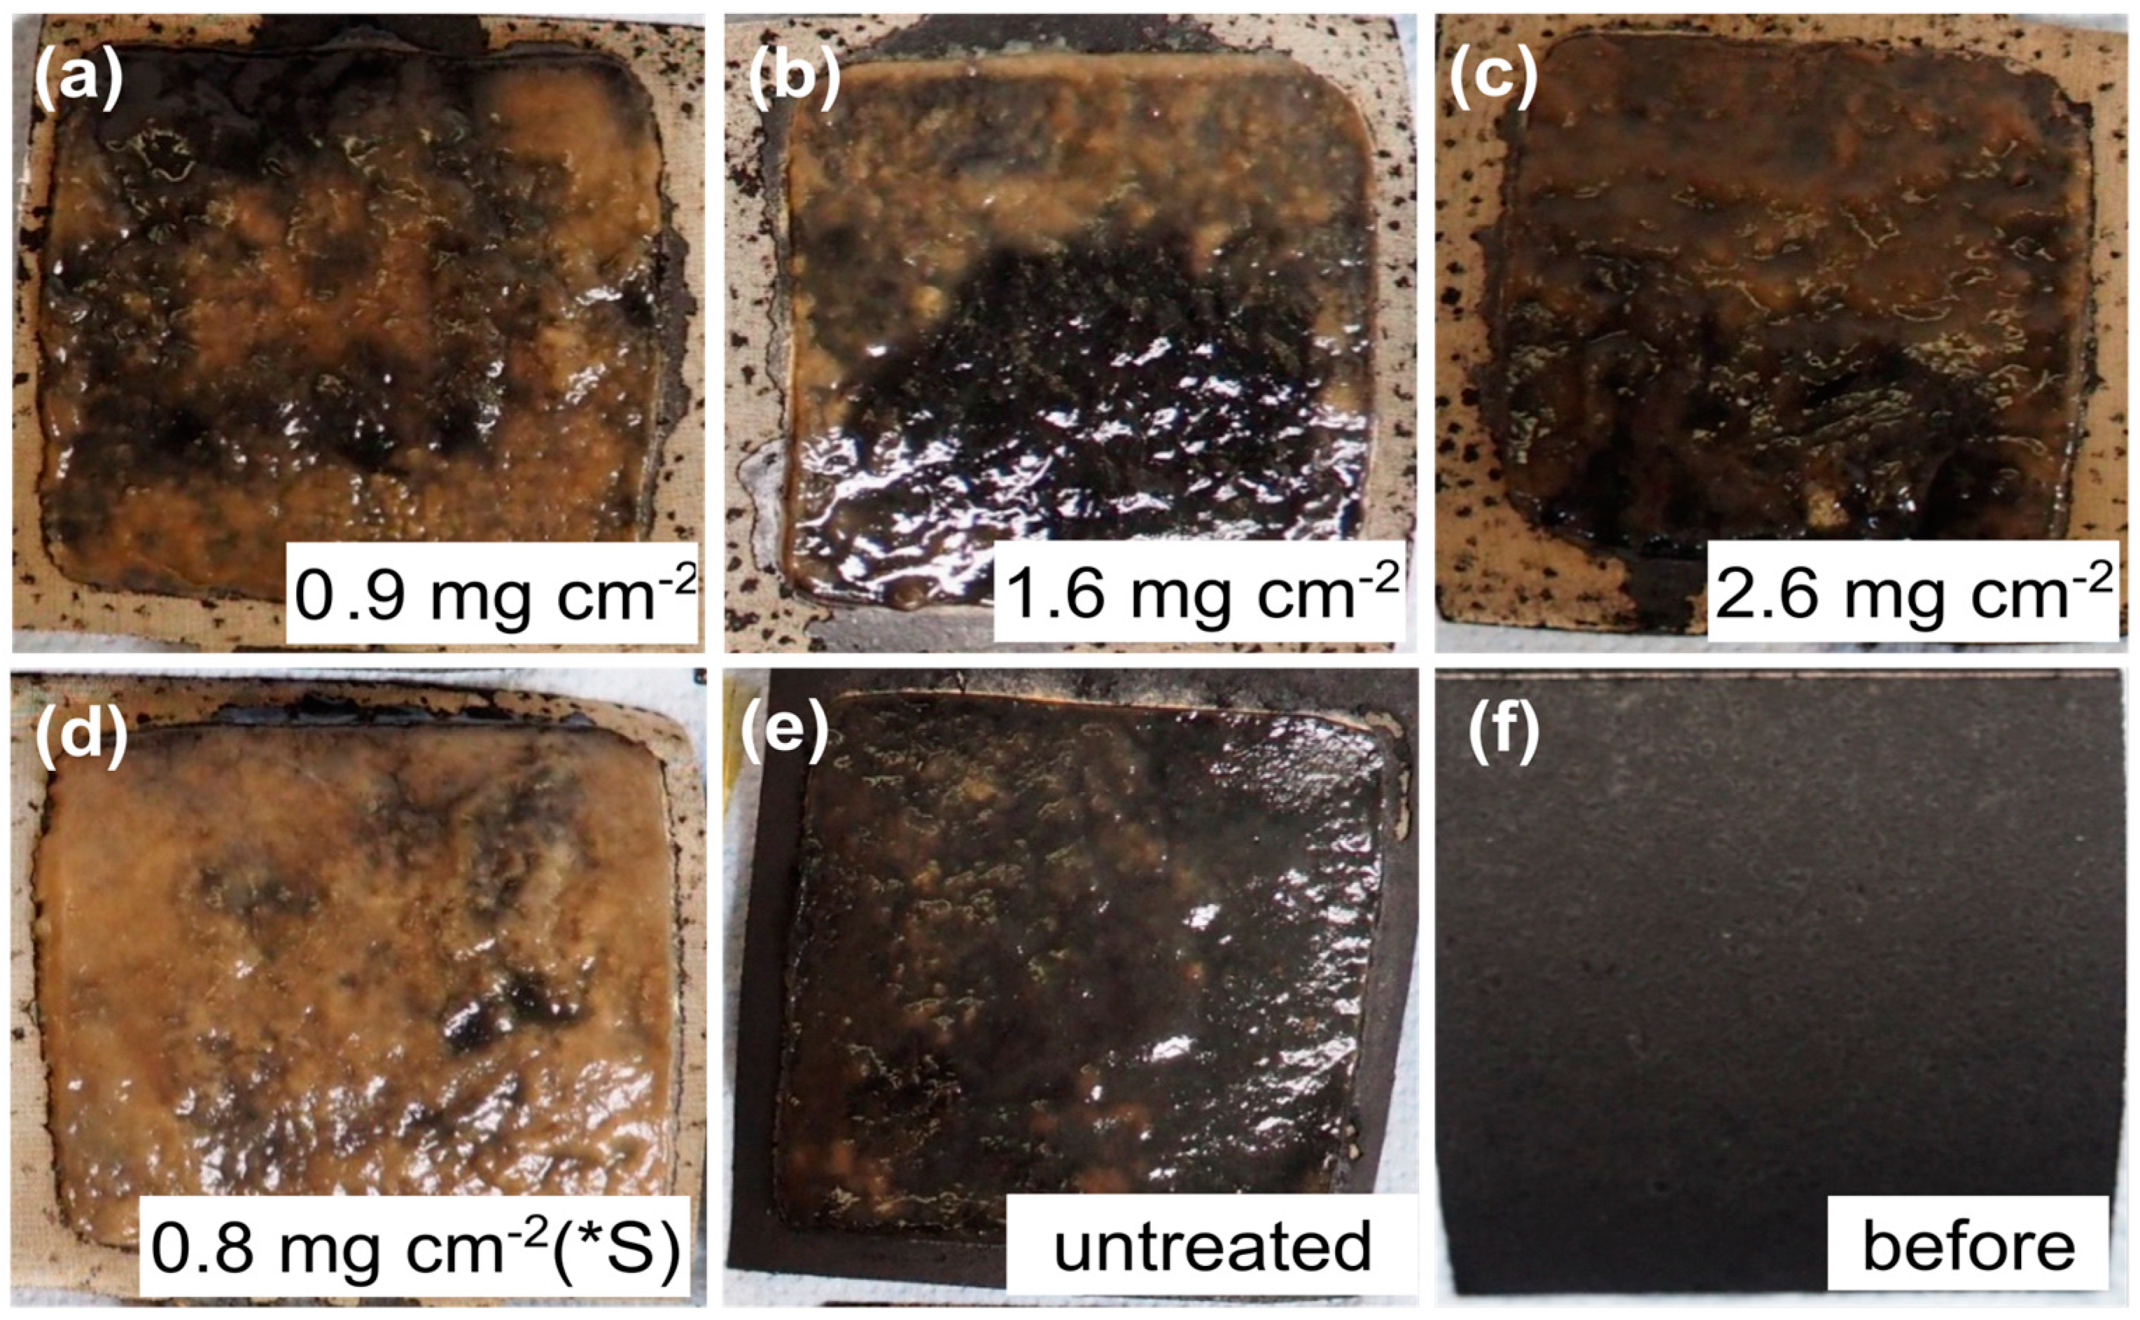
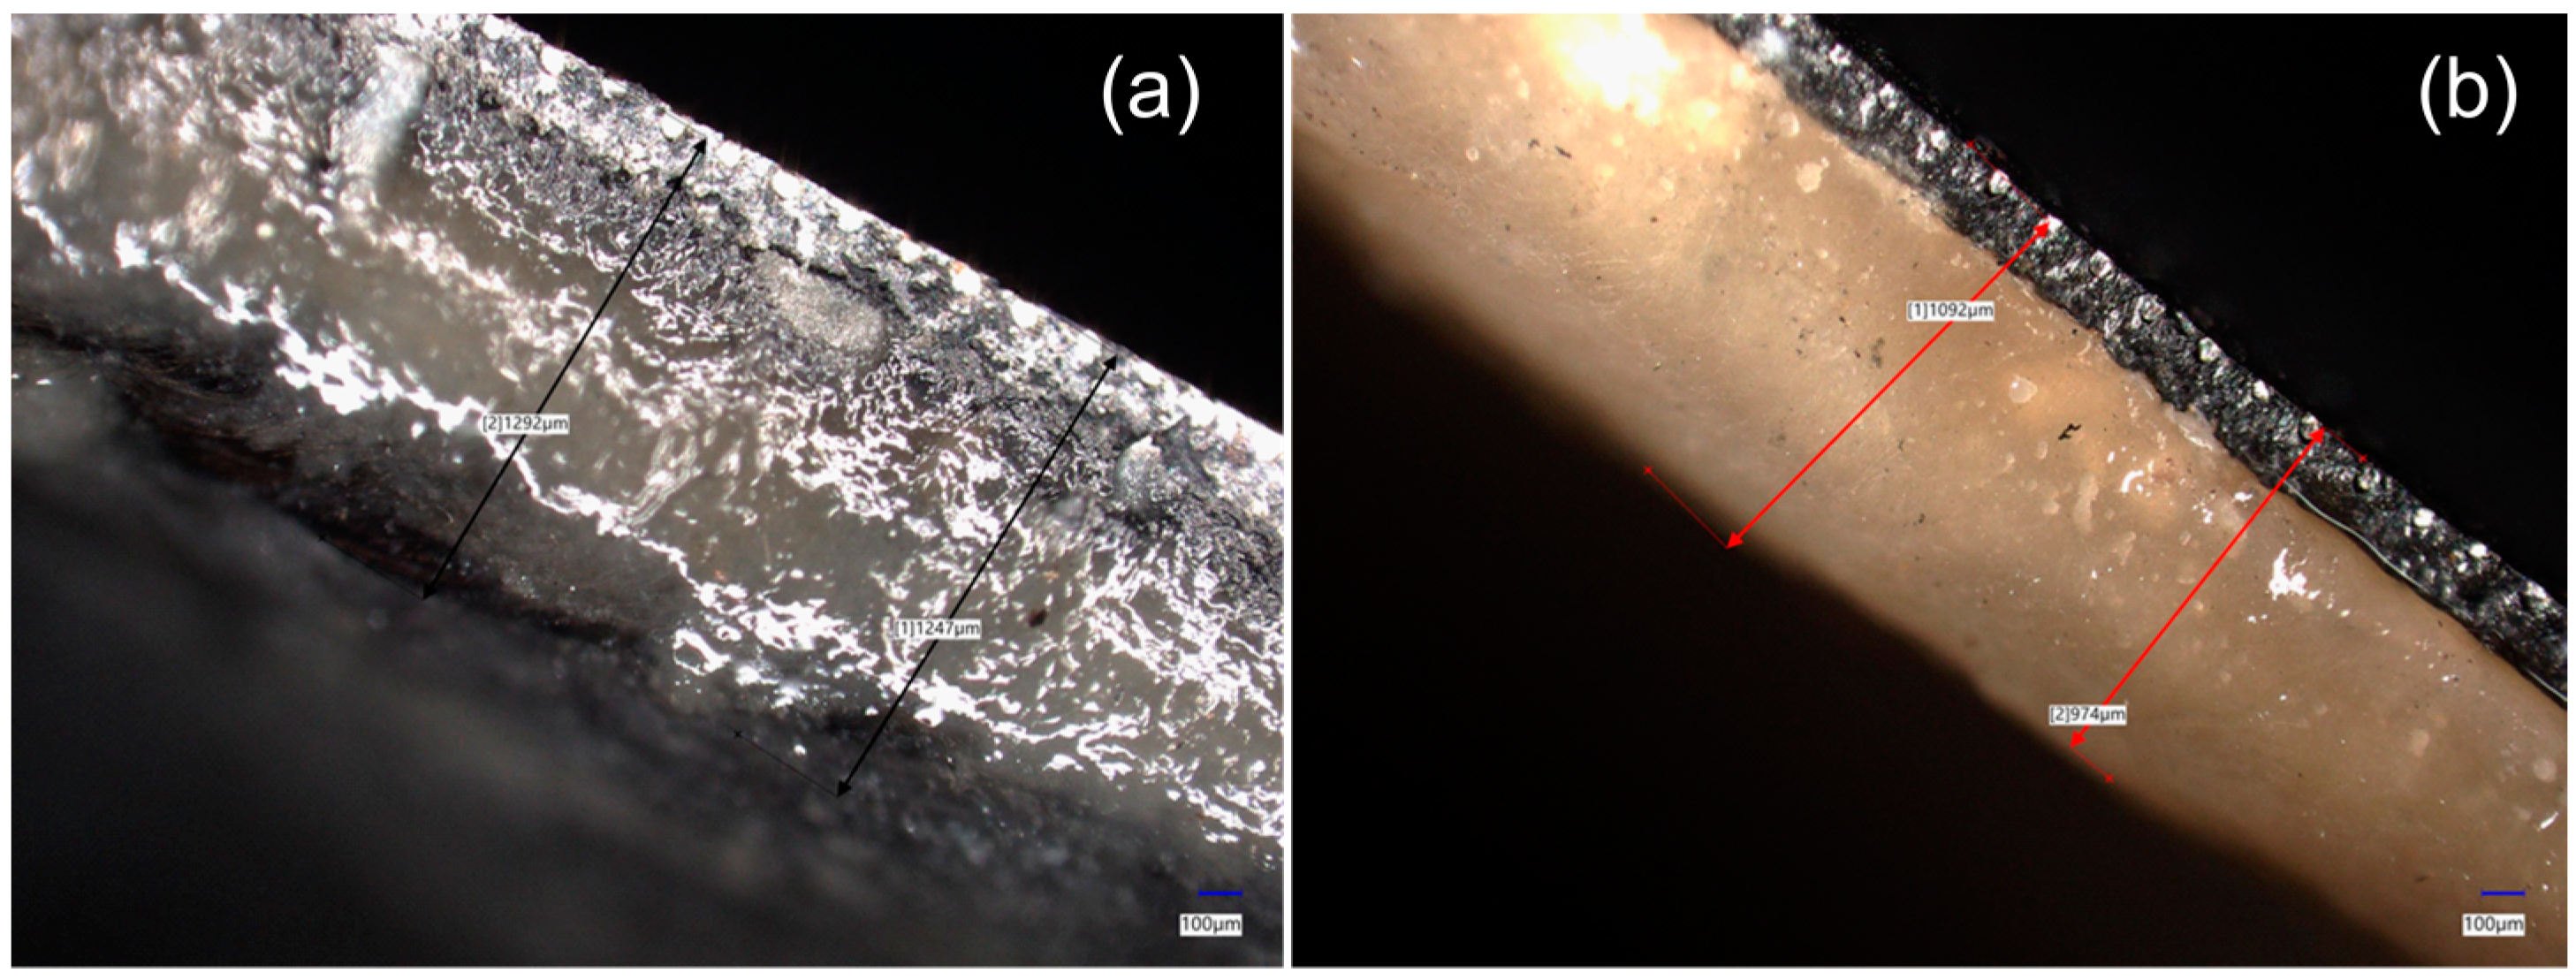
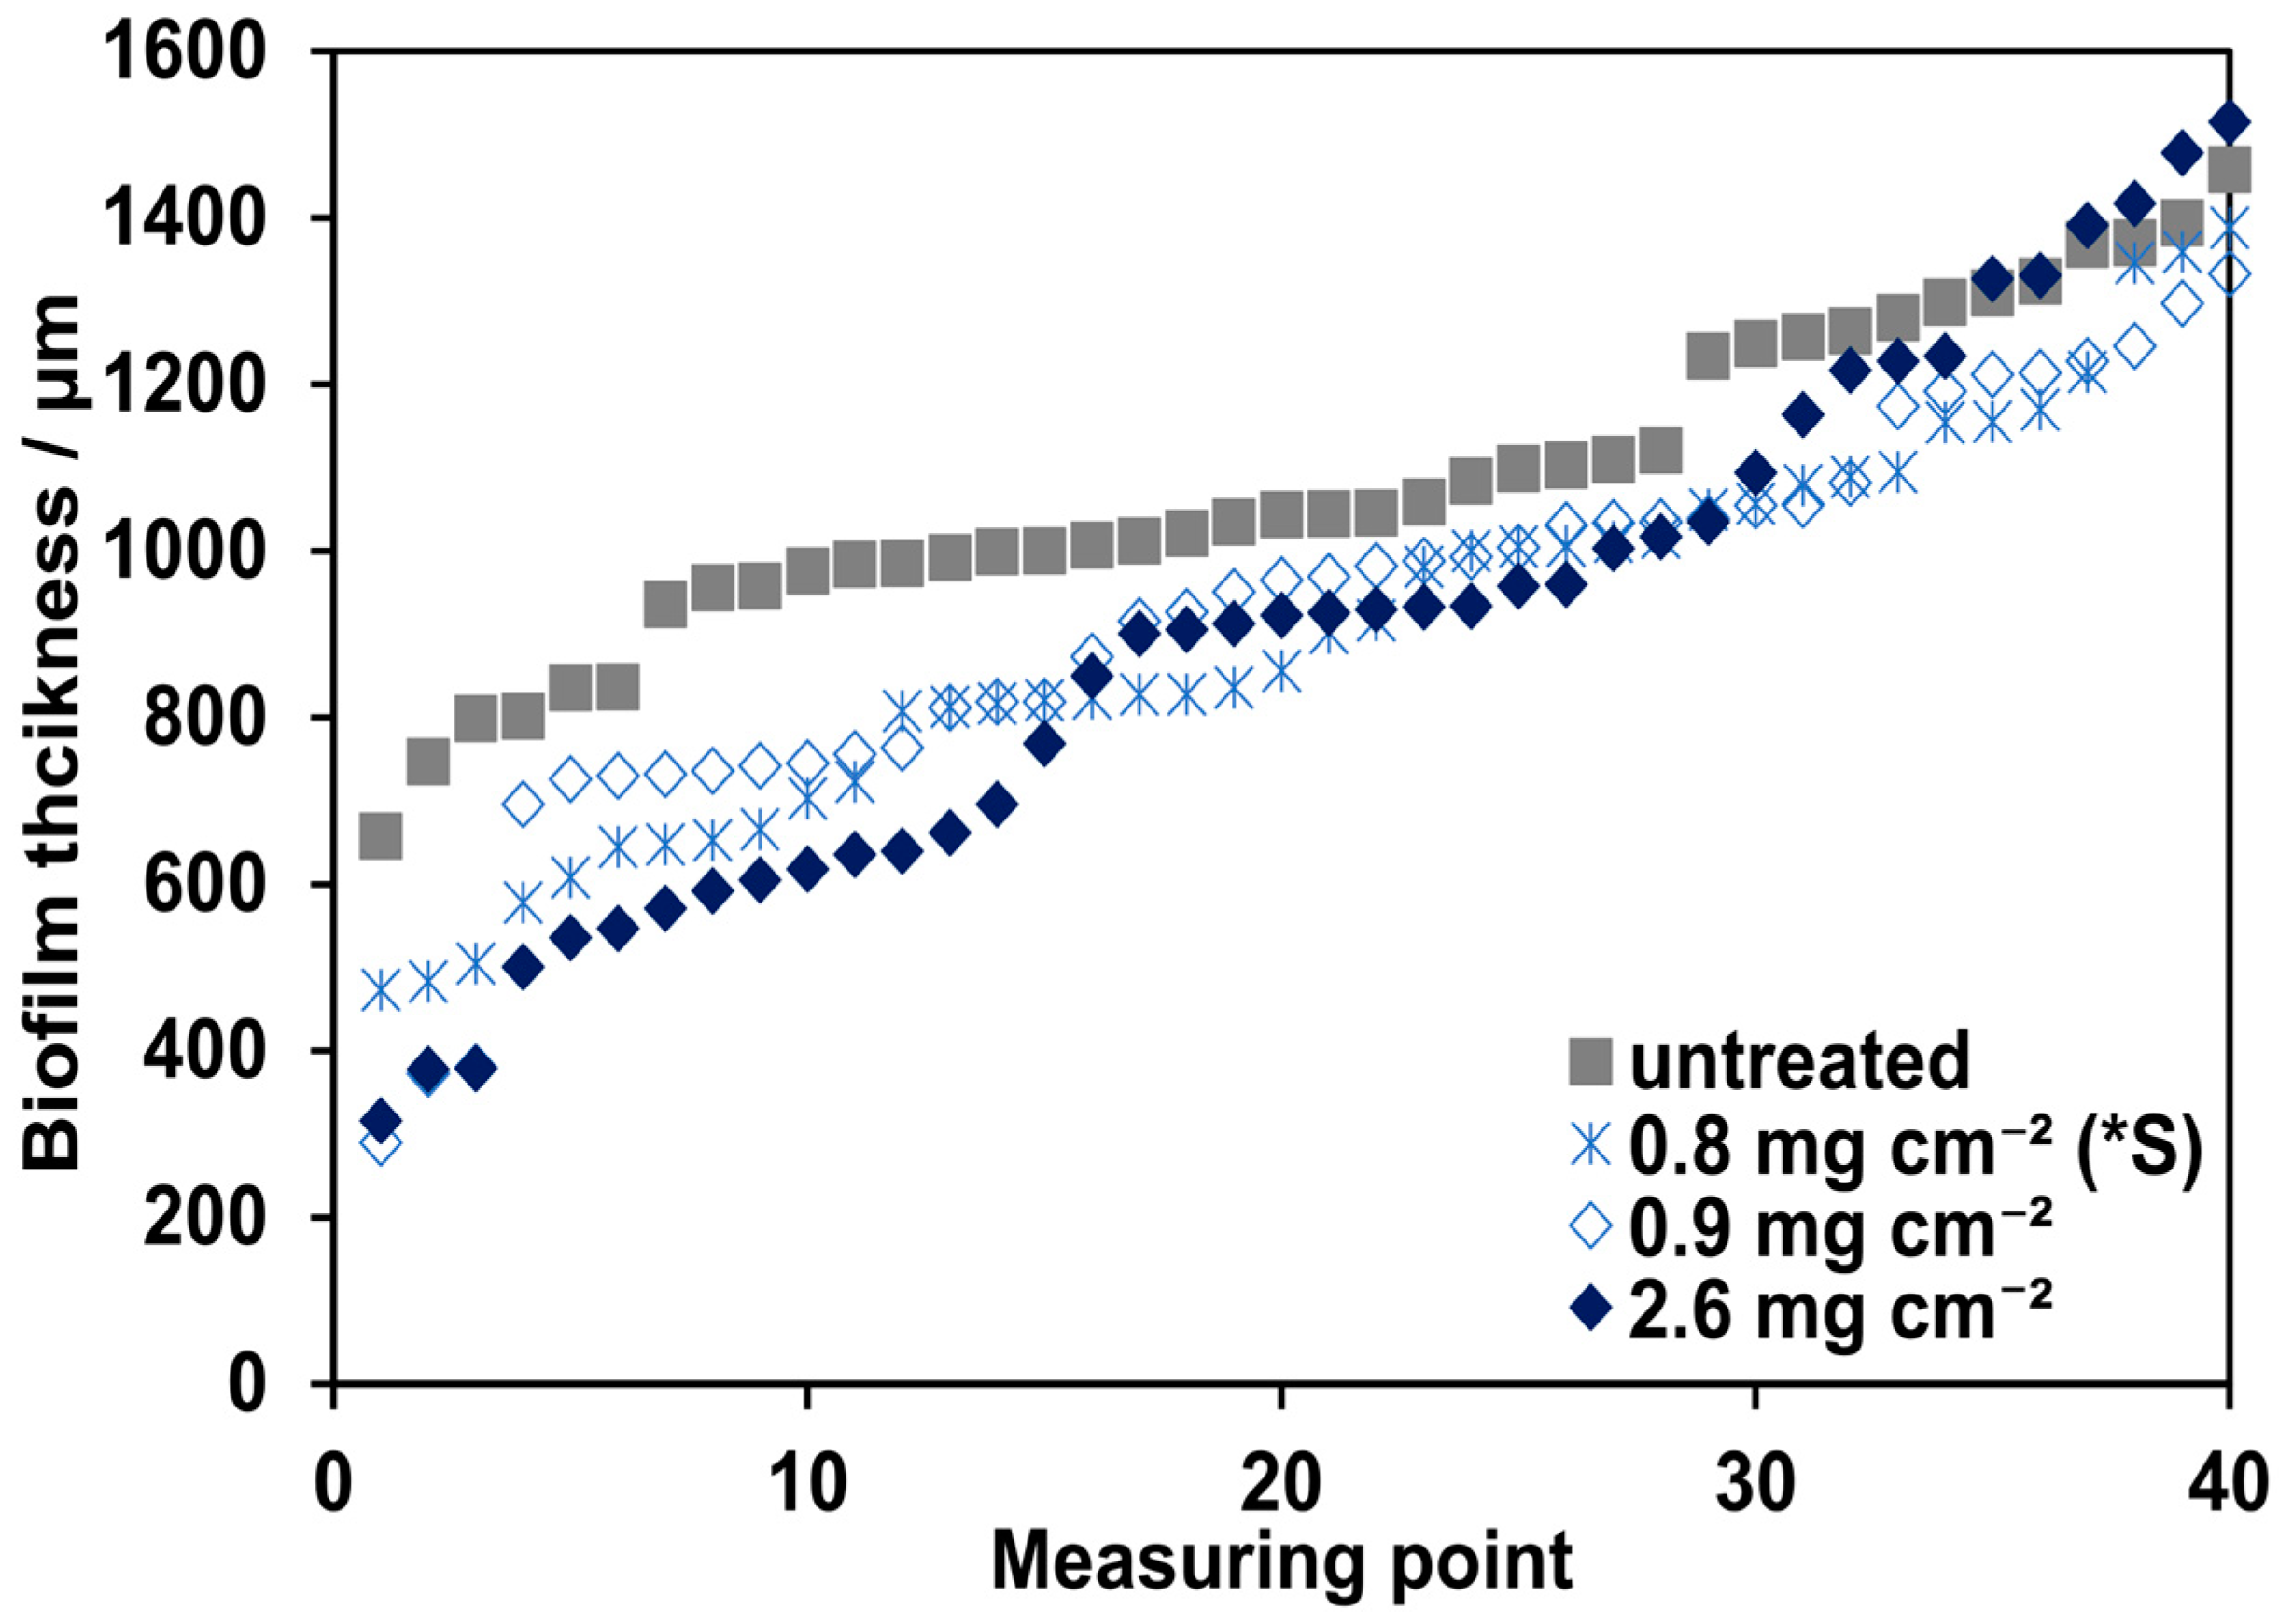
3.4. Evaluation of the Biofilm

Visual assessment of the electrodes shows that a biofilm has grown on all GDEs regardless of ionomer loading, application method or additional aeration (Figure 6a–f).
Regarding the different GDEs, it seems that the biofilms differ in colors. The electrodes treated with ionomer shows a more brownish coating while the untreated GDE is mostly covered with a black layer. This observation is also confirmed by the microscope images shown in Figure 7. Therefore, it is possible that different types of biofilms have formed depending on the antibacterial coating.
Based on the microscope images the biofilm thicknesses of the untreated GDE and the GDEs with the lowest and highest ionomer loadings were measured. The untreated GDE and the two brushed GDEs were additionally aerated from day 56. For a better overview, the measured values have been sorted by size in Figure 8.
The biofilm thicknesses for the GDEs without an antifouling strategy were between 658 µm and 1458 µm (average 1076 µm), and therefore on average approx. 170 µm higher than the thicknesses of the GDEs with the antibacterial coating. There were no significant differences between the GDEs with different ionomer loadings. The thicknesses of the GDEs with 0.9 mg cm−2 ionomer were on average 923 µm and those of the GDEs with a loading of 2.6 mg cm−2 ionomer were on average 901 µm. Furthermore, no influence of the additional aeration on the thickness of the biofilm was detected. The GDE without aeration (0.8 mg cm−2 (*S)) showed an average thickness of 903 µm. Although the biofilm of the untreated GDE was only slightly thicker than that of the GDEs with ionomer, significant differences in electrode performance were observed (Figure 3 and Figure 4). Therefore, the weight of the biofilm formed was also considered. The untreated electrode weighed 353 mg more after 90 days of operation. Meanwhile, the weight increase of the GDEs with the antibacterial coating was only 71 mg (2.6 mg cm−2), 78 mg (0.9 mg cm−2) and 133 mg (0.8 mg cm−2 (*S)).

4. Discussion

Despite the higher power densities of GDEs with ionomer solution, biofilm formation cannot be completely avoided. The measured average thickness of the biofilm was reduced by antibacterial treatment by only 154–176 µm (14–16%) while its weight was 220–282 mg (62–80%) less. This suggests that the fouling of the GDE does not only take place superficially but possibly also in the pores. Accordingly, the application of ionomer solution could avoid the blocking of the active sites inside the GDE, and thus lead to better performance. Another assumption is that the density of biofilm without an antifouling method is higher than that of the treated GDEs. A higher biofilm density could negatively affect the transport processes, and thus the performance of the electrode. Biofilm that collects inside the pores of the GDE can not only impede mass transport but also could lead to a passivation of the catalyst and consequently to a loss of performance. Scaling and corrosion effects can also influence the weight change of the GDE. Since all electrodes examined in this study were in the same medium and were exposed to the same conditions, these phenomena should affect all samples equally.
Additional aeration of the GDEs leads to lower power densities, which suggests the colonization of aerobic microorganisms in the biofilm causes parallel reactions. Future DNA analyses have to show what type of organisms are present in the biofilm.
In addition, it should be mentioned that the results presented in this work are based on an observation time of 90 days. This period was sufficient to investigate the general suitability of the ionomer as an antifouling agent. In a technical application of GDEs in MFCs, the lifetime of the electrodes should be maximized. Therefore, the long-term antibacterial effectiveness of the ionomer coating should be investigated in future studies.

5. Conclusions

The treatment of GDEs with a polyaromatic polymer containing quaternary ammonium functional groups leads to improved performance of the electrode. Within the first 30 days of operation, the maximum measured power density of a GDE with antibacterial coating was 606 mW m−2. In the same period, the GDE without an antifouling treatment could only reach a maximum of 284 mW m−2. Furthermore, there was an optimum in the loading amount with ionomer, which was below 2.6 mg cm−2. The investigations show that it does not matter whether the coating is applied by brush or by spraying.
Additional consideration of electrical resistance shows that the formation of biofilm does not affect the overall resistance of the system. Consequently, the decrease in performance due to fouling is exclusively caused by transport limitation and/or passivation of the catalyst and/or non electrochemical parallel reactions inside the biofilm on the GDE.

Author Contributions

Conceptualization, M.S. and U.K.; methodology, L.L., D.R.H., U.K. and M.S.; software, L.L.; validation, L.L. and U.K.; formal analysis, L.L.; investigation, L.L.; resources, D.R.H., U.K. and M.S.; data curation, L.L.; writing—original draft preparation, L.L.; writing—review and editing, D.R.H., U.K. and M.S.; visualization, L.L.; supervision, U.K.; project administration, M.S. and U.K.; funding acquisition, M.S. and U.K. All authors have read and agreed to the published version of the manuscript.

Funding

This research was funded by the Federal Ministry of Education and Research of Germany under the contract No. 02WER1531A.

Institutional Review Board Statement

Not applicable.

Informed Consent Statement

Not applicable.

Data Availability Statement

The raw data supporting the conclusions of this article will be made available by the authors on request.

Acknowledgments

The authors also thank Eisenhuth GmbH & Co. KG for their support in producing the gas diffusion electrodes and providing the anodes.

Conflicts of Interest

The authors declare no conflicts of interest. The funders had no role in the design of the study; in the collection, analyses, or interpretation of data; in the writing of the manuscript; or in the decision to publish the results.

References

  1. Köroğlu, E.Q.; Yörüklü, H.C.; Demir, A.; Ozkaya, B. Scale-Up and Commercialization Issues of the MFCs: Challenges and Implications. In Microbial Electrochemical Technology: Sustainable Platform for Fuels, Chemicals and Remediation; Mohan, S.V., Varjani, S., Pandey, A., Eds.; Elsevier: Amsterdam, The Netherlands, 2018; pp. 565–580. [Google Scholar]
  2. Gil, G.; Chang, I.; Kim, B.H.; Kim, M.; Jang, J.; Park, H.S.; Kim, H.J. Operational parameters affecting the performance of a mediator-less microbial fuel cell. Biosens. Bioelectron. 2003, 18, 327–334. [Google Scholar] [CrossRef] [PubMed]
  3. Rismani-Yazdi, H.; Carver, S.M.; Christya, A.D.; Tuovinen, O.H. Cathodic limitations in microbial fuel cells: An overview. J. Power Sources 2008, 180, 683–694. [Google Scholar] [CrossRef]
  4. Fan, Y.; Sharbrough, E.; Liu, H. Quantification of the internal resistance distribution of microbial fuel cells. Environ. Sci. Technol. 2008, 42, 8101–8107. [Google Scholar] [CrossRef] [PubMed]
  5. Liu, H.; Logan, B.E. Electricity generation using an air-cathode single chamber microbial fuel cell in the presence and absence of a proton exchange membrane. Environ. Sci. Technol. 2004, 38, 4040–4046. [Google Scholar] [CrossRef] [PubMed]
  6. Liu, W.; Cheng, S.; Yin, L.; Sun, Y.; Yu, L. Influence of soluble microbial products on the long-term stability of air cathodes in microbial fuel cells. Electrochim. Acta 2018, 261, 557–564. [Google Scholar] [CrossRef]
  7. Zhang, F.; Pant, D.; Logan, B.E. Long-term performance of activated carbon air cathodes with different diffusion layer porosities in microbial fuel cells. Biosens. Bioelectron. 2011, 30, 49–55. [Google Scholar] [CrossRef] [PubMed]
  8. Gao, N.; Fan, Y.; Wang, L.; Long, F.; Deng, D.; Liu, H. Accelerated tests for evaluating the air-cathode aging in microbial fuel cells. Bioresour. Technol. 2020, 297, 122479. [Google Scholar] [CrossRef] [PubMed]
  9. Zhang, E.; Wang, F.; Yu, Q.; Scott, K.; Wang, X.; Diao, G. Durability and regeneration of activated carbon air-cathodes in long-term operated microbial fuel cells. J. Power Sources 2017, 360, 21–27. [Google Scholar] [CrossRef]
  10. Liu, W.; Cheng, S.; Sun, D.; Huang, H.; Chen, J.; Cen, K. Inhibition of microbial growth on air cathodes of single chamber microbial fuel cells by incorporating enrofloxacin into the catalyst layer. Biosens. Bioelectron. 2015, 72, 44–50. [Google Scholar] [CrossRef]
  11. An, J.; Li, N.; Wan, L.; Zhou, L.; Du, Q.; Li, T.; Wang, X. Electric field induced salt precipitation into activated carbon air-cathode causes power decay in microbial fuel cells. Water Res. 2017, 123, 369–377. [Google Scholar] [CrossRef]
  12. Li, D.; Liu, J.; Qu, Y.; Wang, H.; Feng, Y. Analysis of the effect of biofouling distribution on electricity output in microbial fuel cells. RSC Adv. 2016, 33, 27494–27500. [Google Scholar] [CrossRef]
  13. Kiely, P.D.; Rader, G.; Regan, J.M.; Logan, B.E. Long-term cathode performance and the microbial communities that develop in microbial fuel cells fed different fermentation endproduct. Bioresour. Technol. 2011, 102, 361–366. [Google Scholar] [CrossRef] [PubMed]
  14. Chatterjee, P.; Ghangrekar, M.M. Preparation of a fouling-resistant sustainable cathode for a single-chambered microbial fuel cell. Water Sci. Technol. 2014, 69, 634–639. [Google Scholar] [CrossRef] [PubMed]
  15. Oliot, M.; Etcheverry, L.; Bergel, A. Removable air-cathode to overcome cathode biofouling in microbial fuel cells. Bioresour. Technol. 2016, 221, 691–696. [Google Scholar] [CrossRef] [PubMed]
  16. Zhang, X.; Pant, D.; Zhang, J.; Liu, W.; He, B.; Logan, B.E. Long-Term Performance of Chemically and Physically Modified Activated Carbons in Air Cathodes of Microbial Fuel Cells. ChemElectroChem 2014, 1, 1859–1866. [Google Scholar] [CrossRef]
  17. Li, D.; Liu, J.; Wang, H.; Qu, Y.; Zhang, J.; Feng, Y. Enhanced catalytic activity and inhibited biofouling of cathode in microbial fuel cells through controlling hydrophilic property. J. Power Source 2016, 332, 454–460. [Google Scholar] [CrossRef]
  18. Guo, L.; Yuan, W.; Lu, Z.; Li, C.M. Polymer/nanosilver composite coatings for antibacterial applications. Colloids Surf. A Physicochem. Eng. Asp. 2013, 439, 69–83. [Google Scholar] [CrossRef]
  19. Noori, M.T.; Tiwari, B.R.; Mukherjee, C.K.; Ghangrekar, M.M. Enhancing the performance of microbial fuel cell using Ag-Pt bimetallic alloy as cathode catalyst and anti-biofouling agent. Int. J. Hydrogen Energy 2018, 43, 19650–19660. [Google Scholar] [CrossRef]
  20. Sun, Y.; Dai, Y.; Duan, Y.; Xu, X.; LV, Y.; Yang, L.; Zou, J. Biofouling inhibition on nano-silver/ferrous sulfide/partly-graphitized carbon cathode with enhanced catalytic activity and durability for microbial fuel cells. Carbon 2017, 119, 394–402. [Google Scholar] [CrossRef]
  21. Noori, M.T.; Jain, S.C.; Ghangrekar, M.M.; Mukherjee, C.K. Biofouling inhibition and enhancing performance of microbial fuel cell using silver nano-particles as fungicide and cathode catalyst. Bioresour. Technol. 2016, 220, 183–189. [Google Scholar] [CrossRef]
  22. Zhou, Z.; Zhou, S.; Zhang, S.; Zheng, S.; Xu, Y.; Nie, W.; Zhou, Y.; Xu, T.; Chen, P. Quaternary Ammonium Salts: Insights into Synthesis and New Directions in Antibacterial Applications. Bioconjugate Chem. 2023, 34, 302–325. [Google Scholar] [CrossRef]
  23. Zhang, X.; Wang, Z.; Tang, C.Y.; Ma, J.; Liu, M.; Ping, M.; Chen, M.; Wu, Z. Modification of microfiltration membranes by alkoxysilane polycondensation induced quaternary ammonium compounds grafting for biofouling mitigation. J. Membr. Sci. 2018, 549, 165–172. [Google Scholar] [CrossRef]
  24. Sun, J.; Zhang, B.; Yu, B.; Ma, B.; Hu, C.; Ulbricht, M.; Qu, J. Maintaining Antibacterial Activity against Biofouling Using a Quaternary Ammonium Membrane Coupling with Electrorepulsion. Environ. Sci. Technol. 2023, 57, 1520–1528. [Google Scholar] [CrossRef]
  25. Haupt, D.R.; Landwehr, L.; Schumann, R.; Hahn, L.; Issa, M.; Coskun, C.; Kunz, U.; Sievers, M. A New Reactor Concept for Single-Chamber Microbial Fuel Cells and Possible Anti-Fouling Strategies for Long-Term Operation. Microorganisms 2022, 10, 2421. [Google Scholar] [CrossRef] [PubMed]
  26. Li, N.; Liu, Y.; An, J.; Feng, C.; Wang, X. Bifunctional quaternary ammonium compounds to inhibit biofilm growth and enhance performance for activated carbon air-cathode in microbial fuel cells. J. Power Source 2014, 272, 895–899. [Google Scholar] [CrossRef]
  27. Zhang, L.; Liu, C.; Zhuang, L.; Li, W.; Zhou, S.; Zhang, J. Manganese dioxide as an alternative cathodic catalyst to platinum in microbial fuel cells. Biosens. Bioelectron. 2009, 24, 2825–2829. [Google Scholar] [CrossRef] [PubMed]
  28. Martin, E.; Tartakovsky, B.; Savadogo, O. Cathode materials evaluation in microbial fuel cells: A comparison of carbon, Mn2O3, Fe2O3 and platinum materials. Electrochim. Acta 2011, 58, 58–66. [Google Scholar] [CrossRef]
  29. Roche, I.; Katuri, K.; Scott, K. A microbial fuel cell using manganese oxide oxygen reduction catalysts. J. Appl. Electrochem. 2009, 40, 13–21. [Google Scholar] [CrossRef]
  30. Jiang, B.; Muddemann, T.; Kunz, U.; Bormann, H.; Niedermeiser, M.; Haupt, D.; Schläfer, O.; Sievers, M. Evaluation of Microbial Fuel Cells with Graphite Plus MnO2 and MoS2 Paints as Oxygen Reduction Cathode Catalyst. J. Electrochem. Soc. 2017, 164, 3083–3090. [Google Scholar] [CrossRef]
  31. Kenawy, E.; Worley, S.D.M.; Broughton, R. The Chemistry and Applications of Antimicrobial Polymers: A State-of-the-Art Review. Biomacromolecules 2007, 8, 1359–1384. [Google Scholar] [CrossRef]
Figure 1. Reactor set-up side view (left) and top view (right).
Fermentation 10 00408 g001
Figure 2. Microscope image of the gas diffusion electrode (GDE) with biofilm for thickness determination of the biofilm.
Fermentation 10 00408 g002
Figure 3. Development of maximum power densities over time measured against reference electrode within 30 days for an untreated GDE and for the three electrodes with different loads of ionomer (0.9 mg cm−2, 1.6 mg cm−2, 2.6 mg cm−2).
Fermentation 10 00408 g003
Figure 4. Development of maximum power densities over time measured against reference electrode within 90 days for an untreated GDE and for the two electrodes sprayed and brushed with ionomer (0.8 mg cm−2 (*S), 0,9 mg cm−2). Start of additional ventilation on day 56.
Fermentation 10 00408 g004
Figure 5. Development of the base resistance of the system calculated by regression function, the measured resistance by electrochemical impedance spectroscopy (EIS) and the resulting resistance of the biofilm, as well as the measured conductivity of electrolyte within 90 days.
Fermentation 10 00408 g005
Figure 6. Photos of the removed GDEs with biofilms after 90 days of operation: (a) GDE brush-coated with 0.9 mg cm−2 of ionomer; (b) GDE brush-coated with 1.6 mg cm−2 of ionomer; (c) GDE brush-coated with 2.6 mg cm−2 of ionomer; (d) GDE spray-coated with 0.8 mg cm−2 of ionomer; (e) GDE without ionomer; (f) GDE before use.
Fermentation 10 00408 g006
Figure 7. Microscope images of the removed GDEs with biofilm after 90 days of operation: (a) GDE without ionomer; (b) GDE brush-coated with 0.9 mg cm−2 of ionomer.
Fermentation 10 00408 g007
Figure 8. Biofilm thickness measured over the cross section of the electrode (sorted by size).
Fermentation 10 00408 g008
Disclaimer/Publisher’s Note: The statements, opinions and data contained in all publications are solely those of the individual author(s) and contributor(s) and not of MDPI and/or the editor(s). MDPI and/or the editor(s) disclaim responsibility for any injury to people or property resulting from any ideas, methods, instructions or products referred to in the content.

