Article

Thermal Treatment and Fermentation of Legume Flours with Leuconostoc citreum TR116 for the Development of Spreadable Meat Alternatives

1
School of Food and Nutritional Sciences, University College Cork, T12 YN60 Cork, Ireland
2
School of Engineering, Institute of Life Technologies, HES-SO Valais-Wallis, 1950 Sion, Switzerland
*
Author to whom correspondence should be addressed.
Fermentation 2024, 10(8), 412; https://doi.org/10.3390/fermentation10080412
Submission received: 22 July 2024 / Revised: 5 August 2024 / Accepted: 6 August 2024 / Published: 9 August 2024
(This article belongs to the Special Issue Strategies for Optimal Fermentation by Using Modern Tools and Methods)

Abstract

:
The demand for meat alternatives in different forms is increasing due to consumers’ awareness of climate change and the health benefits of plant-based ingredients compared to animals. However, current alternatives on the market do not fulfil consumers’ acceptance for taste and texture. Hence, different physical and biological processes, such as thermal treatment and fermentation, need to be investigated. This study reveals that the thermal treatment of legume flours (soy, pea and lentil) prior to single-strain fermentation with Leuconostoc citreum TR116 has a major impact on acidification, colour, texture and sensory properties due to the pregelatinisation of starch and denaturation of proteins. The thermal treatment of soy flour resulted in liquification, and it could not be used as a fermentation substrate. However, non-heat-treated soy flour was fermented for comparison. The highest total titratable acidity (TTA) was determined in fermented pea flour (PF) and fermented lentil flour (LF) after 48 h with 24.35 ± 0.29 mL 0.1 M NaOH/10 g and 24.98 ± 0.33 mL 0.1 M NaOH/10 g, respectively. Heat treatment prior to fermentation led to a reduction in TTA by 20 mL 0.1 M NaOH/10 g for both PF and LF. The loss of colour pigments during thermal treatment led to a lighter colour of the spreadable alternatives. Moreover, a harder texture (+13.76 N in LF; +15.13 N in PF) and a lower adhesiveness (−0.88 N in LF; −0.43 N in PF) were detected in spreadable meat alternatives that were treated with heat prior to fermentation. Cohesiveness was decreased by thermal treatment, and fermentation did not impact it. Fermentation without pre-heat treatment increased adhesiveness by 4.37 N in LF and by 2.36 N in PF—an attribute typical for spreadable meat. Descriptive sensory analysis showed that thermal treatment significantly decreased bitterness but increased crumbliness and reduced juiciness. On the other hand, fermentation without pre-heat treatment mainly influenced flavour by increasing fruitiness and decreasing beaniness, earthiness and off-flavours. In summary, thermal treatment prior to fermentation is powerful in reducing legume-typical off-flavours but is not suitable for the development of spreadable meat alternatives due to texture changes. However, this process can be very beneficial when producing sausage-like alternatives.

1. Introduction

Population growth, urbanisation, industrialisation, and rising incomes are increasing global demand for meat and other animal products. Indeed, meat has been part of human consumption since prehistoric times as it provides high-quality protein and is a source of energy, but it has a significant impact on the environment. It is responsible for 15–30% of the current world greenhouse gas emissions, and its production is a significant cause of global warming [1,2,3]. Thanks to a growing number of concerns about environmental impact, animal welfare, healthy eating, and religious beliefs, the consumption of legumes protein has increased over the years. Legumes emit up to seven-times fewer greenhouse gases per area than other crops and can sequester carbon in the soil. They can also produce nitrogen from the atmosphere, reducing the need for nitrogen fertiliser [4]. In addition to positively impacting the environment, legumes possess an excellent nutritional profile with health benefits and favourable functional properties that give them great potential in food product applications [5]. Meat alternatives made from legumes, such as plant-based burgers, patties and fried balls, are a growing market [6]. Nowadays, the food industry faces significant challenges in providing consumers with attractive products while managing to develop products that are as similar as possible to animal products in terms of quality, nutrition and sensory characteristics and thus gain consumer acceptance [3,6,7]. The most well-studied legume sources are soy and pea. Both are used for the development of dairy and meat alternatives. However, soy production has been associated with ecological problems, such as excessive water usage and deforestation [8], as well as high rates of soil erosion. Moreover, soy contains at least 30 allergens, which affect 0.5% of the general population, causing allergic symptoms such as asthma, anaphylactic shock and even death [9]. Peas, on the other hand, have a lower allergic potential and have a milder effect on the environment during primary production [10,11,12], which has made them gain popularity in the last two decades. To ensure biodiversity, a broader range of protein sources needs to be used in food production. Lentil is a very promising alternative to soy and pea [13]. It has attracted the interest of the food industry in recent years, particularly in the bakery industry [14,15], as well as in extruded products (pasta, snacks) [16,17], and it has also been used in dairy alternatives (mainly in yoghurts) [18,19] and meat substitutes [20]. The natural colour of red lentil is an advantage for meat replacement as it eliminates the need for additional colourings [21].
Legumes are high in antinutritional factors (ANFs), such as trypsin inhibitors, condensed tannins and phytic acid. Hence, the application of legumes in food products can have nutritional disadvantages, such as decreasing protein digestibility and lowering the bioavailability of micronutrients, for example [22]. Lactic acid bacteria (LAB) fermentation is a promising process to increase the nutritional profile of raw ingredients, specifically those that are plant based. LAB cause the rapid acidification of the raw materials through the production of mainly lactic acid. They also play an essential role in producing acetic acid, ethanol, aroma compounds, bacteriocins, exopolysaccharides, and several enzymes [23]. In addition to being of great importance for the nutritional and sensory profile, LAB fermentation has been described as impacting protein digestibility, lowering the glycaemic index, degrading antinutritional compounds and synthesising health-promoting compounds [24]. Leuconostoc citreum TR116 is a heterofermentative LAB that produces D-lactate, CO2 and acetate or ethanol from glucose through the phosphoketolase pathway [25,26]. Furthermore, TR116 expresses an enzyme called mannitol-2-dehydrogenase (MDH), which convert fructose into mannitol and does so in a particularly high yield (>80%) [25,27]. In previous studies, Lc. citreum TR116 was used to reduce sugar in many bakery products such as burger buns [28], cakes [29] and biscuits [30] while maintaining texture by additionally producing exopolysaccharides. Other researchers have used this strain to reduce sugar in a quinoa-based milk substitute [31] and for acidification to produce a lentil-based yoghurt alternative [19]. Moreover, Lc. citreum TR116 was used for the fermentation of different worts (barley, oat, wheat) to produce novel sugar-/calorie-reduced beverages [32]. As a multifunctional LAB strain, TR116 modulates flavour, carbohydrate profiles, and functional properties, such as viscosity, texture, and colour.
This study investigates the impact of the fermentation of legume flours (soy, pea, lentil) on the physicochemical, texture, and sensory properties of vegan pâté bases. A comprehensive analysis of the fermentation characteristics (microbial cell count, pH, total titratable acidity, organic acids, sugar profile) was conducted, followed by the preparation and analysis of the textures and sensory properties of pâté bases. Moreover, the effect of thermal treatment prior to fermentation was investigated.

2. Materials and Methods

2.1. Materials

The fermentation of soy flour (FRANK Food Products, Twello, The Netherlands), red lentil flour (Müller’s Mühle, Gelsenkirchen, Germany), and yellow pea flour (Müller’s Mühle, Gelsenkirchen, Germany) was conducted using the lactic acid bacteria (LAB) strain Leuconostoc citreum TR116 (which belongs to the culture collection of the Department of Biological Sciences, Munster Technological University (MTU)) and sterile tap water. Chemicals were purchased from Sigma-Aldrich (St. Louis, Missouri, USA) unless otherwise stated.

2.2. Compositional Analysis of Legume Flours

The composition of the legume flours included moisture, protein content, fat, total starch (including easily digestible starch and resistant starch), total sugars (disaccharides (sucrose/maltose), glucose, galactose, fructose) and ash content. The moisture, protein, fat and ash content were determined by an external laboratory (Chelab S.r.l., Resana, Italy). The moisture content was determined by the air oven method (pulses) AACC 44–17.01 [33]; protein was measured using the Kjeldahl method AACC 46–12.01 [34]; fat was analysed using the Soxhlet method [35]; and ash was quantified using AACC 08–01.01 [36]. The total starch was determined using the K-RAPRS resistant starch assay kit (rapid) supplied by Megazyme, Ireland. Sugars were analysed using liquid chromatography. The extraction was performed using the method reported by Hoehnel et al. (2020) [37], and the quantification was conducted as reported by Neylon et al. (2023) [38]. All analyses were performed in triplicate.

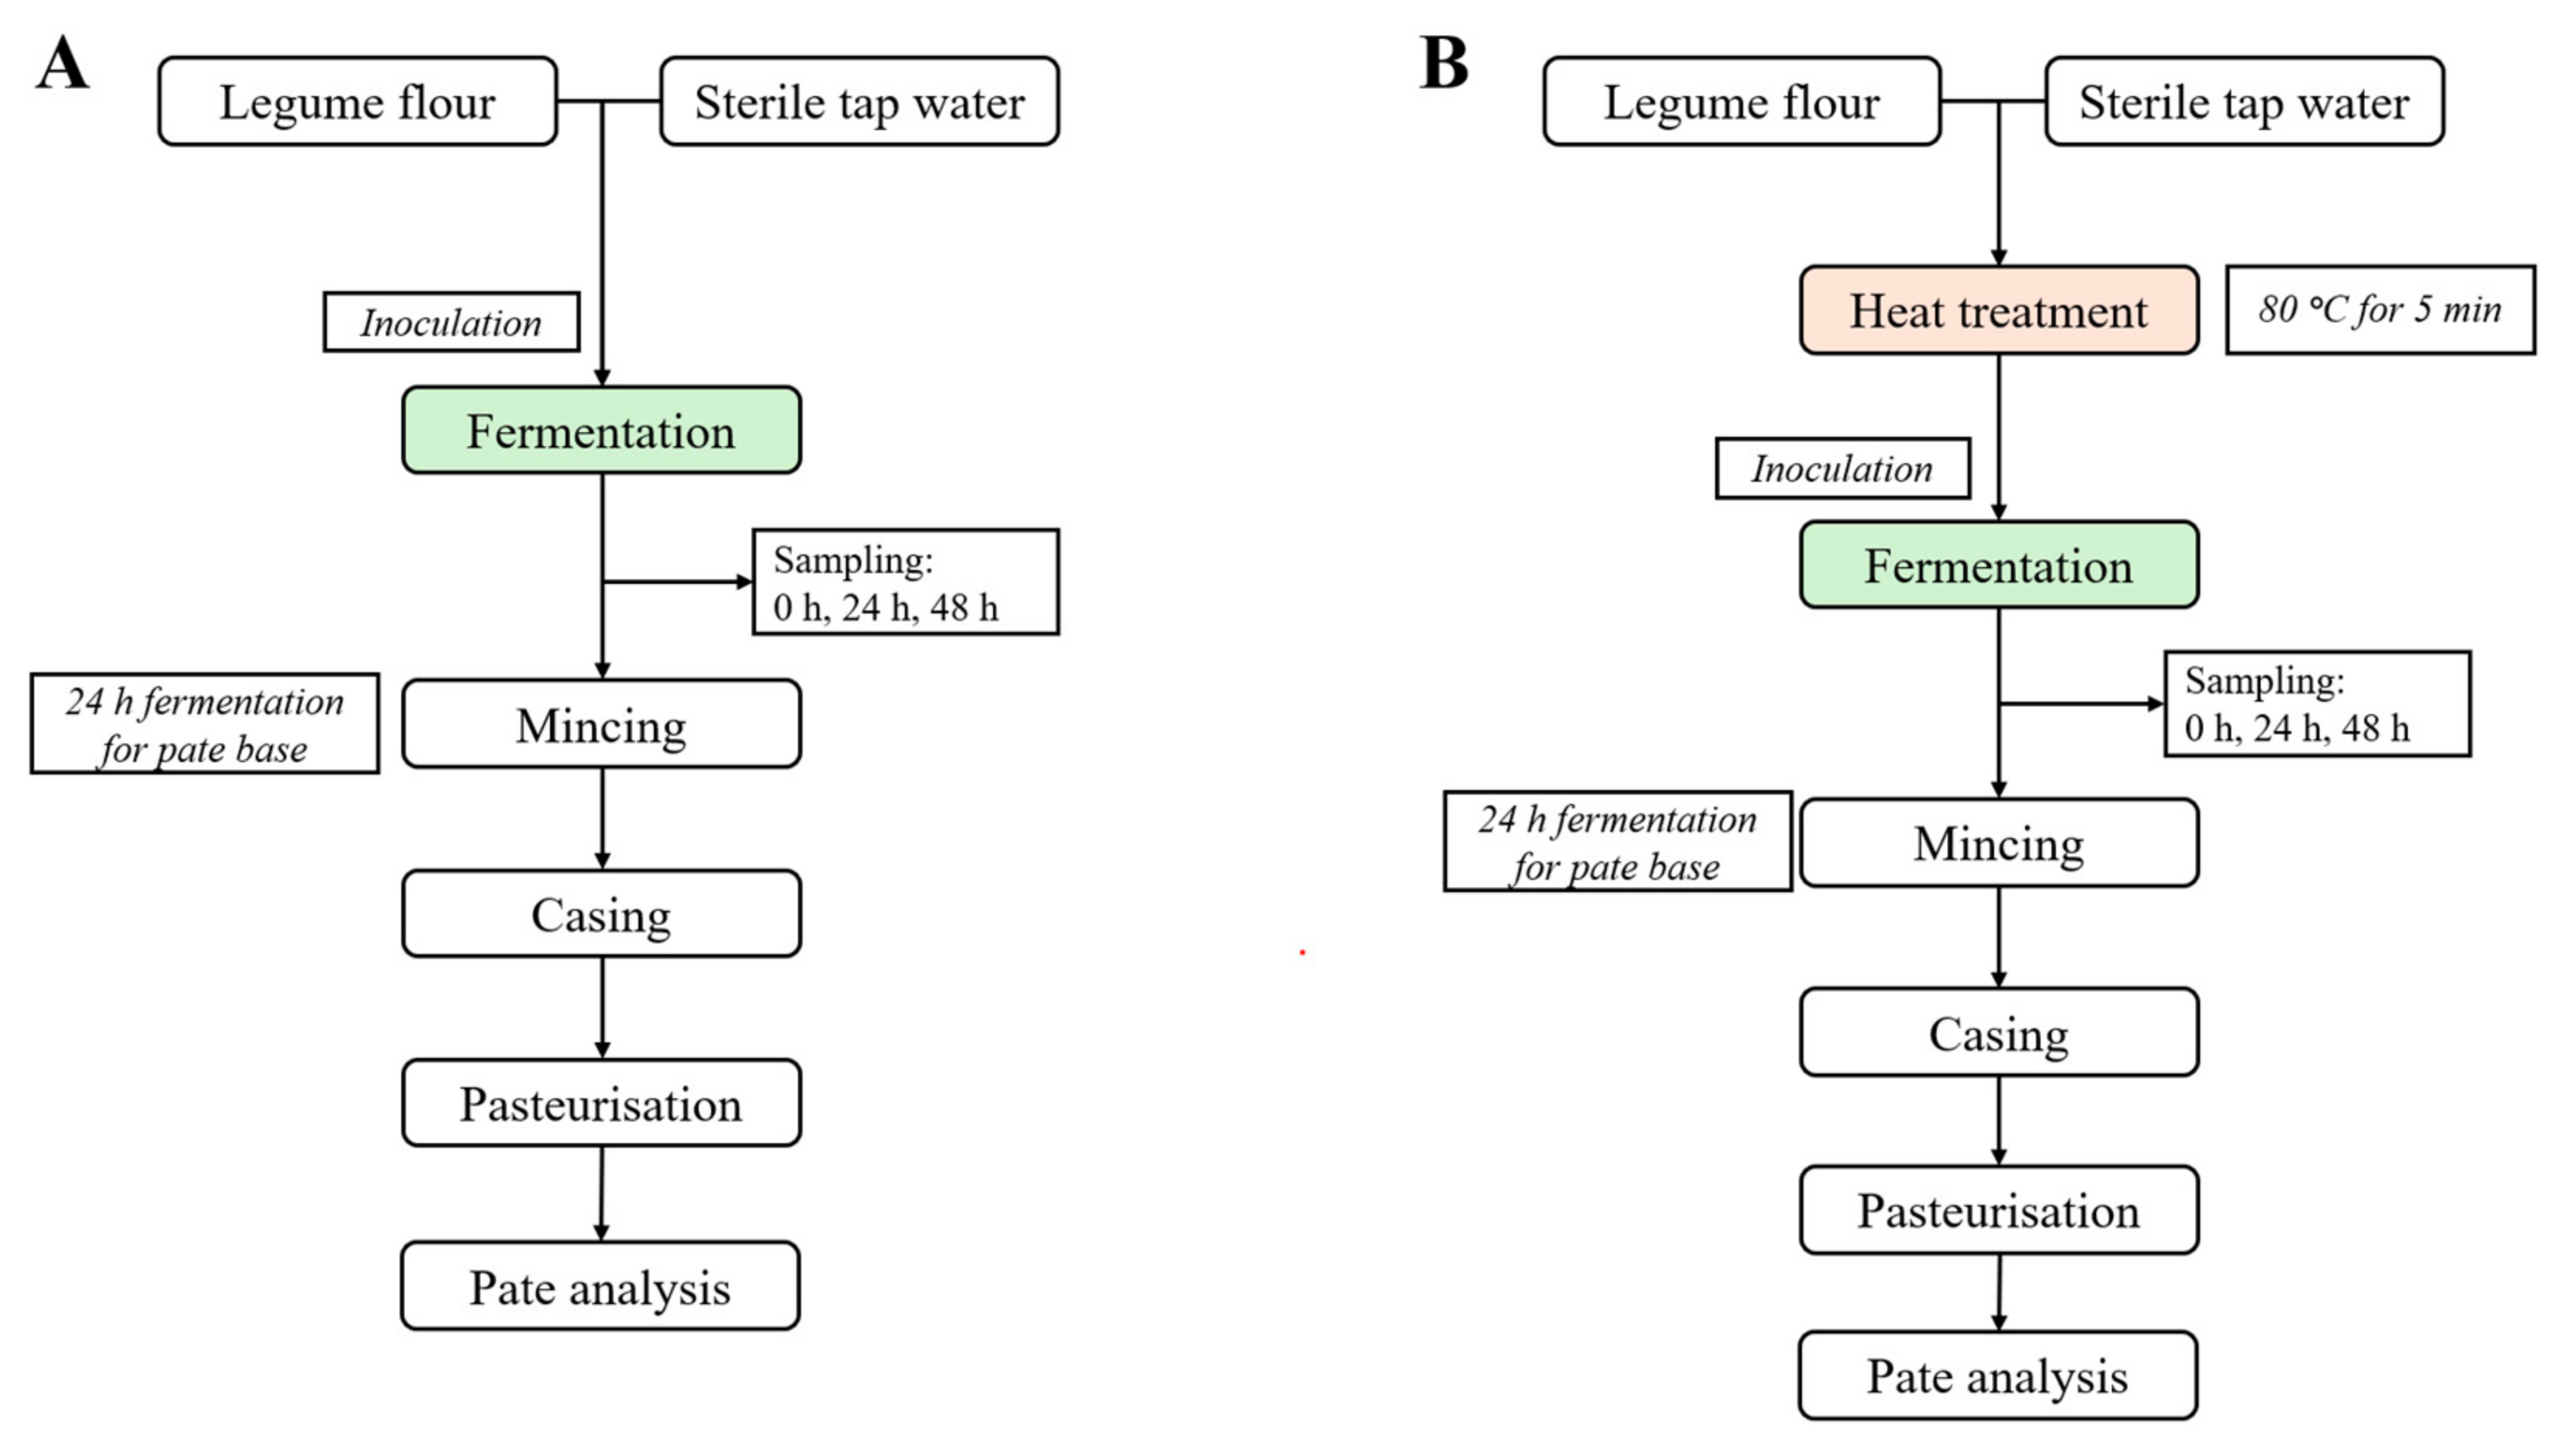
2.3. Experimental Design

The experimental design is illustrated in Figure 1. All flours were fermented with and without heat treatment prior to fermentation. As a control, the non-fermented sample was analysed. Based on the results of the microbial cell count, pH and total titratable acidity, the organic acids and sugar profiles were analysed for only time points 0 h and 24 h. Moreover, these results set the optimal fermentation time for the pâté preparation to 24 h. The heat treatment of soy flour was not conducted because it causes the flour to liquify, preventing the formation of a suitable structure for spreadable meat alternatives.

2.4. Fermentation

The medium and growth conditions for Lc. citreum TR116 are reported by Sahin et al. (2019) [28]. Prior to inoculation, a cell suspension of the strain TR116 was prepared by the pre-inoculation of one single colony in 10 mL MRS-broth 30 °C for 24 h, followed by subculturing (1%) in 10 mL MRS-broth at 30 °C for 16 h. Cells were harvested by centrifugation (5000 rpm, 10 min, 4 °C) and washed in 10 mL sterile tap water, followed by another centrifugation step (5000 rpm, 10 min, 4 °C) and resuspension in sterile tap water. Harvested cells were resuspended in 10 mL of sterile tap water and vortexed to obtain a homogeneous distribution.
A mixture of legume flour and sterile tap water was standardised to a water-to-protein ratio of 2.79 (w/w) for non-thermal-treated samples. A total volume of 300 g was prepared, and harvested cells of Lc. citreum TR116 were added to the mixtures (Figure 1), achieving a cell density of 7.0 log CFU/g total mix. A Kenwood Chef KM 330 mixer (Kenwood, Havant, UK) was used at speed 1 for one minute, followed by a second mixing step at speed 2 for another minute. Samples were packed in sterile stomacher bags under sterile conditions, then sealed and incubated at 30 °C.
The effect of heat on the flour–water mixture prior to the fermentation and its impact on fermentation performance as well as on techno-functionality was evaluated by conducting a pre-heat treatment as follows: The flour–water mixture was exposed to thermal treatment under constant stirring using an LB Electronic mashing bath (Lochner Labor + Technik, Berching, Germany). The mixture was heated to 80 °C with a heating rate of 1.0 °C/min, held at 80 °C for 5 min, and cooled to 20 °C with a cooling rate of 1.0 °C/min. The flour-to-water ratio had to be adjusted to a water-to-protein ratio of 13.4 due to increased water absorption during heating.
Analyses of microbial growth, pH, total titratable acidity (TTA) and sugar and acid profiles and quantification were performed after 24 h and 48 h. The pH, TTA and microbial growth were determined directly after sample collection, while the determination of sugars, mannitol and acids required freeze-drying prior to analysis. All fermentations were performed in triplicate.

2.5. Characterisation of Fermented Legume Flours

Fermentation behaviour (microbial growth, acidification, sugars, and organic acids) was analysed as follows.

2.5.1. Microbial Growth

Microbial growth was determined for each sample taken by homogenising 10 g of fermented legume flour in 90 mL of sterile ringer solution using a stomacher for 30 s. Serial dilutions were performed, and the enumeration of TR116 was carried out by plating on MRS agar supplemented with 0.05 g/L bromocresol green after anaerobic incubation for 48 h at 30 °C, and colony-forming units were determined by counting [38,39]. Sampling took place at 0 h, 24 h and 48 h of fermentation.

2.5.2. Acidification of Fermented Legume Flours

The pH and the total titratable acidity (TTA) were determined by adding 95 mL of distilled water and 5 mL of acetone to a beaker containing 10 g of fermented legume flours. The pH was measured using a calibrated pH-meter (Mettler-Toledo, Greifensee, Switzerland), followed by titration to a pH of 8.5 using 0.1 M NaOH.

2.5.3. Quantification of Mono-, Di-, Trisaccharides and Organic Acids

The sugar profile (mono-, di-, and trisaccharides) and the organic acids in the fermented legume flours were determined following the extraction method reported by Hoehnel et al. (2020) [37], and the quantification was conducted as reported by Neylon et al. (2023) [38]. Fermentation times of 0 h and 24 h were analysed, since these time points were finally chosen to prepare the meat alternative base.

2.6. Preparation of Pâté-like Base and Analyses of Physicochemical and Sensory Characteristics

Soy flour, yellow pea flour and red lentil flour were fermented using the LAB strain Lc. citreum TR116 for 24 h by applying the procedure reported above. A fermentation time of 24 h was chosen based on the fermentation behaviour that showed no significant changes in microbial growth and acidification after 24 h. As a control, a non-fermented and non-heat-treated sample of each legume flour was prepared. After treatment (fermentation (F), heat-treatment (HT), and heat-treatment + fermentation (HT + F)), the samples were used to fill artificial sausage casings (diameter of 115 mm) using a Kenwood CHEF XL Titanium mixer (Kenwood, Havant, UK) equipped with a food mincer attachment (Kenwood CHEF/kMix). After the casings were filled, samples were pasteurized in an Ambassador 158E autoclave (The Rodwell Autoclave Company, Basildon, Essex, UK) for 10 min at 72 °C and conserved in the fridge at 5 °C overnight. For analysis, samples were cut in 20 mm thick slices using a meat slicer (DOMO, Herentals, Belgium).

2.6.1. Texture

The texture of the samples was determined by using a TA-XTplus Texture Analyser (Stable Micro Systems, Surrey, UK) equipped with a glass cylinder probe with a diameter of 25 mm. A two-compression test with a strain of 40%, a test speed of 5 mm/s, a trigger force of 0.05 N and a waiting time of 5 s between the two compressions was chosen. The hardness, defined as the maximum force of the first compression, and the cohesiveness, which is equivalent to the maximum force of the negative curve, were evaluated. The software used for this analysis is called Texture Exponent 32 (Stable Micro Systems, Surrey, UK).

2.6.2. Colour

The colour of the samples was measured with a ChromaMeter CR-400 (Konica Minolta, Osaka, Japan). The CIE L*a*b* reference colour space was used to evaluate the colour of the samples, where L*-value represents the lightness (0 = black and 100 = white), the a*-value represents the colour scheme from green (-) to red (+), and the b*-value represents the colour from blue (-) to yellow (+).

2.6.3. Sensory

A descriptive sensory analysis was conducted using a trained panel (n = 10, 8 female and 2 male, age range 24–33) that was part of the School of Food and Nutritional Sciences at University College Cork. All samples were singly presented to the panellists in a random order. In the descriptive analysis, the panellists were asked to evaluate the intensity on a scale from 0 to 5 (0 = not present at all; 1 = very weak; 2 = weak; 3 = neither weak nor strong; 4 = strong; 5 = very strong) regarding taste (overall intensity, salty, bitter, sweet, umami, sour), flavour (overall intensity, fruity, beany, earthy, off-flavour), odour (overall intensity, beany, earthy, fruity) and texture (adhesive, juicy, crumbly).

2.7. Statistics

All analyses were performed at least in triplicate. Outliers were previously discarded. A one-way ANOVA with a Turkey post hoc test (p-value ≤ 0.05) was first performed to observe significant differences between groups using the statistical software IBM SPSS. A correlation analysis and regression were performed using Microsoft Excel.

3. Results and Discussion

3.1. Impact of Thermal Treatment on Fermentation Substrate

The compositions of the different legume flours in this study are illustrated in Table 1. SF contained the highest amount of protein (35.85 ± 0.27 g/100 g), fat (21.51 ± 0.12 g/100 g) and ash (4.44 ± 0.02 g/100 g) compared to LF and PF, but it only contained 1.47 ± 0.02 g/100 g starch. LF and PF included less fat (<1.61 g/100 g) but a significantly higher amount of starch (43–48 g/100 g) compared to SF.
Thermal treatment significantly changed the characteristics of the legume flours as a substrate for fermentation, meaning time point 0 (Table 2). Heat-treated SF resulted in a liquified substrate that was not suitable for the development of pâté-like alternatives. There are different factors that can promote the liquification of the SF. Firstly, SF contains only 1.47 ± 0.02 g/100 g of starch (Table 1). During heating, starch pasting occurs, which involves the hydration and swelling of starch granules and eventually gelatinisation, leading to network formation during cooling; hence, there is a viscosity increase [40]. A starch content of only 1.47 g/100 g does not influence the viscosity, nor does it lead to network formation. Secondly, SF contains a significant amount of fat (21.51 ± 0.12), which interacts with hydrophobic sidechains of proteins, leading to a hinderance of protein hydration [41,42] and hence counteracting network formation [42].
The thermal treatment of red lentil flour (LF-H) and yellow pea flour (PF-H) led to a slight increase in pH by +0.20 and +0.30, respectively. The total titratable acidity of both LF and PF decreased after heat treatment. LF decreased in TTA from 6.06 ± 0.09 mL 0.1 M NaOH to 2.19 ± 0.02 in LF-H. PF showed a drop in TTA from 5.72 ± 0.12 mL 0.1 M NaOH to 3.14 ± 0.13 in PF-H. Even though significant changes in pH and TTA due to thermal treatment were observed, the treatment did not significantly influence the concentrations of organic acids (Table 3). Heat treatment affects the biochemical structure of molecules, such as protein and starch. During heating, proteins denature and unfold, which results in free binding sides for hydrogen ions, leading to a reduction in H+ ions [43,44,45] and hence a lower signal, which is interpreted as an acidic medium by the pH meter [46]. Moreover, heating to 80 °C causes starch gelatinisation. During this process, amylose helices entangle and hydrogen bonds with freely available H+ ions are formed [47]. This, again, leads to a reduction of free H+ ions in solution and causes a higher value on the pH meter. Hence, the change in pH and TTA during heating is due to the molecular interactions of macromolecules with free H+ ions, rather than the presence of acids and bases.
Table 4 illustrates the sugar profiles of the legume flours without and with heat treatment at time point 0 of fermentation. Overall, an increase in total mono-and disaccharides was determined. No significant changes in glucose concentration were observed in treated pea flour. However, glucose significantly decreased in lentil flour after heat treatment. This might be due to the glycosylation of some proteins [48]. In lentil flour as well as in pea flour, a significant increase in galactose was detected after thermal treatment. This is most likely due to galactooligosaccharides being predominantly present in lentils and peas [49,50], and the temperature increase causes a partial cleavage of glycosidic bonds between galactose-based polymers [51]. Moreover, an increase in tri- and tetra-saccharides was determined. While LF-H showed an increase in both raffinose/stachyose (+0.41 g/100 g) and verbascose (+0.18 g/100 g), PF-H showed only a higher concentration of verbascose (+0.25 g/100 g). The increase in these carbohydrates occurred putatively due to the same reason, namely the partial hydrolysis of galactooligosaccharides.

3.2. Fermentation Characteristics of Thermal-Treated Versus Non-Treated Legume Flours

The growth of Lc. citreum TR116 in the different substrates is reflected by the bacterial cell count and the maximum growth rate during 48 h of fermentation (Table 2). Lc. citreum TR116 grew in all media from log 7 (inoculation level) to log 9 within 24 h (exponential phase), followed by no significant changes between 24 h and 48 h (stationary phase) (Figure 2). All non-thermal-treated legume flours showed the same bacterial cell count after 24 h and 48 h of fermentation. However, the heat treatment prior to fermentation caused a slight but significantly lower cell count. This is also reflected by the maximum growth rate. In the exponential phase (first 24 h), the maximum growth rate was significantly lower in LF-H (0.09) and PF-H (0.06) compared to the non-thermal-treated samples SF (0.13), LF (0.12), and PF (0.11) (Table 2). One would expect an increase in microbial growth after thermal treatment due to starch gelatinisation, leading to a higher degree of hydrolysis during fermentation [52].
The slightly lower cell count can be explained firstly by the higher water absorption of macromolecules due to the application of heat, leading to less water being available for microbial growth [53], and secondly, by the formation of protein–carbohydrate complexes, resulting in a hinderance of substrate accessibility, such as carbohydrate sources and nitrogen sources, for Lc. citreum TR116 [54]. The highest pH values occurred in all unfermented legume flour samples, with values between 6.48 (PF (t0)) and 6.81 (SF (t0)). As expected, fermentation caused a drop in pH. The lowest pH values were determined in fermented LF (4.69–4.80) and fermented PF (4.83–4.99). The fermentation of heat-treated flours LF-H and PF-H led to a significantly higher pH value compared to non-thermal-treated samples. This is most likely due to the reduced metabolic activity of Lc. citreum TR116 observed in heat-treated samples. Reduced metabolic activity and bacterial growth can be caused by lower available nutrients, specifically carbohydrates. During starch pasting, starch gelatinises and retrogrades. The retrogradation of starch can result in the formation of resistant starch, which is less accessible to enzymes, cleaving glycosidic bonds and freeing single sugars [55]. This can cause a limitation of substrates for Lc. citreum TR116. Moreover, the sugar profile in Table 4 indicates less galactose residues in thermal-treated and fermented samples, which reflects a lower degree of degradation of galactooligosaccharides. The reduced metabolic activity of Lc. citreum TR116 in heat-treated samples is also reflected in the TTA measurements, which negatively correlated with the pH (r = −0.83; p < 0.01), illustrated in the heat map in Figure 3. The lowest TTA values were determined in unfermented, heat-treated legume flours (LF-H: 2.19 ± 0.02 mL 0.1 M NaOH/10 g and PF-H: 3.14 ± 0.13 mL 0.1 M NaOH/10 g) (Table 2), followed by unfermented, non-heat-treated PF (5.72 ± 0.12 mL 0.1 M NaOH/10 g), SF (5.87 ± 0.19 mL 0.1 M NaOH/10 g) and LF (6.06 ± 0.09 mL 0.1 M NaOH/10 g). The fermentation of LF and PF resulted in the highest TTA values after 48 h of fermentation, with 24.98 ± 0.33 mL 0.1 M NaOH/10 g and 24.35 ± 0.29 mL 0.1 M NaOH/10 g, respectively. The TTA of SF (t48) (16.08 ± 0.12 mL 0.1 M NaOH/10 g) was significantly lower compared to LF and PF. This can be attributed to the composition of the ingredients, specifically the amounts of digestible starch (Table 1) and the sugar profile (Table 4). LF and PF contain a significant amount of digestible starch, while sucrose was the main carbohydrate source in SF. The correlation analysis revealed a negative correlation between microbial cell count and glucose (r = −0.74; p < 0.01) and sucrose (r = −0.74; p < 0.01), meaning that residual glucose and sucrose indicate lower microbial growth/activity (Figure 3). This observation is strengthened by the positive correlation between microbial cell count and lactic acid (r = 0.88; p < 0.01) and acetic acid (r = 0.84; p < 0.01) as the main metabolites of Lc. citreum TR116 [25]. Even though the cell count in all fermented samples is >109 after 24 h, the microbial growth in LF-H and PF-H is significantly lower compared to the growth in non-thermal-treated and fermented flours (Figure 2). This is also reflected in the TTA, which is the lowest in fermented LF-H (4.20–4.45 mL 0.1 M NaOH/10 g) and PF-H (5.97–7.18 mL 0.1 M NaOH/10 g) amongst all fermented flours. As discussed above, thermal treatment changes the chemical structure of constituents, influencing the amount of free H+ and OH-, which could have caused the low TTA value determined. One of the characteristics of TR116 is its ability to convert fructose into mannitol. Mannitol concentrations positively correlated with microbial cell count (r = 0.76; p < 0.01) and lactic acid (r = 0.78; p < 0.01). An even stronger correlation was observed between mannitol and acetic acid (r = 0.94; p < 0.01) concentrations in fermented samples. Mannitol formation and acetic acid production are directly linked in the metabolic pathway of TR116. Fructose is enzymatically reduced to mannitol while NAD+ is generated, which is an essential co-factor for acetate kinase to produce acetate [25,27,28].

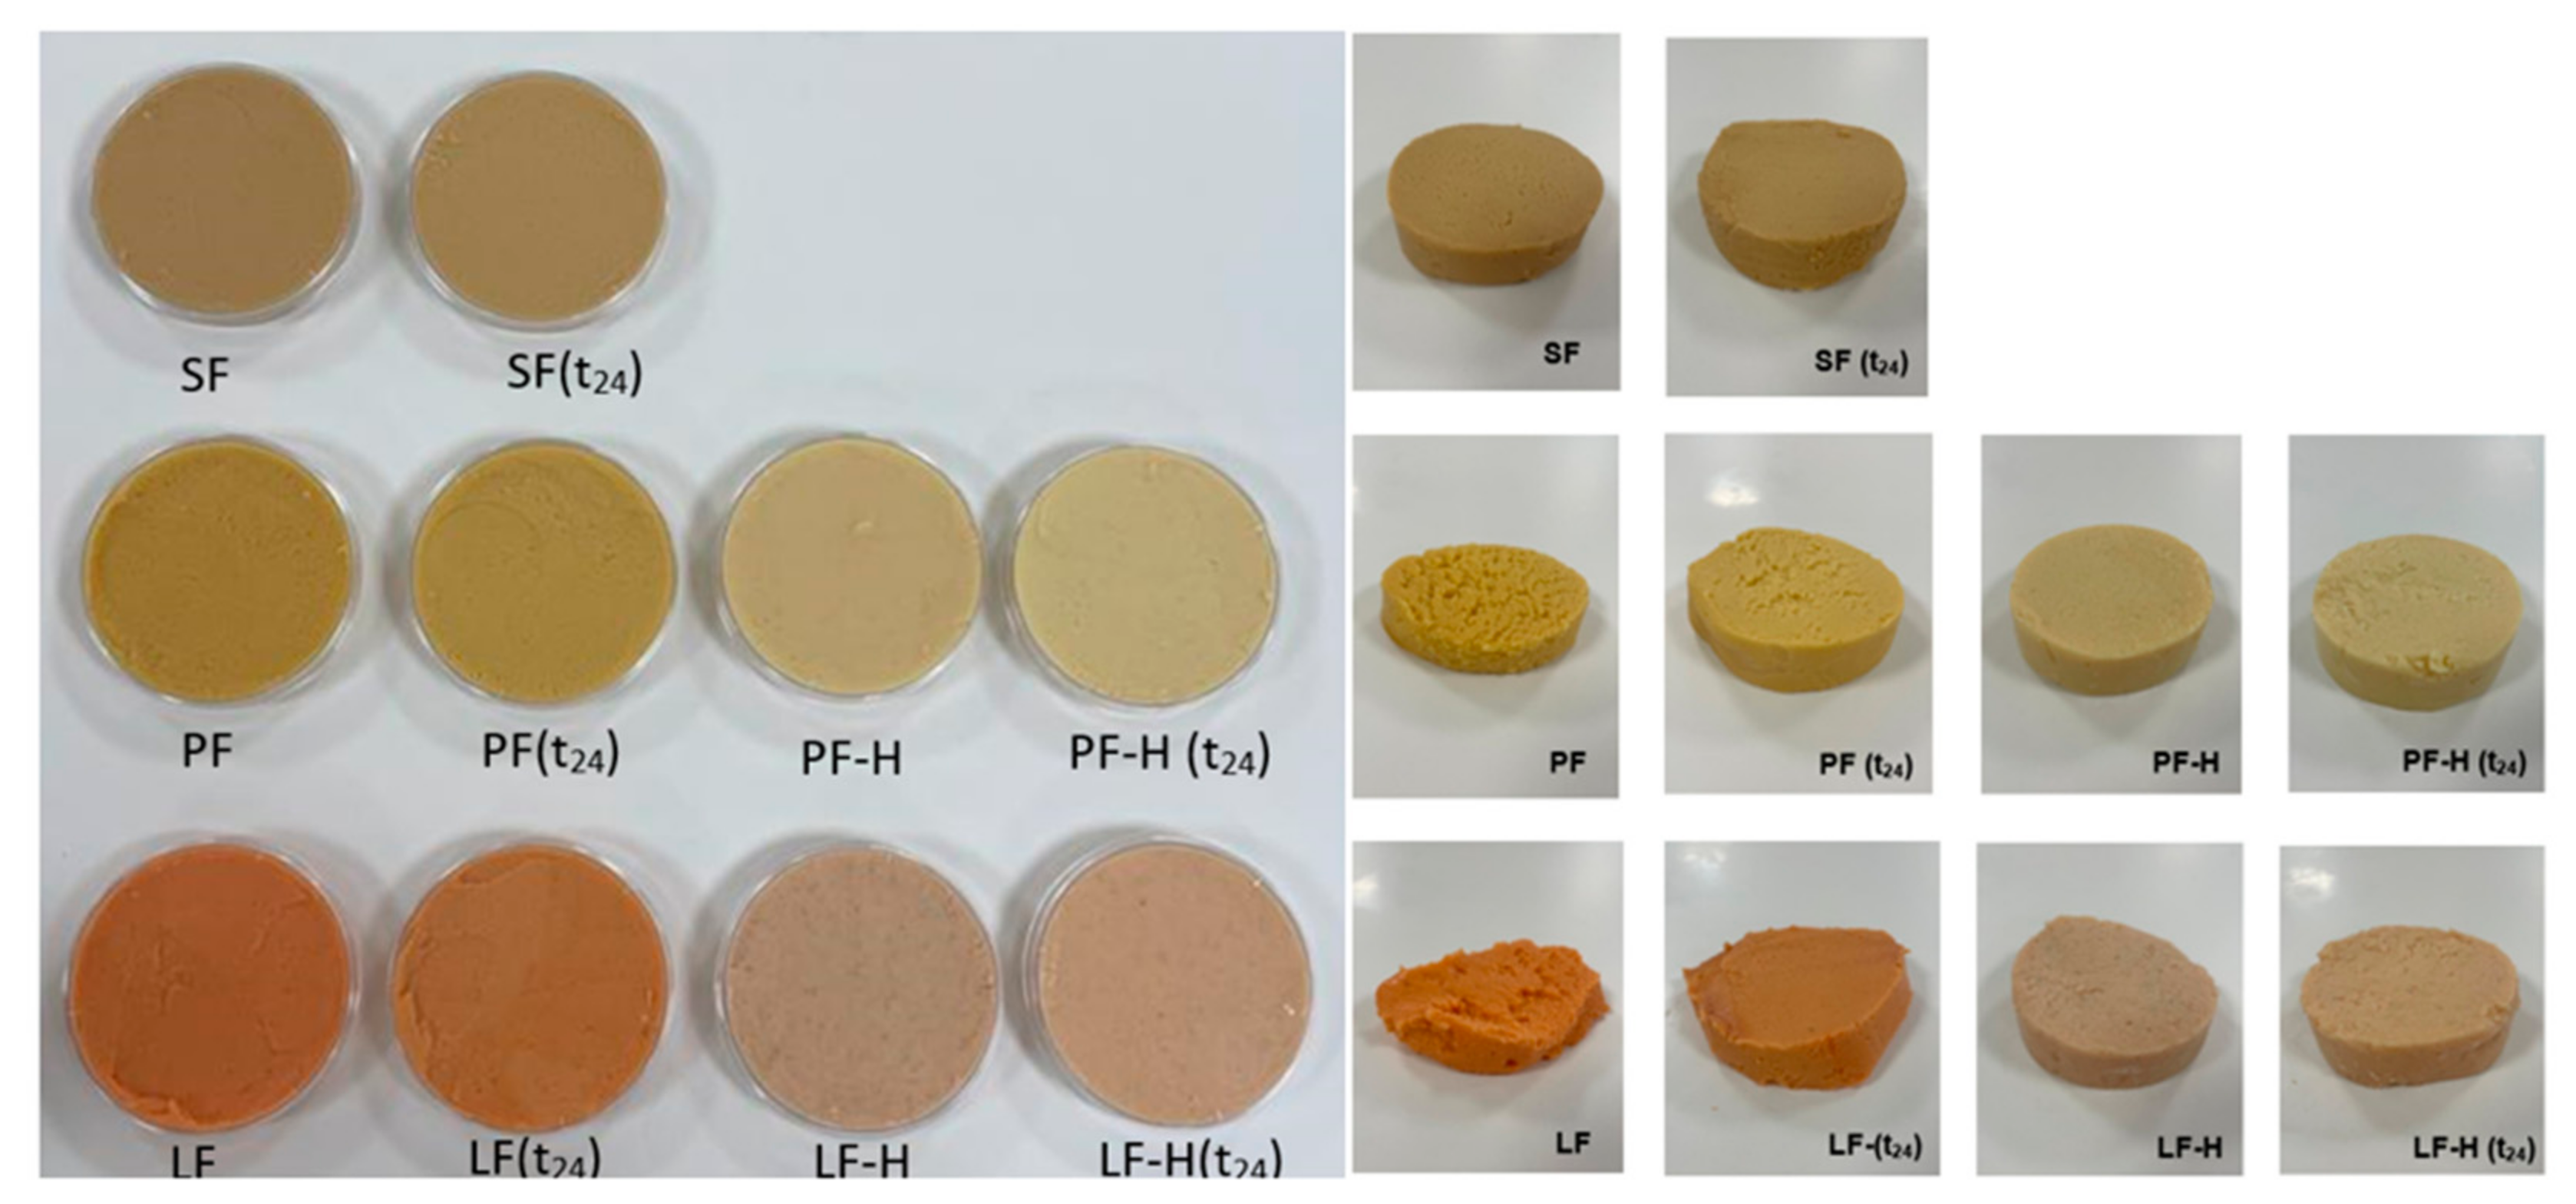
3.3. Physicochemical and Sensory Characteristics of Spreadable Meat Alternative

Fermentation technology can be used to modify legume flours, making them more suitable for the development of meat alternatives, for example. This study investigates not only the modification of the legume flours caused by fermentation but also the impact of thermal processing prior to fermentation, leading to changes in texture, colour and sensory properties. Samples were processed as a pâté base excluding any other ingredients, as mentioned in the method section, followed by pasteurisation and cooling prior to the analysis of texture, colour, and sensory characteristics.

3.3.1. Texture

The two-compression test revealed values for firmness (N), adhesiveness (N) and cohesiveness (N), which are shown in Table 5. SF showed the highest firmness amongst unfermented samples (20.73 ± 1.13 N). No differences in were determined between LF (t0) and PF (t0). Heat treatment increased the hardness from 2.10 ± 0.15 N in LF (t0) to 15.86 ± 1.34 N LF-H (t0), and from 4.11 ± 0.69 N in PF (t0) to 19.24 ± 0.76 N in PF-H (t0). Fermentation did not change the texture properties (firmness, adhesiveness, cohesiveness) of SF, but it changed these attributes in LF and PF. Interestingly, fermented, non-heat-treated samples resulted in a significant increase in pâté firmness compared to heat-treated and fermented samples. This is most likely due to the starch gelatinisation [47,56,57] and protein denaturation process [58,59] taking place during the pasteurisation step of the samples packed in sausage casings. The space limitation in the casing ensured tight network formation. The firmness of heat-treated samples is significantly higher compared to non-thermal treated samples. Fermentation did not change the firmness of heat-treated samples (LF-H and PF-H), which is also revealed by the correlation analysis in Figure 3 showing no correlations between fermentation characteristics (pH, TTA, organic acids, sugars) and firmness. This emphasises that firmness is influenced by thermally induced modifications of constituents in legume flours, caused by thermal processing before pâté preparation. As mentioned above, heat treatment increases water absorption [60] and hence the hydration of the flours, leading to a higher degree of starch pasting and protein denaturation. Protein network formation during cooling is caused by the formation of non-covalent bonds, such as hydrogen bonds and ionic bonds, and covalent bonds, meaning disulfide bonds [61,62,63]. Stronger network formation during processing led to a higher firmness of the pâté base.
Adhesiveness represents the stickiness of the pâté to the surface after compression. While fermentation did not impact the adhesiveness of soy flour (SF (t0) = 10.86 ± 2.22 N; SF (t24) = 10.85 ± 1.30 N), it increased it in lentil flour (LF (t0) = 1.27 ± 0.23 N; LF (t24) = 5.64 ± 1.98 N) and pea flour. The correlation analysis (Figure 3) revealed a positive correlation between adhesiveness and raffinose/verbascose (r = 0.87; p < 0.01). Fermentation causes the breakdown of complex carbohydrates. Pulses contain galactooligosaccharides [49], which are partly hydrolysed into trisaccharides, such as raffinose/verbascose, during fermentation due to microbial enzyme activity and the decrease in pH (acid hydrolysis) [64]. With the biotransformation of high-molecular-weight polysaccharides (starch and galactans) to lower-molecular-weight carbohydrates (oligosaccharides and sugars), the degree of carbohydrate-based network formation decreases, leading to more sticky and adhesive products [28,37,65]. The quantity as well as the type of saccharides influence their water affinity and hence the adhesive behaviour of foods [66]. It needs to be noted that heat treatment reduced the adhesiveness of the pâtés, which is most likely due to the increase in the degree of hydration of the legume flours, resulting in less free water [67]. Moreover, thermal treatment changed the rheological characteristics of the flours, showing elastic rather than viscous behaviour due to starch gelatinisation and protein denaturation [68]. The impact of structure formation during thermal treatment is reflected in the cohesiveness measurements. Cohesiveness represents the strength of the internal bond in the pâtés and refers to the sample’s ability to withstand deformation before breakage [69]. Table 5 shows that only thermal treatment affected the cohesiveness of the pâté samples, leading to significantly lower cohesiveness values, meaning that heat-treated pâté samples withstand the compression test to a lesser extent and experience faster breakage. This highlights the crucial role of molecular changes during heating and cooling in food-texture formation.

3.3.2. Colour

Processing can have a major effect on the appearance of food products, specifically on the colour. Figure 4 illustrates the appearance of the pâté samples. The change in colour of the pâtés due to fermentation or/and heat-treatment is represented as the ΔE value (Table 5). The higher the ΔE, the more the change in colour. The fermentation of the legume flours showed ΔE values between 2.53 ± 1.74 (LF (t24)) and 3.09 ± 1.04 (SF (t(24)). These colour changes are relatively low compared to the ΔE values of heat-treated pâté samples. Amongst all samples, LF-H (t0) showed the greatest colour change (ΔE = 24.43 ± 0.93), followed by LF-H (t24) (ΔE = 21.45 ± 0.67). PF-H (t0) had an ΔE of 14.62 ± 0.99 and was not significantly different from PF-H (t24). Heat treatment increased the brightness of the sample colours. This is most likely due to the loss of pigments and the oxidation of phenolic compounds during thermal processing [70].

3.3.3. Sensory

The sensory characteristics of the pâté bases included in the descriptive analysis (Figure 5) were taste (overall intensity, saltiness, bitterness, sweetness, sourness, umaminess), flavour (overall intensity, fruity, beany, earthy, off-flavour), aroma (overall intensity, beany, earthy, fruity), and texture (adhesive, crumbly, juicy).
Figure 5A demonstrates the descriptive taste analysis. SF showed a high sweetness, which reflects the sucrose content in the flour (6.67 g/100 g), and it also had some umami taste, which was elevated by fermentation (intensity score SF = 2.45; SF (t24) = 3.15). The taste receptors responsible for the perception of sweetness or umami are the same [71]. TR116 has been reported as a suitable strain for sugar reduction by enhancing sweetness [28,29,30,65]. Hence, a molecular symbiosis between single sugars, acids, and mannitol might have caused an increased umami signal to move from the receptor to the brain. LF and PF showed the highest intensity scores for bitterness, which was significantly decreased by heat treatment, to a greater extent than by fermentation. The heat treatment and fermentation of lentil flour even resulted in a slight increase in bitterness, which was most likely caused by a synergistic effect of sourness and bitterness [72]. The high metabolic activity of Lc. citreum TR116 in LF and PF led to the highest sourness in LF (t24) (4.37 ± 0.49) and PF (t24) (4.46 ± 0.51).
Regarding flavour characteristics (Figure 5B), fermentation increased the fruitiness in all samples, with LF (t24) showing the highest fruitiness score, followed by PF (t24). The increased fruity flavour is most likely due to the formation of ethyl acetate; it is formed by the condensation of acetate with ethanol fermentation end products (all metabolites of TR116 [25]) and has been reported to cause fruity, sweet and brandy-like flavours [32,73]. Heat-treated samples showed an overall lower flavour intensity, which is most likely due to the loss of volatile compounds [74]. Additionally, heat-treated and fermented samples (LF-H (t24) and PF-H (t24)) were perceived as less fruity than samples not heat-treated before fermentation (LF-H and PF-H). This aligns with the lower degree of metabolic activity of Lc. citreum TR116 in LF-H and PF-H. Organic acids such as citric acid can increase fruitiness characteristics in fermented foods. The fermentation of legume flours decreased the typical beany and earthy flavour in SF, LF, and PF, but heat treatment also led to a decay in these flavour attributes. Beany notes are perceived due to components such as saponins, alkaloids or phenolic compounds, which can be degraded by high temperatures [75]. Interestingly, fermentation did not change the perception of the off-flavour of PF, but a decrease in off-flavour was determined in LF after fermentation.
Aroma characteristics showed an increase in overall aroma intensity caused by fermentation (Figure 5C), specifically in fruitiness. The beany aroma was slightly but not significantly elevated after fermentation, and the earthy aroma was increased by heat treatment. Fermentation did not affect earthiness.
Figure 5D illustrates the texture characteristics of the pâté samples. The results of adhesiveness adhered to the texture profile analysis of the pâté bases. Fermentation decreased the crumbly texture of the samples. However, heat treatment prior to fermentation showed the opposite result, meaning an increase in crumbliness was perceived by the panellists. This is due to the development of a stronger network within the sample, caused by starch gelatinisation and protein denaturation. Samples pre-treated with heat and further processed through the mincer turned into a crumbly material before being used to fill the casing. Lentil flour resulted in the highest juiciness, regardless of the application of fermentation. Heat treatment decreased the juiciness sensation most likely due to the crumblier texture. Pea-flour-based pâté was perceived as less juicy than lentil-flour-based pâté samples. Bitterness is known to correlate with astringency, which, in turn, significantly influences juiciness [74]. The higher the intensity of astringency/bitterness, the less juicy the panel perceived the samples to be.

4. Conclusions

Lc. citreum TR116 is a multifunctional strain that has been used to modulate different types of food ingredients. In this study, the effect of the thermal treatment of legume flours (soy, pea, lentil) on the fermentation performance of TR116 was investigated, and their suitability for spreadable meat alternatives was tested. Interestingly, treating the flours thermally before fermentation changed the performance of Lc. citreum TR116—specifically, it reduced acidification and microbial growth. Moreover, thermal treatment of the flours prior to fermentation impacted the physicochemical properties of spreadable meat alternatives. Heat-treated samples changed in colour and showed a crumblier texture, which is less desired in spreadable food products. Non-heat-treated, fermented red lentil flour had a soft and smooth texture, leading to high spreadability, and it showed promising sensory characteristics. Hence, fermented red lentil flour with TR116 without heat treatment is recommended as a base for the further development of spreadable meat alternatives, while heat-treated legume flours might be suitable for sausage-like meat substitutes. Future research should be focused on the impact of other constituents of spreadable meat alternatives during the production process, such as salt and fat, for example.

Author Contributions

Conceptualisation, A.W.S.; methodology, O.G., S.G. and A.W.S.; formal analysis, O.G.; writing—original draft preparation, A.W.S. and O.G.; writing—review and editing, S.G.; visualisation, O.G. and A.W.S.; supervision, S.G. and A.W.S. All authors have read and agreed to the published version of the manuscript.

Funding

This research received no external funding, except for raw ingredients. The pea flour and lentil flour were funded by the Smart Protein Project (European Union Horizon 2020 research and innovation programme under grant agreement No 862957).

Data Availability Statement

The raw data supporting the conclusions of this article will be made available by the authors on request.

Acknowledgments

The authors would like to thank Aidan Coffey (Munster Technical University) for providing the lactic acid bacteria strain Leuconostoc citreum TR116.

Conflicts of Interest

The authors declare no conflicts of interest.

References

  1. Fiala, N. Meeting the Demand: An Estimation of Potential Future Greenhouse Gas Emissions from Meat Production. Ecol. Econ. 2008, 67, 412–419. [Google Scholar] [CrossRef]
  2. Smetana, S.; Mathys, A.; Knoch, A.; Heinz, V. Meat Alternatives: Life Cycle Assessment of Most Known Meat Substitutes. Int. J. Life Cycle Assess. 2015, 20, 1254–1267. [Google Scholar] [CrossRef]
  3. Pavan Kumar, M.K.; Chatli, N.M.P.S.O.P.M.; Verma, A.K. Meat Analogues: Health Promising Sustainable Meat Substitutes. Crit. Rev. Food Sci. Nutr. 2017, 57, 923–932. [Google Scholar] [CrossRef] [PubMed]
  4. Stagnari, F.; Maggio, A.; Galieni, A.; Pisante, M. Multiple Benefits of Legumes for Agriculture Sustainability: An Overview. Chem. Biol. Technol. Agric. 2017, 4, 2. [Google Scholar] [CrossRef]
  5. Hoehnel, A.; Zannini, E.; Arendt, E.K. Targeted Formulation of Plant-Based Protein-Foods: Supporting the Food System’s Transformation in the Context of Human Health, Environmental Sustainability and Consumer Trends. Trends Food Sci. Technol. 2022, 128, 238–252. [Google Scholar] [CrossRef]
  6. Sha, L.; Xiong, Y.L. Plant Protein-Based Alternatives of Reconstructed Meat: Science, Technology, and Challenges. Trends Food Sci. Technol. 2020, 102, 51–61. [Google Scholar] [CrossRef]
  7. Ma, K.K.; Greis, M.; Lu, J.; Nolden, A.A.; McClements, D.J.; Kinchla, A.J. Functional Performance of Plant Proteins. Foods 2022, 11, 594. [Google Scholar] [CrossRef] [PubMed]
  8. Jia, F.; Peng, S.; Green, J.; Koh, L.; Chen, X. Soybean Supply Chain Management and Sustainability: A Systematic Literature Review. J. Clean. Prod. 2020, 255, 120254. [Google Scholar] [CrossRef]
  9. Xia, J.; Zu, Q.; Yang, A.; Wu, Z.; Li, X.; Tong, P.; Yuan, J.; Wu, Y.; Fan, Q.; Chen, H. Allergenicity Reduction and Rheology Property of Lactobacillus-Fermented Soymilk. J. Sci. Food Agric. 2019, 99, 6841–6849. [Google Scholar] [CrossRef]
  10. Kumari, T.; Deka, S.C. Potential Health Benefits of Garden Pea Seeds and Pods: A Review. Legume Sci. 2021, 3, e82. [Google Scholar] [CrossRef]
  11. Abu Risha, M.; Rick, E.M.; Plum, M.; Jappe, U. Legume Allergens Pea, Chickpea, Lentil, Lupine and Beyond. Curr. Allergy Asthma Rep. 2024. [Google Scholar] [CrossRef]
  12. Del Borghi, A.; Tacchino, V.; Moreschi, L.; Matarazzo, A.; Gallo, M.; Arellano Vazquez, D. Environmental Assessment of Vegetable Crops towards the Water-Energy-Food Nexus: A Combination of Precision Agriculture and Life Cycle Assessment. Ecol. Indic. 2022, 140, 109015. [Google Scholar] [CrossRef]
  13. Boeck, T.; Sahin, A.W.; Zannini, E.; Arendt, E.K. Nutritional Properties and Health Aspects of Pulses and Their Use in Plant-Based Yogurt Alternatives. Compr. Rev. Food Sci. Food Saf. 2021, 20, 3858–3880. [Google Scholar] [CrossRef] [PubMed]
  14. Marchini, M.; Carini, E.; Cataldi, N.; Boukid, F.; Blandino, M.; Ganino, T.; Vittadini, E.; Pellegrini, N. The Use of Red Lentil Flour in Bakery Products: How Do Particle Size and Substitution Level Affect Rheological Properties of Wheat Bread Dough? LWT 2021, 136, 110299. [Google Scholar] [CrossRef]
  15. Hajas, L.; Sipos, L.; Csobod, C.; Bálint, M.V.; Juhász, R.; Benedek, C. Lentil (Lens Culinaris Medik.) Flour Varieties as Promising New Ingredients for Gluten-Free Cookies. Foods 2022, 11, 2028. [Google Scholar] [CrossRef] [PubMed]
  16. Luo, S.; Chan, E.; Masatcioglu, M.T.; Erkinbaev, C.; Paliwal, J.; Koksel, F. Effects of Extrusion Conditions and Nitrogen Injection on Physical, Mechanical, and Microstructural Properties of Red Lentil Puffed Snacks. Food Bioprod. Process. 2020, 121, 143–153. [Google Scholar] [CrossRef]
  17. Sinaki, N.Y.; Koksel, F. Effects of Dietary Fibre Source and Content and Extrusion Conditions on the Physicochemical Composition and Physical Quality of Fibre-Enriched Lentil Snacks. Int. J. Food Sci. Technol. 2024, 59, 2236–2248. [Google Scholar] [CrossRef]
  18. Boeck, T.; Zannini, E.; Sahin, A.W.; Bez, J.; Arendt, E.K. Nutritional and Rheological Features of Lentil Protein Isolate for Yoghurt-like Application. Foods 2021, 10, 1692. [Google Scholar] [CrossRef]
  19. Boeck, T.; Ispiryan, L.; Hoehnel, A.; Sahin, A.W.; Coffey, A.; Zannini, E.; Arendt, E.K. Lentil-Based Yogurt Alternatives Fermented with Multifunctional Strains of Lactic Acid Bacteria—Techno-Functional, Microbiological, and Sensory Characteristics. Foods 2022, 11, 2013. [Google Scholar] [CrossRef]
  20. Romano, A.; Gallo, V.; Ferranti, P.; Masi, P. Lentil Flour: Nutritional and Technological Properties, in Vitro Digestibility and Perspectives for Use in the Food Industry. Curr. Opin. Food Sci. 2021, 40, 157–167. [Google Scholar] [CrossRef]
  21. Lee, H.W.; Lu, Y.; Zhang, Y.; Fu, C.; Huang, D. Physicochemical and Functional Properties of Red Lentil Protein Isolates from Three Origins at Different PH. Food Chem. 2021, 358, 129749. [Google Scholar] [CrossRef] [PubMed]
  22. Sathe, S.K. Chemistry and Implications of Antinutritional Factors in Dry Beans and Pulses. Dry Beans Pulses Prod. Process. Nutr. 2012, 359–377. [Google Scholar] [CrossRef]
  23. Leroy, F.; De Vuyst, L. Lactic Acid Bacteria as Functional Starter Cultures for the Food Fermentation Industry. Trends Food Sci. Technol. 2004, 15, 67–78. [Google Scholar] [CrossRef]
  24. Garrido-Galand, S.; Asensio-Grau, A.; Calvo-Lerma, J.; Heredia, A.; Andrés, A. The Potential of Fermentation on Nutritional and Technological Improvement of Cereal and Legume Flours: A Review. Food Res. Int. 2021, 145, 110398. [Google Scholar] [CrossRef]
  25. Sahin, A.W.; Rice, T.; Coffey, A. Genomic Analysis of Leuconostoc citreum TR116 with Metabolic Reconstruction and the Effects of Fructose on Gene Expression for Mannitol Production. Int. J. Food Microbiol. 2021, 354, 109327. [Google Scholar] [CrossRef]
  26. Hemme, D.; Foucaud-Scheunemann, C. Leuconostoc, Characteristics, Use in Dairy Technology and Prospects in Functional Foods. Int. Dairy J. 2004, 14, 467–494. [Google Scholar] [CrossRef]
  27. Gänzle, M.G. Lactic Metabolism Revisited: Metabolism of Lactic Acid Bacteria in Food Fermentations and Food Spoilage. Curr. Opin. Food Sci. 2015, 2, 106–117. [Google Scholar] [CrossRef]
  28. Sahin, A.W.; Rice, T.; Zannini, E.; Axel, C.; Coffey, A.; Lynch, K.M.; Arendt, E.K. Leuconostoc citreum TR116: In-Situ Production of Mannitol in Sourdough and Its Application to Reduce Sugar in Burger Buns. Int. J. Food Microbiol. 2019, 302, 80–89. [Google Scholar] [CrossRef]
  29. Sahin, A.W.; Rice, T.; Zannini, E.; Lynch, K.M.; Coffey, A.; Arendt, E.K. Sourdough Technology as a Novel Approach to Overcome Quality Losses in Sugar-Reduced Cakes. Food Funct. 2019, 10, 4985–4997. [Google Scholar] [CrossRef]
  30. Sahin, A.W.; Rice, T.; Zannini, E.; Lynch, K.M.; Coffey, A.; Arendt, E.K. The Incorporation of Sourdough in Sugar-Reduced Biscuits: A Promising Strategy to Improve Techno-Functional and Sensory Properties. Eur. Food Res. Technol. 2019, 245, 1841–1854. [Google Scholar] [CrossRef]
  31. Jeske, S.; Zannini, E.; Lynch, K.M.; Coffey, A.; Arendt, E.K. Polyol-Producing Lactic Acid Bacteria Isolated from Sourdough and Their Application to Reduce Sugar in a Quinoa-Based Milk Substitute. Int. J. Food Microbiol. 2018, 286, 31–36. [Google Scholar] [CrossRef]
  32. Rice, T.; Sahin, A.W.; Heitmann, M.; Lynch, K.M.; Jacob, F.; Arendt, E.K.; Coffey, A. Application of Mannitol Producing Leuconostoc citreum TR116 to Reduce Sugar Content of Barley, Oat and Wheat Malt-Based Worts. Food Microbiol. 2020, 90, 103464. [Google Scholar] [CrossRef]
  33. AACC International AACC 44-17.01. In Approved Methods of the AACC; American Association of Cereal Chemists: St. Paul, MN, USA.
  34. AACC International AACC 46-12.01. In Approved Methods of the AACC; American Association of Cereal Chemists: St. Paul, MN, USA.
  35. AACC International AACC 30-25.01. In Approved Methods of the AACC; American Association of Cereal Chemists: St. Paul, MN, USA.
  36. AACC International AACC 08-01.01. In Approved Methods of the AACC; American Association of Cereal Chemists: St. Paul, MN, USA.
  37. Hoehnel, A.; Bez, J.; Sahin, A.W.; Coffey, A.; Arendt, E.K.; Zannini, E. Leuconostoc citreum TR116 as a Microbial Cell Factory to Functionalise High-Protein Faba Bean Ingredients for Bakery Applications. Foods 2020, 9, 1706. [Google Scholar] [CrossRef] [PubMed]
  38. Neylon, E.; Nyhan, L.; Zannini, E.; Monin, T.; Münch, S.; Sahin, A.W.; Arendt, E.K. Food Ingredients for the Future: In-Depth Analysis of the Effects of Lactic Acid Bacteria Fermentation on Spent Barley Rootlets. Fermentation 2023, 9, 78. [Google Scholar] [CrossRef]
  39. Waters, D.M.; Kingston, W.; Jacob, F.; Titze, J.; Arendt, E.K.; Zannini, E. Wheat Bread Biofortification with Rootlets, a Malting by-Product. J. Sci. Food Agric. 2013, 93, 2372–2383. [Google Scholar] [CrossRef]
  40. Blazek, J.; Copeland, L. Pasting and Swelling Properties of Wheat Flour and Starch in Relation to Amylose Content. Carbohydr. Polym. 2008, 71, 380–387. [Google Scholar] [CrossRef]
  41. Kinsella, J.E. Functional Properties of Soy Proteins. J. Am. Oil Chem. Soc. 1979, 56, 242–258. [Google Scholar] [CrossRef]
  42. Shevkani, K.; Kaur, M.; Singh, N. Composition, Pasting, Functional, and Microstructural Properties of Flours from Different Split Dehulled Pulses (Dhals). J. Food Process. Preserv. 2021, 45, e15485. [Google Scholar] [CrossRef]
  43. Akharume, F.U.; Aluko, R.E.; Adedeji, A.A. Modification of Plant Proteins for Improved Functionality: A Review. Compr. Rev. Food Sci. Food Saf. 2021, 20, 198–224. [Google Scholar] [CrossRef]
  44. Zink, J.; Wyrobnik, T.; Prinz, T.; Schmid, M. Physical, Chemical and Biochemical Modifications of Protein-Based Films and Coatings: An Extensive Review. Int. J. Mol. Sci. 2016, 17, 1376. [Google Scholar] [CrossRef]
  45. Mession, J.L.; Chihi, M.L.; Sok, N.; Saurel, R. Effect of Globular Pea Proteins Fractionation on Their Heat-Induced Aggregation and Acid Cold-Set Gelation. Food Hydrocoll. 2015, 46, 233–243. [Google Scholar] [CrossRef]
  46. McBryde, W.A.E. The PH Meter as a Hydrogen-Ion Concentration Probe. Analyst 1969, 94, 337–346. [Google Scholar] [CrossRef]
  47. Ai, Y.; Jane, J.L. Gelatinization and Rheological Properties of Starch. Starch/Staerke 2015, 67, 213–224. [Google Scholar] [CrossRef]
  48. Chen, J.; Zhang, W.; Chen, Y.; Li, M.; Liu, C.; Wu, X. Effect of Glycosylation Modification on Structure and Properties of Soy Protein Isolate: A Review. J. Food Sci. 2024, 89, 4620–4637. [Google Scholar] [CrossRef] [PubMed]
  49. Ispiryan, L.; Zannini, E.; Arendt, E.K. Characterization of the FODMAP-Profile in Cereal-Product Ingredients. J. Cereal Sci. 2020, 92, 102916. [Google Scholar] [CrossRef]
  50. Ispiryan, L.; Heitmann, M.; Hoehnel, A.; Zannini, E.; Arendt, E.K. Optimization and Validation of an HPAEC-PAD Method for the Quantification of FODMAPs in Cereals and Cereal-Based Products. J. Agric. Food Chem. 2019, 67, 4384–4392. [Google Scholar] [CrossRef] [PubMed]
  51. Miljkovic, M.; Miljković, M. Chemistry of the Glycosidic Bond. In Carbohydrates: Synthesis, Mechanisms, and Stereoelectronic Effects; Springer: New York, NY, USA, 2009; pp. 323–421. [Google Scholar]
  52. Sushil Dhital Frederick, J.; Warren, P.J.B.P.R.E.; Gidley, M.J. Mechanisms of Starch Digestion by α-Amylase—Structural Basis for Kinetic Properties. Crit. Rev. Food Sci. Nutr. 2017, 57, 875–892. [Google Scholar] [CrossRef]
  53. Salaün, F.; Mietton, B.; Gaucheron, F. Buffering Capacity of Dairy Products. Int. Dairy. J. 2005, 15, 95–109. [Google Scholar] [CrossRef]
  54. Wang, S.; Chao, C.; Guo, Q.; Gu, C. Protein Complexation with Carbohydrates and Lipids. In Functionality of Plant Proteins; Elsevier: Amsterdam, The Netherlands, 2024; pp. 221–251. [Google Scholar] [CrossRef]
  55. Tian, S.; Sun, Y. Influencing Factor of Resistant Starch Formation and Application in Cereal Products: A Review. Int. J. Biol. Macromol. 2020, 149, 424–431. [Google Scholar] [CrossRef]
  56. 58Hall, A.E.; Moraru, C.I. Comparative Effects of High Pressure Processing and Heat Treatment on in Vitro Digestibility of Pea Protein and Starch. NPJ Sci. Food 2022, 6, 2. [Google Scholar] [CrossRef]
  57. Tester, R.F.; Morrison, W.R. Swelling and Gelatinization of Cereal Starches. I. Effects of Amylopectin, Amylose, and Lipids. Cereal Chem. 1990, 67, 551–557. [Google Scholar]
  58. Devkota, L.; Kyriakopoulou, K.; Bergia, R.; Dhital, S. Structural and Thermal Characterization of Protein Isolates from Australian Lupin Varieties as Affected by Processing Conditions. Foods 2023, 12, 908. [Google Scholar] [CrossRef] [PubMed]
  59. Sirtori, E.; Resta, D.; Brambilla, F.; Zacherl, C.; Arnoldi, A. The Effects of Various Processing Conditions on a Protein Isolate from Lupinus Angustifolius. Food Chem. 2010, 120, 496–504. [Google Scholar] [CrossRef]
  60. Choe, U.; Osorno, J.M.; Ohm, J.B.; Chen, B.; Rao, J. Modification of Physicochemical, Functional Properties, and Digestibility of Macronutrients in Common Bean (Phaseolus vulgaris, L.) Flours by Different Thermally Treated Whole Seeds. Food Chem. 2022, 382, 132570. [Google Scholar] [CrossRef]
  61. Li, X.; Chen, L.; Hua, Y.; Chen, Y.; Kong, X.; Zhang, C. Effect of Preheating-Induced Denaturation during Protein Production on the Structure and Gelling Properties of Soybean Proteins. Food Hydrocoll. 2020, 105, 105846. [Google Scholar] [CrossRef]
  62. Sun, X.D.; Arntfield, S.D. Gelation Properties of Salt-Extracted Pea Protein Isolate Induced by Heat Treatment: Effect of Heating and Cooling Rate. Food Chem. 2011, 124, 1011–1016. [Google Scholar] [CrossRef]
  63. Renkema, J.M.S.; Van Vliet, T. Heat-Induced Gel Formation by Soy Proteins at Neutral PH. J. Agric. Food Chem. 2002, 50, 1569–1573. [Google Scholar] [CrossRef] [PubMed]
  64. Wang, Y.; Wu, J.; Lv, M.; Shao, Z.; Hungwe, M.; Wang, J.; Bai, X.; Xie, J.; Wang, Y.; Geng, W. Metabolism Characteristics of Lactic Acid Bacteria and the Expanding Applications in Food Industry. Front. Bioeng. Biotechnol. 2021, 9, 612285. [Google Scholar] [CrossRef]
  65. Sahin, A.W.; Coffey, A.; Zannini, E. Functionalisation of Wheat and Oat Bran Using Single-Strain Fermentation and Its Impact on Techno-Functional and Nutritional Properties of Biscuits. Eur. Food Res. Technol. 2021, 247, 1825–1837. [Google Scholar] [CrossRef]
  66. Wang, R.; Hartel, R.W. Understanding Stickiness in Sugar-Rich Food Systems: A Review of Mechanisms, Analyses, and Solutions of Adhesion. Compr. Rev. Food Sci. Food Saf. 2021, 20, 5901–5937. [Google Scholar] [CrossRef]
  67. Boucheham, N.; Galet, L.; Patry, S.; Zidoune, M.N. Physicochemical and Hydration Properties of Different Cereal and Legume Gluten-Free Powders. Food Sci. Nutr. 2019, 7, 3081–3092. [Google Scholar] [CrossRef] [PubMed]
  68. Ma, Z.; Boye, J.I.; Simpson, B.K.; Prasher, S.O.; Monpetit, D.; Malcolmson, L. Thermal Processing Effects on the Functional Properties and Microstructure of Lentil, Chickpea, and Pea Flours. Food Res. Int. 2011, 44, 2534–2544. [Google Scholar] [CrossRef]
  69. Rosenthal, A.J.; Thompson, P. What Is Cohesiveness?—A Linguistic Exploration of the Food Texture Testing Literature. J. Texture Stud. 2021, 52, 294–302. [Google Scholar] [CrossRef] [PubMed]
  70. Huang, P.H.; Cheng, Y.T.; Chan, Y.J.; Lu, W.C.; Li, P.H. Effect of Heat Treatment on Nutritional and Chromatic Properties of Mung Bean (Vigna radiata, L.). Agronomy 2022, 12, 1365. [Google Scholar] [CrossRef]
  71. Spaggiari, G.; Di Pizio, A.; Cozzini, P. Sweet, Umami and Bitter Taste Receptors: State of the Art of in Silico Molecular Modeling Approaches. Trends Food Sci. Technol. 2020, 96, 21–29. [Google Scholar] [CrossRef]
  72. Breslin, P.A.S. Interactions among Salty, Sour and Bitter Compounds. Trends Food Sci. Technol. 1996, 7, 390–399. [Google Scholar] [CrossRef]
  73. Burdock, G.A. Fenaroli’s Handbook of Flavor Ingredients; CRC Press: Boca Raton, FL, USA, 2016; ISBN 0429150830. [Google Scholar]
  74. Roland, W.S.U.; Pouvreau, L.; Curran, J.; Van De Velde, F.; De Kok, P.M.T. Flavor Aspects of Pulse Ingredients. Cereal Chem. 2017, 94, 58–65. [Google Scholar] [CrossRef]
  75. Bühler, J.M.; Dekkers, B.L.; Bruins, M.E.; Van Der Goot, A.J. Modifying Faba Bean Protein Concentrate Using Dry Heat to Increase Water Holding Capacity. Foods 2020, 9, 1077. [Google Scholar] [CrossRef]
Figure 1. Experimental design. (A) fermentation and pâté base preparation without thermal treatment prior to fermentation; (B) fermentation and pâté base preparation with heat treatment prior to fermentation.
Fermentation 10 00412 g001
Figure 2. Microbial cell count of Leuconostoc citreum TR116 in soy flour (SF), red lentil flour (LF), yellow pea flour (PF), heat-treated red lentil flour (LF-H), and heat-treated pea flour (PF-H).
Fermentation 10 00412 g002
Figure 3. Correlation analysis. Red shades indicate a positive correlation, with white having a multiple R value of 0 and dark red having a multiple R value of 1. Blue shades represent a negative correlation, with white having a multiple R value of 0 and dark blue having a multiple R of −1. Yellow frames indicate a significance value of p < 0.01.
Fermentation 10 00412 g003
Figure 4. Appearance of pâté base. SF = soy four; SF (t24) = fermented soy flour; PF = pea flour; PF (t24) = fermented pea flour; PF-H = heat-treated pea flour; PF-H (t24) = heat-treated and fermented pea flour; LF = lentil flour; LF (t24) = fermented lentil flour; LF-H = heat-treated lentil flour; LF-H (t24) = heat-treated and fermented lentil flour.
Fermentation 10 00412 g004
Figure 5. Sensory evaluation of pâté-base samples: soy flour (SF), fermented soy flour (SF (t24)), lentil flour (LF), fermented lentil flour (LF (t24)), heat-treated lentil flour (LF-H), heat-treated and fermented lentil flour (LF-H (t24)), pea flour (PF), fermented pea flour (PF (t24)), heat-treated pea flour (PF-H), and heat-treated and fermented pea flour (PF-H (t24)). (A) Taste intensity; (B) Flavour intensity; (C) Aroma intensity; (D) Texture characteristics.
Fermentation 10 00412 g005
Table 1. Composition of soy flour, yellow pea flour and red lentil flour displayed as mean ± standard deviation of three replicates. The value of ‘carbohydrates’ is based on calculations considering the mean values of the other compounds. Results contained in the same row with the same letter marking them do not differ significantly. Protein content, moisture, fat, and ash values were provided by an external accredited laboratory as mean ± standard deviation, and hence no statistical evaluation was performed.
Soy Flour
(SF)
Red Lentil Flour
(LF)
Yellow Pea Flour
(PF)
Protein [g/100 g]35.85 ± 0.2722.39 ± 0.1721.93 ± 0.06
Moisture [g/100 g]9.37 ± 0.0910.98 ± 0.2610.20 ± 0.08
Fat [g/100 g]21.51 ± 0.121.60 ± 0.111.58 ± 0.22
Carbohydrates [g/100 g]28.8362.7363.60
of which total starch [g/100 g]1.47 ± 0.02 (c)48.19 ± 0.42 (a)43.40 ± 0.75 (b)
of which digestible starch [g/100 g]1.47 ± 0.02 (c)38.47 ± 0.22 (a)31.39 ± 0.58 (b)
Ash [g/100 g]4.44 ± 0.022.30 ± 0.022.69 ± 0.01
Table 2. pH, total titratable acidity (TTA) and bacterial cell count results at the different times of fermentation (0 h, 24 h and 48 h). Values show mean ± standard deviation. Results contained in the same row with the same letter marking them do not differ significantly. SF represents soy flour, LF stands for red lentil flour, and PF is yellow pea flour, and ‘t’ refers to the fermentation time. ‘-H’ indicates thermal treatment prior to fermentation.
pH [43,44]TTA [mL 0.1 M NaOH/10 g]Maximum Growth Rate (µmax) [43,44]
SF (t0)6.81 ± 0.04 (j)5.87 ± 0.19 (d)0.13 ± 0.01 (a)
SF (t24)5.44 ± 0.01 (e)14.77 ± 0.16 (f)
SF (t48)5.35 ± 0.01 (d,e)16.08 ± 0.12 (g)
LF (t0)6.54 ± 0.04 (h)6.06 ± 0.09 (d)0.12 ± 0.01 (a)
LF (t24)4.80 ± 0.01 (b)20.96 ± 0.29 (h)
LF (t48)4.69 ± 0.05 (a)24.98 ± 0.33 (i)
LF-H (t0)6.74 ± 0.01 (i,j)2.19 ± 0.02 (a)0.09 ± 0.01 (b)
LF-H (t24)5.62 ± 0.07 (e)4.20 ± 0.05 (c)
LF-H (t48)5.61 ± 0.08 (e)4.45 ± 0.13 (c)
PF (t0)6.48 ± 0.03 (i)5.72 ± 0.12 (d)0.11 ± 0.01 (a)
PF (t24)4.99 ± 0.05 (c)19.84 ± 0.41 (h)
PF (t48)4.83 ± 0.04 (b)24.35 ± 0.29 (i)
PF-H (t0)6.78 ± 0.05 (j)3.14 ± 0.13 (b)0.06 ± 0.01 (b)
PF-H (t24)5.34 ± 0.06 (d,e)7.18 ± 0.04 (e)
PF-H (t48)5.32 ± 0.08 (d)5.97 ± 0.23 (d)
Table 3. Organic acid concentrations of legume flours during 24 h fermentation expressed in g/100 g based on dry matter. Values show mean ± standard deviation. Results contained in the same row with the same letter marking them do not differ significantly. SF represents soy flour, LF stands for red lentil flour, and PF is yellow pea flour. ‘-H’ indicates thermal treatment prior to fermentation.
Citric AcidSuccinic AcidLactic AcidAcetic AcidΣ
SF (t0)0.62 ± 0.01 (a)0.00 ± 0.00 (d)0.00 ± 0.00 (e)0.16 ± 0.02 (d)0.79 ± 0.04 (e)
SF (t24)0.36 ± 0.02 (c)0.80 ± 0.04 (a)5.15 ± 0.14 (a)3.31 ± 0.01 (a)7.60 ± 0.16 (a)
LF (t0)0.19 ± 0.01 (d)0.00 ± 0.00 (d)1.47 ± 0.02 (d)0.00 ± 0.00 (e)1.66 ± 0.03 (d)
LF-H (t0)0.22 ± 0.01 (d)0.00 ± 0.00 (d)1.74 ± 0.04 (c,d)0.00 ± 0.00 (e)1.87 ± 0.05 (d)
LF (t24)0.00 ± 0.00 (f)0.35 ± 0.01 (b)5.48 ± 0.15 (a)1.07 ± 0.03 (c)6.91 ± 0.19 (a)
LF-H (t24)0.17 ± 0.01 (d,e)0.14 ± 0.01 (c)3.14 ± 0.08 (b)1.30 ± 0.17 (b)4.76 ± 0.16 (b)
PF (t0)0.56 ± 0.02 (b)0.00 ± 0.00 (d)0.00 ± 0.00 (e)0.00 ± 0.00 (e)0.56 ± 0.02 (e)
PF-H(t0)0.27 ± 0.02 (d)0.00 ± 0.00 (d)0.00 ± 0.00 (e)0.00 ± 0.00 (e)0.27 ± 0.02 (e)
PF (t24)0.22 ± 0.01 (d)0.35 ± 0.01 (b)3.05 ± 0.09 (b)1.29 ± 0.10 (b)4.91 ± 0.22 (b)
PF-H (t24)0.13 ± 0.00 (e)0.15 ± 0.01 (c)2.23 ± 0.12 (c)1.46 ± 0.07 (b)3.97 ± 0.20 (c)
Table 4. Concentrations of mono-, di-, tri-, and tetrasaccharides, and mannitol in legume flours before and after 24 h fermentation expressed in g/100 g based on dry matter. Values show mean ± standard deviation. Results contained in the same row with the same letter marking them do not differ significantly. SF represents soy flour, LF stands for red lentil flour, and PF is yellow pea flour. ‘-H’ indicates thermal treatment prior to fermentation, and ‘t’ refers to the fermentation time. ‘ < LoQ’ stands for ‘below limit of quantification,’ which is 0.05 g/100 g.
GlucoseFructoseSucroseMaltoseGalactoseΣ Mono- and DisaccharidesRaffinose/
Stachyose
VerbascoseΣ Tri- and TetrasaccharidesMannitol
SF (t0)0.00 ± 0.00 (c)0.13 ± 0.05 (a)6.67 ± 0.35 (a)<LoQ0.00 ± 0.00 (g)6.82 ± 0.41 (a)3.45 ± 0.18 (a)<LoQ3.49 ± 0.19 (a)0.00 ± 0.00 (e)
SF (t24)0.00 ± 0.00 (c)0.22 ± 0.02 (a)0.00 ± 0.00 (d)0.00 ± 0.00 (b)0.00 ± 0.00 (g)0.22 ± 0.02 (h)3.80 ± 0.24 (a)0.06 ± 0.01 (f)3.86 ± 0.25 (a)1.62 ± 0.06 (a)
LF (t0)0.18 ± 0.01 (a)0.00 ± 0.00 (b)1.25 ± 0.13 (c)0.16 ± 0.04 (a)0.15 ± 0.02 (f)1.74 ± 0.20 (d)0.62 ± 0.21 (e)0.15 ± 0.05 (e)0.77 ± 0.25 (e)0.00 ± 0.00 (e)
LF-H (t0)0.07 ± 0.00 (b)0.00 ± 0.00 (b)1.82 ± 0.01 (c)<LoQ0.50 ± 0.01 (c,d)2.40 ± 0.02 (c)1.03 ± 0.18 (d)0.33 ± 0.04 (c)1.36 ± 0.22 (d)0.00 ± 0.00 (e)
LF (t24)0.00 ± 0.00 (c)<LoQ<LoQ<LoQ1.15 ± 0.06 (a)1.29 ± 0.07 (e)1.11 ± 0.06 (c,d)0.26 ± 0.02 (d)1.37 ± 0.08 (d)0.59 ± 0.01 (c)
LF-H (t24)0.00 ± 0.00 (c)0.00 ± 0.00 (b)0.00 ± 0.00 (d)0.00 ± 0.00 (b)0.56 ± 0.03 (c)0.56 ± 0.03 (g)0.94 ± 0.04 (e)0.24 ± 0.01 (d)1.18 ± 0.04 (e)0.14 ± 0.02 (d)
PF (t0)0.18 ± 0.00 (a)<LoQ2.21 ± 0.20 (b)0.15 ± 0.01 (a)0.35 ± 0.01 (e)2.89 ± 0.23 (c)1.55 ± 0.05 (b)0.36 ± 0.03 (c)1.91 ± 0.08 (b,c)0.00 ± 0.00 (e)
PF-H(t0)0.12 ± 0.01 (a)<LoQ3.06 ± 0.08 (b)0.00 ± 0.00 (b)0.73 ± 0.02 (b,c)3.94 ± 0.01 (b)1.54 ± 0.16 (b,c)0.61 ± 0.03 (a)2.16 ± 0.20 (b)0.00 ± 0.00 (e)
PF (t24)<LoQ<LoQ<LoQ<LoQ1.33 ± 0.04 (a)1.44 ± 0.07 (d,e)1.10 ± 0.08 (d)0.25 ± 0.01 (d)1.34 ± 0.08 (d)0.76 ± 0.08 (b)
PF-H (t24)0.00 ± 0.00 (c)<LoQ0.00 ± 0.00 (d)0.00 ± 0.00 (b)0.48 ± 0.02 (d,e)0.89 ± 0.10 (f,g)1.28 ± 0.09 (c)0.42 ± 0.03 (b)1.70 ± 0.12 (c)0.48 ± 0.02 (c)
Table 5. Techno-functional properties of fermented legume flours as a base for spreadable meat alternatives. Values show mean ± standard deviation. Results contained in the same row with the same letter marking them do not differ significantly. SF represents soy flour, LF stands for red lentil flour, and PF is yellow pea flour. ‘-H’ indicates thermal treatment prior to fermentation.
Firmness (N)Adhesiveness (N)Cohesiveness (N)Colour Change ΔE
SF (t0)20.73 ± 1.13 (c,a)10.86 ± 2.22 (a)0.68 ± 0.02 (a)-
SF (t24)19.52 ± 1.20 (b,c)10.85 ± 1.30 (a)0.69 ± 0.04 (a)3.09 ± 1.04 (c)
LF (t0)2.10 ± 0.15 (g)1.27 ± 0.23 (b)0.66 ± 0.00 (a)-
LF-H (t0)15.86 ± 1.34 (e,d)0.39 ± 0.09 (e)0.29 ± 0.03 (c)24.43 ± 0.93 (a)
LF (t24)5.28 ± 0.59 (f)5.64 ± 1.98 (c)0.65 ± 0.01 (a)2.36 ± 0.71 (c)
LF-H (t24)13.89 ± 1.27 (e)0.23 ± 0.05 (f)0.26 ± 0.01 (c)21.45 ± 0.67 (a)
PF (t0)4.11 ± 0.69 (g,f)0.81 ± 0.07 (d)0.42 ± 0.02 (b)-
PF-H(t0)19.24 ± 0.76 (b,c)0.38 ± 0.06 (e)0.25 ± 0.02 (c)14.62 ± 0.99 (b)
PF (t24)22.59 ± 1.48 (a)3.17 ± 0.32 (c)0.41 ± 0.03 (b)2.53 ± 1.74 (c)
PF-H (t24)17.99 ± 1.10 (d,b)0.52 ± 0.22 (d)0.24 ± 0.02 (c)16.20 ± 1.28 (b)
Disclaimer/Publisher’s Note: The statements, opinions and data contained in all publications are solely those of the individual author(s) and contributor(s) and not of MDPI and/or the editor(s). MDPI and/or the editor(s) disclaim responsibility for any injury to people or property resulting from any ideas, methods, instructions or products referred to in the content.

