Article

Effect of Temperature and pH on Microbial Communities Fermenting a Dairy Coproduct Mixture

by
Kevin A. Walters
1,2,3,
Kevin S. Myers
2,3,
Abel T. Ingle
2,3,4,
Timothy J. Donohue
1,2,3 and
Daniel R. Noguera
2,3,4,*
1
Department of Bacteriology, University of Wisconsin-Madison, Madison, WI 53706, USA
2
Wisconsin Energy Institute, University of Wisconsin-Madison, Madison, WI 53726, USA
3
Great Lakes Bioenergy Research Center, University of Wisconsin-Madison, Madison, WI 53726, USA
4
Department of Civil and Environmental Engineering, University of Wisconsin-Madison, Madison, WI 53706, USA
*
Author to whom correspondence should be addressed.
Fermentation 2024, 10(8), 422; https://doi.org/10.3390/fermentation10080422
Submission received: 29 June 2024 / Revised: 2 August 2024 / Accepted: 7 August 2024 / Published: 15 August 2024
(This article belongs to the Section Industrial Fermentation)

Abstract

:
Organic-rich industrial residues can serve as renewable feedstocks for the generation of useful products by microbial fermentation. We investigated fermenting communities enriched in a mixture of ultra-filtered milk permeate (UFMP) and acid whey from cottage cheese (CAW), two dairy coproducts rich in lactose. To evaluate how operational pH and temperature affect microbial communities and fermentation products, we operated 12 bioreactors for 140 days, each fed a 1:1 mixture of UFMP and CAW at either 35 °C or 50 °C and at either a pH of 4.8 or 5.5. The bioreactors operated at a pH of 4.8 resulted in the incomplete conversion of lactose, while those operated at a pH of 5.5 consistently fermented lactose, primarily into lactic, acetic, and hexanoic acids. The metagenomic analyses revealed that microbial communities obtained at a pH of 5.5 were dominated by lactic acid-producing organisms. Additionally, an inverse relationship was found between the abundance of chain elongating organisms and lactic acid accumulation, with 50 °C reducing the abundance of these organisms and enhancing lactic acid yields. We conclude that the pH and temperature are important determinants of the fermentation of dairy coproducts with a pH of 5.5 and 50 °C yielding the most promising results for lactic acid production. Additional research is required to better understand the factors affecting functional consistency of the process.

1. Introduction

To facilitate society’s transition towards a circular bioeconomy, it is of interest to explore technologies that leverage organic-rich industrial residues as sources of renewable products [1]. The fermentation of industrial residues shows potential for the production of fuels and industrial chemicals with either pure cultures [2,3,4] or self-assembled microbial communities [5,6,7]. Fermentations with pure cultures can take advantage of genetic modifications to redirect or customize the fermentation product profile [8,9]. Microbial communities have advantages over pure cultures such as a resilience to disturbances [5,10,11,12], the synergistic metabolic activity of community members that can facilitate the conversion of complex feedstocks [5,13,14,15], and removing the need for sterilization of the organic residues [16]. Fermenting microbial communities frequently produce a mixture of end products [17,18,19] and there are knowledge gaps on how to direct the metabolism of microbial communities towards achieving high yields of specific products. In addition, the self-assemblage nature of microbial communities may create challenges in the reproducibility of fermentation profiles even if the feedstock and culturing conditions remain unchanged. Thus, our goal is to advance the current knowledge both of how to adjust the microbial community function by manipulating bioreactor conditions and how to assess the functional reproducibility of microbial communities to further their development as biotechnological tools.
To make progress on this goal, we have chosen to evaluate the ability of microbial communities to generate valuable fermentation products from dairy coproducts. In the processing of milk into various products, the dairy industry generates various lactose-rich and low-value coproducts, including ultra-filtration permeates and acid whey, that have potential as feedstocks for bioconversion by a microbial community [20,21,22,23]. We recently demonstrated that ultra-filtered milk permeate (UFMP), when supplemented with ammonium chloride as a nitrogen source, could be fermented by a microbial community into a variable mixture of organic acids including lactic, succinic, butyric, and hexanoic acids [24]. These products show potential as target molecules for microbial bioconversion strategies due to their societal utility as industrial chemicals [25,26,27,28], warranting further investigation into their production from dairy coproducts. Furthermore, because ammonium is typically generated through the energy intensive Haber–Bosch process, it would be beneficial to use a more sustainable nitrogen source for the microbial upgrading of dairy coproducts. In this study, we were interested in exploring whether a mixture of two dairy coproducts, UFMP and a protein-rich cottage cheese acid whey (CAW), would sustain the full conversion of its carbohydrates into fermentation products without the addition of exogenous nitrogen sources. A 1:1 ratio of UFMP and CAW was formulated which we predicted would supply a sufficient amount of nitrogen for full lactose fermentation based the results of our previous UFMP experiment [24]. Furthermore, since recent studies have demonstrated that the pH and temperature are key parameters in determining the functionality of bioreactor microbial communities [29,30,31,32,33,34,35,36,37,38,39], we sought to investigate how these parameters could affect the profile of fermentation products and the microbial community structure in bioreactors fed a 1:1 mixture of UFMP and CAW. Specifically, we tested two temperatures, 35 °C and 50 °C, to assess how mesophilic and thermophilic temperatures disparately influence microbial community structure and fermentation of lactose-rich dairy residues. We also tested two pH values, 4.8 and 5.5, since other studies have shown differential fermentation at these values, with a pH of 5.5 and higher frequently favoring butyric and hexanoic acid accumulation and a pH of 5 or lower frequently favoring lactic acid accumulation [34,35,36,37,38,39].
In summary, the objective of this study was to evaluate how the pH and temperature influenced the microbial community fermenting a dairy coproduct mixture that did not require supplementation of the feedstock with an exogenous nitrogen source. Here, we present the data from UFMP:CAW-fed anaerobic bioreactors operated at two pH values and two temperatures to explore how these parameters shape microbial communities with different metabolic functioning. Additionally, we compared bioreactors operated under identical conditions and initiated with the same microbial community inoculum and bioreactors operated under identical conditions but initiated with separate inocula to assess the reproducibility of fermentation product accumulation. To provide time for the microbial communities to adjust to the experimental conditions, and to assess the potential for the long-term operation of these bioreactors, we operated each for 140 days. Metagenomic analyses of the microbial communities were used to evaluate community structures in relation to the accumulated metabolic profiles. The knowledge gained here provides insights into using fermentative microbial communities as tools for industrial residue upgrading by advancing the current understanding of bioreactor performance as a function of pH and temperature.

2. Materials and Methods

2.1. Materials

Ultra-filtered milk permeate (UFMP) was supplied by the Center for Dairy Research (Madison, WI, USA) and Meister Cheese (Muscoda, WI, USA) and cottage cheese acid whey (CAW) was supplied by WW Homestead Dairy (Waukon, IA, USA). Both substrates were stored frozen at −20 °C until use. They were mixed in a 50/50 v/v ratio directly before being fed to the bioreactors.

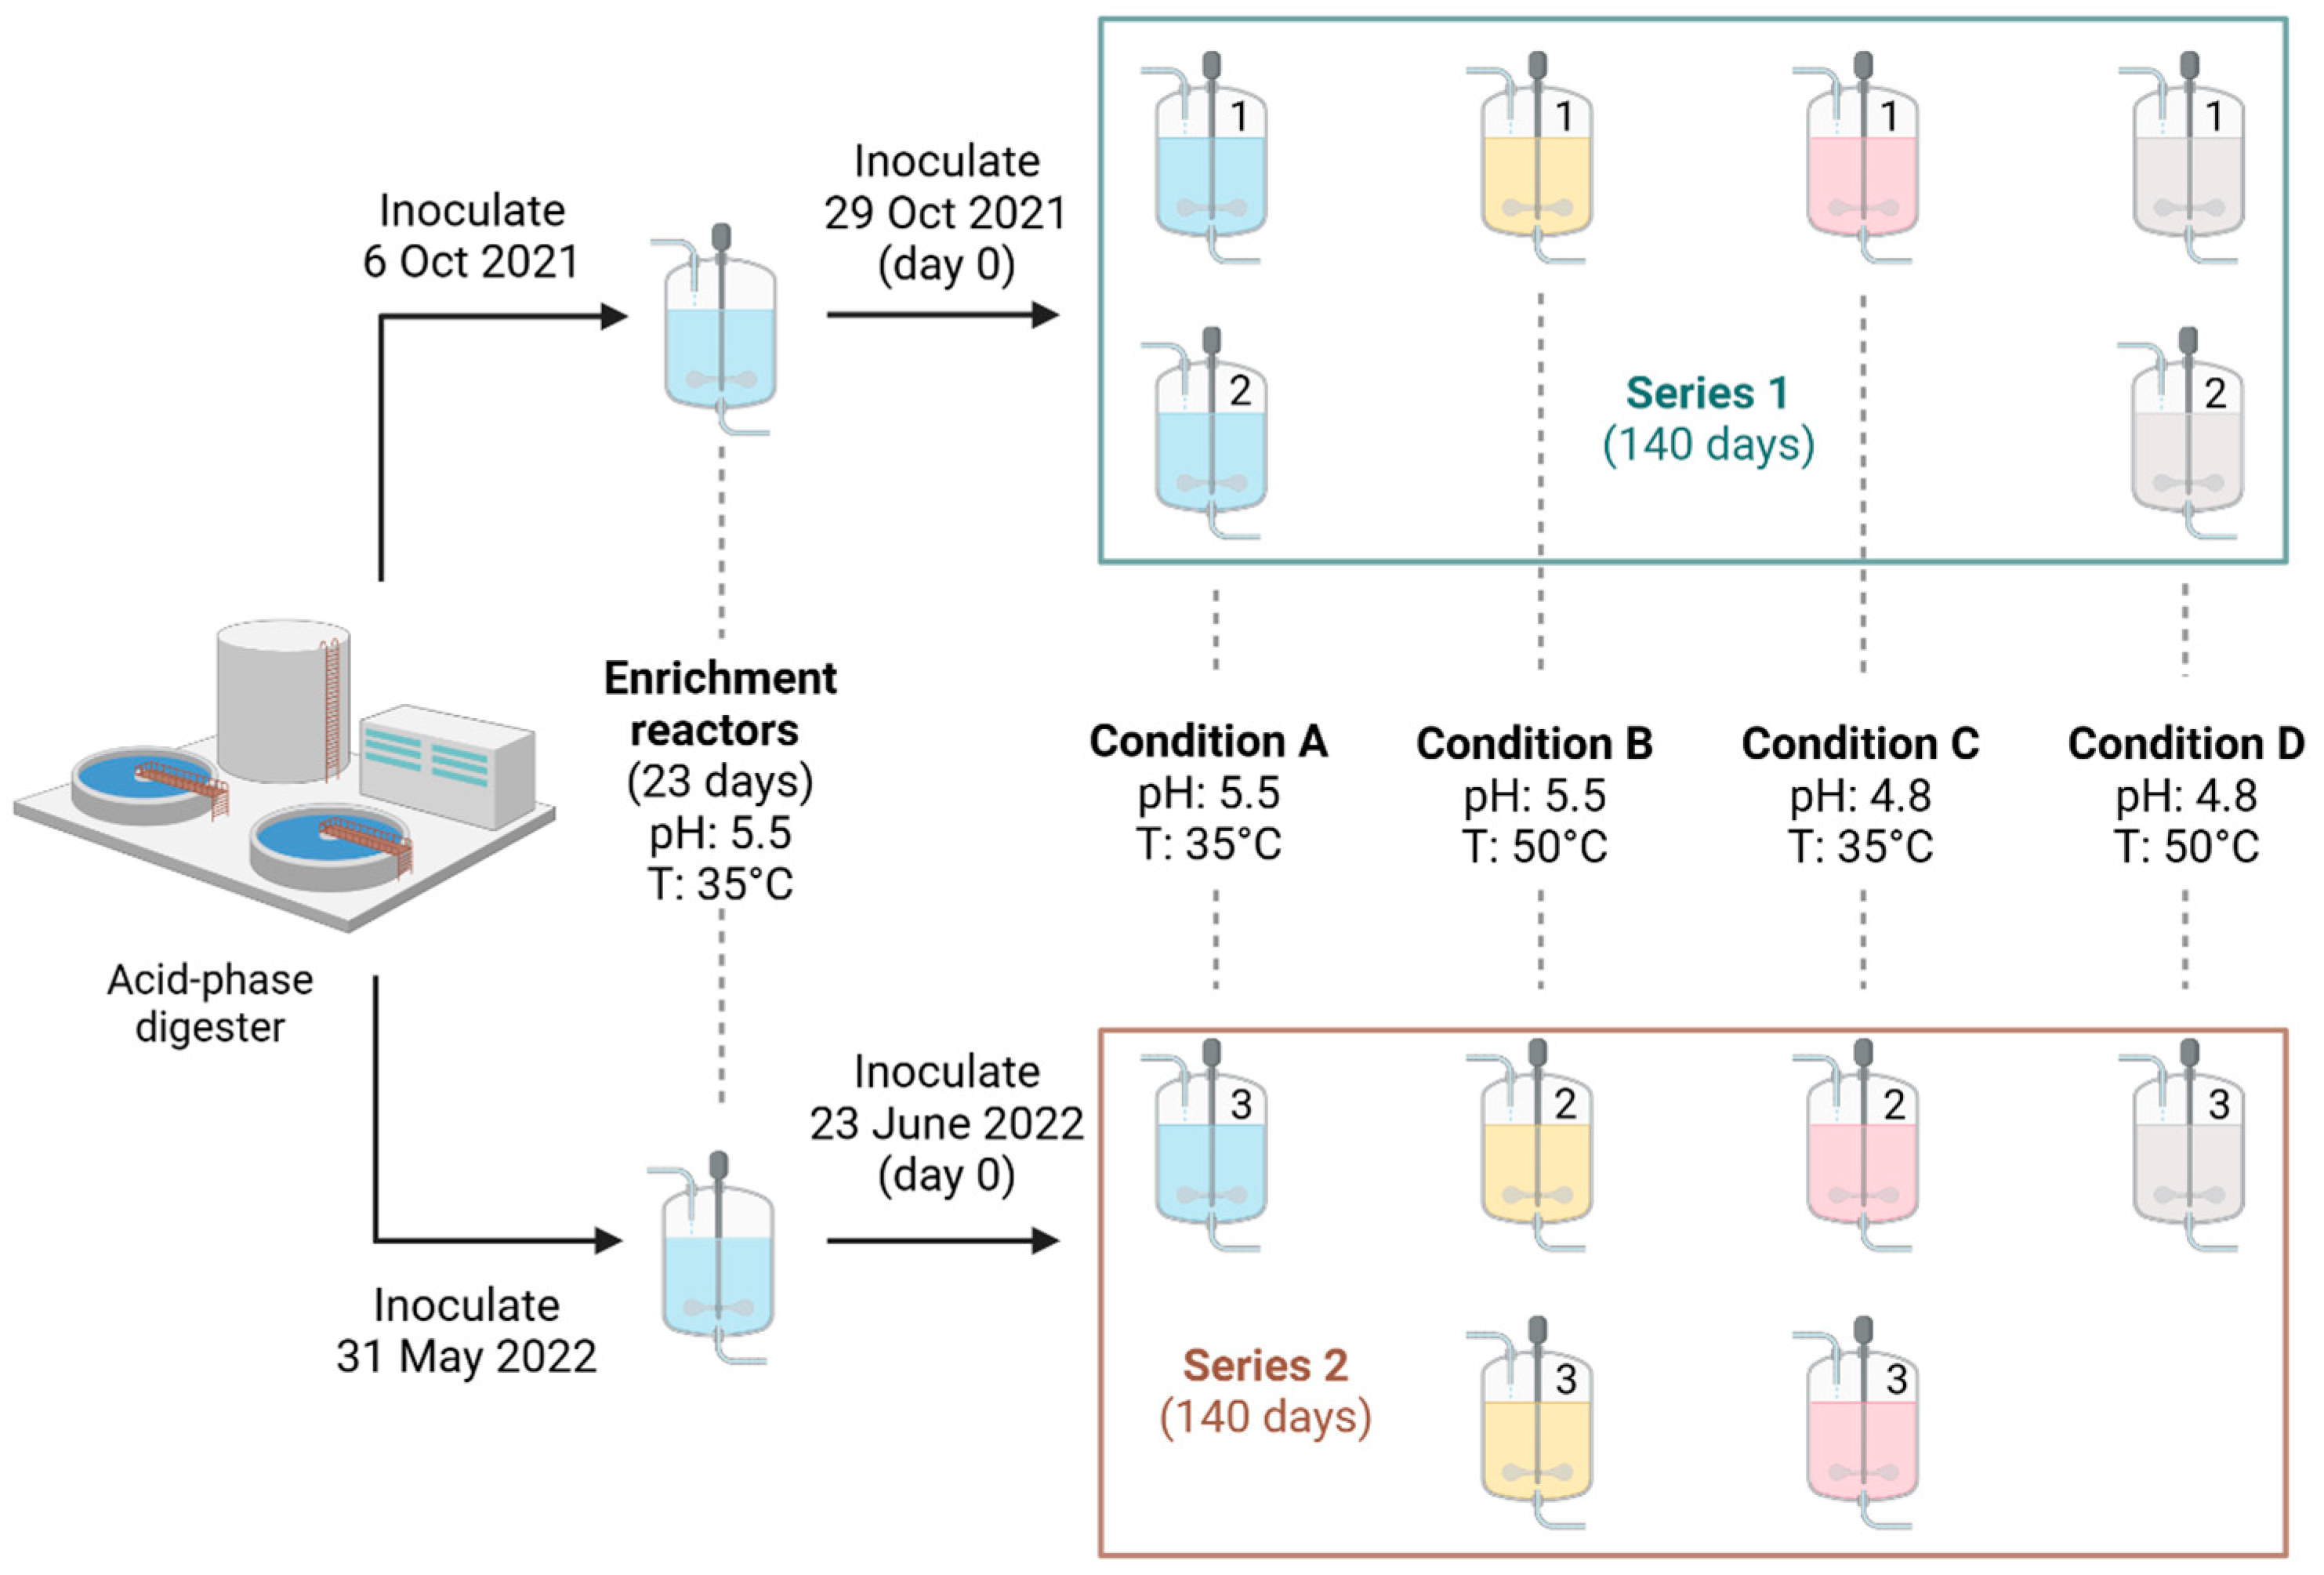
2.2. Experimental Design and Bioreactor System

Twelve bioreactors were operated for 140 days under one of four experimental conditions (A: pH 5.5, 35 °C; B: pH 5.5, 50 °C; C: pH 4.8, 35 °C; D: pH 4.8, 50 °C), such that each condition was applied to three separate bioreactors (Figure 1). These bioreactors were operated in two successive series of six bioreactors using a Multifors 2 parallel bench top reactor system (version “Q2 2022”, Infors USA Inc., Annapolis Junction, MD, USA) with a total volume of 1.4 L, and an integrated pH control system, temperature control system, influent and effluent peristaltic pumps, and oxygen sensors. Treatment conditions were randomly assigned to each series and each bioreactor vessel. These bioreactors were operated as continuously stirred tank reactors, fed a 50/50 v/v mixture of UFMP and CAW, with a 6-day solids and hydraulic retention times, and mixed at 200 rpm. pH was controlled with the addition of 5 M NaOH. Care was taken to limit input of air into the bioreactor vessels. Process parameters were controlled and real-time readings of pH, temperature, pump usage, and dissolved oxygen concentrations were recorded using the system’s integrated Eve bioprocess platform software (Infors USA Inc., Annapolis Junction, MD, USA). Experimental bioreactors were operated with a 450 mL working volume and inoculated by the addition of 450 mL of broth from an enrichment bioreactor, with each series inoculated from a different enrichment bioreactor (Figure 1). Each enrichment bioreactor was inoculated with a microbial community from an acid-phase digester operated in the Madison Metropolitan Sewerage District’s wastewater treatment plant (Madison, WI, USA) and operated as condition A for 23 days before being transferred to the experimental bioreactors (Figure 1).

2.3. Sample Collection and Storage

Samples were collected from each batch of dairy coproducts, each inoculant, and every 7 days from each bioreactor for chemical analyses and DNA extraction. Fully mixed reactor broth of each bioreactor was collected, a portion of which was stored at 4 °C, and the rest centrifuged at 10,000× g for 10 min in 2 mL aliquots. The supernatants of centrifugated samples were passed through a 0.22-µm polyethersulfone membrane syringe filter and stored at −20 °C or 4 °C. The centrifugation pellets containing microbial biomass were stored at −80 °C.

2.4. Analytical Tests

Analytical tests for the determination of the concentration of total nitrogen, proteins, chemical oxygen demand (COD), total suspended solids, volatile suspended solids, carbohydrates (lactose, glucose, and galactose), organic acids (acetic, lactic, succinic, butyric, hexanoic, and octanoic), and ethanol determination were performed for select samples following published procedures [24].

2.5. DNA Sequencing and Metagenome Assembly

DNA was extracted, in duplicate, from the inoculant of each bioreactor series and from samples collected after 140 days of operation for each bioreactor operated at a pH of 5.5 (conditions A and B). Extractions were performed on biomass pellets originating from 2 mL aliquots using the DNeasy PowerSoil Pro kit (QIAGEN, Hilden, Germany), following the manufacturer’s protocol. DNA aliquots containing 1500 ng were submitted to the Joint Genome Institute (JGI) for sequencing of paired-end 2 × 150-bp reads using a NovaSeq S4 platform (Illumina, San Diego, CA, USA). Sequencing, assembly, binning, quality checking, feature annotation, dereplications, and taxonomy classification were performed as reported elsewhere (Table S1) [40]. To summarize the final steps of these reported procedures, MAGs from all samples were pooled and dRep (v3.4.5) (“dereplicate -conW 0.5 -N50W 5”) [41], a dereplication tool, was used to consolidate MAGs into distinct clusters based on sequence identity (≥95% ANI) and select a representative MAG for each cluster based on quality. The taxonomy of these representative MAGs, and their closest reference genomes within the GTDB, were determined using GTDB-Tk (v2.1.1, database release 214) (“gtdbtk identify”) [42] culminating in a dataset of 34 representative and taxonomically distinct MAGs with greater than 75% completion and less than 3% contamination, based off quality statistics derived from CheckM (v1.2.2) [43].

2.6. Microbial Community Analysis

Default software parameters were used unless specified otherwise. The relative abundance of microorganisms within each bioreactor sample was estimated by mapping their raw sequence reads to a FASTA file containing the concatenated sequences of the 34 representative MAG dataset using Bowtie2 (“bowtie2” command) (v2.4.1) [44]. The resulting SAM files were converted to sorted BAM files (“samtools view” then “samtools sort” commands) [45] and then input into CoverM (v0.4.0) (https://github.com/wwood/CoverM, accessed on 20 February 2020) to estimate the coverage of sequence reads mapped onto each MAG and to calculate relative abundance for each MAG in each sample (“coverm genome” command). Reported values are averages derived from the extraction duplicates.
A re-estimation of the relative abundance of microorganisms in each community was conducted by incorporating an additional dataset of 185 unique taxonomic MAGs. This 185 MAG dataset was created by dereplicating the MAGs from several fermentation studies that used the same acid-phase digester as the source of inoculum [24,37,46,47,48,49,50,51,52,53], using dRep, as above (Table S2). The 34 and 185 MAG datasets were combined by using dRep on their pooled MAGs as described above except that MAGs from this study were preferentially selected as representative MAGs for a given cluster. This resulted in a combined 201 MAG dataset containing 34 MAGs from this study and 167 novel MAGs from the 185 dataset, each with greater than 75% completion and less than 7.5% contamination (Table S2).

2.7. Machine Learning Functional Classifications

MAGs were classified into functional groups using a published method [46] with the scripts available at https://github.com/GLBRC/agroindustrial_residue_metagenomics, accessed on 20 March 2024. Briefly, the genes encoding enzymes involved in fermentation and central metabolism were predicted for each MAG using a homology-based analysis method as described previously. Multiclass classification machine learning was used to categorize the MAGs into one of the following four functional groups: (1) organisms metabolizing carbohydrates to lactic acid (lactic acid producers); (2) organisms metabolizing fermentation products, such as lactic acid, into butyric, hexanoic, and/or octanoic acids (intermediate chain elongators); (3) organisms converting carbohydrates directly into butyric, hexanoic, and/or octanoic acids (carbohydrate chain elongators); and (4) organisms that could not be assigned to any of the previous three functional groups. The same training set data and analysis techniques were used as reported before [46]. The LightGBM [54] algorithm performed best with the training set and was used to classify the MAGs.

2.8. Gene and Metabolic Pathway Predictions

In order to predict the homologues for genes relevant to lactose fermentation and amino acid biosynthesis within the MAGs of this study, these genomes were annotated using Bakta (“bakta”) and specifying locus tags from NCBI to maintain consistency (“--locus-tag” flag) (v1.9.1) [55]. To supplement these annotations, tblastn searches (default parameters; percent identity ≥25%; query coverage ≥75%) [56] were used with the Geneious Prime software (v2022.1.1) to identify additional homologues by sequence comparison to several genes (Table S3) [57,58,59]. Because electron bifurcation capability is a feature of electron transfer flavoproteins (EtfABs) involved in chain elongation (reverse β oxidation) and lactic acid consumption [59,60], and because EtfABs capable of electron bifurcation are phylogenetically grouped [61], a phylogenetic tree was constructed including MAG EtfBs and biochemically characterized reference EtfBs [59,61,62,63]. This tree aided in gene prediction whereby MAG EtfBs that did not cluster with biochemically characterized electron bifurcating EtfBs were considered as not partaking in chain elongation or lactic acid consumption. For this phylogenetic tree generation, MUSCLE (v3.8.31) [64] was used for alignment using the “muscle” command and RAxML (v8.2.11) [65] for tree construction (“raxmlHPC-SSE3” command with “-m PROTCATAUTO -f a” flags) using 500 bootstraps. The amino acid sequences used in this analysis are provided in Table S4 and the tree is provided in Figure S1. The results of all these gene predictions are summarized in Table S5.
To predict whether MAGs were prototrophic for individual amino acids, their Bakta annotations (general feature format files), including appended genomes in fasta format, were used as an input for the Pathway Tools software (version 25.5 tier 1) [66,67] by first using the “Pathologic” and “Pathway Hole Filler” components to create Pathway/Genome Databases (PGDBs). Subsequently, these PGDBs were used with the “Pathways Comparative Analysis” tool through the web server mode (“pathway-tools -www”) to predict and compare the presence of amino acid biosynthesis pathways within each MAG.

2.9. Phylogenetic Tree Generation

A phylogenetic tree was constructed comparing the 34 representative MAG dataset originating from this study and the 185 MAG dataset from other bioreactor studies, as described above. This tree was generated by first using GTDB-Tk (v2.1.1, database release 214) to align the MAGs and genomes based on the concatenation of 120 bacterial single-copy marker genes (Bac120), (“gtdbtk identify” and “gtdbtk align” commands), followed by tree construction with RAxML-NG (v1.2.0) (“raxml-ng --parse --model LG+G8+F” and “raxml-ng --all --model LG+G8+F” commands and model specification) [68] using 1000 bootstraps. TreeViewer (v2.2.0) [69] was used for the visualization of this tree.

3. Results

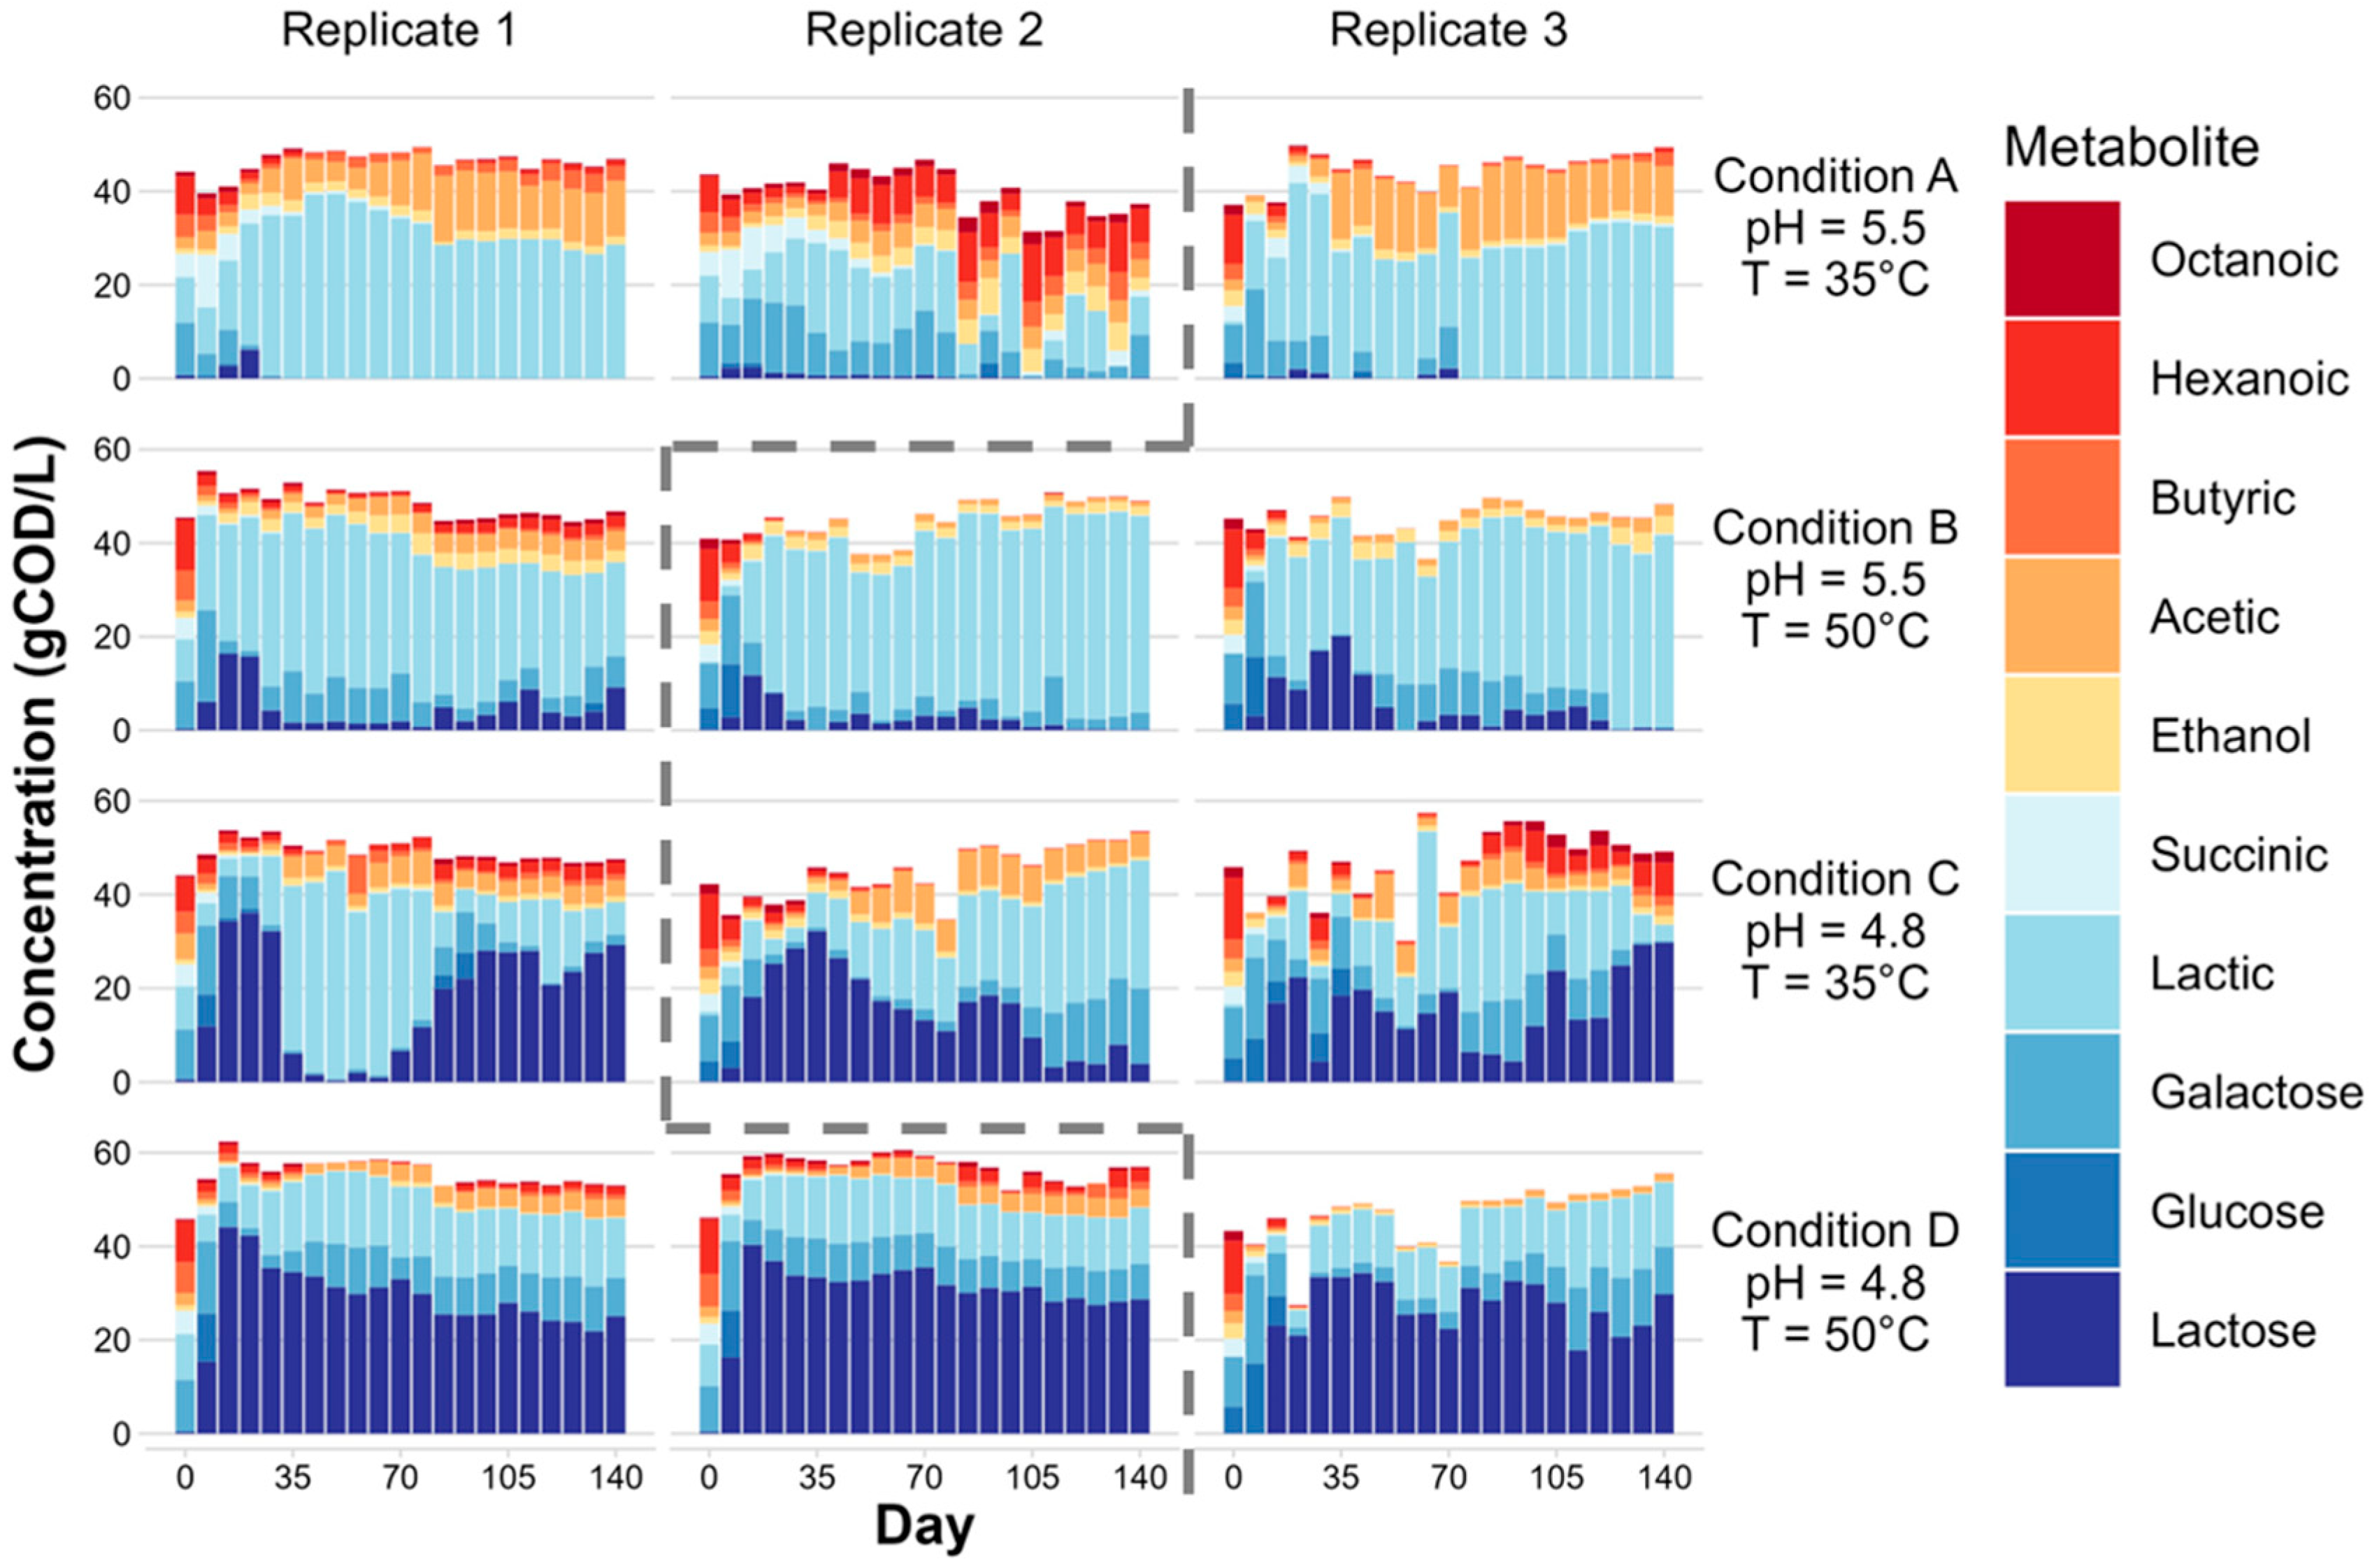
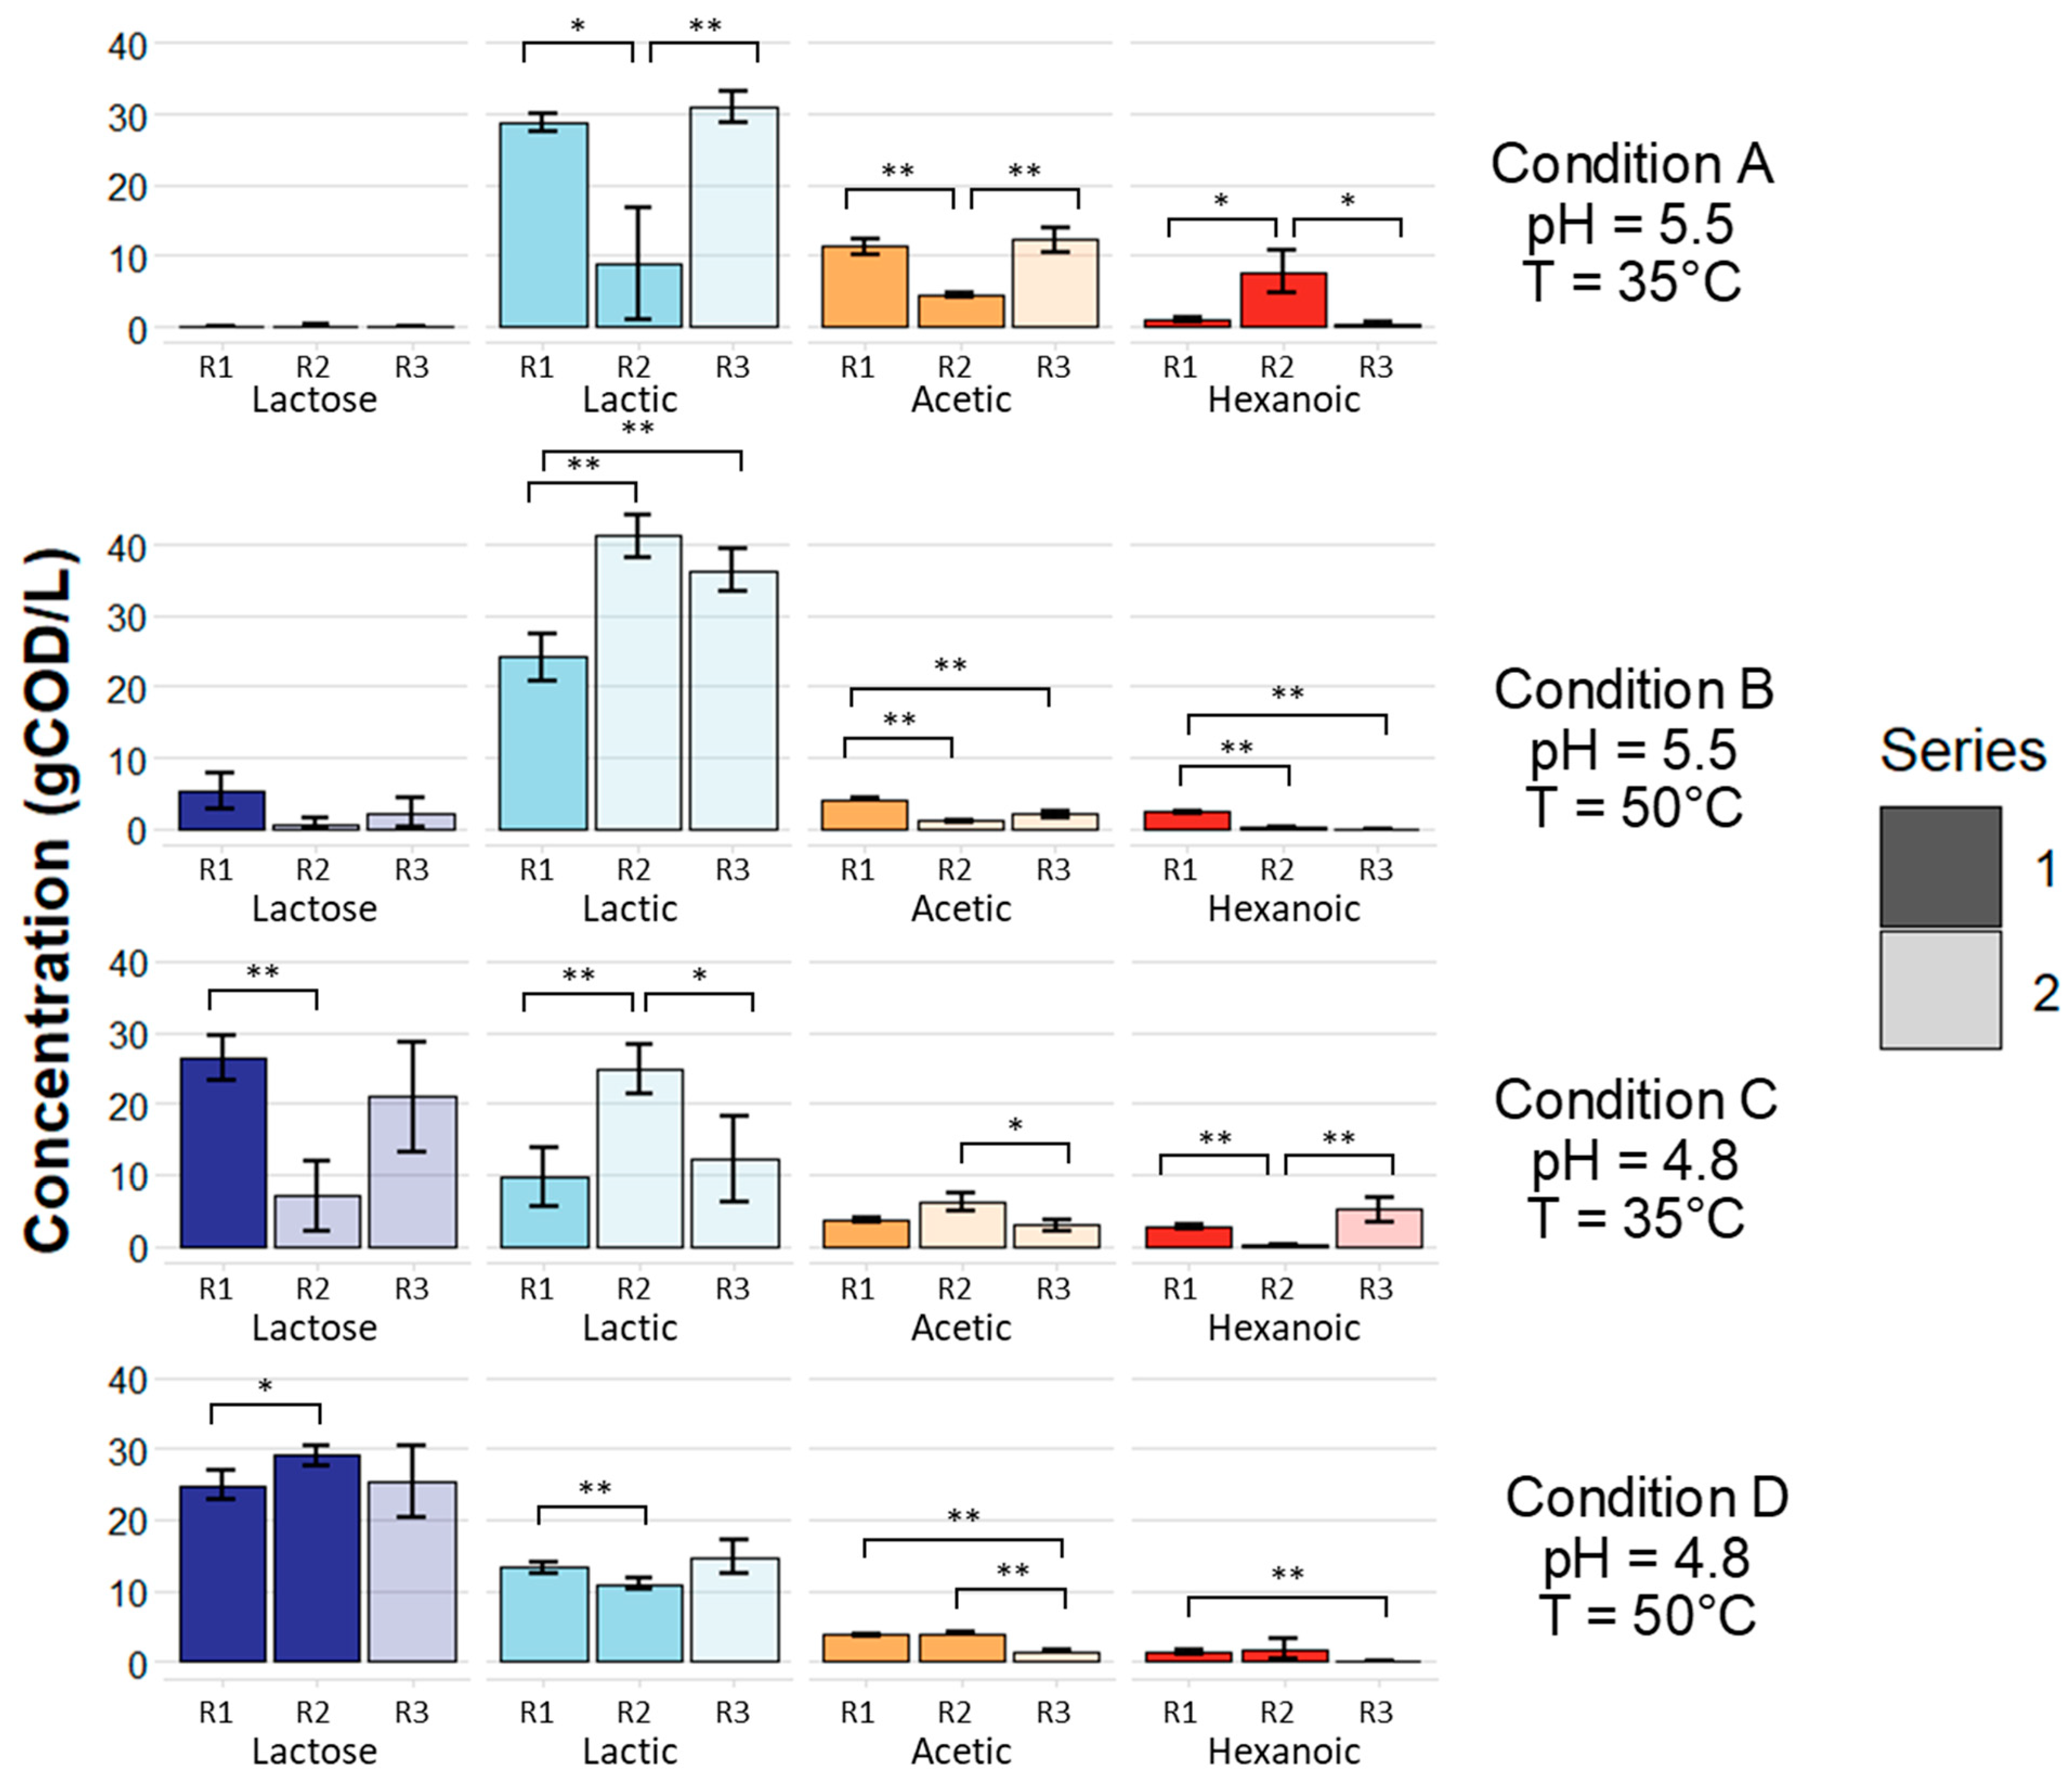
3.1. Microbial Fermentation of Dairy Coproduct Mixtures

To evaluate the possibility of using a mixture of UFMP and CAW as the feedstock to produce valuable chemicals by mixed culture fermentation, we set up chemostat bioreactors receiving a 1:1 mixture (by volume) of these two dairy coproducts. We hypothesized that the pH and temperature are important operational variables that influence the type of fermentation product that accumulates in the bioreactors. To test this hypothesis, we operated chemostat bioreactors at two temperatures (35 °C and 50 °C) and two pH (4.8 and 5.5) conditions (Figure 1) and determined the fermentation product profiles over time at each condition.
The inoculum for these experiments was collected from an acid-phase digester at the local wastewater treatment plant (Madison, WI, USA). Since the composition of this inoculum may vary depending on the operational conditions at the treatment plant or the time of the year, we were interested in evaluating whether bioreactors operated under identical conditions would converge to the same fermentation product profiles and enrich for a similar microbial community. To test this, we ran two series of experiments with inoculum collected on two different days (Figure 1). Six reactors were operated in each series, and for each series, two sets of duplicate experiments were included, as shown in Figure 1. The inoculum was initially enriched in bioreactors operated at 35 °C and a pH of 5.5. After 23 days, the contents of these enrichment bioreactors were distributed to six test bioreactors in each experimental series, and these sets of reactors were operated in parallel for 140 days. The performance of each bioreactor was monitored by measuring the effluent concentration of carbohydrate substrates and of fermentation products throughout the operational period (Figure 2, Table S6). We selected to operate the reactors for a long period of time to allow for the microbial community to reach some level of equilibrium. Note that in a chemostat operation, the product is continuously produced, and with a 6-day retention time, one sixth of the culture volume containing the product is removed daily.
The UFMP:CAW dairy coproduct mixture contained 63 ± 2 g COD/L of organic material, all of it accounted for as soluble substrates (Table 1). Lactose was the most abundant substrate (52 ± 3 g COD/L), representing 83% of total influent COD to the bioreactors. Lactic acid (3 ± 0 g COD/L) represented 5% of the total COD and soluble protein (4 ± 0 g COD/L) represented 6% of the total COD. Glucose and galactose, the monomeric components of lactose, were also measured and found not to be present in detectable amounts. The mixture had negligible amounts of insoluble COD as determined by soluble and total COD tests not being statistically different (Table 1).
We found that the extent to which the dairy coproduct carbohydrate was fermented depended on the pH value, with bioreactors operated at a pH of 5.5 having almost complete lactose utilization whereas bioreactors operated at a pH of 4.8 showing incomplete lactose degradation (Figure 2). Using the last 42 days of bioreactor operation as a period representing approximately steady-state conditions in most bioreactors (Figure 2), the average lactose concentrations in the effluent of the pH 5.5 bioreactors were 0 ± 0 g COD/L and 3 ± 3 g COD/L for the reactors operated at 35 °C and 50 °C, respectively (Figure 3). In contrast, the effluent lactose concentrations in the bioreactors operated at a pH of 4.8 during this same period were 18 ± 10 g COD/L and 26 ± 4 g COD/L for the reactors operated at 35 °C and 50 °C, respectively (Figure 3). The quantity of residual lactose did not differ significantly (Welch’s two-sided t-test, p > 0.05, with Bonferroni correction) between replicate bioreactors operated under identical conditions at a pH of 5.5 regardless of whether bioreactors were seeded with the same inoculant or initiated in a separate series (Figure 3). Thus, from a perspective of lactose utilization, we conclude from these data that the pH 5.5 condition is suitable for the efficient conversion of dairy coproduct carbohydrates to fermentation products with the coproduct mixture used.
The extracellular fermentation products that accumulated in the bioreactors (Figure 2) included primary products of carbohydrate fermentation such as lactic, acetic, and succinic acids, and ethanol, and carboxylic acids that can result from the chain elongation of primary fermentation products including butyric, hexanoic, and octanoic acids [29,71]. Among these products, lactic, acetic, and hexanoic acids were the most abundant extracellular products accumulating in the bioreactors.
Using the averages from the last 42 days of bioreactor operation as a proxy for the quantities of products that could be recovered from the fermentation of UFMP:CAW mixtures (Figure 3), we assessed the reproducibility of product accumulation when bioreactors were operated under identical conditions and started from the same inoculum or from inocula collected at different times. This analysis showed that the reproducibility of product accumulation can vary under the operational conditions used. For instance, within bioreactors operated at a pH of 5.5 and 35 °C (Condition A in Figure 3), Replicate 1 accumulated significantly different amounts of lactic, acetic, and hexanoic acids compared to Replicate 2, even though they were initiated with the same inoculum. However, product accumulation in Replicate 1 was not significantly different from product accumulation in Replicate 3, despite these reactor runs starting with separate inocula (Figure 3). The opposite result was observed for the bioreactors operated at a pH of 5.5 and 50 °C (Condition B in Figure 3). That is, replicates starting from the same inoculum (Replicates 2 and 3) did not have significant differences in product accumulation, while Replicate 1, started with a different inoculum (Figure 1), resulted in significantly different product accumulation when compared to the accumulation observed in both other replicate reactors (Figure 3). Similar reproducibility results were observed among the bioreactors operated at pH 4.8. In the case of operation at 35 °C (Condition C in Figure 3), two replicates from different inocula had no significant differences in product accumulation (Replicates 1 and 3), while the third replicate (Replicate 2) had multiple significantly different results compared to other replicates. At 50 °C (Condition D in Figure 3), replicates from the same inoculum had a significant difference in lactic acid accumulation, while more differences were evident when comparing replicates initiated with different inocula.

3.2. Metagenomic Analysis of Bioreactor Microbial Communities

We wanted to test if the patterns of product accumulation observed in bioreactors, regardless of the inoculum used, will depend on the assemblage of the microbial communities during bioreactor operation. For example, although lactic acid was the main fermentation product that accumulated in the bioreactors (Figure 3), we hypothesize that bioreactors with the highest accumulation of lactic acid have lower abundance of lactic acid-consuming or carbohydrate-consuming chain elongating microorganisms. To test this hypothesis, we used a metagenome-based analysis of the microbial communities operated at a pH of 5.5 (Conditions A and B in Figure 3), which are the conditions that resulted in almost complete utilization of the influent carbohydrates.
DNA was extracted and processed from samples collected after 140 days of operation of the six pH 5.5 bioreactors, and from the two enrichment cultures used to inoculate these bioreactors (Figure 1). After sequencing the DNA from duplicate samples collected for each condition, we assembled 16 metagenome libraries [40]. From these metagenome libraries, we recovered a total of 122 MAGs with >75% completeness and <3% contamination (Table S1). An average nucleotide identity (ANI) analysis of these MAGs reveals that they can be grouped into 34 taxonomic clusters, using an ANI threshold of 0.95, spanning three different bacterial phyla (Table 2). We found that 12 of these clusters belong to the phylum Actinomycetota (Actinobacteria), 19 to the Bacillota (Firmicutes), and 3 to the Pseudomonadota (Proteobacteria).
Table 2 summarizes the characteristics of the highest quality MAGs that represent each of the 34 taxonomic clusters. This dataset is composed of two high-quality (HQ) and thirty-two medium-quality (MQ) MAGs, as defined by the standards for minimum information for metagenome-assembled genomes (MIMAG) (i.e., HQ has >90% completeness, <5% contamination, and encodes 23S, 16S, and 5S rRNA genes and tRNAs for at least 18 of the 20 possible amino acids; MQ has >50% completeness and <10% contamination [72]). In this MAG dataset, 15 could be classified at the genus and species level and had ANI values greater than 0.98 when compared to reference genomes in the genome taxonomy database (GTDB) [42]. This suggests that many of the microorganisms enriched in the bioreactors are closely related to already characterized strains, and therefore, their function in the bioreactors can be more easily inferred. For instance, among the Actinomycetota, several MAGs were classified in the Bifidobacterium genus, which encompass microorganisms that ferment carbohydrates to lactic acid via the bifid shunt [73]. Among the Bacillota, several MAGs correspond to the genera of known lactic acid bacteria, such as Lactobacillus, Lacticaseibacillus, Leuconostoc, Lentilactobacillus, Weizmannia, and Lactococcus [74,75,76,77,78,79]. Notably, the STREP1 MAG, classified as Lactococcus lactis (Table 2), shares the genus and species of the microorganisms used in the production of cottage cheese by the facility that generated the CAW, and thus, this community member may have originated from the CAW. There are also MAGs whose classification associates them with the production of medium chain carboxylic acids (e.g., hexanoic acid), such as Caproicibacterium [80,81,82].
For a more comprehensive prediction of the functional roles of the MAGs derived from the communities in the bioreactors, we used two methods of functional classification. We used a machine learning algorithm that was trained to classify MAGs from fermenting microbial communities into four groups, namely (1) organisms metabolizing carbohydrates to lactic acid (lactic acid producers) such as Bifidobacterium species and Bacilli such as Lactobacillus and Leuconostoc species, (2) organisms metabolizing fermentation products, such as lactic acid, into butyric, hexanoic, and/or octanoic acids (intermediate chain elongators), such as Clostridium and Megasphaera species, (3) organisms converting carbohydrates directly into butyric, hexanoic, and/or octanoic acids (carbohydrate chain elongators), such as Caproicibacter species, and (4) organisms that could not be assigned to any of these three functional groups [46]. To complement this tool, we manually classified MAGs into these four groups by assessing the presence of homolog genes for metabolic pathways characteristic of each functional group [24] in combination with taxonomic inferences from GTDB classifications (Table S7; Figure S2) [19,73,74,75,76,77,78,79,81,82,83,84,85,86,87,88]. For this manual classification method, the MAGs assigned to taxa with demonstrated functional characteristics were classified as the corresponding functional group (e.g., Lactobacillus as a lactic acid bacteria), and the MAGs containing homologues of genes resulting in the predicted near-completion of metabolic pathways key to a given functional group were classified as that group (Table S7; Figure S2). From these methods, we predicted 20 MAGs as being lactic acid producers, 6 MAGs as capable of the chain elongation metabolism directly from carbohydrates, and no MAGs performing chain elongation from lactic acid (Figure 4A). In addition, eight MAGs were not classified into any of the three categories (Table S7).
Having classified these MAGs according to their predicted function, we evaluated the relative abundance of each functional group in the microbial community by adding up the relative abundances of the representative MAGs in each group (Figure 4B). This analysis revealed that all the bioreactor-enriched communities were primarily composed of lactic acid producers, regardless of the inoculum used. However, the inoculants used for the series 1 and series 2 experiments had different compositions, with the series 1 inoculant having a large fraction of community members identified as carbohydrate chain elongators.
In the enrichments, only Replicate 2 in series 1 of Condition A (Figure 4B) had community members identified as carbohydrate chain elongators, in agreement with this reactor having the greatest accumulation of hexanoic acid (Figure 3). However, the relative abundance estimation for this reactor was an outlier, with only 28% of the microbial community explained by the abundances of the 34 representative MAGs (Figure 4B, left-hand side bars). We reasoned that one or more abundant members of the community in this bioreactor was not represented in the set of 34 representative MAGs because MQ or HQ MAGs were not assembled from the DNA sequencing of this community. To evaluate this hypothesis, we augmented the set of representative MAGs with an existing dataset of 185 unique taxonomic MAGs that was derived from other fermentation studies that used the same acid-phase digester as the source of the inoculum (Table S2) [24,37,46,47,48]. As a first step in this analysis, we compared the dataset of the 34 MAGs representing the taxonomic clusters obtained in this study to the 185 MAG dataset (Figure S3). This analysis revealed that 18 out of the 34 MAGs recovered in this study were already represented in the 185 MAG dataset. We then classified the remaining 167 MAGs according to their functional role in the fermenting communities, as described above (Table S7), and mapped the DNA reads from each metagenome library to the expanded dataset of 201 MAGs (34 from this study, 167 from other studies) to re-estimate the relative abundance of these representative MAGs in the bioreactors and in the inocula used in this study. This re-evaluation of relative abundances (right-hand side bars in Figure 4B) increased the cumulative relative abundance for the outlier from 28% to 76%, chiefly with the identification of one additional community member, an Atopobiaceae MAG (UW_SG_COR3; Actinomycetota) classified as a lactic acid producer and with a relative abundance of 48.6% in this community (Figure 4). Additionally, the MAGs classified as intermediate chain elongators, a functional group that was not present in the original mapping, were identified in several samples, most notably in the samples for the series 2 inoculant and Replicate 1 of the pH 5.5 and 50 °C condition where they displayed 4.6% and 3.2% summed relative abundance, respectively (Figure 4).
In an attempt to understand how community composition affected the accumulation of lactic acid in each bioreactor, we compared the concentration of lactic acid during the last 42 days of operation to the summed relative abundance of functional groups (Figure 5). This analysis revealed that lactic acid-producing bacteria were abundant in each sample, regardless of lactic acid concentration (ranging from 74 to 87% relative abundance), while chain elongators were more abundant when lactic acid concentrations were lower, with carbohydrate and intermediate chain elongators having a summed 6% relative abundance at the lowest lactic acid concentration, 3% at the second lowest lactic acid concentration, and below 1% for each other sample (Figure 5).

3.3. Lactic Acid Pathway Analysis

Our analysis predicted that most of the bioreactor microbial communities were dominated by a mixture of many diverse lactic acid-producing organisms (Figure 4B and Figure S3). To assess why there was such variety and redundancy in MAGs predicted capable of lactic acid production in these communities, we asked whether there were differences in metabolic pathways contained within the abundant MAGs predicted to be lactic acid producers. To do so, we searched the MAGs present above 1% relative abundance in one or more communities for the presence of homologues for genes of three lactic acid-producing pathways: (1) homolactic fermentation resulting in lactic acid as the sole product [77], (2) the heterofermentative phosphoketolase pathway producing lactic acid, carbon dioxide, and ethanol [89], and (3) the heterofermentative bifid shunt producing lactic and acetic acids (Figure 6) [73]. This analysis illustrated that individual MAGs had a differing completion of pathways suggesting that different pathways may have been utilized by different MAGs. The bifid shunt was the most complete pathway for lactic acid production in most Bifidobacteria and Atopobiaceae MAGs, homolactic fermentation was the most complete pathway in most Bacilli MAGs, and the phosphoketolase pathway was the most complete pathway in three MAGs spanning two phyla. Consistent with these results, Bifidobacteria are reported to typically utilize the bifid shunt for carbohydrate fermentation [73], and Bacilli, such as many Lactobacilli and Weizmania coagulans, typically utilize homofermentation, while others, such as Leuconostoc, typically utilize the phosphoketolase pathway [74,76,77,90].

4. Discussion

This work is part of efforts to evaluate the ability to convert abundant dairy coproducts into valuable chemicals by microbial fermentation. Previous experiments have shown that microbial communities could convert the lactose in UFMP into one or more valuable chemicals as long as ammonia was added as an exogenous nitrogen source [24]. One goal of this study was to assess whether a mixture of UFMP and CAW could be utilized as a feedstock for the generation of valuable chemicals by a microbial community without the need of added nutrients. Furthermore, we wanted to know how temperature and pH could affect such a biotransformation. Our results indicated that a 1:1 mixture of UFMP and CAW contained all the nutrients necessary for bioconversion since its lactose was almost completely fermented at a pH of 5.5. We also found that the pH value affected the ability of microbial communities to ferment this mixture of dairy coproducts as its lactose was not fully consumed at a pH of 4.8 (Figure 3).
Lactic acid accumulated to high concentrations for extended durations in several bioreactors, including all three of those operated at a pH of 5.5 and 50 °C and two of those operated at a pH of 5.5 and 35 °C (Figure 2). This fermentation product has relevance as a valuable chemical with potential as an end product of bioconversion that is useful to society [25,28]. Our results show that while lactic acid accumulation was not consistent across all replicates under any conditions, its yield was most consistently highest, and the concentration of other products was lowest, in bioreactors operated at a pH of 5.5 and 50 °C (Figure 3), suggesting these bioreactor conditions were an important factor in end product formation and that they may be beneficial in prospective industrial applications of microbial community fermentation, where consistency and robustness of function is imperative.
These results add to the knowledge from recent studies involving food wastes, dairy coproducts, and glucose-based feedstocks that demonstrated that, with microbial communities, thermophilic conditions are favorable for the accumulation of lactic acid compared to lower temperatures [29,30,32]. Additionally, other studies involving food waste and glucose-based feedstocks have demonstrated that acidic conditions ranging from pH values of 3.5–5.0 increase the selectivity for lactic acid by fermentative communities compared to higher pH values [33,34,35]. In contrast, we found our feedstock and operational conditions were not conducive to complete metabolism of the lactose of this mixture of dairy coproducts at a pH of 4.8. Consistent with our results, one recent experiment utilizing bioethanol stillage as a feedstock showed that a shift to thermophilic (55 °C) and low pH (pH 5.0) simultaneously increased the selectivity of a fermentative community towards lactic acid production [37]. Additionally, it has been demonstrated that a low pH can shift the metabolism from carbohydrate utilization to amino acid utilization for some lactic acid bacteria [91], which could be a factor in the incomplete lactose utilization observed for bioreactors operated at a pH of 4.8 in this study. When combined, these previous studies and our studies illustrate a need to tune the bioreactor conditions of pH value and temperature for optimized functionality.

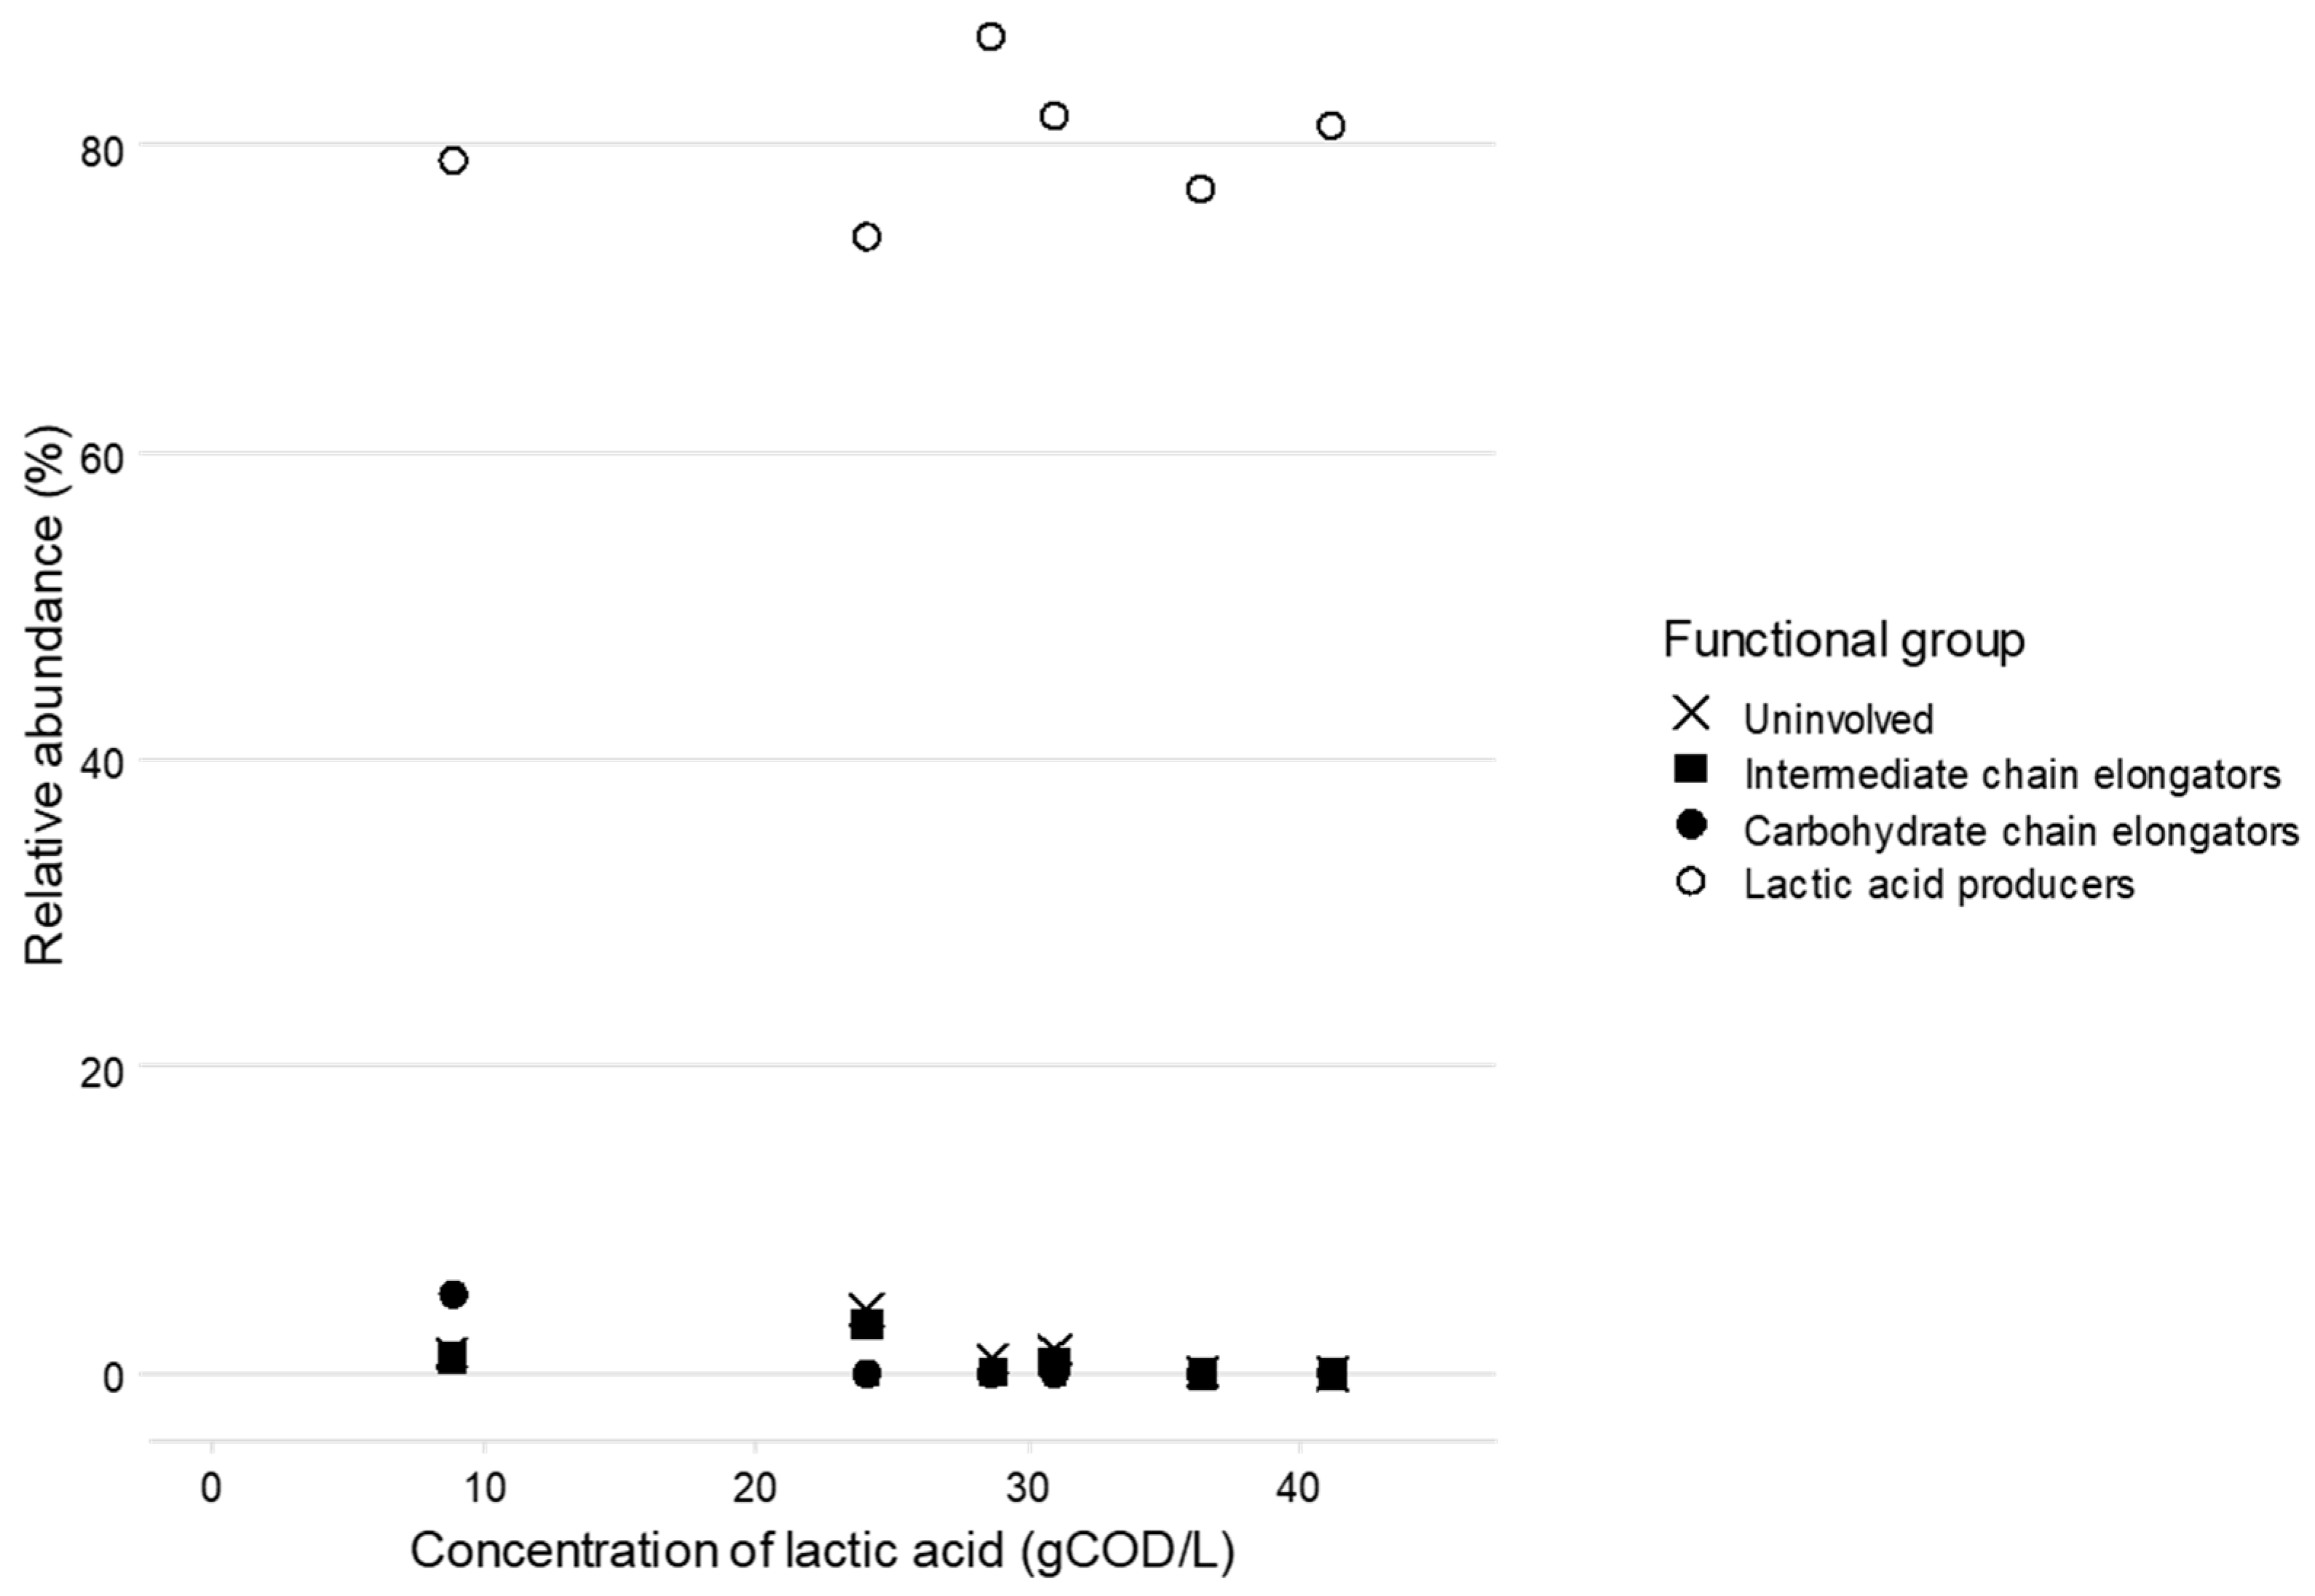
4.1. Communities Enriched for Lactic Acid Producing Organisms

In this study, we also sought to describe the members of lactose fermenting microbial communities within bioreactors operated at a pH of 5.5. We found that these microbial communities, although started from disparate inocula, became dominated by a mixture of lactic acid-producing organisms (Figure 4B). Notably, this community shift coincided in most cases with increased lactic acid accumulation (Figure 2), exemplifying the link between community structure and function. A similar convergence of community structure from disparate inocula was demonstrated in a recent study where three types of inocula (methanogenic sludge, fresh food waste, and anaerobic sludge) were used in bioreactors operated under identical conditions and resulted in lactic acid-producing communities with similar structure to each other that were dominated by Lactobacillus [34]. Notably, despite the similarity of functional groups observed between the community members of the different bioreactors, there is much variability regarding specific taxa enriched in each (Figure 4A). Interestingly, in some cases, bioreactors from disparate inocula resulted in the enrichment of the same community members (e.g., Figure 4A, BIF2 and ATO4 in A1 and A3) while in other cases, replicate bioreactors from the same inoculant resulted in disparate taxa dominating the community (e.g., Figure 4A, A1 and A2). The former case exemplifies how the selective pressure of given operational conditions can favor the enrichment of specific taxa such as those demonstrated in recent studies [34,92]. The latter case exemplifies that there is a balance between stochastic and deterministic factors regarding the assemblage of microbial communities, as discussed by Dini-Andreote et al. [93].

4.2. The Presence of Chain Elongators Were Associated with Lower Lactic Acid Accumulation

MAGs predicted to represent chain-elongating microorganisms were present in this study’s bioreactors where hexanoic acid accumulated but were largely absent from bioreactors not accumulating hexanoic acid (Figure 2, Figure 3 and Figure 4B). Additionally, the presence of chain elongators was associated with lower lactic acid production (Figure 5), suggesting the metabolic activity of microbes represented by these MAGs contributed to lower yields of lactic acid, potentially through the consumption of carbohydrates by carbohydrate chain elongators or through the direct consumption of lactic acid by intermediate chain elongators. Both occurrences could be happening simultaneously and, indeed, a recent study demonstrated in situ competition for carbohydrates between lactic acid bacteria and a chain-elongating organism that could switch between carbohydrate and lactic acid utilization [94]. Notably, in most bioreactors in this study, the total abundance of chain elongator MAGs decreased from the inocula communities to the bioreactor communities (Figure 4B), suggesting that the conditions in this study aided in selecting against chain elongators, decreasing the amount of dairy coproduct mixture material allocated towards chain elongation products such as butyric and hexanoic acids.
Other bioreactor experiments have demonstrated that a shift towards thermophilic temperature or low pH conditions leading to increased lactic acid production was frequently accompanied by a community shift towards lactic acid-producing Bacilli and often accompanied by a decrease in chain elongating Clostridia concurrent with a decrease in chain elongation products such as butyric and hexanoic acids [29,30,32,33,34,35,37]. To complement this trend, Bacilli, Atopobiaceae, and Bifidobacteria are common organisms in butyric and hexanoic acid-producing communities, where they are predicted to produce lactic acid that is subsequently utilized by chain elongating organisms [19,24,46,48,95,96,97,98,99,100]. Indeed, in a previous UFMP-fed bioreactor experiment, we found that lactic acid accumulated when chain-elongating MAGs were not abundant and subsided when butyric acid accumulated concurrently with the increased abundance of a Clostridia MAG predicted to elongate lactic acid [24]. These examples illustrate the relationship between the microbial community composition and function with regards to both lactic acid-producing and chain-elongating organisms, which is key in understanding how pH and temperature can be used to enrich for or against key functional groups within microbial communities. More specifically, these results culminated in the hypothesis that utilizing fermentation conditions that disfavor chain-elongating organisms will increase lactic acid yield in a microbial community.

4.3. Communities Exhibited a High Degree of Functional Redundancy

In contrast to the communities of this study which were composed of mixtures of Bacilli, Atopobiaceae, and Bifidobacteria MAGs predicted to be lactic acid producers (Figure 4A and Table 2), many other reported lactic acid-producing communities exhibited low diversity wherein a small number of organisms dominated, typically Bacilli such as Lactobacillus and Weizmania coagulans [29,32,34,35]. Even in examples of communities with many lactic acid-producing organisms, these were mainly Bacilli, without a significant presence of diverse lactic acid-producing organisms [30,37]. Of these examples, only one lactic acid-producing community contained an abundant Bifidobacterium, predicted to produce lactic and acetic acids via the bifid shunt [35]. When combined, these reports suggest difficulties in predicting the composition of communities that exhibit high levels of lactic acid production.
Insights from Louca et al. [11] have indicated that functional redundancy and taxonomic diversity within communities, such as those we observed in our bioreactors, are not caused by ecological drift (random fluctuations in relative abundances) but are instead emergent properties of open systems that result from the nuanced interactions of community members with each other and the environment, and spatial heterogeneity, all of which diversify the ecological niches available to community members. For instance, our genomic data predicted that various lactic acid-producing organisms in our communities used different routes for lactic acid production (Figure 6), potentially allowing them to occupy different ecological niches and coexist despite all being lactic acid-producing organisms. Furthermore, the observed contrast in diversity and degree of functional redundancy between our experiment and the examples above could be caused by many factors such as the specifics in bioreactor operation, the inoculant, or nutrient composition, all of which could provide varying degrees of ecological niches for microbial community members to occupy. However, it is important to understand what factors affect the diversity of lactic acid-producing community members to further the development of fermentative communities as biotechnological tools because (1) functional redundancy has been demonstrated to confer functional resiliency to biotic and abiotic disturbances in microbial communities [5,10,11,12] and (2) the different lactic acid-producing pathways utilized by these organisms theoretically impact the efficiency of lactic acid production, whereby only homolactic fermentation theoretically yields four lactic acid molecules for every molecule of lactose utilized.

4.4. Current Questions of Pathway Utilization

To illustrate the point that lactic acid-producing pathways impact end products, others [35] have hypothesized that the enrichment for a bifid shunt-utilizing organism resulted in the increased concentration of acetic acid concomitantly with the reduction in lactic acid concentration, compared to a community dominated solely by Lactobacillus. Because replicate bioreactors 1 and 3 operated at a pH of 5.5 and 35 °C resulted in lactic and acetic acids as the major products, while the bioreactors operate at a pH of 5.5 and 50 °C resulted in lactic acid as the sole major product, without a significant accumulation of acetic acid (Figure 2 and Figure 3), one might expect the bifid shunt would be a highly utilized pathway at 35 °C and homolactic fermentation would be the most utilized pathway at 50 °C. However, we found that both MAGs predicted to utilize the bifid shunt (e.g., Bifidobacterium such as BIF2), and those predicted to utilize homolactic fermentation (e.g., Lactobacillus such as LAC1) were abundant at each condition (Figure 4A), suggesting either a disparity between abundance and metabolic activity or some degree of metabolic flexibility within the MAGs such as suggested by the lactic acid pathway analysis (Figure 6). As such, follow-up metatranscriptomic analyses of bioreactors using this mixture of dairy coproducts could help elucidate which organisms are most metabolically active at each condition and what pathways they utilize. Furthermore, while it has been suggested that Atopobiaceae may be capable of utilizing the bifid shunt [58], more research needs to be conducted regarding these common members of lactic acid and chain-elongating communities.

4.5. Comparison to UFMP-Fed Bioreactor

Similar to condition A in this experiment, a previous chemostat experiment from our lab was operated at 35 °C and a pH of 5.5, 6-day solids, and hydraulic retention times, and was inoculated with the same acid sludge source as in this study [24]. As a major operational difference, this previous study fed the bioreactor community UFMP with ammonium chloride as a nitrogen source rather than the UFMP and CAW mixture used in this study, which is rich in proteins. Compared to the bioreactors in this study, the microbial communities in the UFMP-fed bioreactor were much less consistent over time and resulted in a transient mixture of many products. In contrast to the communities at a pH of 5.5 in this study which enriched predominantly for lactic acid-producing organisms, the UFMP-fed bioreactor enriched for a mixture of lactic acid-producing organisms and intermediate chain-elongating organisms (Figure S4). Of particular note, while Bacilli were common members of the communities of this study, no Bacilli were abundant throughout the operation of the UFMP-fed bioreactor, though Atopobiaceae and Bifidbacteria were common, including a single Atopobiaceae MAG that dominated the community during a period of high lactic acid accumulation [24].
Because Bacilli such as Weizmannia coagulans and many Lactobacilli typically produce lactic acid homofermentatively [74,76,90] and may therefore be of importance from a bioprocess perspective, we were interested in understanding why the presence of MAGs related to those organisms differed so drastically between the UFMP-fed bioreactor and the UFMP:CAW-fed bioreactors. We propose that the presence of proteins in the UFMP:CAW-fed bioreactors allowed for the enrichment of certain Bacilli that typically require exogenous amino acids for growth and typically degrade proteins and peptides to acquire them [101,102,103], whereas the protein-lacking UFMP-fed bioreactors did not, resulting in Atopobiaceae and Bifidobacteria being the only lactic acid producers enriched in that bioreactor. To test this hypothesis, we identified homologues for genes used in amino acid biosynthesis in each abundant MAG (above 1% relative abundance in at least one community) from both bioreactors provided with UFMP and CAW and bioreactors provided UFMP and ammonia as a nitrogen source. This analysis revealed that, consistent with our hypothesis, the MAGs in the UFMP and ammonia-fed bioreactors were predicted to be prototrophic for more amino acids than the MAGs from bioreactors fed a combination of UFMP and CAW (Figure S5). In particular, the Lactobacilli (LAC1 and LAC2), which are predicted to be a significant source of extracellular lactic acid in the reactors fed UMFP and CAW, exhibited especially low degrees of amino acid prototrophy; meanwhile, the Atopobiaceae and Bifidobacteria (UW_MP_BIF2, UW_MP_BIF11, and UW_MP_ATO3), predicted to be a significant source of extracellular lactic acid in the UFMP and ammonium-fed bioreactor, exhibited high degrees of amino acid prototrophy. These results suggest that differences in feedstock nutrients could be a factor resulting in the disparity of community structure and bioreactor performance in bioreactors fed dairy coproducts. This concept merits further investigation to understand how this factor can be leveraged to shape microbial communities with specific functional traits.

4.6. Concluding Remarks

This work demonstrated the effective bioconversion of a feedstock composed solely of coproducts from the dairy industry to valuable products by a fermentative community, and it revealed the conditions conducive to the accumulation of lactic acid as a metabolic end product. It showed that the pH value and temperature are important parameters in shaping microbial communities which impacted both the fermentative profiles and the functional reliability of those bioreactors, offering insights on how to achieve better functional control of fermentative communities. In utilizing both replicate bioreactors operated in parallel under identical conditions and bioreactors initiated with separate inoculants but otherwise operated identically, this study illustrates the issues associated with the reliability of fermentative communities, demonstrating which conditions allow for increased consistency in functionality, such as 50 °C and a pH of 5.5 for consistent lactic acid production. Our findings illustrate that further work needs to be conducted to understand the key factors in achieving functional consistency of such communities at other conditions. These insights are invaluable in developing fermentative communities as biotechnological tools of industrial relevance, where functional reliability and control is imperative.
From the perspective of the industrial implementation of this type of fermentation, further research into the processes required for extraction and purification of lactic acid will be an important consideration. Also relevant to industrial application is the selection of the dairy coproducts to be used, taking into consideration the current nutritional value of some of the coproducts, as well as the large volume of coproducts that are currently produced and that could find alternative non-food applications.
Lastly, this work highlighted several additional areas that warrant further investigation to advance this biotechnology towards the goals of real-world applications including (1) experiments assessing the effects of dairy residue nutrient components on microbial composition and performance, (2) metatranscriptomic analyses to test the hypothesized metabolic activity and functional role of community members, and (3) an investigation into the metabolic capabilities and potential industrial utility of Atopobiaceae species.

Supplementary Materials

The following supporting information can be downloaded at: https://www.mdpi.com/article/10.3390/fermentation10080422/s1, Figure S1: phylogenetic analysis of biochemically characterized reference EtfB and MAG EtfB; Figure S2: (A) predicted presence of genes and (B) percent completion of metabolic pathways relevant to lactose fermentation within MAGs; Figure S3: comparison of the 34 MAG dataset originating from this study and the 185 MAG dataset originating from other bioreactor studies; Figure S4: comparison of community compositions between bioreactors of this study (Figure 4B) and the UFMP-fed bioreactor from Walters et al., 2023 [24]; Figure S5: predicted amino acid prototrophy within MAGs abundant in this experiment (blue) and a previous UFMP-fed bioreactor (pink); Table S1: MAG statistics, dRep classification, and genome accession numbers for the 122 MAGs recovered from this study with >75% completion and <3% contamination; Table S2: taxonomy, quality statistics, origin, and participation in mapping of MAGs originating from this study (34 MAG dataset) and from other studies (185 MAG dataset); Table S3: amino acid sequences for glucokinase, fructose-6-phosphate phosphoketolase, electron confurcating lactate dehydrogenase, and electron transfer protein subunit A and B, used in the prediction of gene homologues with tBLASTn; Table S4: amino acid sequences for biochemically characterized reference EtfB and MAG EtfB used for the EtfB phylogenetic tree; Table S5: presence of homologues of genes relevant to lactose fermentation within MAGs; Table S6: concentrations of extracellular carbohydrates and metabolites for each experimental bioreactor; Table S7: functional classification of MAGs; Table S8: relative abundance from the first mapping utilizing the 34 MAG dataset of MAGs originating from this study; Table S9: relative abundance from the second mapping utilizing the 34 MAG dataset of MAGs originating from this study combined with the 167 MAGs novel to other studies (combined 201 MAG dataset).

Author Contributions

Conceptualization, K.A.W., T.J.D. and D.R.N.; methodology, K.A.W., T.J.D. and D.R.N.; software, K.S.M., K.A.W. and A.T.I.; validation, K.A.W. and D.R.N.; formal analysis, K.A.W.; investigation, K.A.W.; resources, T.J.D. and D.R.N.; data curation, K.A.W. and K.S.M.; writing—original draft preparation, K.A.W.; writing—review and editing, T.J.D., D.R.N., K.S.M. and A.T.I.; visualization, K.A.W. and D.R.N.; supervision, T.J.D. and D.R.N.; project administration, T.J.D. and D.R.N.; funding acquisition, T.J.D. and D.R.N. All authors have read and agreed to the published version of the manuscript.

Funding

This work was supported by funding from the National Dairy Council under projects MSN214606 (AAG8952 and AAK8347) and AWD00000053 (AAM1591) and the Great Lakes Bioenergy Research Center, U.S. Department of Energy (DOE), Office of Science, Biological and Environmental Research Program, under award DE-SC0018409. The work (award DOI:10.46936/10.25585/60008808) conducted by the U.S. DOE JGI (https://ror.org/04xm1d337), a DOE Office of Science User Facility, is supported by the Office of Science of the U.S. DOE operated under contract DE-AC02-05CH11231.

Institutional Review Board Statement

Not applicable.

Informed Consent Statement

Not applicable.

Data Availability Statement

The datasets presented in this study can be found in online repositories. The names of the repositories and accession numbers can be found below: https://www.ncbi.nlm.nih.gov/bioproject/PRJNA1040840. Direct links to each metagenome are provided in Table S8. Direct links to individual MAGs originating from this study are provided in Table S1. Direct links to MAGs used in the analysis of this study but originating elsewhere are provided in Table S2.

Acknowledgments

We thank Mick McGee and the rest of the GLBRC Metabolomics team for the HPLC and GC-MS metabolite analyses, collaborators Mike Molitor and John Lucey at the Center for Dairy Research (https://www.cdr.wisc.edu/) and Meister Cheese (Muscoda, WI, USA) for providing the ultra-filtered milk permeate and background knowledge of the dairy industry, WW Homestead Dairy LLC (Waukon, IA, USA) for providing the cottage cheese acid whey, and Matt Seib at the Madison Metropolitan Sewerage District for providing the inoculum for the bioreactor experiments.

Conflicts of Interest

The authors declare no conflicts of interest. The funders had no role in the design of the study; in the collection, analyses, or interpretation of data; in the writing of the manuscript; or in the decision to publish the results.

References

  1. Venkata Mohan, S.; Modestra, J.A.; Amulya, K.; Butti, S.K.; Velvizhi, G. A Circular Bioeconomy with Biobased Products from CO2 Sequestration. Trends Biotechnol. 2016, 34, 506–519. [Google Scholar] [CrossRef]
  2. Wadler, C.S.; Wolters, J.F.; Fortney, N.W.; Throckmorton, K.O.; Zhang, Y.; Miller, C.R.; Schneider, R.M.; Wendt-Pienkowski, E.; Currie, C.R.; Donohue, T.J.; et al. Utilization of Lignocellulosic Biofuel Conversion Residue by Diverse Microorganisms. Biotechnol. Biofuels Bioprod. 2022, 15, 70. [Google Scholar] [CrossRef]
  3. Perez, J.M.; Sener, C.; Misra, S.; Umana, G.E.; Coplien, J.; Haak, D.; Li, Y.; Maravelias, C.T.; Karlen, S.D.; Ralph, J.; et al. Integrating Lignin Depolymerization with Microbial Funneling Processes Using Agronomically Relevant Feedstocks. Green Chem. 2022, 24, 2795–2811. [Google Scholar] [CrossRef]
  4. Uçkun Kiran, E.; Trzcinski, A.P.; Ng, W.J.; Liu, Y. Bioconversion of Food Waste to Energy: A Review. Fuel 2014, 134, 389–399. [Google Scholar] [CrossRef]
  5. Scarborough, M.J.; Lawson, C.E.; DeCola, A.C.; Gois, I.M. Microbiomes for Sustainable Biomanufacturing. Curr. Opin. Microbiol. 2022, 65, 8–14. [Google Scholar] [CrossRef]
  6. Han, W.; He, P.; Shao, L.; Lü, F. Road to Full Bioconversion of Biowaste to Biochemicals Centering on Chain Elongation: A Mini Review. J. Environ. Sci. 2019, 86, 50–64. [Google Scholar] [CrossRef]
  7. Duber, A.; Jaroszynski, L.; Zagrodnik, R.; Chwialkowska, J.; Juzwa, W.; Ciesielski, S.; Oleskowicz-Popiel, P. Exploiting the Real Wastewater Potential for Resource Recovery—n-Caproate Production from Acid Whey. Green Chem. 2018, 20, 3790–3803. [Google Scholar] [CrossRef]
  8. Chen, J.; Zhang, W.; Tan, L.; Wang, Y.; He, G. Optimization of Metabolic Pathways for Bioconversion of Lignocellulose to Ethanol through Genetic Engineering. Biotechnol. Adv. 2009, 27, 593–598. [Google Scholar] [CrossRef]
  9. Cheng, K.-K.; Wang, G.-Y.; Zeng, J.; Zhang, J.-A. Improved Succinate Production by Metabolic Engineering. Biomed Res. Int. 2013, 2013, 538790. [Google Scholar] [CrossRef]
  10. Spirito, C.M.; Daly, S.E.; Werner, J.J.; Angenent, L.T. Redundancy in Anaerobic Digestion Microbiomes during Disturbances by the Antibiotic Monensin. Appl. Environ. Microbiol. 2018, 84, e02692-17. [Google Scholar] [CrossRef]
  11. Louca, S.; Polz, M.F.; Mazel, F.; Albright, M.B.N.; Huber, J.A.; O’Connor, M.I.; Ackermann, M.; Hahn, A.S.; Srivastava, D.S.; Crowe, S.A.; et al. Function and Functional Redundancy in Microbial Systems. Nat. Ecol. Evol. 2018, 2, 936–943. [Google Scholar] [CrossRef] [PubMed]
  12. Girvan, M.S.; Campbell, C.D.; Killham, K.; Prosser, J.I.; Glover, L.A. Bacterial Diversity Promotes Community Stability and Functional Resilience after Perturbation. Environ. Microbiol. 2005, 7, 301–313. [Google Scholar] [CrossRef] [PubMed]
  13. Stams, A.J.M.; Plugge, C.M. Electron Transfer in Syntrophic Communities of Anaerobic Bacteria and Archaea. Nat. Rev. Microbiol. 2009, 7, 568–577. [Google Scholar] [CrossRef] [PubMed]
  14. Sieuwerts, S.; De Bok, F.A.M.; Hugenholtz, J.; Van Hylckama Vlieg, J.E.T. Unraveling Microbial Interactions in Food Fermentations: From Classical to Genomics Approaches. Appl. Environ. Microbiol. 2008, 74, 4997–5007. [Google Scholar] [CrossRef]
  15. Mee, M.T.; Collins, J.J.; Church, G.M.; Wang, H.H. Syntrophic Exchange in Synthetic Microbial Communities. Proc. Natl. Acad. Sci. USA 2014, 111, E2149–E2156. [Google Scholar] [CrossRef] [PubMed]
  16. Kleerebezem, R.; van Loosdrecht, M.C. Mixed Culture Biotechnology for Bioenergy Production. Curr. Opin. Biotechnol. 2007, 18, 207–212. [Google Scholar] [CrossRef] [PubMed]
  17. Yu, H.Q.; Mu, Y.; Fang, H.H.P. Thermodynamic Analysis of Product Formation in Mesophilic Acidogenesis of Lactose. Biotechnol. Bioeng. 2004, 87, 813–822. [Google Scholar] [CrossRef]
  18. Liu, B.; Kleinsteuber, S.; Centler, F.; Harms, H.; Sträuber, H. Competition between Butyrate Fermenters and Chain-Elongating Bacteria Limits the Efficiency of Medium-Chain Carboxylate Production. Front. Microbiol. 2020, 11, 336. [Google Scholar] [CrossRef] [PubMed]
  19. Candry, P.; Ganigué, R. Chain Elongators, Friends, and Foes. Curr. Opin. Biotechnol. 2021, 67, 99–110. [Google Scholar] [CrossRef]
  20. Prazeres, A.R.; Carvalho, F.; Rivas, J. Cheese Whey Management: A Review. J. Environ. Manag. 2012, 110, 48–68. [Google Scholar] [CrossRef]
  21. Menchik, P.; Zuber, T.; Zuber, A.; Moraru, C.I. Short Communication: Composition of Coproduct Streams from Dairy Processing: Acid Whey and Milk Permeate. J. Dairy Sci. 2019, 102, 3978–3984. [Google Scholar] [CrossRef]
  22. Asunis, F.; De Gioannis, G.; Dessì, P.; Isipato, M.; Lens, P.N.L.; Muntoni, A.; Polettini, A.; Pomi, R.; Rossi, A.; Spiga, D. The Dairy Biorefinery: Integrating Treatment Processes for Cheese Whey Valorisation. J. Environ. Manag. 2020, 276, 111240. [Google Scholar] [CrossRef]
  23. Tarapata, J.; Zieliński, M.; Zulewska, J. Valorization of Dairy By-Products: Efficiency of Energy Production from Biogas Obtained in Anaerobic Digestion of Ultrafiltration Permeates. Energies 2022, 15, 6829. [Google Scholar] [CrossRef]
  24. Walters, K.A.; Mohan, G.; Myers, K.S.; Ingle, A.T.; Donohue, T.J.; Noguera, D.R. A Metagenome-Level Analysis of a Microbial Community Fermenting Ultra-Filtered Milk Permeate. Front. Bioeng. Biotechnol. 2023, 11, 1173656. [Google Scholar] [CrossRef]
  25. Biddy, M.J.; Scarlata, C.; Kinchin, C. Chemicals from Biomass: A Market Assessment of Bioproducts with Near-Term Potential. 2016. Available online: www.nrel.gov/publications (accessed on 11 November 2021).
  26. Dwidar, M.; Park, J.-Y.; Mitchell, R.J.; Sang, B.-I. The Future of Butyric Acid in Industry. Sci. World J. 2012, 2012, 471417. [Google Scholar] [CrossRef]
  27. Spirito, C.M.; Richter, H.; Rabaey, K.; Stams, A.J.M.; Angenent, L.T. Chain Elongation in Anaerobic Reactor Microbiomes to Recover Resources from Waste. Curr. Opin. Biotechnol. 2014, 27, 115–122. [Google Scholar] [CrossRef]
  28. Komesu, A.; de Oliveira, J.A.R.; da Silva Martins, L.H.; Maciel, M.R.W.; Filho, R.M. Lactic Acid Production to Purification: A Review. BioResources 2017, 12, 4364–4383. [Google Scholar] [CrossRef]
  29. Xu, J.; Hao, J.; Guzman, J.J.L.; Spirito, C.M.; Harroff, L.A.; Angenent, L.T. Temperature-Phased Conversion of Acid Whey Waste Into Medium-Chain Carboxylic Acids via Lactic Acid: No External e-Donor. Joule 2018, 2, 280–295. [Google Scholar] [CrossRef]
  30. Kim, M.S.; Na, J.G.; Lee, M.K.; Ryu, H.; Chang, Y.K.; Triolo, J.M.; Yun, Y.M.; Kim, D.H. More Value from Food Waste: Lactic Acid and Biogas Recovery. Water Res. 2016, 96, 208–216. [Google Scholar] [CrossRef] [PubMed]
  31. Hollister, E.B.; Forrest, A.K.; Wilkinson, H.H.; Ebbole, D.J.; Tringe, S.G.; Malfatti, S.A.; Holtzapple, M.T.; Gentry, T.J. Mesophilic and Thermophilic Conditions Select for Unique but Highly Parallel Microbial Communities to Perform Carboxylate Platform Biomass Conversion. PLoS ONE 2012, 7, e39689. [Google Scholar] [CrossRef]
  32. Kim, D.H.; Lim, W.T.; Lee, M.K.; Kim, M.S. Effect of Temperature on Continuous Fermentative Lactic Acid (LA) Production and Bacterial Community, and Development of LA-Producing UASB Reactor. Bioresour. Technol. 2012, 119, 355–361. [Google Scholar] [CrossRef] [PubMed]
  33. Itoh, Y.; Tada, K.; Kanno, T.; Horiuchi, J.I. Selective Production of Lactic Acid in Continuous Anaerobic Acidogenesis by Extremely Low PH Operation. J. Biosci. Bioeng. 2012, 114, 537–539. [Google Scholar] [CrossRef] [PubMed]
  34. Tang, J.; Wang, X.C.; Hu, Y.; Zhang, Y.; Li, Y. Effect of PH on Lactic Acid Production from Acidogenic Fermentation of Food Waste with Different Types of Inocula. Bioresour. Technol. 2017, 224, 544–552. [Google Scholar] [CrossRef] [PubMed]
  35. Feng, K.; Li, H.; Zheng, C. Shifting Product Spectrum by PH Adjustment during Long-Term Continuous Anaerobic Fermentation of Food Waste. Bioresour. Technol. 2018, 270, 180–188. [Google Scholar] [CrossRef] [PubMed]
  36. Candry, P.; Radic, L.; Favere, J.; Carvajal-arroyo, J.M.; Rabaey, K.; Ganigué, R. Mildly Acidic PH Selects for Chain Elongation to Caproic Acid over Alternative Pathways during Lactic Acid Fermentation. Water Res. 2020, 186, 116396. [Google Scholar] [CrossRef] [PubMed]
  37. Fortney, N.W.; Hanson, N.J.; Rosa, P.R.F.; Donohue, T.J.; Noguera, D.R. Diverse Profile of Fermentation Byproducts from Thin Stillage. Front. Bioeng. Biotechnol. 2021, 9, 695306. [Google Scholar] [CrossRef] [PubMed]
  38. Ganigué, R.; Sánchez-Paredes, P.; Bañeras, L.; Colprim, J. Low Fermentation PH Is a Trigger to Alcohol Production, but a Killer to Chain Elongation. Front. Microbiol. 2016, 7, 702. [Google Scholar] [CrossRef] [PubMed]
  39. Jankowska, E.; Chwiałkowska, J.; Stodolny, M.; Oleskowicz-Popiel, P. Effect of PH and Retention Time on Volatile Fatty Acids Production during Mixed Culture Fermentation. Bioresour. Technol. 2015, 190, 274–280. [Google Scholar] [CrossRef] [PubMed]
  40. Walters, K.A.; Myers, K.S.; Donohue, T.J.; Noguera, D.R. Metagenome-Assembled Genomes from Microbiomes Fermenting Dairy Coproducts. Microbiol. Resour. Announc. 2024, 13, e0017324. [Google Scholar] [CrossRef]
  41. Olm, M.R.; Brown, C.T.; Brooks, B.; Banfield, J.F. DRep: A Tool for Fast and Accurate Genomic Comparisons That Enables Improved Genome Recovery from Metagenomes through De-Replication. ISME J. 2017, 11, 2864–2868. [Google Scholar] [CrossRef]
  42. Chaumeil, P.-A.; Mussig, A.J.; Hugenholtz, P.; Parks, D.H. GTDB-Tk: A Toolkit to Classify Genomes with the Genome Taxonomy Database. Bioinformatics 2020, 36, 1925–1927. [Google Scholar] [CrossRef]
  43. Parks, D.H.; Imelfort, M.; Skennerton, C.T.; Hugenholtz, P.; Tyson, G.W. CheckM: Assessing the Quality of Microbial Genomes Recovered from Isolates, Single Cells, and Metagenomes. Genome Res. 2015, 25, 1043–1055. [Google Scholar] [CrossRef] [PubMed]
  44. Langmead, B.; Salzberg, S.L. Fast Gapped-Read Alignment with Bowtie 2. Nat. Methods 2012, 9, 357–359. [Google Scholar] [CrossRef]
  45. Li, H.; Handsaker, B.; Wysoker, A.; Fennell, T.; Ruan, J.; Homer, N.; Marth, G.; Abecasis, G.; Durbin, R. The Sequence Alignment/Map Format and SAMtools. Bioinformatics 2009, 25, 2078–2079. [Google Scholar] [CrossRef] [PubMed]
  46. Myers, K.S.; Ingle, A.T.; Walters, K.A.; Fortney, N.W.; Scarborough, M.J.; Donohue, T.J.; Noguera, D.R. Comparison of Metagenomes from Fermentation of Various Agroindustrial Residues Suggests a Common Model of Community Organization. Front. Bioeng. Biotechnol. 2023, 11, 1197175. [Google Scholar] [CrossRef]
  47. Ingle, A.T.; Fortney, N.W.; Walters, K.A.; Donohue, T.J.; Noguera, D.R. Mixed Acid Fermentation of Carbohydrate-Rich Dairy Manure Hydrolysate. Front. Bioeng. Biotechnol. 2021, 9, 724304. [Google Scholar] [CrossRef] [PubMed]
  48. Scarborough, M.J.; Lawson, C.E.; Hamilton, J.J.; Donohue, T.J.; Noguera, D.R. Metatranscriptomic and Thermodynamic Insights into Medium-Chain Fatty Acid Production Using an Anaerobic Microbiome. mSystems 2018, 3, e00221-18. [Google Scholar] [CrossRef] [PubMed]
  49. Fortney, N.W.; Myers, K.S.; Ingle, A.T.; Walters, K.A.; Scarborough, M.J.; Donohue, T.J.; Noguera, D.R. Metagenomes and Metagenome-Assembled Genomes from Microbiomes Metabolizing Thin Stillage from an Ethanol Biorefinery. Microbiol. Resour. Announc. 2022, 11, e0029022. [Google Scholar] [CrossRef]
  50. Ingle, A.T.; Fortney, N.W.; Myers, K.S.; Walters, K.A.; Scarborough, M.J.; Donohue, T.J.; Noguera, D.R. Metagenome-Assembled Genomes from a Microbiome Grown in Dairy Manure Hydrolysate. Microbiol. Resour. Announc. 2022, 11, e0029222. [Google Scholar] [CrossRef]
  51. Scarborough, M.J.; Myers, K.S.; Donohue, T.J.; Noguera, D.R. Medium-Chain Fatty Acid Synthesis by “Candidatus Weimeria Bifida” Gen. Nov., Sp. Nov., and “Candidatus Pseudoramibacter Fermentans” Sp. Nov. Appl. Environ. Microbiol. 2020, 86, e02242-19. [Google Scholar] [CrossRef]
  52. Scarborough, M.J.; Myers, K.S.; Fortney, N.W.; Ingle, A.T.; Donohue, T.J.; Noguera, D.R. Metagenome-Assembled Genomes from a Microbiome Converting Xylose to Medium-Chain Carboxylic Acids. Microbiol. Resour. Announc. 2022, 11, e0115121. [Google Scholar] [CrossRef] [PubMed]
  53. Walters, K.A.; Myers, K.S.; Wang, H.; Fortney, N.W.; Ingle, A.T.; Scarborough, M.J.; Donohue, T.J.; Noguera, D.R. Metagenomes and Metagenome-Assembled Genomes from Microbial Communities Fermenting Ultrafiltered Milk Permeate. Microbiol. Resour. Announc. 2022, 11, e0029322. [Google Scholar] [CrossRef] [PubMed]
  54. Zhang, H.; Si, S.; Hsieh, C.-J. GPU-Acceleration for Large-Scale Tree Boosting. arXiv 2017, arXiv:1706.08359. [Google Scholar]
  55. Schwengers, O.; Jelonek, L.; Dieckmann, M.A.; Beyvers, S.; Blom, J.; Goesmann, A. Bakta: Rapid and Standardized Annotation of Bacterial Genomes via Alignment-Free Sequence Identification. Microb. Genom. 2021, 7, 000685. [Google Scholar] [CrossRef] [PubMed]
  56. Gerts, E.M.; Yu, Y.K.; Agarwala, R.; Schäffer, A.A.; Altschul, S.F. Composition-Based Statistics and Translated Nucleotide Searches: Improving the TBLASTN Module of BLAST. BMC Biol. 2006, 4, 41. [Google Scholar] [CrossRef] [PubMed]
  57. Zheng, L.; Bai, Z.; Xu, T.; He, B. Glucokinase Contributes to Glucose Phosphorylation in D-Lactic Acid Production by Sporolactobacillus Inulinus Y2-8. J. Ind. Microbiol. Biotechnol. 2012, 39, 1685–1692. [Google Scholar] [CrossRef] [PubMed]
  58. Gupta, R.S.; Nanda, A.; Khadka, B. Novel Molecular, Structural and Evolutionary Characteristics of the Phosphoketolases from Bifidobacteria and Coriobacteriales. PLoS ONE 2017, 12, e0172176. [Google Scholar] [CrossRef]
  59. Weghoff, M.C.; Bertsch, J.; Müller, V. A Novel Mode of Lactate Metabolism in Strictly Anaerobic Bacteria. Environ. Microbiol. 2015, 17, 670–677. [Google Scholar] [CrossRef] [PubMed]
  60. Buckel, W.; Thauer, R.K. Energy Conservation via Electron Bifurcating Ferredoxin Reduction and Proton/Na+ Translocating Ferredoxin Oxidation. Biochim. Biophys. Acta—Bioenerg. 2013, 1827, 94–113. [Google Scholar] [CrossRef] [PubMed]
  61. Costas, A.M.G.; Poudel, S.; Miller, A.-F.; Schut, G.J.; Ledbetter, R.N.; Fixen, K.R.; Seefeldt, L.C.; Adams, M.W.W.; Harwood, C.S.; Boyd, E.S.; et al. Defining Electron Bifurcation in the Electron-Transferring Flavoprotein Family. J. Bacteriol. 2017, 199, e00440-17. [Google Scholar] [CrossRef]
  62. Ledbetter, R.N.; Garcia Costas, A.M.; Lubner, C.E.; Mulder, D.W.; Tokmina-Lukaszewska, M.; Artz, J.H.; Patterson, A.; Magnuson, T.S.; Jay, Z.J.; Duan, H.D.; et al. The Electron Bifurcating FixABCX Protein Complex from Azotobacter Vinelandii: Generation of Low-Potential Reducing Equivalents for Nitrogenase Catalysis. Biochemistry 2017, 56, 4177–4190. [Google Scholar] [CrossRef] [PubMed]
  63. Li, F.; Hinderberger, J.; Seedorf, H.; Zhang, J.; Buckel, W.; Thauer, R.K. Coupled Ferredoxin and Crotonyl Coenzyme A (CoA) Reduction with NADH Catalyzed by the Butyryl-CoA Dehydrogenase/Etf Complex from Clostridium Kluyveri. J. Bacteriol. 2008, 190, 843–850. [Google Scholar] [CrossRef] [PubMed]
  64. Edgar, R.C. MUSCLE: Multiple Sequence Alignment with High Accuracy and High Throughput. Nucleic Acids Res. 2004, 32, 1792–1797. [Google Scholar] [CrossRef] [PubMed]
  65. Stamatakis, A. RAxML Version 8: A Tool for Phylogenetic Analysis and Post-Analysis of Large Phylogenies. Bioinformatics 2014, 30, 1312–1313. [Google Scholar] [CrossRef] [PubMed]
  66. Karp, P.D.; Latendresse, M.; Caspi, R. The Pathway Tools Pathway Prediction Algorithm. Stand. Genom. Sci. 2011, 5, 424–429. [Google Scholar] [CrossRef]
  67. Karp, P.D.; Midford, P.E.; Billington, R.; Kothari, A.; Krummenacker, M.; Latendresse, M.; Ong, W.K.; Subhraveti, P.; Caspi, R.; Fulcher, C.; et al. Pathway Tools Version 23.0 Update: Software for Pathway/Genome Informatics and Systems Biology. Brief. Bioinform. 2021, 22, 109–126. [Google Scholar] [CrossRef]
  68. Kozlov, A.M.; Darriba, D.; Flouri, T.; Morel, B.; Stamatakis, A. RAxML-NG: A Fast, Scalable and User-Friendly Tool for Maximum Likelihood Phylogenetic Inference. Bioinformatics 2019, 35, 4453–4455. [Google Scholar] [CrossRef]
  69. Bianchini, G.; Sánchez-Baracaldo, P. TreeViewer—Cross-Platform Software to Draw Phylogenetic Trees, Version 2.1.0; CERN: Geneva, Switzerland, 2023. [CrossRef]
  70. Davis, T.L.; Dirks, B.; Carnero, E.A.; Corbin, K.D.; Krakoff, J.; Parrington, S.; Lee, D.; Smith, S.R.; Rittmann, B.E.; Krajmalnik-Brown, R.; et al. Chemical Oxygen Demand Can Be Converted to Gross Energy for Food Items Using a Linear Regression Model. J. Nutr. 2021, 151, 445–453. [Google Scholar] [CrossRef]
  71. Zhu, X.; Tao, Y.; Liang, C.; Li, X.; Wei, N.; Zhang, W.; Zhou, Y.; Yang, Y.; Bo, T. The Synthesis of N-Caproate from Lactate: A New Efficient Process for Medium-Chain Carboxylates Production. Sci. Rep. 2015, 5, 14360. [Google Scholar] [CrossRef]
  72. Bowers, R.M.; Kyrpides, N.C.; Stepanauskas, R.; Harmon-Smith, M.; Doud, D.; Reddy, T.B.K.; Schulz, F.; Jarett, J.; Rivers, A.R.; Eloe-Fadrosh, E.A.; et al. Minimum Information about a Single Amplified Genome (MISAG) and a Metagenome-Assembled Genome (MIMAG) of Bacteria and Archaea. Nat. Biotechnol. 2017, 35, 725–731. [Google Scholar] [CrossRef]
  73. Pokusaeva, K.; Fitzgerald, G.F.; Van Sinderen, D. Carbohydrate Metabolism in Bifidobacteria. Genes Nutr. 2011, 6, 285–306. [Google Scholar] [CrossRef] [PubMed]
  74. Zheng, J.; Ruan, L.; Sun, M.; Gänzle, M. A Genomic View of Lactobacilli and Pediococci Demonstrates That Phylogeny Matches Ecology and Physiology. Appl. Environ. Microbiol. 2015, 81, 7233–7243. [Google Scholar] [CrossRef] [PubMed]
  75. Zheng, J.; Wittouck, S.; Salvetti, E.; Franz, C.M.A.P.; Harris, H.M.B.; Mattarelli, P.; O’toole, P.W.; Pot, B.; Vandamme, P.; Walter, J.; et al. A Taxonomic Note on the Genus Lactobacillus: Description of 23 Novel Genera, Emended Description of the Genus Lactobacillus Beijerinck 1901, and Union of Lactobacillaceae and Leuconostocaceae. Int. J. Syst. Evol. Microbiol. 2020, 70, 2782–2858. [Google Scholar] [CrossRef] [PubMed]
  76. Johnson, M.E. Mesophilic and Thermophilic Cultures Used in Traditional Cheesemaking. In Cheese and Microbes; Wiley: Hoboken, NJ, USA, 2014; pp. 73–94. [Google Scholar] [CrossRef]
  77. Gänzle, M.G. Lactic Metabolism Revisited: Metabolism of Lactic Acid Bacteria in Food Fermentations and Food Spoilage. Curr. Opin. Food Sci. 2015, 2, 106–117. [Google Scholar] [CrossRef]
  78. Su, F.; Xu, P. Genomic Analysis of Thermophilic Bacillus Coagulans Strains: Efficient Producers for Platform Bio-Chemicals. Sci. Rep. 2014, 4, 3926. [Google Scholar] [CrossRef] [PubMed]
  79. Chen, Y.; Sun, Y.; Liu, Z.; Dong, F.; Li, Y.; Wang, Y. Genome-Scale Modeling for Bacillus coagulans to Understand the Metabolic Characteristics. Biotechnol. Bioeng. 2020, 117, 3545–3558. [Google Scholar] [CrossRef] [PubMed]
  80. Wang, H.; Gu, Y.; Zhou, W.; Zhao, D.; Qiao, Z.; Zheng, J.; Gao, J.; Chen, X.; Ren, C.; Xu, Y. Adaptability of a Caproate-Producing Bacterium Contributes to Its Dominance in an Anaerobic Fermentation System. Appl. Environ. Microbiol. 2021, 87, e0120321. [Google Scholar] [CrossRef] [PubMed]
  81. Wang, H.; Gu, Y.; Zhao, D.; Qiao, Z.; Zheng, J.; Gao, J.; Ren, C.; Xu, Y. Caproicibacterium lactatifermentans Sp. Nov., Isolated from Pit Clay Used for the Production of Chinese Strong Aroma-Type Liquor. Int. J. Syst. Evol. Microbiol. 2022, 72, 005206. [Google Scholar] [CrossRef] [PubMed]
  82. Gu, Y.; Zhu, X.; Lin, F.; Shen, C.; Li, Y.; Ao, L.; Fan, W.; Ren, C.; Xu, Y. Caproicibacterium amylolyticum Gen. Nov., Sp. Nov., a Novel Member of the Family Oscillospiraceae Isolated from Pit Clay Used for Making Chinese Strong Aroma-Type Liquor. Int. J. Syst. Evol. Microbiol. 2021, 71, 004789. [Google Scholar] [CrossRef]
  83. Brady, C.; Hunter, G.; Kirk, S.; Arnold, D.; Denman, S. Rahnella victoriana Sp. Nov., Rahnella bruchi Sp. Nov., Rahnella woolbedingensis Sp. Nov., Classification of Rahnella Genomospecies 2 and 3 as Rahnella variigena Sp. Nov. and Rahnella inusitata Sp. Nov., Respectiv. Syst. Appl. Microbiol. 2014, 37, 545–552. [Google Scholar] [CrossRef]
  84. Cotta, M.; Forster, R. The Family Lachnospiraceae, Including the Genera Butyrivibrio, Lachnospira and Roseburia. In The Prokaryotes; Springer: New York, NY, USA, 2006; pp. 965–981. [Google Scholar] [CrossRef]
  85. Dwidar, M.; Kim, S.; Jeon, B.S.; Um, Y.; Mitchell, R.J.; Sang, B.I. Co-Culturing a Novel Bacillus Strain with Clostridium tyrobutyricum ATCC 25755 to Produce Butyric Acid from Sucrose. Biotechnol. Biofuels 2013, 6, 35. [Google Scholar] [CrossRef] [PubMed]
  86. Gomes, R.J.; de Fatima Borges, M.; de Freitas Rosa, M.; Castro-Gómez, R.J.H.; Spinosa, W.A. Acetic Acid Bacteria in the Food Industry: Systematics, Characteristics and Applications. Food Technol. Biotechnol. 2018, 56, 139–151. [Google Scholar] [CrossRef] [PubMed]
  87. Gupta, R.S.; Chen, W.J.; Adeolu, M.; Chai, Y. Molecular Signatures for the Class Coriobacteriia and Its Different Clades; Proposal for Division of the Class Coriobacteriia into the Emended Order Coriobacteriales, Containing the Emended Family Coriobacteriaceae and Atopobiaceae fam. nov., and Eggerthellales ord. nov., containing the family Eggerthellaceae fam. nov. Int. J. Syst. Evol. Microbiol. 2013, 63, 3379–3397. [Google Scholar] [CrossRef] [PubMed]
  88. Scholz, C.F.P.; Kilian, M. The Natural History of Cutaneous Propionibacteria, and Reclassification of Selected Species within the Genus Propionibacterium to the Proposed Novel Genera Acidipropionibacterium Gen. Nov., Cutibacterium Gen. Nov. and Pseudopropionibacterium gen. nov. Int. J. Syst. Evol. Microbiol. 2016, 66, 4422–4432. [Google Scholar] [CrossRef] [PubMed]
  89. DeMoss, R.D.; Bard, R.C.; Gunsalus, I.C. The Mechanism of the Heterolactic Fermentation: A New Route of Ethanol Formation. J. Bacteriol. 1951, 62, 499–511. [Google Scholar] [CrossRef] [PubMed]
  90. Zhang, C.; Zhou, C.; Assavasirijinda, N.; Yu, B.; Wang, L.; Ma, Y. Non-Sterilized Fermentation of High Optically Pure d-Lactic Acid by a Genetically Modified Thermophilic Bacillus Coagulans Strain. Microb. Cell Fact. 2017, 16, 213. [Google Scholar] [CrossRef]
  91. Konings, W.N. The Cell Membrane and the Struggle for Life of Lactic Acid Bacteria. Antonie Leeuwenhoek 2002, 82, 3–27. [Google Scholar] [CrossRef] [PubMed]
  92. Vanwonterghem, I.; Jensen, P.D.; Dennis, P.G.; Hugenholtz, P.; Rabaey, K.; Tyson, G.W. Deterministic Processes Guide Long-Term Synchronised Population Dynamics in Replicate Anaerobic Digesters. ISME J. 2014, 8, 2015–2028. [Google Scholar] [CrossRef] [PubMed]
  93. Dini-Andreote, F.; Stegen, J.C.; Van Elsas, J.D.; Salles, J.F. Disentangling Mechanisms That Mediate the Balance between Stochastic and Deterministic Processes in Microbial Succession. Proc. Natl. Acad. Sci. USA 2015, 112, E1326–E1332. [Google Scholar] [CrossRef]
  94. Candry, P.; Chadwick, G.L.; Cara, J.M.; Candry, P.; Chadwick, G.L.; Caravajal-arroyo, J.M.; Lacoere, T.; Winkler, M.H. Trophic Interactions Shape the Spatial Organization of Medium- Chain Carboxylic Acid Producing Granular Biofilm Communities. ISME J. 2023, 17, 2014–2022. [Google Scholar] [CrossRef]
  95. Chwialkowska, J.; Duber, A.; Zagrodnik, R.; Walkiewicz, F.; Łężyk, M.; Oleskowicz-Popiel, P. Caproic Acid Production from Acid Whey via Open Culture Fermentation—Evaluation of the Role of Electron Donors and Downstream Processing. Bioresour. Technol. 2019, 279, 74–83. [Google Scholar] [CrossRef]
  96. Carvajal-Arroyo, J.M.; Candry, P.; Andersen, S.J.; Props, R.; Seviour, T.; Ganigué, R.; Rabaey, K. Granular Fermentation Enables High Rate Caproic Acid Production from Solid-Free Thin Stillage. Green Chem. 2019, 21, 1330–1339. [Google Scholar] [CrossRef]
  97. Crognale, S.; Braguglia, C.M.; Gallipoli, A.; Gianico, A.; Rossetti, S.; Montecchio, D. Direct Conversion of Food Waste Extract into Caproate: Metagenomics Assessment of Chain Elongation Process. Microorganisms 2021, 9, 327. [Google Scholar] [CrossRef]
  98. Liu, B.; Sträuber, H.; Saraiva, J.; Harms, H.; Silva, S.G.; Kasmanas, J.C.; Kleinsteuber, S.; Nunes da Rocha, U. Machine Learning-Assisted Identification of Bioindicators Predicts Medium-Chain Carboxylate Production Performance of an Anaerobic Mixed Culture. Microbiome 2022, 10, 48. [Google Scholar] [CrossRef] [PubMed]
  99. Belenguer, A.; Duncan, S.H.; Calder, A.G.; Holtrop, G.; Louis, P.; Lobley, G.E.; Flint, H.J. Two Routes of Metabolic Cross-Feeding between Bifidobacterium adolescentis and Butyrate-Producing Anaerobes from the Human Gut. Appl. Environ. Microbiol. 2006, 72, 3593–3599. [Google Scholar] [CrossRef] [PubMed]
  100. Ulčar, B.; Regueira, A.; Podojsteršek, M.; Boon, N.; Ganigué, R. Why Do Lactic Acid Bacteria Thrive in Chain Elongation Microbiomes? Front. Bioeng. Biotechnol. 2023, 11, 1291007. [Google Scholar] [CrossRef] [PubMed]
  101. Hayek, S.; Ibrahim, S. Current Limitations and Challenges with Lactic Acid Bacteria: A Review. Food Nutr. Sci. 2013, 4, 73–87. [Google Scholar] [CrossRef]
  102. Kieliszek, M.; Pobiega, K.; Piwowarek, K.; Kot, A.M. Characteristics of the Proteolytic Enzymes Produced by Lactic Acid Bacteria. Molecules 2021, 26, 1858. [Google Scholar] [CrossRef] [PubMed]
  103. Teusink, B.; Molenaar, D. Systems Biology of Lactic Acid Bacteria: For Food and Thought. Curr. Opin. Syst. Biol. 2017, 6, 7–13. [Google Scholar] [CrossRef] [PubMed]
Figure 1. Experimental design outlining bioreactor conditions, replicate experiments, and inoculum source. The original inoculant was sourced twice from an acid-phase digester at the local wastewater treatment plant (Madison, WI, USA) and enriched for 23 days. The enrichment and experimental reactors were continuously stirred chemostats operated with a hydraulic retention time of six days and fed a 1:1 mixture of CAW and UFMP. Numbers in the top right corner of experimental bioreactors refer to their replicate number. The figure was created using Biorender.com.
Fermentation 10 00422 g001
Figure 2. Extracellular concentration of carbohydrates and fermentation products for each bioreactor throughout the 140-day operational period. Each graph displays the data for a single bioreactor with each row of graphs indicating treatment condition and each column of graphs indicating replicate number. The dotted line separates bioreactors from series 1 (left) and series 2 (right). Raw data can be found in Table S6.
Fermentation 10 00422 g002
Figure 3. Average concentration of lactose and selected fermentation products within 12 bioreactors operated at 4 treatment conditions. Values were obtained from 5 time points for each bioreactor spanning the last 42 days of operation during which approximately steady state conditions were achieved for most bioreactors. Error bars represent standard deviation. Each set of three clustered bars represents bioreactors operated under the same conditions with asterisks indicating statistically significant differences between them as assessed using a Welch’s two-sided t-test with a Bonferroni correction for multiple comparisons. A single asterisk (*) indicates p ≤ 0.05, while a double asterisk (**) indicates p ≤ 0.01. R1–R3 indicates replicates 1–3 for a given condition. Raw data are provided in Table S6.
Fermentation 10 00422 g003
Figure 4. (A) Functional classification and relative abundance of MAGs as lactic acid producers, carbohydrate chain elongators, or intermediate chain elongators. Values in the tables show relative abundance (%), determined by mapping of sequence reads of each sample to the 34 representative MAG dataset originating from this study and 167 MAGs from earlier studies [46] that represent additional taxonomic clusters present in the metagenomes (names start with UW_). Blanks represent abundances less than 0.1%. MAGs with no mapped reads are omitted. A1–A3 represent the three replicate bioreactors operated at a pH of 5.5 and 35 °C, while B1–B3 represent those operated at a pH of 5.5 and 50 °C, and S1 and S2 represent the inoculants for series 1 and 2, respectively. Superscripts in each replicate label indicate what series a reactor was from, series 1 or 2. (B). Relative abundance of MAGs within inoculant and bioreactors by functional group classification. For each pair of bars, the left bar includes relative abundance values for the 34 representative MAG dataset originating from this study. The right bar includes relative abundance values for the combined 201 MAG dataset, which includes the 34 representative MAGs from this study plus the 167 MAGs representing other taxonomic clusters derived from other studies [46]. Superscripts in each replicate label indicate what series a reactor was from, series 1 or 2. Horizontal white lines represent delineations between distinct MAGs within a functional guild. Relative abundance of individual MAGs can be found in Tables S8 and S9 for the first and second mappings, respectively.
Fermentation 10 00422 g004
Figure 5. Summed relative abundance of functional groups compared to the concentration of lactic acid accumulated in each bioreactor, represented by the average of the last 42 days of bioreactor operation (Figure 3). Values for lactic acid concentration and relative abundance can be found in Tables S6 and S9, respectively.
Fermentation 10 00422 g005
Figure 6. Presence of homologues of genes relevant to lactic acid fermentation within MAGs from the expanded 201 dataset predicted to be lactic acid producers and above 1% relative abundance in at least one sample. Percentages displayed adjacent to each tile plot represent the proportion of gene homologues that were predicted for each pathway. H, P, and B, represent homolactic fermentation, phosphoketolase pathway, and bifid shunt, respectively. MAGs without the UW_ prefix originate from this study. Gene abbreviations are as follows: HK, hexokinase (EC:2.7.1.1, EC:2.7.1.2, K00844); G6PI, glucose-6-phosphate isomerase (EC:5.3.1.9, K01810); PFK, 6-phosphofructokinase (EC:2.7.1.11, K24182); FBA, fructose-bisphosphate aldolase (EC:4.1.2.13, K01623); TIM, triosephosphate isomerase (EC:5.3.1.1); GAPDH, glyceraldehyde 3-phosphate dehydrogenase (EC:1.2.1.12, K00134); PGK, phosphoglycerate kinase (EC:2.7.2.3, K00927); PGM, phosphoglycerate mutase (EC:5.4.2.11, EC:5.4.2.12, K01834); ENO, enolase (EC:4.2.1.11, K01689); PYK, pyruvate kinase (EC:2.7.1.40, K00873); PTA, phosphate acetyltransferase (EC:2.3.1.8); LDH, L-lactate dehydrogenase (EC:1.1.1.27, K00016) or D-lactate dehydrogenase (EC:1.1.1.28, K03778); ADA, acetaldehyde dehydrogenase (EC:1.2.1.10); ADH, alcohol dehydrogenase/aldehyde reductase (EC:1.1.1.1); FPHK, fructose-6-phosphate phosphoketolase (EC:4.1.2.22); TA, transaldolase (EC:2.2.1.2); TK, transketolase (EC:2.2.1.1); R5PI, ribose-5-phosphate isomerase/phosphopentosisomerase (EC:5.3.1.6); R5PE, ribulose-phosphate 3-epimerase (EC:5.1.3.1); PKT, phosphoketolase (EC:4.1.2.9); G6PD, glucose-6-phosphate dehydrogenase (EC:1.1.1.49, EC:1.1.1.363); PGL, 6-phosphogluconolactonase (EC:3.1.1.31); PGD, phosphogluconate dehydrogenase (EC:1.1.1.351, EC:1.1.1.43, EC:1.1.1.44). See also Table S5.
Fermentation 10 00422 g006
Table 1. Characteristics of the UFMP and CAW substrate mixture.
CharacteristicValue a
Total chemical oxygen demand (g COD/L)63 ± 2 (n = 4)
Soluble chemical oxygen demand (g COD/L)64 ± 2 (n = 4)
Lactose (g COD/L)52 ± 3 (n = 4)
Lactic acid (g COD/L)3 ± 0 (n = 4)
Total soluble protein (g COD/L) b4 ± 0 (n = 5)
Total nitrogen (mg/L)680 ± 10 (n = 5)
pH4.93 ± 0.02 (n = 3)
a Values expressed as mean ± standard deviation of n measurements, with n shown in parenthesis. b For the estimation of the COD equivalence of protein measurements, an average of 1.43 g COD per g protein was used [70].
Table 2. Taxonomy, accession numbers, genomic features, and quality statistics of the 34 representative MAGs recovered from the inoculants and experimental bioreactors.
MAG IDPhylum aClassification aReference Genome aANI aQuality bCompleteness c (%)Contamination c (%)MAG Size c (bp)Contigs cN50 c (bp)%GC cNCBI Genome Accession NumberReactor of Origin d
ATO1ActinomycetotaTractidigestivibacter scatoligenesGCF_001494635.10.9565MQ98.3902,241,33540140,86262.75GCA_036454705.1A2
ATO2ActinomycetotaUBA7741N/AN/AMQ98.390.272,092,2406345,27069.72GCA_036454645.1S2
ATO3ActinomycetotaUBA7748 sp900314535GCA_900314535.10.9723MQ95.970.812,022,2296934,98860.23GCA_036454665.1B1
ATO4ActinomycetotaOlegusella sp002407925GCA_002407925.10.9865MQ80.6501,498,3458252,91255.53GCA_036454505.1A1
COR1ActinomycetotaCAIFEU01 sp903789505GCA_903789505.10.9735MQ95.161.412,881,08338127,57369.49GCA_036453905.1S1
EGG1ActinomycetotaCAIFEB01 sp903789375GCA_903789375.10.9674MQ97.902,264,1176344,45864.89GCA_036453845.1S2
BIF1ActinomycetotaBifidobacterium mongolienseGCF_000741285.10.9757MQ99.731.142,108,75871,311,66863.18GCA_036454425.1B3
BIF2ActinomycetotaBifidobacterium crudilactisGCF_000738005.10.9749HQ99.082.122,461,6457508,63857.61GCA_036454125.1B3
BIF3ActinomycetotaBifidobacterium subtileGCF_000741775.10.9894MQ99.442.732,748,13116283,46461.21GCA_036454005.1B1
BIF4ActinomycetotaBifidobacterium thermophilumGCA_000771265.10.9551MQ1000.152,049,27227111,91760.52GCA_036453945.1A2
BIF5ActinomycetotaBifidobacterium sp022649135GCA_022649135.10.9934MQ98.311.532,450,0114195,36661.5GCA_036453965.1A1
PROP1ActinomycetotaAcidipropionibacterium acidipropioniciGCF_001441165.10.9883MQ10003,480,40129187,53368.94GCA_036452805.1A3
LAC1BacillotaLactobacillus delbrueckiiGCF_001433875.10.9759MQ95.7801,796,9835445,73250.08GCA_036453405.1A1
LAC2BacillotaLactobacillus absianaGCA_017309015.10.9782MQ79.990.971,391,8657519,35252.73GCA_036455685.1A1
LAC3BacillotaLactobacillus amylovorusGCF_002706375.10.9756MQ79.280.091,343,1057321,95338.61GCA_036453345.1A1
LACCAS1BacillotaLacticaseibacillus paracaseiGCF_000829035.10.9836HQ99.4602,787,64839102,06546.5GCA_036453305.1A3
LACCAS2BacillotaLacticaseibacillus rhamnosusGCF_900636965.10.9749MQ80.9802,071,04423132,81446.82GCA_036453285.1B1
LEUC1BacillotaLeuconostoc gelidumGCF_000166715.10.9875MQ99.440.191,870,6468442,93936.63GCA_036453045.1B2
LEUC2BacillotaLeuconostoc mesenteroidesGCF_000014445.10.9903MQ10001,800,5272492,86237.7GCA_036452885.1A2
LENLAC1BacillotaLentilactobacillus sunkiiGCF_001435575.10.966MQ98.8902,748,55725142,53042.13GCA_036453105.1B1
STREP1BacillotaLactococcus lactisGCF_900099625.10.9846MQ1000.282,510,06020233,86434.87GCA_036452675.1A2
STREP2BacillotaLactococcus cremorisGCF_001591705.10.9826MQ85.850.381,744,2745636,77835.7GCA_036452495.1B1
BACIL1BacillotaWeizmannia coagulansGCF_000290615.10.9832MQ91.6102,447,3347048,54447.87GCA_036454485.1B2
ERY1BacillotaBulleidiaN/AN/AMQ96.190.452,113,6695950,39347.89GCA_036453465.1A2
ERY2BacillotaBulleidia sp900319505GCA_900319505.10.9523MQ92.520.321,691,1236630,47847.86GCA_036453425.1S1
LCO1Bacillota ABilifractor sp900319355GCA_900319355.10.9934MQ97.130.322,309,7954080,51352.52GCA_036453235.1S2
LCO2Bacillota ACAG-791 sp900315055GCA_900315055.10.9889MQ94.910.42,906,08710637,63355.88GCA_036453225.1A2
LCO3Bacillota ABilifractorN/AN/AMQ91.561.272,395,18417174,31850.59GCA_036453165.1S1
LCO4Bacillota AUBA1066N/AN/AMQ89.8102,176,4316754,45555.06GCA_036453195.1A2
ACUT1Bacillota ACaproicibacterium sp022483045GCA_022483045.10.9999MQ82.5501,598,5642286,10451.34GCA_036454745.1A3
ACUT2Bacillota ACaproicibacterium sp902809935GCA_902809935.10.9948MQ82.70.341,580,4638222,59542.65GCA_036454725.1S2
ENTER1PseudomonadotaRahnella inusitataGCF_003263515.10.9896MQ98.030.085,063,486102,624,76053.06GCA_036453825.1S2
ACET1PseudomonadotaAcetobacter sp012517935GCA_012517935.10.958MQ1000.252,793,54128121,03553.7GCA_036452275.1A2
PSEU1PseudomonadotaPseudomonas E helleriGCF_001043025.10.9728MQ75.7905,159,29213153,20358.58GCA_036452715.1S2
A1–A3 represent the three replicate bioreactors operated at a pH of 5.5 and 35 °C, while B1–B3 represent those operated at a pH of 5.5 and 50 °C, and S1 and S2 represent the inoculants for series 1 and 2, respectively. See also Table S1. a Taxonomy was assigned using GTDB-Tk tool and database [42], with the reference genomes representing the closest representative genome within the GTDB to a given MAG, if available. N/A indicates that the MAG did not match a reference genome. ANI values represent the average nucleotide identity between each MAG and its reference genome, as calculated with the GTDB-Tk tool, indicating their genomic similarity. b Quality assignments are based on minimum information about a metagenome-assembled genome (MIMAG) standards [72]. HQ indicates a high-quality genome that has >90% completeness, <5% contamination, and encodes 23S, 16S, and 5S rRNA genes and tRNAs for at least 18 of the 20 possible amino acids. MQ indicates a medium-quality genome that has >50% completeness and <10% contamination. c Quality statistics were determined with CheckM [43]. d Reactor of origin indicates the bioreactor or inoculant from which the representative MAG was constructed.
Disclaimer/Publisher’s Note: The statements, opinions and data contained in all publications are solely those of the individual author(s) and contributor(s) and not of MDPI and/or the editor(s). MDPI and/or the editor(s) disclaim responsibility for any injury to people or property resulting from any ideas, methods, instructions or products referred to in the content.

