Abstract
In three consecutive experiments, natural yogurt (NY) and fruit yogurt (FY) fortified with 5 and 10% skimmed milk powder (SMP) and 10% jam from black currant (BC), elderberry (EB), and their mixture of 1:1 (BCEB) were analyzed, and consumer acceptance was assessed. In Experiment 1, the effect of SMP (0, 5, and 10%) on selected physicochemical parameters of the NY was evaluated. With the increasing addition of SMP, a decrease in fat content (up to −19%) and, conversely, an increase in protein content (up to +82%) and viscosity were noted. Analyses of fruits and jams intended for yogurt fortification revealed a significantly higher vitamin C content in BC than in EB and higher anthocyanins in EB than in BC. In Experiment 2, NY with 5 and 10% SMP was fortified with 10% jams (BC or EB). A joint effect of SMP and the type of fruit jam was evaluated. The same trends in fat and protein contents as in Experiment 1 were detected. The sensory evaluation showed better acceptance of FY with 10% SMP and no differences between BC and EB perception. Thus, for Experiment 3, FY was prepared with only 10% SMP and 10% jam (BC, EB, BCEB). Significant differences were detected in active acidity and color measured in the CIELab system. These results were also confirmed in sensory evaluation. The overall acceptability showed that FY with different types of jam did not significantly differ. The launching of innovative fortified yogurt onto the market represents a promising way to increase the diversity of fermented dairy products with nutritionally desirable properties.
1. Introduction
Milk and dairy products supply a range of crucial nutrients, some especially important at certain life stages. The low consumption of milk and dairy products may lead to nutritional deficiencies, particularly in infants, adolescents, pregnant women, or the elderly [1]. Yogurt is one of the most suitable dairy products and can be considered a functional food [2]. Yogurt is an excellent source of essential amino acids of high biological quality, minerals (calcium, magnesium, and zinc), and vitamins (B vitamins and D). Yogurt contains the viable microorganisms Lactobacillus delbrueckii subsp. bulgaricus and Streptococcus salivarius subsp. thermophilus, which may eventually be supplemented with other probiotics to enhance the gut microbiota [3,4,5]. Yogurt is the most popular dairy product, and its consumption increases every year. The yogurt market is expected to continue to grow [6]. Consumers’ increased interest in yogurt is also due to its wide availability on the market and constant innovations in this sector [7,8].
The enhancement of yogurt with additional nutrients, biologically active substances, or various ingredients is an important process for further increasing the quality of yogurt [3,9]. Recently, products with increased protein content, which are suitable not only for athletes, have become very popular [1,10,11,12]. Different technologies (e.g., membrane separation, centrifugation, and desorption) or the direct addition of proteins before fermentation can be used to obtain protein-rich yogurt [12,13]. The last mentioned method, where skimmed milk powder (SMP) or other protein concentrates are added to milk, is the most widely used, simple, and relatively cheap [14,15]. Milk proteins, especially whey proteins, are considered high quality, are digested very quickly, and effectively stimulate muscle protein synthesis in older people [16,17]. Moreover, the addition of SMP positively affects yogurt’s consistency and organoleptic properties [12,18].
The traditional method of yogurt fortification is the addition of fruit products (jams, jelly, or dried fruit). Small fruit, such as berries, is very often used for these purposes [19]. The black currant (BC; Ribes nigrum L.) and elderberry (EB; Sambucus nigra L.) are two kinds of small fruits with an exceptionally high potential for yogurt fortification because of their color, taste, and favorable composition. Both fruits have an intense aroma and are used as appropriate materials for producing jams, jellies, syrups, juices, and cordials [20,21,22]. BC and EB contain anthocyanins, flavonoid glycosides, phenolic acids, and vitamins B and C. According to many publications, all these compounds are powerful antioxidants [23,24]. Strong anti-inflammatory, antiviral, and antibacterial properties have been reported for both fruits [22,25].
Polyphenols are absent in dairy products because animals cannot synthesize them. They are exclusively of plant origin [26]. Thus, the fortification of dairy products with plant-based compounds is highly desirable [19,21,27]. Combining yogurt and BC and EB may represent a new option in formulating fruit-enriched fermented dairy products.
Therefore, the aim of this work was (i) to compare the selected physicochemical properties of natural yogurt (NY) enriched with SMP and (ii) to compare the selected physicochemical and organoleptic properties of fruit yogurt (FY) enriched with SMP and jam from BC, EB, or their mixture (BCEB).
To our knowledge, relatively few publications deal with this topic, e.g., BC [27,28] and EB [29,30], and no publications on the mixture of these fruits. A new aspect of this study can also be seen in the testing of yogurt acceptability by simultaneously two panels of evaluators (experienced and trained). This ensured the evaluation of the new product by both experienced evaluators and consumers of such dairy products.
2. Materials and Methods
In the three consecutive experiments, yogurt samples were prepared under laboratory conditions (Table 1). Raw bulk cow milk, different amounts of SMP, and various jams from small fruits were used for yogurt preparation.

Table 1.
Designation and number of analyzed natural and fruit yogurt samples without and with skimmed milk powder (SMP) in all experiments (n = 4; in each group).
2.1. Characteristics of Materials
2.1.1. Raw and Pasteurized Milk and SMP
Raw milk was pasteurized (72 °C; 20 s), cooled, and enriched with 5 and 10% SMP, depending on the experiment (see Table 1). Additions of 5 and 10% SMP were chosen based on our previous experiments (unpublished data). The composition of the raw and pasteurized milk samples is given in Table 2.
Table 2.
Composition of raw and pasteurized milk samples enriched by different amounts of skimmed milk powder (SMP) used for the preparation of yogurts *.
The chemical composition of the SMP was analyzed by the dairy company supplier: fat content, 0.30 g/100 g; protein content, 34.30 g/100 g; lactose content, 50.0 g/100 g; water content, 3.53 g/100 g; and pH value, 6.54.
2.1.2. Fruit Collection
The fruits (BC and EB) were collected from Lhenice, Czech Republic. Both fruits were ripe for consumption. BC (variety Wellington) was obtained from a small local grower and was harvested in July 2021; EB was collected from wild bushes in August 2021. Before the production of jams, the small fruits were frozen at −16 °C until the time of jam preparation (See Section 2.2.2).
2.2. Preparation
2.2.1. Yogurt Samples
Pasteurized milk was cooled to approximately 45 °C. After cooling, a selected amount of SMP (5 and 10%) was added to the relevant NY samples and mixed thoroughly. In Experiment 1, the control NY sample was without SMP (0%). In the next step, the yogurt starter culture was added in the amount recommended by the manufacturer (5 mL per 100 mL of milk). The starter culture (YC-380, Christian Hansen, NOVONESIS, Lyngby, Denmark) contains Streptococcus salivarius subsp. thermophilus and Lactobacillus delbrueckii subsp. bulgaricus. After fermentation (3.5 h at 42 °C), the yogurt was cooled to approximately 4 °C. The fermentation was stopped based on the fermentation time according to ON 57 0534 [31] to ensure identical conditions for all samples.
In Experiments 2 and 3, NY samples were produced as in Experiment 1. Each sample of NY was used to produce FY samples by thoroughly mixing NY samples (after fermentation and cooling) with 10% fruit components. An overview of all experiments is shown in Table 1.
2.2.2. Jam Samples
One kg of each type of fruit (BC and EB) and one kg of a mixture of both types of fruit in a 1:1 ratio (BCEB) were used to produce jam. The fruit was blended to a fine pulp for 5 min with a stick blender. The weighed pulp was mixed with the same amount of sucrose, 1% (m/m) citric acid, and 0.5% pectin. The mixture was boiled for 5 min with constant stirring. The jam was then divided into sterile glass containers and closed with a lid. The final product was stored at 6 °C.
2.3. Analysis of Milk and Yogurt Samples
2.3.1. Raw and Pasteurized Milk Samples
Milk composition (fat, crude protein, casein, lactose (as monohydrate), and solids-not-fat contents), freezing point depression, and somatic cell counts were determined by mid-infrared spectroscopy (by filter technology and by Fourier data transformation technology). The analysis was performed with a Combi Foss FT 6000 instrument (Foss Electric, Hillerød, Denmark), which consists of a MilkoScan 6000 analyzer and a Fossomatic 5000 flow cytometer.
2.3.2. Yogurts
All analyses of yogurt samples were performed 24 h after their production.
The chemical composition (fat, protein, total solids, and total saccharide contents) was measured by near-infrared spectroscopy with Fourier transformation (NIR MasterTM N500; Büchi, Flawil, Switzerland) with NIRWare version 1.5 according to the manufacturer’s instructions. The application Yogurt-12-16 version 1 was used. Approximately 30 g of sample was put into a Petri dish and analyzed.
The active acidity was measured by a pH meter with a combined electrode (Fisher Scientific, Pardubice, Czech Republic) and expressed in pH units.
The titratable acidity was measured only in NY samples according to the Soxhlet–Henkel method and expressed in SH units (mL of 0.25 M NaOH required to titrate 100 g of yogurt to a standard pink color) and in mmol/L according to the equation:
where SH = SH units, and 2.5 = coefficient. After the indicator phenolphthalein was added, NY samples (10 g) were titrated with 0.25 M NaOH solution. The results were then converted to represent results for 100 g of sample.
Titratable acidity (mmol/L) = SH × 2.5,
The viscosity was measured with a HAAKE Viscotester 6L/R plus viscometer (Thermo Electron (Karlsruhe) GmbH, Karlsruhe, Germany) with an R5 spindle at 50 rpm and a sample temperature of 20 ± 2 °C (R4 for a sample containing 5% SMP).
The color was measured with a ColorEye XTH spectrophotometer (Gretag Macbeth, New Windsor, NY, USA) in 50 g of sample. The results are expressed on the L* (lightness), a* (redness), and b* (yellowness) scale.
Enumeration of lactic acid bacteria in NY samples was performed using the standard plate method. A ten-fold series dilution was prepared using 10 g of sample and 0.9% sterile saline solution. For the enumeration of bacteria, 1 mL of aliquot was inoculated on MRS agar for Lactobacillus delbrueckii subsp. bulgaricus (incubated anaerobically at 37 °C 48 h) and on M17 agar for Streptococcus salivarius subsp. thermophilus (incubated aerobically at 37 °C 48 h). The results were expressed as logarithm of colony forming units per gram of sample (log CFU/g) [32].
Selective volatile compounds (acetoin, acetone, diacetyl, and heptanone) were isolated by the solid-phase microextraction technique and analyzed by gas chromatography/mass spectrometry at the Institute of Milk, Fats, and Cosmetics of the University of Chemistry and Technology in Prague [33]. The volatile compounds were determined only in NY samples.
Fruit jams were added after the fermentation of NY samples, so we did not assume the effect of the fruit component on yogurt starters and volatile compounds.
2.3.3. Jams
The determination of vitamin C content was based on the method described in Begum and Harikrishna [34] and was slightly modified. The content of L-ascorbic acid was determined after extraction from the samples with 0.02 M oxalic acid and 0.5 mM EDTA to prevent analyte loss. One g of sample was extracted with 50 mL of extraction agent for 30 min. The mixture was centrifuged (Sigma Laborzentrifugen GmbH, Osterode am Harz, Germany) at 3500 rpm for 10 min (1800× g), and the supernatant was separated into a 50 mL volumetric flask. Before chromatographic analysis, the sample was filtered with a glass fiber filter (Z7). The HPLC procedure was carried out on an Agilent 1200 instrument with an Agilent SB-C8 column (150 × 4.6 mm, 5 μm) (Agilent Technologies, Inc., Santa Clara, CA, USA). The mobile phase was 0.02 M oxalic acid at a constant flow rate of 1 mL/min for 15 min at a temperature of 25 °C. The sample volume was 5 µL, and L-ascorbic acid was detected at 254 nm. The quantification was performed with a standard curve. Chromatographic data were analyzed using ChemStation software (Agilent Technologies, Santa Clara, CA, USA; Agilent ChemStation for LC 3D systems) and MS Excel tools (MS Excel 2002 (10.2701.2625)). The limit of quantification (LOQ) was 5 mg of L-ascorbic acid in the fresh weight (FW); the working range was 5–100 mg of L-ascorbic acid in the FW.
The monomeric anthocyanin content was determined according to the pharmacopeial method [35]. Briefly, 5 g of sample was extracted with methanol for 30 min on a shaker (LT2, Kavalier, Sázava, Czech Republic). The mixture was centrifuged (Sigma Laborzentrifugen GmbH, Osterode am Harz, Germany) at 3500 rpm for 10 min (1800× g), and the supernatant was separated into a 100 mL volumetric flask. The obtained solution was diluted fifty times with a solution of HCl/methanol (0.1%, v/v). The filtered samples (glass filter, Z7, Filpap, Štětí, Czech Republic) were measured on a photometer (Lightwave II, WPA, Biochrom Ltd., Cambridge, UK) at 520 nm. The total content of monomeric anthocyanins was expressed as the content of cyanidin-3-O-D-glucoside and was calculated according to the following equation:
where A = absorbance (at 528 nm), 718 = specific absorptivity of cyanidin-3-O-D-glucoside, m = sample weight, 5000 = dilution factor, and Z = dilution factor 1.
Monomeric anthocyanin content (g/100 g FW) = (A × 5000)/(718 × m) × Z,
The total polyphenol content (TPC) was determined by the modified Folin–Ciocâlteu method according to Lachman et al. [36]. The homogenized samples were extracted with 80% aqueous ethanol solution at a ratio of 1:10 (sample: solvent) for 23 h at room temperature. The samples were subsequently extracted in an ultrasonic bath for one hour and then centrifuged (ROTINA420/420R, Hettich Instruments, Beverly, MA, USA) at 4500 rpm for 10 min (4075× g). The supernatant was collected and stored in 2 mL microcentrifuge tubes in a freezer. To prepare the reaction mixture, 10 μL of extract was mixed with 990 μL of deionized H2O, and then 50 μL of Folin–Ciocâlteu phenol reagent was added. Within 8 min of mixing with the reagent, 150 µL of 20% sodium carbonate was added, and the samples were then incubated at room temperature for 120 min. Absorbance was measured at λ = 765 nm with a BioMate 5 UV–Vis spectrophotometer (Thermo Electron Corporation, Waltham, MA, USA). A standard calibration curve was evaluated using gallic acid at concentrations ranging from 0 to 2000 µg/mL. The TPC was expressed as milligrams of gallic acid equivalents per 100 g of FW (mg GAE/100 g FW). Two independent samples from each treatment group were collected, and each sample was analyzed in duplicate (n = 4). The final mixed mixture was used as a blank.
The antioxidant activity was determined by the modified DPPH (2,2-diphenyl-1-picrylhydrazyl) and ABTS (2,2′-Azino-bis(3-ethylbenzothiazoline-6-sulfonic acid) diammonium salt) method according to Šulc et al. [37]. The third assay for antioxidant activity was the FRAP (ferric reducing antioxidant potential) method, performed according to Dudonné et al. [38]. For the antioxidant activity assays, samples were prepared using the same procedure as for determining TPC. The antioxidant activity was expressed for all methods as the ascorbic acid equivalent in mg per 100 g fresh weight (mg AAE/100 g FW). Two independent samples from each treatment group were collected and analyzed in duplicate (n = 4).
A stock solution of the stable free radical DPPH was prepared by dissolving 25 mg of the radical in 100 mL of methanol. The working solution was prepared by diluting the stock solution with pure methanol to achieve an absorbance of 0.800 ± 0.01 (λ = 515 nm) with a BioMate 5 UV–Vis spectrophotometer (Thermo Electron Corporation, Waltham, MA, USA). A total of 25 µL of the sample was added to 975 µL of DPPH working solution. The absorbance of the samples was determined at λ = 515 nm after 30 min of incubation at room temperature. Pure methanol was used as a blank.
The ABTS free radical stock solution was prepared by dissolving 54.8 mg of radical and 1.0 g of MnO2 in 20 mL of deionized water. The filtered solution (PTFE 0.25 μm) was diluted in 5 mM phosphate buffer (pH 7.4) to an absorbance of 0.800 ± 0.01 at λ = 734 nm. The absorbance of the reaction mixture was measured at λ = 734 nm 1 min after adding 100 μL of the sample extract to 1 mL of the radical solution. Finally, 5 mM phosphate buffer was used as a blank.
The working solution for the FRAP assay was prepared by mixing 10 volumes of 300 mM acetate buffer (pH = 3.6) with 1 volume of 10 mM of TPTZ (2,4,6-tri(2-pyridyl)-s-triazine) in 40 mM of hydrochloric acid and 1 volume of 20 mM of ferric chloride. To 1.5 mL of FRAP, 50 μL of a working solution was added. The reaction mixture was incubated for 30 min at 37 °C. After the incubation, the absorbance was measured at λ = 593 nm. The acetate buffer was used as a blank.
2.4. Sensory Analysis
In Experiments 2 and 3, sensory analysis was performed at the Department of Food Biotechnologies and Agricultural Products’ Quality, Faculty of Agriculture and Technology, University of South Bohemia in České Budějovice (Czech Republic), which is familiar with sensory evaluation. The characteristics of the sensory assessors are shown in Table 3. In Experiment 2, the sensory profile of FY samples with different SMP contents (5 and 10%) and with two types of jam (BC and EB) was determined by the experienced panel. In Experiment 3, the sensory profile of FY samples with 10% SMP and three types of jam (BC, EB, BCEB) was determined by two panels (experienced and trained).
Table 3.
Characteristics of participants at sensory analysis in Experiments 2 and 3 *.
The sensory evaluation of the samples was performed according to the requirements of ISO standards [39,40]. The yogurt samples (four in Experiment 2 and three in Experiment 3, each weighing 20 g) were coded with three-digit numbers and served (~10 °C) in glass cups simultaneously. The assessors were asked to rate the color, aroma, consistency, taste, sour taste intensity, sweet taste intensity, and fruit taste intensity of the yogurt samples by a 10 cm structured scale (10 = extremely like, very strong, highly consistent; 0 = extremely dislike, not perceptible, not consistent). Sensory analysis was conducted at room temperature (~22 °C), and daylight-type bulbs were used for balanced light. Water and white bread were provided to rinse the mouth between the evaluation of the tested samples to avoid carryover effects.
2.5. Statistical Analysis
For statistical evaluation, Statistica 12.0 software (StatSoft CR s.r.o., Prague, Czech Republic) was used. The assumption of using parametric methods (normality of the data and homogeneity of variances) was made for the dataset.
One-way analysis of variance followed by Tukey’s HSD test for group comparisons (post hoc tests) was used to determine the effects of (i) the addition of SMP (0, 5, and 10%) on selected parameters of NY samples (Experiment 1); (ii) the type of small fruit (BC, EB, BCEB) on selected parameters of jams; and (iii) the type of small fruit (BC, EB, BCEB) on selected parameters of FY samples (Experiment 3). For the effect of the type of fruit (BC, EB) on the selected parameters of the fruit, the Student’s t test was used.
A general linear model was used for a joint assessment of SMP and fruits on selected parameters of FY samples (Experiment 2) according to the following model:
where Yijk = dependent variables (active acidity; fat, protein, total solids, and total carbohydrate content (g/100 g)); color coordinates (L*, a*, b*); sensory descriptors); μ = mean; SMPi = the addition of SMP (i = 2; 5, and 10%); SFj = the type of small fruit (j = 2; BC = black currant, EB = elderberry); and εijk = residual error. Tukey’s HSD test was used for group comparisons (post hoc tests).
Yijk = μ + SMPi + SFj + (SMP × SF)ij + εijk,
3. Results and Discussion
3.1. Properties of Natural Yogurts
Dried dairy products (milk, buttermilk, whey, milk protein concentrates, and whey protein concentrates) are recommended as interesting food supplements because of their protein content [41]. SMP is usually used to enrich milk intended for yogurt production before fermentation. The purpose is to increase nutritional value and improve rheological and organoleptic properties [42].
In Experiment 1, NY was prepared from milk with 0, 5%, or 10% SMP (Table 4). Additions of 5 and 10% SMP were chosen based on our previous experiments (unpublished data). A significant effect of SMP addition on yogurt acidity (active and titratable) was observed (p < 0.05; p < 0.001). The results revealed a decrease in active acidity (an increase in pH value from 4.25 to 4.42) and an increase in titratable acidity (from 40.7 SH to 71.5 SH) with the increasing SMP content. A similar trend was reported by Damin et al. [15] and Souza et al. [18]. Comparatively, the pH value can also be affected by other protein supplements. For example, Bong and Moraru [43] confirmed an increase in pH after adding micellar casein concentrate.
Table 4.
Selected parameters of natural yogurts enriched with 5 and 10% skimmed milk powder (SMP) and a control group without SMP (0%)—Experiment 1 *.
According to Tamime and Robinson [44], titratable acidity increases due to the increasing content of solids-not-fat/total solids. It mainly results from the buffering action of the proteins, phosphates, citrates, and other milk constituents. On the other hand, the relationship between titratable acidity and pH is more complex regarding the buffering system in yogurt.
While the fat content decreased significantly with the addition of SMP (from 3.58 to 2.89 g/100 g, i.e., a 19% reduction; p < 0.001), the protein content increased (from 3.50 to 6.36 g/100 g, i.e., an increase of +82%; p < 0.001). The total solids (from 12.12 to 19.15 g/100 g) and viscosity (from 1295 to 4106 mPa·s) also increased (p < 0.001 for both parameters).
Tamime et al. [45] reported substantial changes in the chemical composition of yogurt after the addition of SMP. When the protein and total solids contents increase, the density of the protein network increases, the pores shrink, and thus, the viscosity increases. Damin et al. [15] reported that yogurt with SMP had more pores, of which almost 50% were smaller than 1 µm. The authors found a correlation coefficient of 0.82 between protein content and viscosity.
The consistency is also affected by the heat treatment temperature [46]. The authors noted a greater consistency of yogurt at higher temperatures (90 °C for 1–5 min). In our experiment, the milk was heated only to 72 °C for 20 s. It can be assumed that when higher temperatures are used, the consistency would also be greater.
Increased protein and total solids contents also caused changes in other yogurt properties. Tamime and Robinson [44] and Damin et al. [15] confirmed an improvement in texture at a total solids content of 12–20 g/100 g, and Uduwerella et al. [13] confirmed a reduction in synergy.
The color assessed in the CIELab system showed a slight increase in L*, lightness (black-white) coordinate (p > 0.05), and b*, yellow-blue coordinate (p < 0.01). This was probably caused by the lower fat content and the associated lower content of the beta-carotene pigment. The protein content can also affect the color. Moreover, the results presented by Milovanovic et al. [47] show that the L* and b* values are increasing for milk powder products.
The microorganism counts increased insignificantly in both monitored groups. Thus, the addition of SMP did not affect the amount of viable yogurt counts (107 per g) mandated by Czech Republic legislation, Decree 397/2016 [48]. The desired aroma and flavor of yogurt result from the activity of yogurt bacteria, which influence the variety of volatile compounds and their levels. Only some of them, e.g., acetaldehyde, diacetyl, and 2-butanone, exert a strong influence on the yogurt aroma and are also present in amounts detectable by standard laboratory techniques [49,50]. In our study, four volatile compounds were determined. A significant difference (p < 0.05) was observed except for acetone, mainly between 0% and 10% SMP. A decreasing trend was detected for diacetyl (from 6.27 to 4.30 mg/kg); in contrast, an increasing trend was detected for acetoin (from 144.90 to 268.56 mg/kg). Typical levels of diacetyl and acetoin in yogurt are 0.2–3 mg/kg and 1.2–28.2 mg/kg, respectively. Acetoin, as a diacetyl’s reduced form, is essential for decreasing the sharpness of diacetyl and adds to the pleasant, creamy flavor of yogurt [51].
3.2. Properties of Fruits and Jams
The usual criteria for fruit intended as a flavoring component for yogurt are a pronounced pleasant aroma and taste and a high content of biologically active substances and natural dyes [52,53,54]. These requirements are met by small fruits, especially BC and EB [20,21,22,30]. The selected parameters of the biological value of BC and EB are shown in Table 5.
Table 5.
Total phenolic content (TPC), vitamin C, total anthocyanins, and antioxidant activity (ABTS, DPPH, FRAP) depending on the type of fruits (black currant (BC), elderberry (EB), and BC and EB in a 1:1 ratio (BCEB)) and jams made from these fruits *.
Both types of small fruit used for the fortification of NY yogurt are among the types richest in plant antioxidants [22,25,55,56]. According to the results of analyses of biologically active compounds in all types of jams (BC, EB, BCEB), the products retained a high content of vitamin C and anthocyanins. The contents of both components are comparable to their contents in the study of low-sugar jam from the study by Viberg et al. [57]. Our study shows that the jam with the proposed composition (BCEB) has a much higher total monomeric anthocyanins content than similar elderberry products, as was evaluated in the study by Baeza et al. [58]. Regarding the content of vitamin C and anthocyanins, the jam of the proposed composition is a valuable ingredient suitable for addition to yogurt.
3.3. Properties of Fruit Yogurts
Although yogurt is one of the most consumed foods due to its nutritional value and health benefits [1,3], it does not contain sufficient amounts of essential compounds such as antioxidants [30,59]. This urges efforts to enrich yogurt with plant products that are rich in these substances [19,21,29]. Current studies indicate that adding a fruit component to yogurt considerably improves its quality and health benefits for consumers [52,53]. The selected parameters of yogurt with 5% and 10% SMP and 10% fruit jam (Experiment 2) are shown in Table 6.
Table 6.
Selected parameters of fruit yogurts enriched with 5 and 10% skimmed milk powder (SMP) and with 10% jam from black currant (BC) and elderberry (EB)—Experiment 2 *.
Higher active acidity was found in FY compared to NY (See Section 3.1). Differences were also found in FY depending on the type of fruit jam. Specifically, active acidity was lower in FY with BC jam (4.12 and 4.16 for 5% and 10% SMP, respectively) than in FY with EB jam (4.21 and 4.30). The differences in pH were statistically significant for both the type of fruit and the SMP addition.
It follows from the study by Amal et al. [52] that the active acidity tends to increase (i.e., low pH values) with increasing amounts of fruit in yogurt.
The same trend of fat and protein contents as in NY (See Section 3.1) was also found in FY. The yogurt with 5% SMP (with BC and EB jam) contained more fat (3.91 and 3.39 g/100 g) than the yogurt with 10% SMP (3.63 and 3.22 g/100 g). While the effect of SMP addition on fat content was not confirmed (p = 0.1588), the addition of fruit jam was significant (p = 0.0091). Differences in fat content depending on the fruit type and variety have been reported by other authors [60,61,62]. In general, the fat content of yogurt decreases slightly after fruit jams are added due to the low-fat content of the fruit [30,52].
As expected, the addition of SMP had a statistically significant effect on the protein content (p = 0.0001). The higher the addition of SMP, the higher the protein content of the final product. The protein contents of the BC and EB yogurt samples were 4.79 and 4.22 g/100 g for 5% SMP and 6.21 and 5.80 g/100 g for 10% SMP. A statistically significant effect was observed for the total solid content of yogurt, both for the addition of SMP (p < 0.001) and the type of fruit (p = 0.0306). Compared with NY (See Section 3.1), FY logically presented a significantly greater total solids content. With the increasing addition of SMP, the content of total saccharides in BC and EB yogurt also increased from 12.77 to 15.88 g/100 g and from 13.73 to 15.25 g/100 g (p = 0.0004), respectively.
In color, a statistically significant effect was observed for all values (L*, a* and b*) both for the addition of SMP (p = 0.0013 for L*, <0.001 for a* and p = 0.0044 for b*) and the type of fruit (p < 0.001 for all coordinates).
In the sensory analysis, the experienced assessors also noted differences in color between BC and EB yogurt, although the differences were not statistically significant (Figure 1). As reported by Raikos et al. [27] and Cais-Sokolinska and Walkowiak-Tomczak [29], the color of yogurt is significantly affected by the content of anthocyanins, which was also confirmed in our study, as the contents of anthocyanins in BC and EB differed significantly (Table 5). The assessors also noted differences in the intensity of sour taste (p = 0.0414) and sweet taste (p = 0.0449) when they rated EB yogurt (with 5 and 10% SMP) as the sweetest yogurt and BC yogurt (with 5% SMP) as the sourest yogurt. Logically, the assessors noted the most significant differences in consistency (p < 0.001), in which yogurt with 10% SMP was evaluated as the yogurt with the highest density.
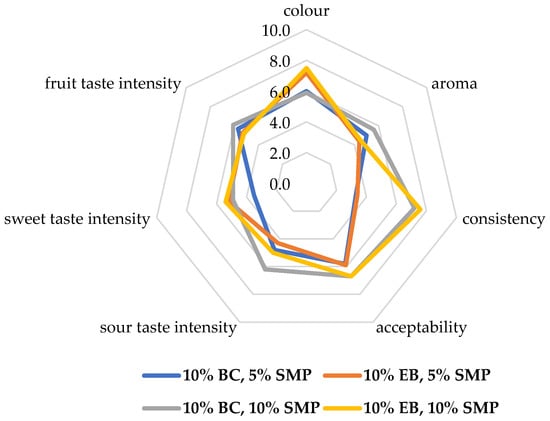
Figure 1.
Sensory profile of fruit yogurts enriched with 5 and 10% skimmed milk powder (SMP) and with 10% jam from black currant (10% BC) and elderberry (10% EB) evaluated by experienced panel—Experiment 2.
Based on the above-mentioned findings from Experiment 1 and Experiment 2, in Experiment 3, yogurt with only 10% SMP was prepared, and the effects of fruit components (BC, EB, and a mixture of BC and EB in a 1:1 ratio) were assessed (Table 7).
Table 7.
Selected parameters of fruit yogurts enriched with 10% skimmed milk powder (SMP) and with 10% jam from black currant (BC), elderberry (EB), and BC and EB in a 1:1 ratio (BCEB)—Experiment 3 *.
The BC yogurt had the lowest value (4.17 pH) of active acidity (i.e., the highest acidity), whereas the EB yogurt had the highest value of active acidity (4.29). Statistically significant differences were found only between the BC and EB yogurt samples, similar to the results of Experiment 2. In terms of the type of fruit jam used, differences in fat, protein, total solids, and total carbohydrate contents were detected but were not significantly different. Najgebauer-Lejko et al. [30] also found that adding fruit jam did not significantly affect the protein content. In the case of color, statistically significant differences were observed in all coordinates between all the FY samples (p < 0.001).
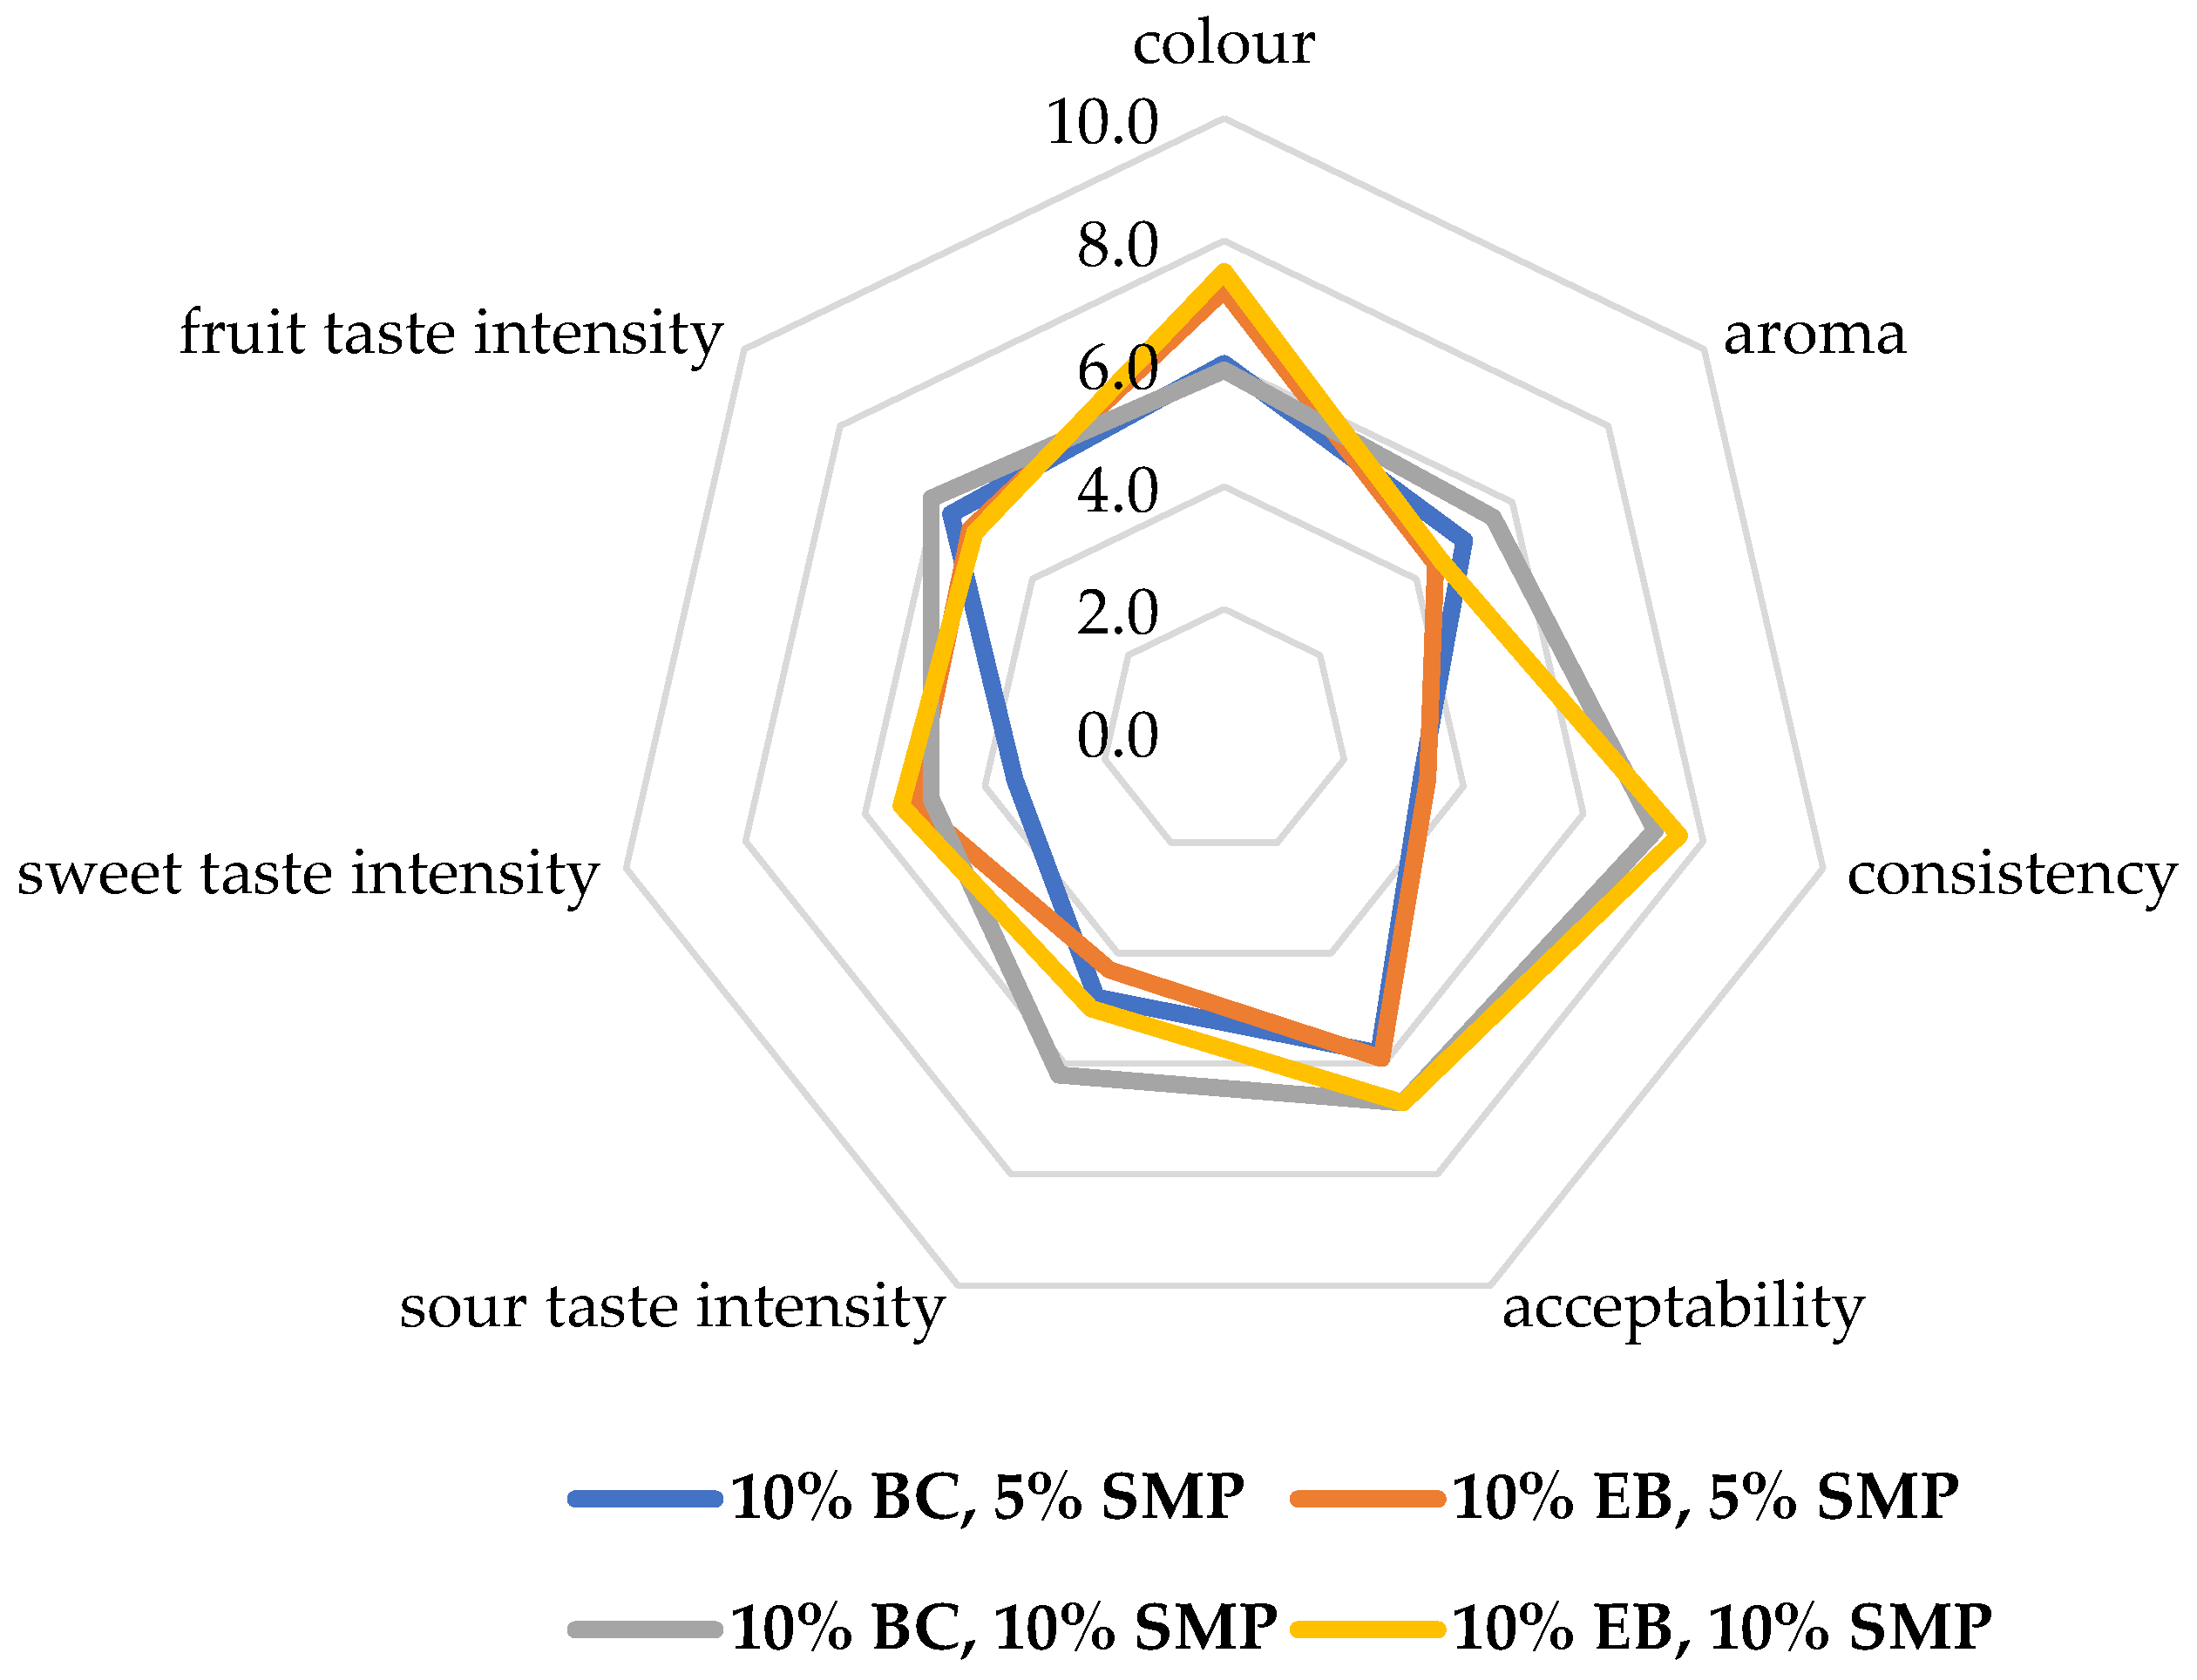
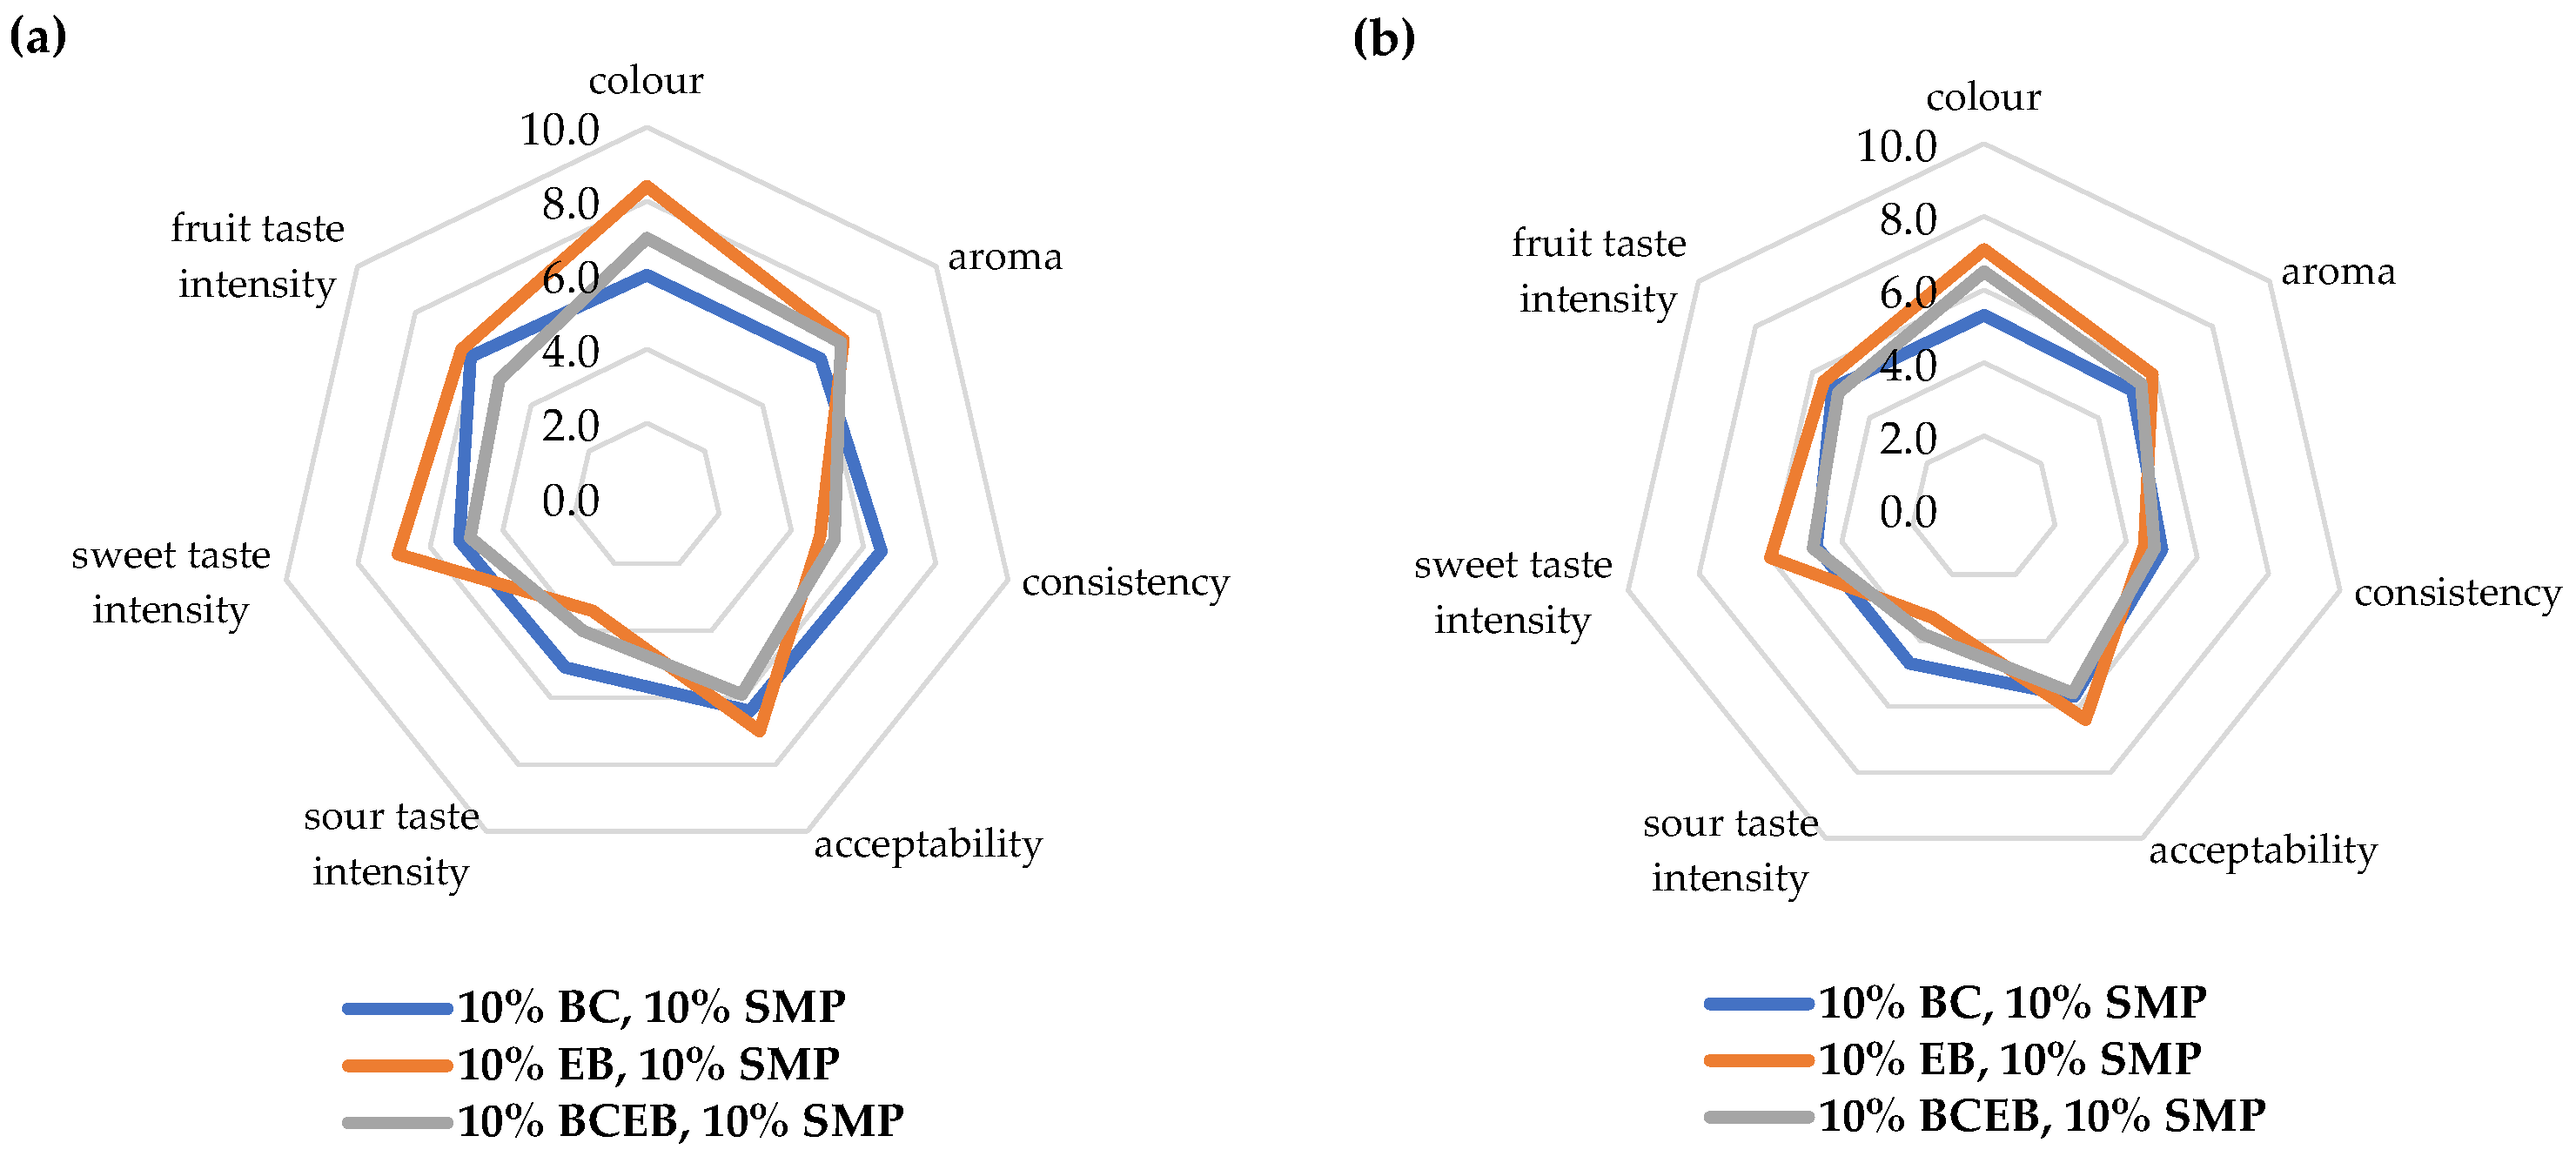
In Experiment 3, sensory evaluation was performed by two panels: experienced and trained (Figure 2a,b). EB yogurt was evaluated as the yogurt with the most acceptable color. In both groups of assessors, statistically significant differences were noted in color. Both groups similarly evaluated the difference in the sweet taste intensity (p < 0.001), and the EB yogurt was evaluated as the sweetest. Trained assessors evaluated the EB yogurt as the yogurt with the most pleasant taste (p = 0.0494). The sour taste intensity was perceived significantly by the trained assessors compared with the experienced assessors (p < 0.001); however, both groups evaluated BC yogurt as the sourest. The experienced assessors noted significant differences in consistency (p = 0.0224) and determined that the BC yogurt had the highest density.

Figure 2.
Sensory profile of fruit yogurts enriched with 10% skimmed milk powder (SMP) and with 10% jam from black currant (BC), elderberry (EB), and BC and EB in a 1:1 ratio (BCEB) evaluated by experienced (a) and trained panels (b) Experiment 3.
Slight differences in the perception of tastes could be caused by the different average ages of the experienced and trained assessors, whereas other important factors influencing the perception and preference of taste may be, for example, the gender or emotional state of the evaluators [63,64,65].
In overall acceptability, no significant differences were found among all types of jam used in FY. The BCEB yogurt was evaluated as acceptable by experienced and trained assessors. Therefore, BCEB jam is a new suitable flavoring ingredient with a more favorable ratio of biologically active substances (vitamin C and anthocyanins) for the final consumer, which can thus improve consumer health.
4. Conclusions
This study evaluated the effect of skimmed milk powder and fruit jam addition on selected physiochemical properties and consumers’ acceptability of yogurt. The addition of 10% skimmed milk powder caused a significant increase in the protein content, total solids content, titratable acidity, and viscosity of natural yogurt. Both types of fruit jam, black currant, and elderberry, were found to have high levels of nutritionally desirable compounds. Therefore, it can be expected that their addition will increase the antioxidant properties of fruit yogurt. In our proposed mixture of fruit jam (black currant and elderberry, 1:1), the benefits of both types of small fruits were favorably combined, i.e., the high vitamin C content in black currant and the high anthocyanins in elderberry. In conclusion, black currant, elderberry, and their mixture have great potential and can meet consumers’ demand for a nutritionally balanced product with health benefits and an attractive taste.
Author Contributions
Conceptualization, S.J.H. and E.S.; methodology, S.J.H., E.S. and E.D.; formal analysis, S.J.H., E.D., L.H., M.J. and K.R.; investigation, S.J.H., E.D., L.H., M.J., K.R. and J.B.; resources, E.S., E.D., L.H. and J.B.; writing—original draft preparation, S.J.H., E.S. and E.D.; writing—review and editing, S.J.H., E.S., E.D. and L.H.; visualization, S.J.H.; supervision, E.S. and J.B.; project administration, S.J.H. and E.S.; funding acquisition, S.J.H., E.S. and J.B. All authors have read and agreed to the published version of the manuscript.
Funding
This research was supported by the projects of the Grant Agency of South Bohemia University in České Budějovice: GAJU 005/2022/Z; GAJU 122/2024/Z; GAJU 096/2021/T.
Institutional Review Board Statement
Not applicable.
Informed Consent Statement
Not applicable.
Data Availability Statement
The raw data supporting the conclusions of this article will be made available by the authors on request.
Conflicts of Interest
The authors declare no conflicts of interest.
References
- Givens, D.I. MILK Symposium review: The importance of milk and dairy foods in the diets of infants, adolescents, pregnant women, adults, and the elderly. J. Dairy Sci. 2020, 103, 9681–9699. [Google Scholar] [CrossRef] [PubMed]
- Hadjimbei, E.; Botsaris, G.; Chrysostomou, S. Beneficial effects of yoghurts and probiotic fermented milks and their functional food potential. Foods 2022, 11, 2691. [Google Scholar] [CrossRef] [PubMed]
- García-Burgos, M.; Moreno-Fernández, J.; Alférez, M.J.M.; Díaz-Castro, J.; López-Aliaga, I. New perspectives in fermented dairy products and their health relevance. J. Funct. Foods 2020, 72, 104059. [Google Scholar] [CrossRef]
- Meybodi, N.M.; Mortazavian, A.M.; Arab, M.; Nematollahi, A. Probiotic viability in yoghurt: A review of influential factors. Int. Dairy J. 2020, 109, 104793. [Google Scholar] [CrossRef]
- Sarkar, S. Potentiality of probiotic yoghurt as a functional food—A review. Nutr. Food Sci. 2019, 49, 182–202. [Google Scholar] [CrossRef]
- Statista. Yogurt—Worldwide. 2023. Available online: https://www.statista.com/outlook/cmo/food/dairy-products-eggs/yogurt/worldwide (accessed on 13 December 2023).
- Rybowska, A.; Gromowska, K. The consumer versus innovative dairy products. Sci. J. Gdyn. Marit. Univ. 2022, 124/22, 81–94. [Google Scholar] [CrossRef]
- Sajdakowska, M.; Tekień, A. To raise or not to raise the level of ingredients in yoghurts: Polish consumer preferences regarding dairy products. Nutrients 2019, 11, 2526. [Google Scholar] [CrossRef]
- Gahruie, H.H.; Eskandari, M.H.; Mesbahi, G.; Hanifpour, M.A. Scientific and technical aspects of yogurt fortification: A review. Food Sci. Hum. Well. 2015, 4, 1–8. [Google Scholar] [CrossRef]
- Gomaa, M.A.E.; Allam, M.G.; Haridi, A.; Eliwa, A.M.; Darwish, A.M.G. High-protein concentrated pro-yogurt (Pro-WPI) enriched with whey protein isolate improved athletic anemia and performance in a placebo-controlled study. Front. Nutr. 2021, 8, 788446. [Google Scholar] [CrossRef] [PubMed]
- Keršienė, M.; Jasutienė, I.; Eisinaitė, V.; Pukalskienė, M.; Venskutonis, P.R.; Damulevičienė, G.; Knašienė, J.; Lesauskaitė, V.; Leskauskaitė, D. Development of a high-protein yoghurt-type product enriched with bioactive compounds for the elderly. LWT-Food Sci. Technol. 2020, 131, 109820. [Google Scholar] [CrossRef]
- Jorgensen, C.E.; Abrahamsen, R.K.; Rukke, E.O.; Hoffmann, T.K.; Johansen, A.G.; Skeie, S.B. Processing of high-protein yoghurt—A review. Int. Dairy J. 2019, 88, 42–59. [Google Scholar] [CrossRef]
- Uduwerella, G.; Chandrapala, J.; Vasiljevic, T. Minimising generation of acid whey during Greek yoghurt manufacturing. J. Dairy Res. 2017, 84, 346–354. [Google Scholar] [CrossRef] [PubMed]
- Ibrahim, A.S.; Saad, M.F.; Hafiz, N.M. Safety and quality aspects of whole and skimmed milk powders. Acta Sci. Polon.-Techn. 2021, 20, 165–177. [Google Scholar] [CrossRef]
- Damin, M.R.; Alcântara, M.R.; Nunes, A.P.; Oliveira, M.N. Effects of milk supplementation with skim milk powder, whey protein concentrate and sodium caseinate on acidification kinetics, rheological properties and structure of nonfat stirred yogurt. LWT-Food Sci.Technol. 2009, 42, 1744–1750. [Google Scholar] [CrossRef]
- Beasley, J.M.; Shikany, J.M.; Thomson, C.A. The role of dietary protein intake in the prevention of sarcopenia of aging. Nutr. Clin. Pract. 2013, 28, 684–690. [Google Scholar] [CrossRef]
- Luiking, Y.C.; Deutz, N.E.P.; Memelink, R.G.; Verlaan, S.; Wolfe, R.R. Postprandial muscle protein synthesis is higher after a high whey protein, leucine-enriched supplement than after a dairy-like product in healthy older people: A randomized controlled trial. Nutr. J. 2014, 13, 9. [Google Scholar] [CrossRef] [PubMed]
- de Souza, W.F.C.A.; do Amaral, C.R.S.; Bernardino, P.D.L.D. The addition of skim milk powder and dairy cream influences the physicochemical properties and the sensory acceptance of concentrated Greek-style yogurt. Int. J. Gastron. Food Sci. 2021, 24, 100349. [Google Scholar] [CrossRef]
- Wajs, J.; Brodziak, A.; Król, J. Shaping the physicochemical, functional, microbiological and sensory properties of yoghurts using plant additives. Foods 2023, 12, 1275. [Google Scholar] [CrossRef]
- Buchweitz, M.; Speth, M.; Kammerer, D.R.; Carle, R. Impact of pectin type on the storage stability of black currant (Ribes nigrum L.) anthocyanins in pectic model solutions. Food Chem. 2013, 139, 1168–1178. [Google Scholar] [CrossRef]
- Nemetz, N.J.; Schieber, A.; Weber, F. Application of crude pomace powder of chokeberry, bilberry, and elderberry as a coloring foodstuff. Molecules 2021, 26, 2689. [Google Scholar] [CrossRef]
- Veberic, R.; Jakopic, J.; Stampar, F.; Schmitzer, V. European elderberry (Sambucus nigra L.) rich in sugars, organic acids, anthocyanins and selected polyphenols. Food Chem. 2009, 114, 511–515. [Google Scholar] [CrossRef]
- Agati, G.; Azzarello, E.; Pollastri, S.; Tattini, M. Flavonoids as antioxidants in plants: Location and functional significance. Plant Sci. 2012, 196, 67–76. [Google Scholar] [CrossRef] [PubMed]
- Kong, J.M.; Chia, L.S.; Goh, N.K.; Chia, T.F.; Brouillard, R. Analysis and biological activities of anthocyanins. Phytochemistry 2003, 64, 923–933. [Google Scholar] [CrossRef]
- Gopalan, A.; Reuben, S.C.; Ahmed, S.; Darvesh, A.S.; Hohmann, J.; Bishayee, A. The health benefits of blackcurrants. Food Funct. 2012, 3, 795–809. [Google Scholar] [CrossRef] [PubMed]
- Hano, C.; Tungmunnithum, D. Plant polyphenols, more than just simple natural antioxidants: Oxidative stress, aging and age-related diseases. Medicines 2020, 7, 26. [Google Scholar] [CrossRef]
- Raikos, V.; Ni, H.; Hayes, H.; Ranawana, V. Antioxidant properties of a yogurt beverage enriched with salal (Gaultheria shallon) berries and blackcurrant (Ribes nigrum) pomace during cold storage. Beverages 2019, 5, 2. [Google Scholar] [CrossRef]
- Sankowski, L.V.; Morales-Medina, R.; Arguello, C.F.; Reibner, A.M.; Struck, S.; Rohm, H.; Drusch, S.; Brückner-Gühmann, M. Thermal-mechanical treatment of blackcurrant pomace for enrichment in yoghurt. Food Hydrocoll. 2024, 146, 109296. [Google Scholar] [CrossRef]
- Cais-Sokolinska, D.; Walkowiak-Tomczak, D. Consumer-perception, nutritional, and functional studies of a yogurt with restructured elderberry juice. J. Dairy Sci. 2021, 104, 1318–1335. [Google Scholar] [CrossRef]
- Najgebauer-Lejko, D.; Liszka, K.; Tabaszewska, M.; Domagala, J. Probiotic Yoghurts with Sea Buckthorn, Elderberry, and Sloe Fruit Purees. Molecules 2021, 26, 2345. [Google Scholar] [CrossRef]
- ON 57 0534; Milk Fermentationability Determination. Standard of Milk Industry: Prague, Czech Republic, 1986. (In Czech)
- ČSN ISO 7889 (571420); Yogurt Enumeration of Characteristic Microorganisms—Colony-Count Technique at 37 °C. Czech Office for Standards, Metrology and Testing: Prague, Czech Republic, 2003. (In Czech)
- Koval, D.; Alishevich, K.; Sasínová, K.; Ramešová, A.; Marhons, Š.; Nešporová, T.; Čurda, L.; Kumherová, M.; Bárta, J.; Filip, V.; et al. Formation of dihydrophenolic acids and aroma-active volatile phenols by new strains of Limosilactobacillus fermentum. Eur. Food Res. Technol. 2022, 248, 599–611. [Google Scholar] [CrossRef]
- Begum, A.; Harikrishna, S. Evaluation of some tree species to absorb air pollutants in three industrial locations of South Bengaluru, India. E-J. Chem. 2010, 7, S151–S156. [Google Scholar] [CrossRef]
- Myrtilli fructus siccum, the content analysis. In Czech Pharmacopoeia; Grada Publishing: Praha, Czech Republic, 2017; p. 4115. (In Czech)
- Lachman, J.; Hosnedl, V.; Pivec, V. Polyphenols in cereals and their positive and negative role in human and animal nutrition. In Cereals for Human Health and Preventive Nutrition; Vaculová, K., Ehrenbergerová, J., Eds.; MZLU: Brno, Czech Republic, 1998; pp. 118–124. [Google Scholar]
- Šulc, M.; Lachman, J.; Hamouz, K.; Orsák, M.; Dvořák, P.; Horáčková, V. Selection and evaluation of methods for determination of antioxidant activity of purple- and red-fleshed potato varieties. Chem. Listy 2007, 101, 584–591. [Google Scholar]
- Dudonné, S.; Vitrac, X.; Coutière, P.; Woillez, M.; Mérillon, J.M. Comparative study of antioxidant properties and total phenolic content of 30 plant extracts of industrial interest using DPPH, ABTS, FRAP, SOD, and ORAC assays. J. Agr. Food Chem. 2009, 57, 1768–1774. [Google Scholar] [CrossRef]
- ČSN ISO 11035 (560061); Sensory Analysis—Identification and Selection of Descriptors for Establishing a Sensory Profile by a Multidimensional Approach. Czech Office for Standards, Metrology and Testing: Prague, Czech Republic, 2003. (In Czech)
- ČSN ISO 4121 (560052); Sensory Analysis—Guidelines for the Use of Quantitative Response Scales. Czech Office for Standards, Metrology and Testing: Prague, Czech Republic, 2009. (In Czech)
- Silva, J.V.C.; O’Mahony, J.A. Flowability and wetting behaviour of milk protein ingredients as influenced by powder composition, particle size and microstructure. Int. J. Dairy Technol. 2017, 70, 277–286. [Google Scholar] [CrossRef]
- Marafon, A.P.; Sumi, A.; Granato, D.; Alcântara, M.R.; Tamime, A.Y.; de Oliveira, M.N. Effects of partially replacing skimmed milk powder with dairy ingredients on rheology, sensory profiling, and microstructure of probiotic stirred-type yogurt during cold storage. J. Dairy Sci. 2011, 94, 5330–5340. [Google Scholar] [CrossRef] [PubMed]
- Bong, D.D.; Moraru, C.I. Use of micellar casein concentrate for Greek-style yogurt manufacturing: Effects on processing and product properties. J. Dairy Sci. 2014, 97, 1259–1269. [Google Scholar] [CrossRef] [PubMed]
- Tamime, A.Y.; Robinson, R.K. Tamime and Robinson’s Yoghurt; Tamime, A.Y., Robinson, R.K., Eds.; Woodhead Publishing: Cambridge, UK, 2007; pp. 1–808. [Google Scholar]
- Tamime, A.Y.; Hickey, M.; Muir, D.D. Strained fermented milks—A review of existing legislative provisions, survey of nutritional labelling of commercial products in selected markets and terminology of products in some selected countries. Int. J. Dairy Technol. 2014, 67, 305–333. [Google Scholar] [CrossRef]
- Remeuf, F.; Mohammed, S.; Sodini, I.; Tissier, J.P. Preliminary observations on the effects of milk fortification and heating on microstructure and physical properties of stirred yogurt. Int. Dairy J. 2003, 13, 773–782. [Google Scholar] [CrossRef]
- Milovanovic, B.; Djekic, I.; Miocinovic, J.; Djordjevic, V.; Lorenzo, J.M.; Barba, F.J.; Mörlein, D.; Tomasevic, I. What is the color of milk and dairy products and how is it measured? Foods 2020, 9, 1629. [Google Scholar] [CrossRef]
- Decree on Requirements for Milk and Dairy Products, Frozen Creams and Edible Fats and Oils. [In Czech]. 2016. Available online: https://faolex.fao.org/docs/pdf/cze174739.pdf (accessed on 30 June 2024).
- Cheng, H. Volatile flavor compounds in yogurt: A review. Crit. Rev. Food Sci. Nutr. 2010, 50, 938–950. [Google Scholar] [CrossRef]
- Sidira, M.; Santarmaki, V.; Kiourtzidis, M.; Argyri, A.A.; Papadopoulou, O.S.; Chorianopoulos, N.; Tassou, C.; Kaloutsas, S.; Galanis, A.; Kourkoutas, Y. Evaluation of immobilized Lactobacillus plantarum 2035 on whey protein as adjunct probiotic culture in yoghurt production. LWT-Food Sci. Technol. 2017, 75, 137–146. [Google Scholar] [CrossRef]
- Krastanov, A.; Yeboah, P.J.; Dulari Wijemanna, N.W.; Eddin, A.S.; Ayivi, R.D.; Ibrahim, S.A. Volatile Aromatic Flavor Compounds in Yogurt: A Review. In Current Issues and Advances in the Dairy Industry; Salam, A.I., Ed.; IntechOpen: Rijeka, Croatia, 2023. [Google Scholar]
- Amal, A.M.N.; Mahmoud, A.M.; Zidan, N.S. Fruit flavored yoghurt: Chemical, functional and rheological properties. Int. J. Envir. Agric. Res. 2016, 2, 57–66. [Google Scholar]
- Jideani, A.I.O.; Silungwe, H.; Takalani, T.; Omolola, A.O.; Udeh, H.O.; Anyasi, T.A. Antioxidant-rich natural fruit and vegetable products and human health. Int. J. Food Prop. 2021, 24, 41–67. [Google Scholar] [CrossRef]
- Shashirekha, M.N.; Mallikarjuna, S.E.; Rajarathnam, S. Status of bioactive compounds in foods, with focus on fruits and vegetables. Crit. Rev. Food Sci. Nutr. 2015, 55, 1324–1339. [Google Scholar] [CrossRef]
- Diviš, P.; Pořízka, J.; Vespalcová, M.; Matějíček, A.; Kaplan, J. Elemental composition of fruits from different black elder (Sambucus nigra L.) cultivars grown in the Czech Republic. J. Elementol. 2015, 20, 549–557. [Google Scholar] [CrossRef]
- Woznicki, T.L.; Heide, O.M.; Sønsteby, A.; Wold, A.B.; Remberg, S.F. Yield and fruit quality of black currant (Ribes nigrum L.) are favoured by precipitation and cool summer conditions. Acta Agr. Scand. B-Soil Plant Sci. 2015, 65, 702–712. [Google Scholar] [CrossRef]
- Viberg, U.; Ekström, G.; Fredlund, K.; Öste, R.E.; Sjöholm, I. A study of some important vitamins and antioxidants in a blackcurrant jam with low sugar content and without additives. Int. J. Food Sci. Nutr. 1997, 48, 57–66. [Google Scholar] [CrossRef]
- Baeza, R.; Busso, C.; Sanchez, V.; López, P.; Chirife, J. Physicochemical properties and anthocyanin content of commercially manufactured elderberry jams from Patagonia (Argentina). Int. J. Food Eng. 2024, 20, 17–26. [Google Scholar] [CrossRef]
- Kennas, A.; Amellal-Chibane, H.; Kessal, F.; Halladj, F. Effect of pomegranate peel and honey fortification on physicochemical, physical, microbiological and antioxidant properties of yoghurt powder. J. Saudi Soc. Agric. Sci. 2020, 19, 99–108. [Google Scholar] [CrossRef]
- Bajramova, A.; Spégel, P. A comparative study of the fatty acid profile of common fruits and fruits claimed to confer health benefits. J. Food Compos. Anal. 2022, 112, 104657. [Google Scholar] [CrossRef]
- del Castillo, M.L.R.; Dobson, G.; Brennan, R.; Gordon, S. Fatty acid content and juice characteristics in black currant (Ribes nigrum L.) genotypes. J. Agr. Food Chem. 2004, 52, 948–952. [Google Scholar] [CrossRef] [PubMed]
- Salvador, A.C.; Rocha, S.M.; Silvestre, A.J.D. Lipophilic phytochemicals from elderberries (Sambucus nigra L.): Influence of ripening, cultivar and season. Ind. Crop. Prod. 2015, 71, 15–23. [Google Scholar] [CrossRef]
- Barragán, R.; Coltell, O.; Portolés, O.; Asensio, E.M.; Sorlí, J.V.; Ortega-Azorín, C.; González, J.I.; Sáiz, C.; Fernández-Carrión, R.; Ordovas, J.M.; et al. Bitter, sweet, salty, sour and umami taste perception decreases with age: Sex-specific analysis, modulation by genetic variants and taste-preference associations in 18 to 80 year-old subjects. Nutrients 2018, 10, 1539. [Google Scholar] [CrossRef] [PubMed]
- Noel, C.; Dando, R. The effect of emotional state on taste perception. Appetite 2015, 95, 89–95. [Google Scholar] [CrossRef] [PubMed]
- Vennerod, F.F.F.; Nicklaus, S.; Lien, N.; Almli, V.L. The development of basic taste sensitivity and preferences in children. Appetite 2018, 127, 130–137. [Google Scholar] [CrossRef]
Disclaimer/Publisher’s Note: The statements, opinions and data contained in all publications are solely those of the individual author(s) and contributor(s) and not of MDPI and/or the editor(s). MDPI and/or the editor(s) disclaim responsibility for any injury to people or property resulting from any ideas, methods, instructions or products referred to in the content. |
© 2024 by the authors. Licensee MDPI, Basel, Switzerland. This article is an open access article distributed under the terms and conditions of the Creative Commons Attribution (CC BY) license (https://creativecommons.org/licenses/by/4.0/).