Abstract
Microalgae produce renewable biomass at high efficiency by using photosynthesis to capture the greenhouse gas CO2 from the atmosphere and releasing O2. Chlorella vulgaris is one of the most frequently cultivated unicellular green microalgae of commercial relevance. Some recent studies remarkably indicate that these microalgae can be a source of both cellulose and chitin biopolymers. Biomaterials produced with these polymers have useful mechanical properties. They are biocompatible and biodegradable, and they are regarded as sustainable alternatives to replace fossil-based bioplastics for many applications. However, selective and environmentally friendly processes for the effective co-purification of both polymers from microalgae are not yet available. Here, we present a green biorefinery approach that allowed, on the one hand, for the co-extraction of chitin and cellulose with a mass yield of 0.6% of the C. vulgaris biomass dry weight (before extraction). On the other hand, our method enabled to co-purify lipids, pigments, and proteins (mass yields: ~6.25%, ~0.13%, and ~50% of biomass dry weight, respectively) to make the whole procedure economically more viable. Finally, our greener fractionation and purification process was shown to reach efficiencies comparable to conventional, more toxic solvent extractions.
1. Introduction
Growing needs for sustainable and biobased materials are fostering the emergence of new high-performance polymers with reduced environmental impact. Cellulose nanofibrils (CNF) and cellulose nanocrystals (CNC), as well as chitin nanofibrils (ChNF) and nanocrystals (ChNC), are gaining increasing interest as a platform for a wide range of applications, which are already in use in material science, medicine, and food packaging, to mention a few [1,2,3]. Conventional nanocellulose production from lignocellulosic biomass, most frequently derived from wood, routinely involves harsh chemical extraction and energy-intensive fibrillation treatments [4]. The globally increasing need for the large-scale production of these polymers from terrestrial plant feedstocks is predicted to accelerate deforestation with a foreseeable impact on global warming, unbalance existing ecosystems, and compete for arable land required for feeding a growing world population [5]. Chitin production is presently mainly derived from marine crustacean processing industries [6]. Similar to the currently established approaches for cellulose purification, the extraction of chitin also involves harsh chemical treatments for achieving demineralization and deproteinization of crustacean shells [7].
Interestingly, a growing number of studies have indicated the presence of both cellulose and chitin as constituents of the cell wall in a few microalgal species, among them Chlorella vulgaris [8,9,10,11]. Microalgae that produce both biopolymers cellulose and chitin via photosynthesis may have the potential to replace the above-mentioned classical feedstocks for the production of these biopolymers in a sustainable and renewable way.
Here, we focus on C. vulgaris and describe the initial steps toward a more environmentally friendly cellulose and chitin extraction process, which we combine with the co-purification of a range of value-added bioactive compounds for increasing the economic viability of this so-called biorefinery process. C. vulgaris, one of the leading species used for many algae-based products, exhibits high photosynthetic and CO2 fixation activities and shows fast growth at the industrial scale in aquaculture, totally independent from natural ecosystems [12,13]. Moreover, the C. vulgaris biomass source is lignin-free and allows for the “greener” extraction processes for obtaining cellulosic polymers.
As both biopolymers are constituents of the C. vulgaris cell wall [14,15] and because they have a very similar chemical structure with the difference in a hydroxyl group in cellulose compared to an acetamide group in chitin, we established a co-purification protocol that co-extracts both biopolymers with reasonable purity, as well as lipids and proteins with high extraction efficiencies. This achievement will allow us, in the near future, to establish free-standing films composed of cellulose and chitin nanofibrils as a starting material for the development of new sustainable and biodegradable packaging products and as an inspiration for further innovative applications.
2. Material and Methods
2.1. Experimental Design of the Biorefinery Process
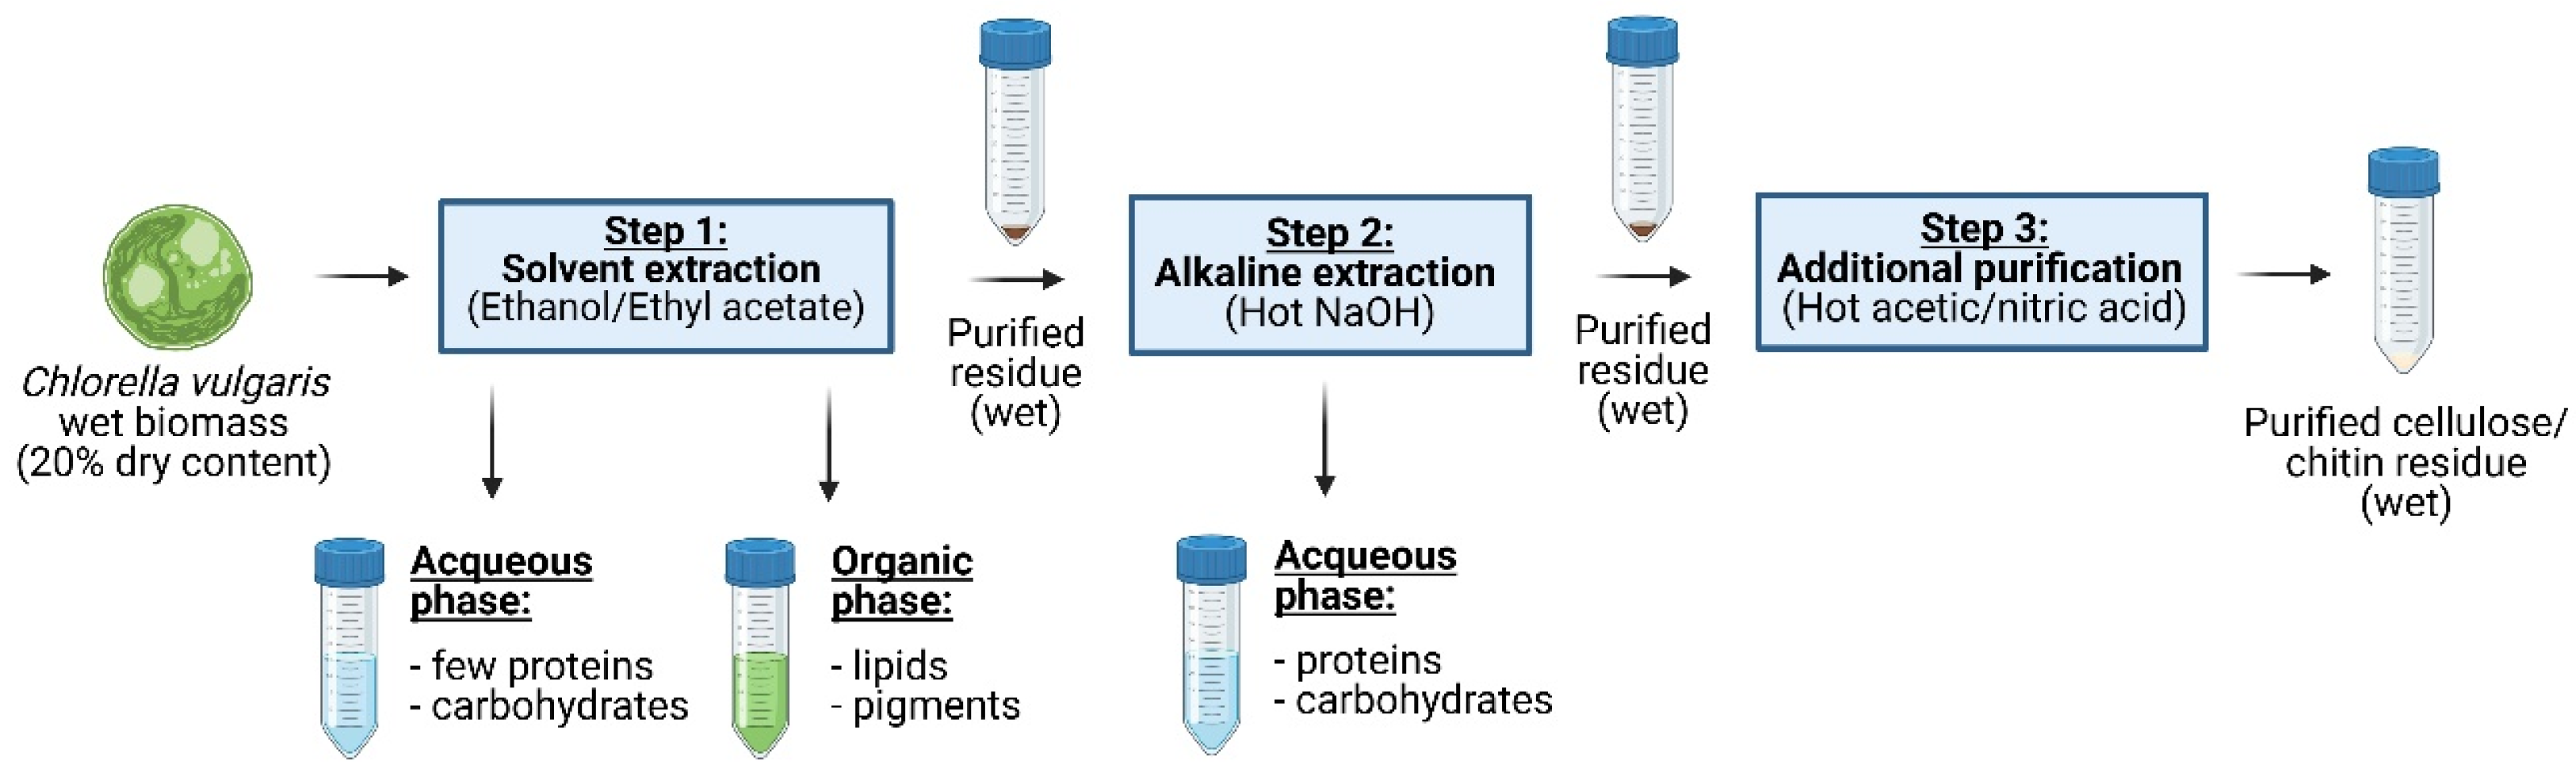
A fractionation and purification protocol has been developed to valorize microalgal co-products through a 3-step biorefinery process, which is visualized in a flow diagram (Figure 1). In the first step, lipids and parts of the pigments were extracted using different solvents. The purified residue was then passed through a hot NaOH extraction process to remove proteins. Finally, a purification step with a mixture of acetic/nitric acid was applied to obtain cellulose and chitin with reasonable purity. The complete extraction procedure was carried out on wet biomass, and the purified residues were kept wet during the entire process, as potential bioplastic manufacturing would require “never dried” purified residues.
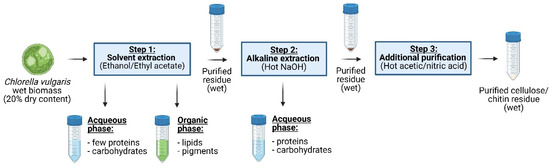
Figure 1.
Biorefinery applied to the wet biomass of C. vulgaris. In a sequential procedure, lipids and pigments were first extracted (step 1); then, proteins were extracted (step 2), and finally, impurities were removed to obtain the wet and cleaned biopolymer residue (step 3).
2.2. Microalgal Biomass and Chemicals
Dried Chlorella vulgaris biomass was purchased from the company Allma (Pataias, Portugal). According to the supplier, 100 g of dried biomass contains 10 g of lipids, 1.8 g of chlorophyll, and 55 g of proteins. The biomass was hydrated with sterile, deionized water prior to extraction to imitate a wet extraction condition, which is essential for obtaining efficient fibrillation of cellulose and chitin at the end of the extraction process. The hydrated biomass contained 20% of C. vulgaris dry mass, which we refer to when we calculate the yields of purified products in Section 3.1 and Section 3.2. All chemicals were purchased from Sigma-Aldrich (Saint-Louis, MO, USA).
2.3. Extraction of Lipids and Pigments
Harsh solvent extraction using methanol and chloroform (2:1, v/v) (“Bligh and Dyer method”) [16] has been used as a reference to allow for a comparison with the lipid extraction efficiency based on greener solvents. Solvents used for greener approaches were either pure ethanol or a mixture of ethanol and ethyl acetate (1:2, v/v) (“Green Bligh and Dyer”), inspired by the work of Breil et al. [17]. Extractions were carried out in duplicate at room temperature for different extraction times (2 min, 10 min, 30 min) and different solvent-to-biomass ratios (3:1, 10:1) under constant stirring. The eco-friendly extraction condition maximizing the yield of lipids was kept for the next step.
2.4. Extraction of Proteins and Carbohydrates
The alkaline extraction was carried out with hot NaOH, and three increasingly harsh extraction conditions were assessed by changing the extraction time, temperature, NaOH concentration, and solvent-to-biomass ratio. The extraction conditions used in the present study were inspired by articles reviewed in [1]. Extractions were conducted in duplicate in an agitated hot bath. Details of the parameters can be found in Table 1. The extraction condition maximizing the yield of proteins was kept for the next step.

Table 1.
Extraction parameters for the second extraction step.
2.5. Biopolymer Purification
The last purification step tested five different strategies. Extraction based on chlorinated bleach (1.7% NaClO2) in acetate buffer (pH 4.9) (1:1, v/v) was used as a reference method representing a non-ecofriendly purification process [18]. More eco-friendly alternatives were tested, such as chlorine-free bleach (H2O2), a harsher NaOH extraction, and a mixture of 80% acetic acid and 70% nitric acid (10:1, v/v), as inspired by the work of Updegraff [19], or simply hot water. Extractions were conducted in duplicate in an agitated hot bath. Specific parameter details can be found in Table 2.
Table 2.
Extraction parameters for the third extraction step.
2.6. Yield of Co-Products
2.6.1. Pigments
Solvent extractions (step 1) were conducted as detailed in Section 2.3. After recovery of the extraction supernatant by centrifugation (4000 rcf, 3 min, 20 °C), a two-phase separation was performed to separate the organic and aqueous phases. After migration of the pigments into the organic phase (either chloroform or ethyl acetate), the concentration of pigments was assessed by spectrophotometry (DR3900, Hach, Loveland, CO, USA). The concentrations of chlorophyll a and b were deduced according to the formula below.
For chloroform [20]:
For ethyl acetate [21]:
Yields of pigments were calculated with the following equation:
2.6.2. Lipids
An aliquot of half of the total amount of organic solvent used during extraction and phase separation was evaporated to dryness under a flow of nitrogen at 40 °C. The dry residue was weighed, and yields were determined by the following equation:
Yields were then corrected by subtracting the mass of pigments calculated above (Section 2.6.1), as these were also present in the organic phase.
2.6.3. Proteins
Protein concentrations were assessed on the aqueous phase obtained after phase separation of the solvent extraction supernatant (step 1) or after the alkaline extraction (step 2) using a commercial kit (DC Protein Assay, Bio-Rad, Hercules, CA, USA) containing two reagents dissolved in demineralized water: Reagent A contains an alkaline copper tartrate solution, and Reagent B contains a dilute Folin reagent.
A 25 µL aliquot of the aqueous phase was mixed with 125 µL of reagent A; then, 1.0 mL of reagent B was added, and the solution was immediately vortexed. The sample was left to react for 15 min, and the absorbance was measured at 750 nm by spectrophotometry (DR3900, Hach, Loveland, CO, USA). The protein concentration was determined from a standard curve prepared on the same day using a bovine serum albumin (BSA) standard (Bio-Rad, Hercules, CA, USA). Yields of proteins were finally determined by the following equation:
2.7. Yield of the Residues
The moisture content of the biomass before extraction was assessed by comparing weights obtained before and after freeze-drying to deduce the dry biomass weight. The residue was freeze-dried after each extraction step (1, 2, 3), and the ratio of mass before and after extraction was used to calculate the yield:
A lower yield was used as an indication of increased purity of the residue.
2.8. Scanning Electron Microscopy
Scanning electron microscopy (SEM) (GeminiSEM 300, Zeiss, Oberkochen, Germany) was used to visualize the remaining impurities still present in the residue obtained after the third extraction step (Section 2.5) and for making a comparative assessment of the relative purity of the residue after the different extraction procedures. Suspensions containing the purified residues were dried onto a silicon wafer. SEM high-resolution images were obtained at an acceleration voltage of 1.5 or 3 kV, after sputter-coating a 10 nm thick Au/Pd layer onto the samples.
3. Results and Discussion
3.1. Yield of Co-Products
3.1.1. Lipids
Following the above-described outline (Section 2.1), we compared the efficacy of harsher and milder extraction conditions to obtain optimal yields for co-products (lipids, proteins, pigments). All extractions have been performed in duplicates. Harsh solvent extraction using chloroform and methanol (“Bligh and Dyer method”) [16], which is the gold standard for lipid extraction from microalgae or other microorganisms, has been applied here as reference to allow for a comparison with greener solvents, for instance, pure ethanol or a mixture of ethanol and ethyl acetate (“Green Bligh and Dyer”) inspired from the work of Breil et al. [17].
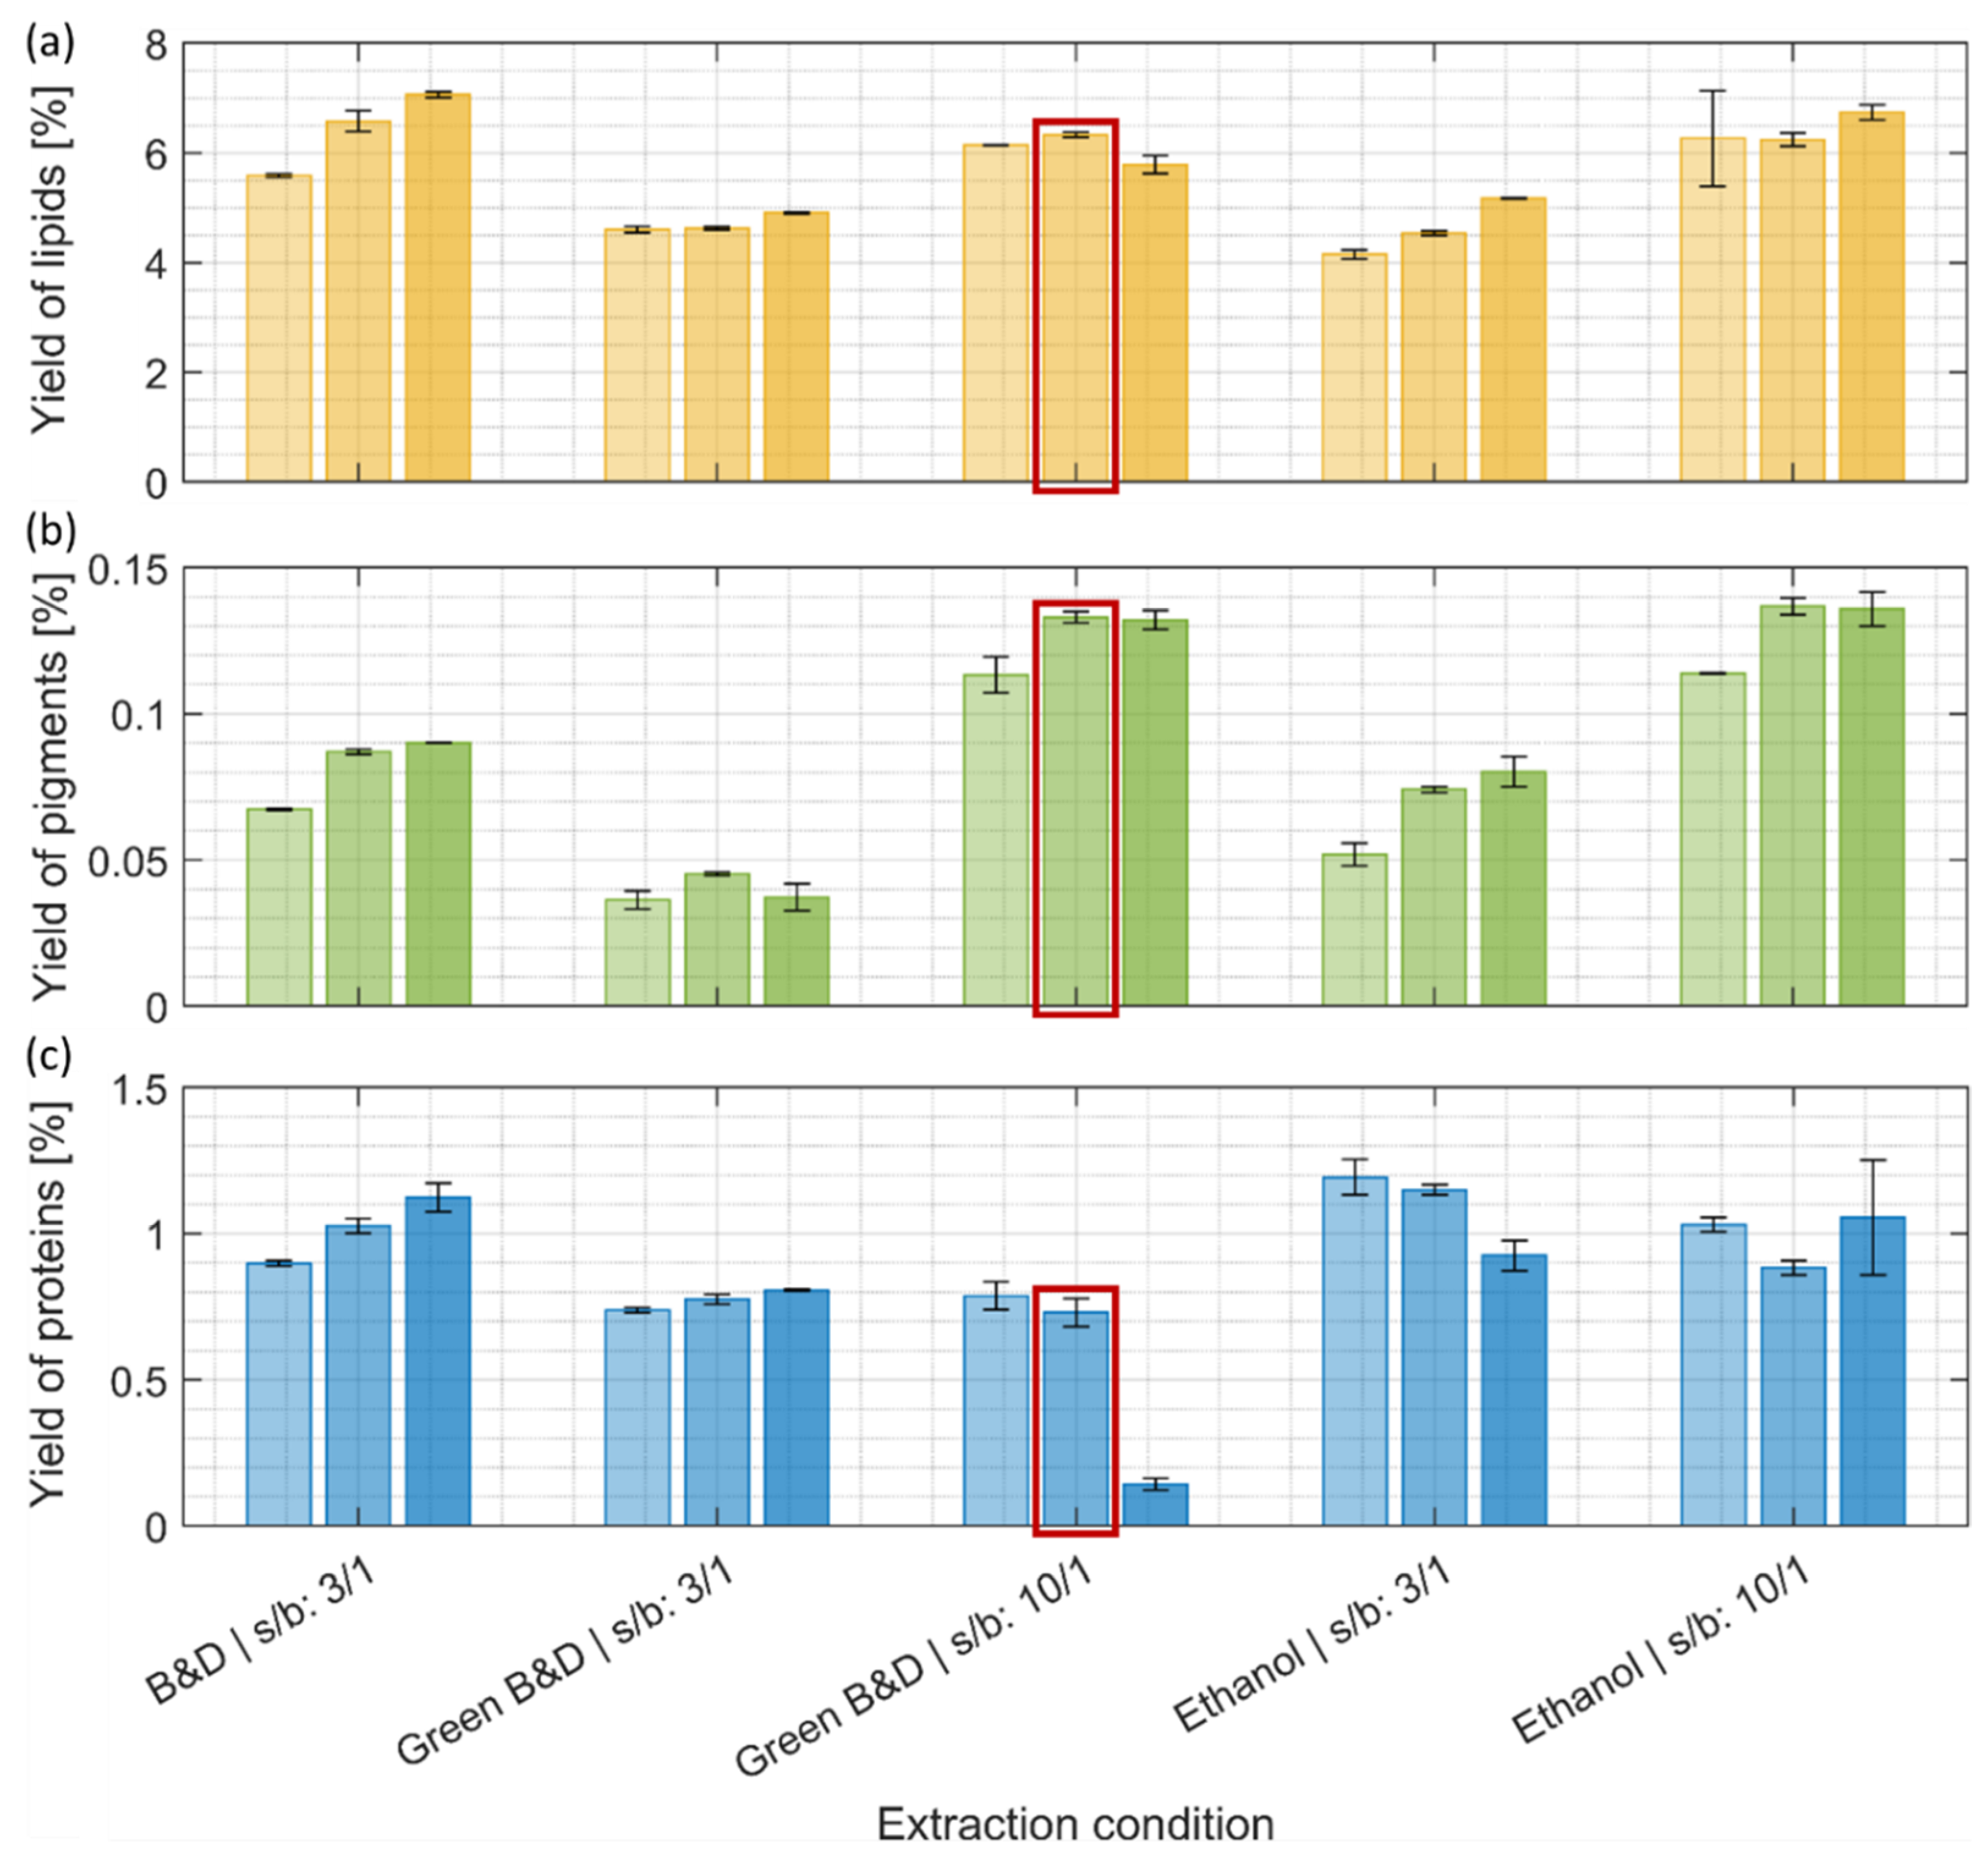
The conventional Bligh and Dyer method for lipid extraction was effective at a low (3:1) solvent-to-biomass ratio, and higher yields were obtained with longer extraction times (Figure 2a). However, similar amounts of lipid were also obtained with more eco-friendly ethanol and ethanol/ethyl acetate extractions using a higher solvent-to-biomass ratio (10:1). In general, the yield of extracted lipid increased with higher solvent-to-biomass ratios and prolonged extraction times, with the exception of the harshest condition for the ethyl acetate/ethanol extraction (Green Bligh and Dyer at 10:1 ratio and 30 min) (Figure 2a). This drop in extraction efficiency might be explainable by the transesterification of lipids with ethyl acetate, making them more water-soluble and, therefore, less present in the organic phase where lipids were quantified.

Figure 2.
Yields of (a) lipids, (b) pigments, and (c) proteins after the first extraction step (% of mass extracted compared to the initial biomass dry weight). (a–c) Light, intermediate, and darker colorings refer to an increase in extraction time, resp. 2 min, 10 min, and 30 min. The detailed extraction conditions can be found in Section 2.3. Ethanol and green solvent extraction (Green B&D) (solvent-to-biomass ratio 10:1) reach lipid yields comparable to a harsh conventional extraction procedure (B&D). The extraction condition marked with a red frame was selected for the subsequent extraction step. B&D: Bligh and Dyer, s/b: solvent-to-biomass ratio.
To date, solvent extraction methods have most frequently been used for lipid extraction, as they provide high lipid recovery [22,23,24]. Among these solvents, “greener” ones like ethanol and ethyl acetate/ethanol mixtures are gaining increasing importance as they are biocompatible and have a lower risk to human health. In comparison to chloroform and methanol, they exhibit, for instance, no negative genotoxicity and long-term carcinogenicity effects [25].
The data of the present study indicate that for a given biomass, greener extractions needed slightly more than three times the amount of solvent to be as efficient as the conventional Bligh and Dyer extraction method. The finding that the solvent-to-biomass ratio has the highest impact on the lipid extraction efficiency for the greener solvent ethanol, followed by the extraction time, has also been demonstrated on the wet biomass of the microalga Picochlorum sp. and is consistent with our results [26].
In the following, we would like to highlight some advantages of the greener solvents ethanol and ethyl acetate compared to those derived from fossil fuels such as methanol (polar solvent) and chloroform (non-polar) solvent.
Greener solvents with medium polarities may be preferred for the extraction of lipids from wet biomass. High water content in the wet biomass can inhibit the contact between lipids and non-polar solvents, such as chloroform. Thus, the influence of water can be diminished, and the extraction yields can be increased by using solvents with medium polarity (e.g., ethyl acetate/ethanol mixtures) [23].
Moreover, ethanol is regarded as a food-grade solvent, and ethyl acetate, which is contained in many fruits, is used, for instance, for the removal of caffeine in coffee or tea [27]. These aspects may be relevant when considering lipid extraction from microalgae biomass for animal or human food applications.
Finally, if lipid extraction from microalgae biomass is not intended for food applications but for biofuel production, ethyl acetate has been shown to have quite a high selectivity for the extraction of neutral lipids (NLs, including triacylglycerol, diglyceride, and mono-glyceride), which are of interest as a source of biologically produced diesel fuel substitute [28].
3.1.2. Pigments
Two types of chlorophyll, a and b, are present in green microalgae like C. vulgaris, and they can be a relevant feedstock for the increasing industrial needs of these pigments [29]. Mixtures of chloroform/methanol have been shown to be efficient for the extraction of chlorophyll from algal cultures [30]. In our present study, the Bligh and Dyer extraction also provided reasonable pigment extraction results (Figure 2b). For all tested conditions, the yield of extracted chlorophyll a and b generally increased with prolonged incubation times, with a maximum reached after 10 min of extraction (Figure 2b). At a low solvent-to-biomass ratio (3:1), the extraction with ethanol yielded similar amounts of pigments obtained by the Bligh and Dyer method, while only half of the amount was obtained with the mixture of ethanol and ethyl acetate. A higher solvent-to-biomass ratio (10:1) resulted in a 50% increase in pigment yield in the case of the ethanol extraction and 200% for the ethanol/ethyl acetate mixture compared to the lower solvent-to-biomass ratio condition. At these elevated solvent-to-biomass ratios, both greener extraction methods yielded similar results.
It is worth mentioning that chlorophylls are gaining increasing commercial relevance as natural pigments for the coloration of food, cosmetics, and pharmaceutical products [31]. In addition to the color-providing characteristics, they also improve the preservation in food storage as they have antioxidant and antimicrobial properties. Moreover, they exhibit a positive influence on human health as they improve the immune system, and they possess antimutagenic and anticarcinogenic as well as wound healing properties [29,31]. Chlorophyll a and chlorophyll b from edible plants are approved by European legislation to be marketed after solvent extraction [29]. Our results indicate that these pigments can efficiently be extracted from C. vulgaris by using eco-friendly extraction methods.
3.1.3. Proteins
C. vulgaris is considered a microalga with high protein content and protein quality, as its essential amino acid composition meets the dietary requirements for human consumption [32,33]. To enhance the bioavailability of proteins, they need to be extracted from microalgal biomass [34]. The solvent extractions described in Section 3.1.1 and Section 3.1.2 were adapted for the fractionation and purification of lipids and pigments and, therefore, showed only low-performance yields for the extraction of proteins (around 1% maximum) (Figure 2c). We still monitor these protein extraction yields to document that there are no significant protein losses after the lipid and pigment extraction step.
The most quantitative protein extraction step, as detailed in the following, was performed on the defatted biomass remaining from extraction with the ethanol/ethyl acetate mixture (10:1, 10 min), which removed lipids and pigments in the previous step as efficiently as pure ethanol (Figure 2a,b). The decision in favor of the ethanol/ethyl acetate mixture was justified by the fact that pure ethanol and the subsequent addition of ethyl acetate for the two-phase separation step would result in a three-times-higher solvent consumption than by directly using the ethanol/ethyl acetate mixture [17].
In order to achieve high protein extraction yields, alkaline extraction with NaOH is regarded as the most favorable method, as it increases protein solubility and can be performed at relatively low process costs [35].
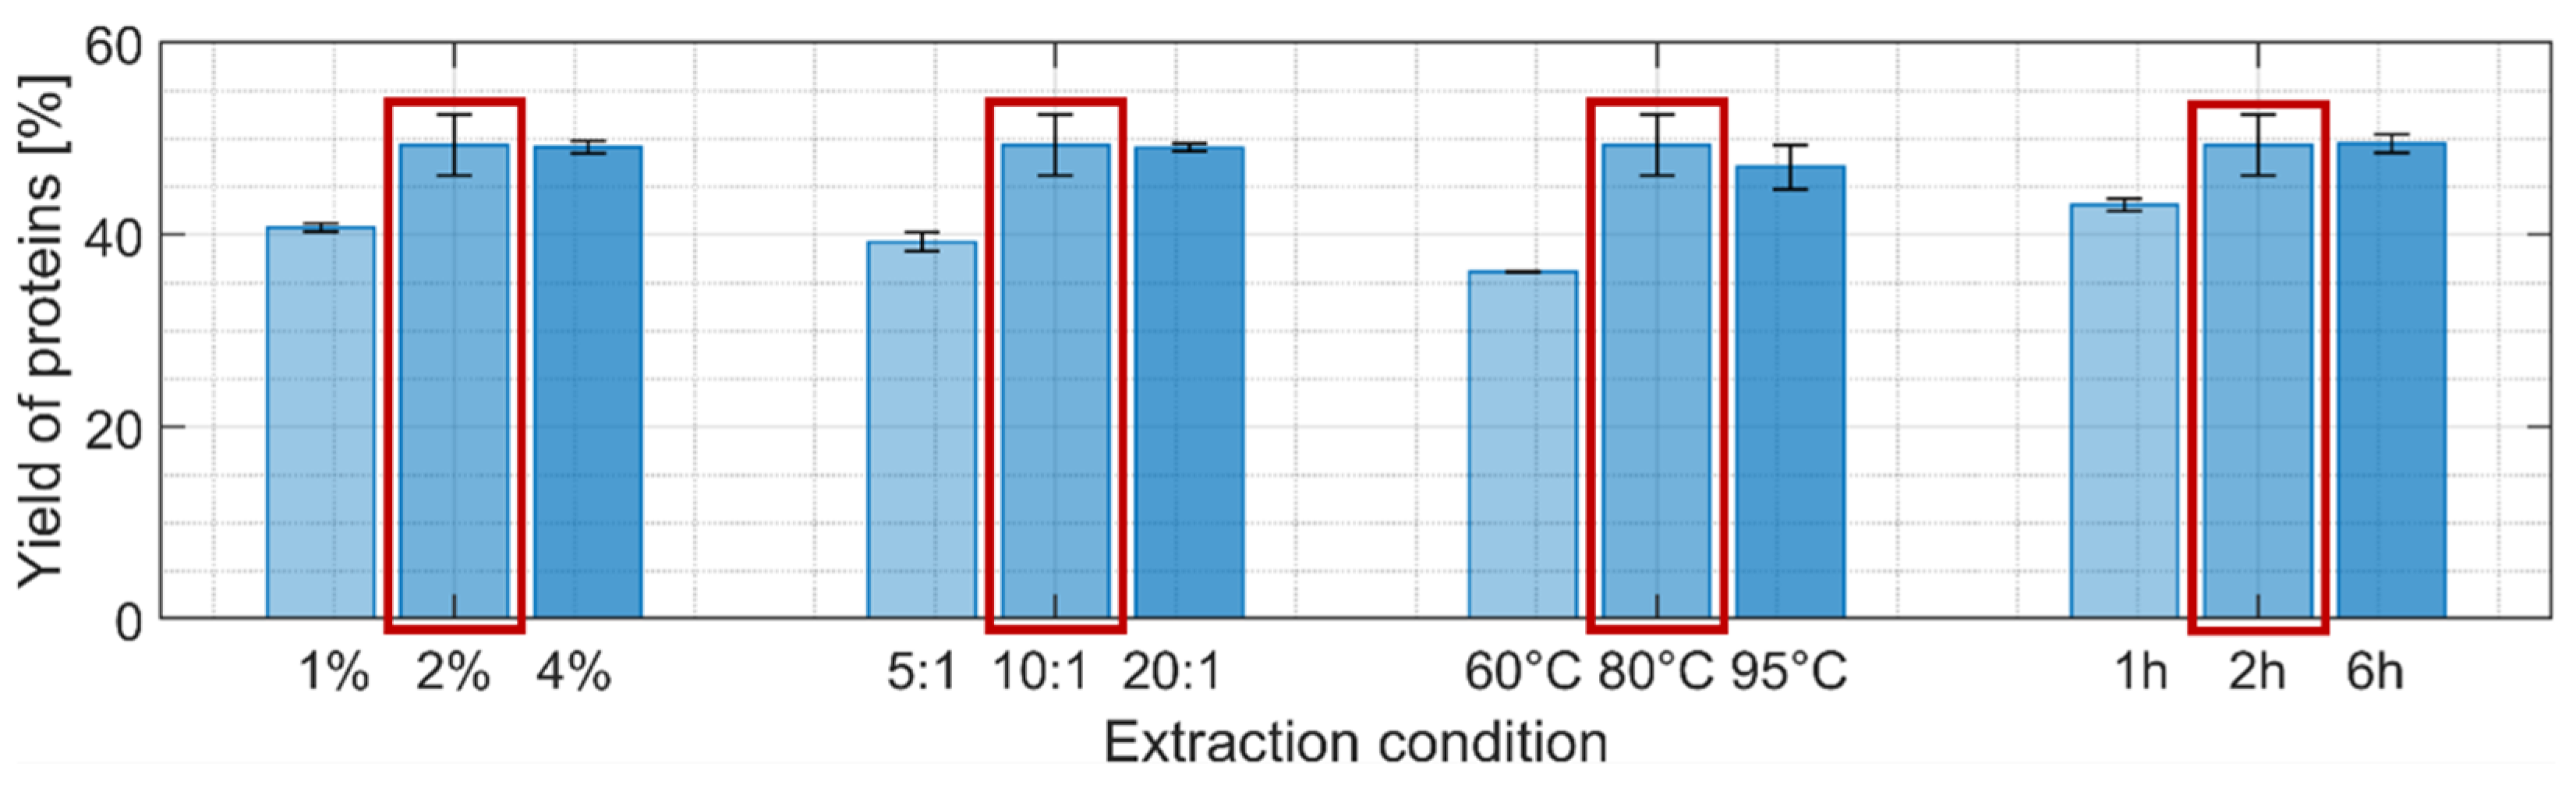
Four different parameters were individually varied using a hot NaOH extraction process: NaOH concentration, solvent-to-biomass ratio, temperature, and extraction time while keeping the other parameters at an intermediate harshness level (Figure 3). Higher protein extraction yields were obtained when each of the four parameters was independently increased with a maximum reached for the reference scenario: 56% yield if the lipid-free biomass is used as reference (i.e., after extraction step 1) or close to 50% when taking the initial biomass dry weight as reference. This indicates that almost all the proteins were extracted after the two first extraction steps since the supplier of the biomass indicated a protein content of 55%.
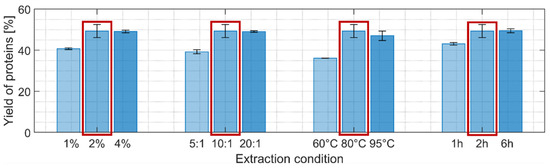
Figure 3.
Yields of protein after the second extraction step (% of mass extracted compared to the initial biomass dry weight). Light, intermediate, and darker colorings refer to an increased harshness of extraction. The detailed extraction conditions can be found in Table 1. Following the extraction procedure using 2% NaOH, 10:1 solvent-to-biomass ratio, incubation at 80 °C for 2 h obtained the highest protein yield among the tested conditions. The extraction condition marked with a red frame was selected for the subsequent extraction step.
The lipid and protein contents in microalgae are influenced by a number of factors, for instance, the composition of growth media and abiotic stress conditions [36,37]. The lipid capabilities of C. vulgaris can reach values of 30–40% of dry weight [38]. As our lipid yield was around 6–7% of dry weight but still in a normal range of lipid content for C. vulgaris, our results indicate that the culturing conditions used to grow this biomass of commercial origin were focused on increasing protein synthesis while decreasing lipid in the cells, as it was found in other studies [39].
3.2. Overall Yields and Purity of the Residue
3.2.1. Yield of the Residue After Each Extraction Step
The following paragraphs summarize the yields and mass losses of the residue after each of the three extraction steps in comparison to the initial biomass dry weight prior to any extraction (Figure 4). The sequential and selective extraction of lipids, pigments, and proteins results in measurable mass losses of the residue but also increases stepwise the overall purity of cellulose/chitin biopolymers, which are further purified in the last step of the process as illustrated in Section 3.2.2.
After the first lipid/pigment extraction step (Figure 4a), the yields of extracted residue remained quite high, ranging from 85–90% for the two green alternatives, and were slightly lower (around 75%) for the Bligh and Dyer method. For all different treatments, the prolongation of the extraction time and higher solvent-to-biomass ratio did not significantly enhance the extraction yield of the residues.
The residue remaining from the first extraction step with ethanol/ethyl acetate mixture (ratio 10:1, 10 min) was used for the second, protein-extraction step (Figure 4b). A significant drop in yield could be observed for each of the four extraction parameters and was more pronounced for harsher chemical treatments and longer incubation times. This decrease in yield of the residue can be attributed to a mass loss due to efficient protein extraction (Figure 3) but might also be due to a partial removal of carbohydrates, as similar treatments were shown to efficiently extract hemicellulose in other microalgae species and different kinds of monosaccharides in Chlorella [18,40,41]. As we were looking for a compromise that maximized protein extraction yields at not too harsh conditions (Figure 3) by still achieving reasonable mass yields of the residue (Figure 4b), it was decided to keep the intermediate condition (2% NaOH, ratio 10:1, 80 °C, 2h) for the next extraction step.
The last extraction step (Figure 4c), which compares five different treatments that are detailed in Table 2, is meant to obtain purified cellulose/chitin biopolymers. One non-eco-friendly purification process was used as a reference (sodium chlorite, NaClO2), as it was reported in most common cellulose purification protocols from algal biomass [1], and four more eco-friendly alternatives. Overall, yields of purified biopolymer residues were quite low in comparison to the initial biomass dry weight. A recent study has determined a total protein content of 56% and a carbohydrate content of 14% of the total biomass for C. vulgaris [40]. However, these numbers may vary depending on the taxonomic classification, cultivation conditions, and metabolic status of the cells [42]. Whereas the protein yield of our extraction procedure (Figure 3) is in the range of the mentioned analysis by Weber et al. [40], the low yield in cellulose/chitin biopolymers compared to the 14% of carbohydrate content determined by Weber et al. [40] cannot be readily compared with our results, because their study determined the total amount of all different classes of monomeric sugars present in C. vulgaris, which is obviously higher than the cellulose/chitin mass content. Moreover, our results may point to the fact that the culturing conditions for the C. vulgaris biomass we used for extraction were not optimized for high carbohydrate biosynthesis [39].
Among all tested conditions, extraction with hot water extracted residual impurities with the lowest efficiency (Figure 4c), although it still removed around 60% of the dry mass when taking the lipid/protein-free biomass as a reference. The other tested conditions resulted in a significantly lower yield for the dried residue, suggesting higher purity compared to hot water extraction: 35% of the yield obtained by hot water extraction for NaClO2, 30% for H2O2, 20% for NaOH and 10% for the mixture of nitric/acetic acid. Our results show that the common reference scenario (NaClO2) might not be the best option for cellulose/chitin purification of C. vulgaris, while several greener alternatives are yielding higher purity. The treatment with nitric/acetic acid was, in our case, the best-performing purification process, although it has not been reported so far for routine cellulose or chitin purification processes to the best of our knowledge.
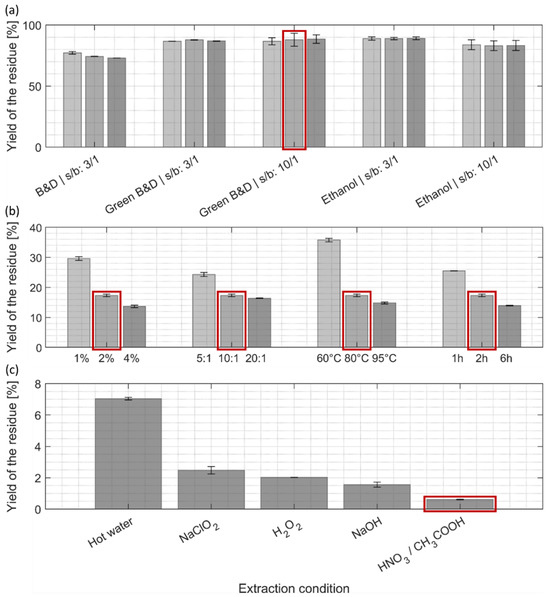
Figure 4.
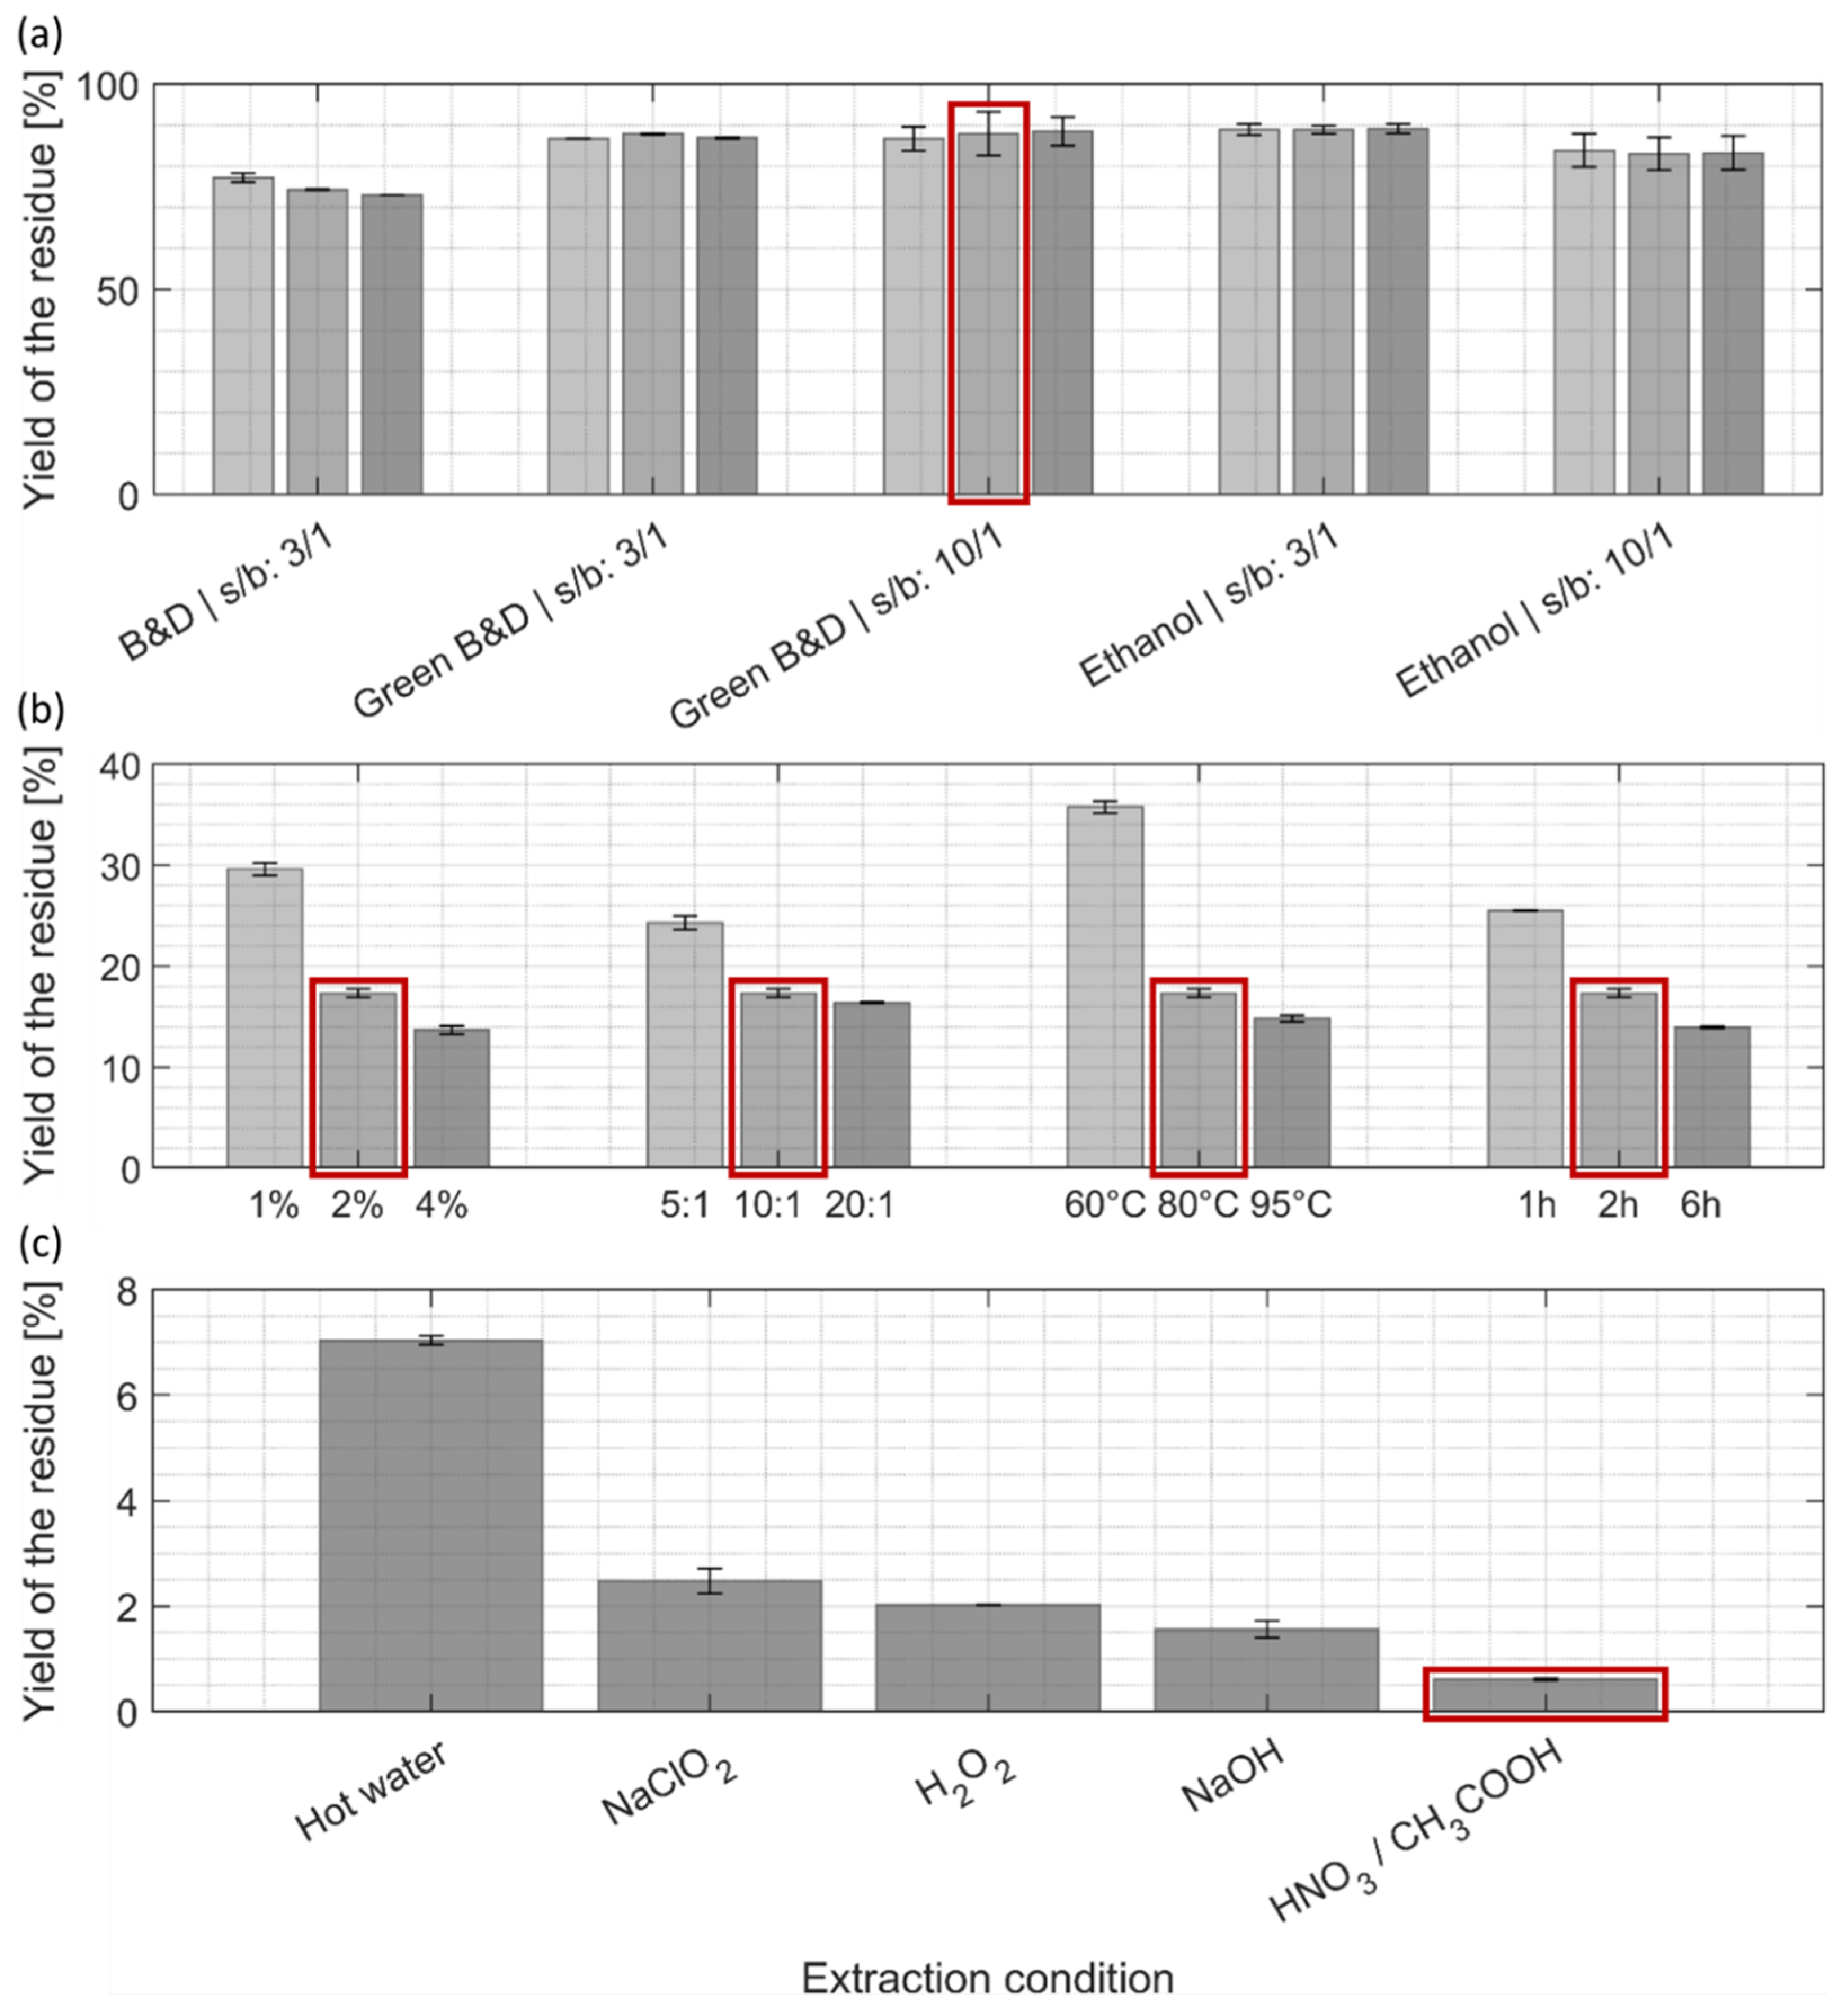
Yields of residues after (a) the first, (b) second, and (c) third extraction steps (% of mass of residues compared to the initial biomass dry weight). (a–c) Light, intermediate, and darker colorings refer to an increase in harshness of the extraction; in the case of the first extraction step (a), it refers to an increase in extraction time, 2 min, 10 min, and 30 min. The detailed extraction conditions can be found in (a) Section 2.3, (b) Table 1, and (c) Table 2. Extraction conditions marked with a red frame (a,b) were selected for the subsequent extraction step, and (c) indicates the purification method with highest mass loss. B&D: Bligh and Dyer, s/b: solvent-to-biomass ratio.
Figure 4.
Yields of residues after (a) the first, (b) second, and (c) third extraction steps (% of mass of residues compared to the initial biomass dry weight). (a–c) Light, intermediate, and darker colorings refer to an increase in harshness of the extraction; in the case of the first extraction step (a), it refers to an increase in extraction time, 2 min, 10 min, and 30 min. The detailed extraction conditions can be found in (a) Section 2.3, (b) Table 1, and (c) Table 2. Extraction conditions marked with a red frame (a,b) were selected for the subsequent extraction step, and (c) indicates the purification method with highest mass loss. B&D: Bligh and Dyer, s/b: solvent-to-biomass ratio.
3.2.2. Optical and SEM-Characterisation of the Residue Containing Cellulose and Chitin Biopolymers
The visual inspection and the scanning electron microscopic analysis of the residues obtained after the last extraction step (Figure 5) validate that the trends in the loss of masses (Figure 4c) inversely correlate with the level of purity of the residue as they follow the same ranking.
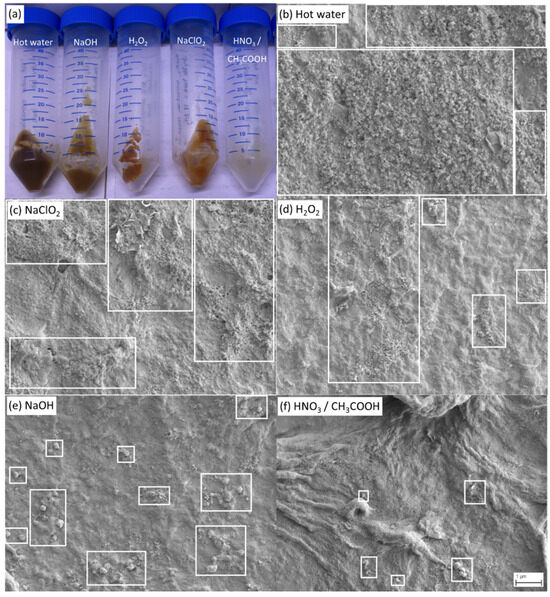
Figure 5.
(a) Macroscopic visual appearance of the residues after the third extraction step (from left to right: hot water, NaOH, H2O2, NaClO2, HNO3/CH3COOH), and representative scanning electron microscopy images behind (Magnification 10,000×) of the same residues with indication of the corresponding extraction method: (b) hot water, (c) sodium chlorite, (d) hydrogen peroxide, (e) sodium hydroxide, and (f) a mixture of nitric and acetic acid. A network of cellulose and chitin fibers is visible for all treatments (b–f), while the area sizes of visible impurities (white boxes) vary for the different treatments (b–f). The highest purity level was obtained by the extraction with HNO3/CH3COOH (f).
Macroscopic observations (Figure 5a) showed that the residue obtained after nitric/acetic acid (HNO3/CH3COOH) treatment exhibits a yellow–white color, closely related to the natural color of cellulose and chitin, while more brownish residues were observed for the other extraction conditions, indicating that they presumably contained a higher level of impurities. Additional evidence of the presence of cellulose and chitin in C. vulgaris can be found in the Supplementary Information (Figure S1).
This trend was then verified by scanning electron microscopy analysis (Figure 5b–f), whereas a network of fibers was observable for all treatments, indicating that all the final extraction steps principally yielded cellulose/chitin biopolymers, however, with a different degree of purity. Figure 5b–f shows representative SEM images at lower magnification for each of the extraction steps to better visualize the overall extent of the impurities, whereas higher magnification images (Figure S2) that show the biopolymer networks in better detail can be found in the Supplementary Information. Treatments resulting in a lower purity (hot water, NaClO2, H2O2) usually contained a large amount of small-sized particles representing residual impurities (Figure 5b–d), while more efficient treatments (NaOH, HNO3/CH3COOH) showed significantly less small-sized impurities and rarely contained particles of larger sizes (Figure 5e,f). Again, the trend of the degree of purity of the residue, as documented by SEM, is inversely correlated to the residue yield shown in Figure 4. Finally, considering the low quantity of impurities present after HNO3/CH3COOH treatment (Figure 5f), an estimate of the yield of biopolymers can be obtained at 0.6% of the mass of cellulose/chitin compared to the dry biomass before extractions (Figure 4c).
Only a limited number of microalgae species have been shown to synthesize and accumulate both cellulose and chitin in their cell walls. With the aim of developing a mainly green biorefinery process, we extended here the portfolio of already known value-added products derived from C. vulgaris, an economically relevant microalga, by the extraction of biopolymers potentially useful as building blocks for creating novel packaging materials. As the cell wall composition differs from species to species and a great variety of polysaccharides occurs in different microalgae [43], an extraction protocol needs to be adapted case by case. Here, we provide some inspiration for replacing certain extraction steps with more eco-friendly procedures by still achieving comparable and sometimes even better product yields than those obtained with conventional methods.
We would finally like to point out that the combination of cellulose and chitin polymers for creating advanced composite biomaterials is gaining increasing attention for medical applications, pollutant absorbents, and packaging materials, to mention a few [44,45,46]. Once again, cellulose is a renewable biomaterial currently mostly derived from wood and other plant-based materials or bacterial cellulose. Chitin is generally obtained as a by-product from the crab and shrimp meat production industry [46]. For engineering composite materials, these biopolymers are purified from their natural biomasses, fibrillated, and subsequently mixed in different molar ratios [45,46].
Having both cellulose and chitin derived from a single type of microalga, as exemplified in our present study, will have the advantage that these polymers can be simultaneously produced in a sustainable way from a photosynthetic organism. Investigations will follow to determine the mechanical and physical properties of this novel composite material. Moreover, it needs to be determined how osmotic stress or other types of abiotic stresses can influence the thickness and mechanical stability of the C. vulgaris cell wall. We assume that these stress treatments might potentially also impact the molar ratio of cellulose and chitin polymers within the natural cell wall and, thus, the mechanical properties of the final composite material.
4. Conclusions
C. vulgaris is gaining increasing relevance as a new feedstock of cellulose and chitin biopolymers suitable for the production of many kinds of nanomaterials. We established a biorefinery process mainly using greener solvents and chemicals that allow for the fractionation and purification of lipids, pigments, and proteins, as well as the co-purification of cellulose and chitin from C. vulgaris biomass.
The sequential manner of this biorefinery, beginning with the purification of lipids and pigments based on a green extraction reagent (Green B&D, solvent-to-biomass ratio 10:1, 10 min) provided lipid and pigment mass yields of ~6.25%, and ~0.13% of biomass dry weight (before extraction), respectively, compared to mass yields of ~6.5%, and 0.09% of dry biomass using the conventional B&D extraction with a solvent-to-biomass ratio of 3:1 during 10 min. The subsequent and more conventional protein extraction step using 2% NaOH, 10:1 solvent-to-biomass ratio, and incubation at 80 °C for 2h provided the highest protein mass yield (~50% of dry biomass weight) among the tested conditions. Thus, for the listed value-added compounds, we reached extraction efficiencies comparable to the most common but more toxic fuel-derived solvent processes.
In the final biopolymer purification step used for the first time, a mixture of nitric/acetic acid reached a mass yield of 0.6% cellulose/chitin biopolymers of dry biomass weight compared to 2.5% mass yield with conventional NaClO2, but with significantly less impurities as analyzed by scanning electron microscopy (SEM), indicating a better purification efficiency of the nitric/acetic acid-based strategy compared to less environmental-friendly conventional methods.
Supplementary Materials
The following supporting information can be downloaded at: https://www.mdpi.com/article/10.3390/fermentation11030120/s1, Figure S1: Confocal microscopy images of C. vulgaris cells stained with: (a) WGA (red), (b) CW (blue), and (c) WGA (red) + CW (blue) show distinct compartments of chitin (red) and cellulose (blue but no red) in the cell. WGA: Wheat germ agglutinin; CW: Calcofluor white; Figure S2: Scanning electron microscopy images of the residues after the third extraction step (Magnification 20,000×).
Author Contributions
E.Z., project administration, conceptualization, methodology, investigation, data curation, visualization, writing—original draft, writing—review and editing; B.M., methodology, investigation, data curation; M.F., investigation, data curation; E.D., funding acquisition, supervision, methodology; C.L., funding acquisition, supervision, project administration, conceptualization, writing—review and editing; H.P., supervision, project administration, conceptualization, methodology, writing—original draft, writing—review and editing. All authors have read and agreed to the published version of the manuscript.
Funding
This work was supported by Nestlé SA (EPFL-Nestlé grant, project Biopack).
Data Availability Statement
The original contributions presented in the study are included in the article/Supplementary Materials, further inquiries can be directed to the corresponding author.
Conflicts of Interest
The authors declare no conflict of interest.
References
- Zanchetta, E.; Damergi, E.; Patel, B.; Borgmeyer, T.; Pick, H.; Pulgarin, A.; Ludwig, C. Algal Cellulose, Production and Potential Use in Plastics: Challenges and Opportunities. Algal Res. 2021, 56, 102288. [Google Scholar] [CrossRef]
- Serventi, L.; He, Q.; Huang, J.; Mani, A.; Subhash, A.J. Advances in the Preparations and Applications of Nanochitins. Food Hydrocoll. Health 2021, 1, 100036. [Google Scholar] [CrossRef]
- Trache, D.; Tarchoun, A.F.; Derradji, M.; Hamidon, T.S.; Masruchin, N.; Brosse, N.; Hussin, M.H. Nanocellulose: From Fundamentals to Advanced Applications. Front. Chem. 2020, 8, 392. [Google Scholar] [CrossRef] [PubMed]
- Isogai, A. Wood Nanocelluloses: Fundamentals and Applications as New Bio-Based Nanomaterials. J. Wood Sci. 2013, 59, 449–459. [Google Scholar] [CrossRef]
- Lawrence, D.; Coe, M.; Walker, W.; Verchot, L.; Vandecar, K. The Unseen Effects of Deforestation: Biophysical Effects on Climate. Front. For. Glob. Change 2022, 5, 49. [Google Scholar] [CrossRef]
- Hamed, I.; Özogul, F.; Regenstein, J.M. Industrial Applications of Crustacean By-Products (Chitin, Chitosan, and Chitooligosaccharides): A Review. Trends Food Sci. Technol. 2016, 48, 40–50. [Google Scholar] [CrossRef]
- Younes, I.; Rinaudo, M. Chitin and Chitosan Preparation from Marine Sources. Structure, Properties and Applications. Mar. Drugs 2015, 13, 1133–1174. [Google Scholar] [CrossRef]
- Kapaun, E.; Reisser, W. A Chitin-like Glycan in the Cell Wall of a Chlorella sp. (Chlorococcales, Chlorophyceae). Planta 1995, 197, 577–582. [Google Scholar] [CrossRef]
- Burczyk, J.; Śmietana, B.; Termińska-Pabis, K.; Zych, M.; Kowalowski, P. Comparison of Nitrogen Content Amino Acid Composition and Glucosamine Content of Cell Walls of Various Chlorococcalean Algae. Phytochemistry 1999, 51, 491–497. [Google Scholar] [CrossRef]
- Durkin, C.A.; Mock, T.; Armbrust, E.V. Chitin in Diatoms and Its Association with the Cell Wall. Eukaryot. Cell 2009, 8, 1038–1050. [Google Scholar] [CrossRef]
- Latil de Ros, D.G.; Lòpez Cerro, M.T.; Ruiz Canovas, E.; Durany Turk, O.; Segura de Yebra, J.; Mercadé Roca, J. Chitin and Chitosan Producing Methods. EP3034612A1, 22 June 2016. [Google Scholar]
- Adamczyk, M.; Lasek, J.; Skawińska, A. CO2 Biofixation and Growth Kinetics of Chlorella vulgaris and Nannochloropsis gaditana. Appl. Biochem. Biotechnol. 2016, 179, 1248–1261. [Google Scholar] [CrossRef] [PubMed]
- Koyande, A.K.; Chew, K.W.; Rambabu, K.; Tao, Y.; Chu, D.T.; Show, P.L. Microalgae: A Potential Alternative to Health Supplementation for Humans. Food Sci. Hum. Wellness 2019, 8, 16–24. [Google Scholar] [CrossRef]
- Duval, J.F.L.; Razafitianamaharavo, A.; Bihannic, I.; Offroy, M.; Lesniewska, N.; Sohm, B.; Le Cordier, H.; Mustin, C.; Pagnout, C.; Beaussart, A. New Insights into the Effects of Growth Phase and Enzymatic Treatment on the Cell-Wall Properties of Chlorella vulgaris Microalgae. Algal Res. 2023, 69, 102955. [Google Scholar] [CrossRef]
- Zanchetta, E.; Ollivier, M.; Taing, N.; Damergi, E.; Agarwal, A.; Ludwig, C.; Pick, H. Abiotic Stress Approaches for Enhancing Cellulose and Chitin Production in Chlorella vulgaris. Bioresour. Technol. 2024, in press. [Google Scholar]
- Bligh, E.G.; Dyer, W.J. A Rapid Method of Total Lipid Extraction and Purification. Can. J. Biochem. Physiol. 1959, 37, 911–917. [Google Scholar] [CrossRef]
- Breil, C.; Abert Vian, M.; Zemb, T.; Kunz, W.; Chemat, F. “Bligh and Dyer” and Folch Methods for Solid–Liquid–Liquid Extraction of Lipids from Microorganisms. Comprehension of Solvatation Mechanisms and towards Substitution with Alternative Solvents. Int. J. Mol. Sci. 2017, 18, 708. [Google Scholar] [CrossRef]
- Lee, H.-R.; Kim, K.; Mun, S.C.; Chang, Y.K.; Choi, S.Q. A New Method to Produce Cellulose Nanofibrils from Microalgae and the Measurement of Their Mechanical Strength. Carbohydr. Polym. 2018, 180, 276–285. [Google Scholar] [CrossRef]
- Updegraff, D.M. Semimicro Determination of Cellulose in Biological Materials. Anal. Biochem. 1969, 32, 420–424. [Google Scholar] [CrossRef]
- Wellburn, A.R. The Spectral Determination of Chlorophylls a and b, as Well as Total Carotenoids, Using Various Solvents with Spectrophotometers of Different Resolution. J. Plant Physiol. 1994, 144, 307–313. [Google Scholar] [CrossRef]
- Kumar, P.; Ramakritinan, C.M.; Kumaraguru, A.K. Solvent Extraction and Spectrophotometric Determination of Pigments of Some Algal Species from the Shore of Puthumadam, Southeast Coast of India. Int. J. Ocean. Oceanogr. 2010, 4, 29–34. [Google Scholar]
- de Jesus, S.S.; Ferreira, G.F.; Moreira, L.S.; Maciel, M.R.W.; Maciel Filho, R. Comparison of Several Methods for Effective Lipid Extraction from Wet Microalgae Using Green Solvents. Renew. Energy 2019, 143, 130–141. [Google Scholar] [CrossRef]
- Saini, R.K.; Prasad, P.; Shang, X.; Keum, Y.S. Advances in Lipid Extraction Methods—A Review. Int. J. Mol. Sci. 2021, 22, 13643. [Google Scholar] [CrossRef] [PubMed]
- Zhou, J.; Wang, M.; Saraiva, J.A.; Martins, A.P.; Pinto, C.A.; Prieto, M.A.; Simal-Gandara, J.; Cao, H.; Xiao, J.; Barba, F.J. Extraction of Lipids from Microalgae Using Classical and Innovative Approaches. Food Chem. 2022, 384, 132236. [Google Scholar] [CrossRef]
- Loyao, A.S.; Villasica, S.L.G.; Dela Peña, P.L.L.; Go, A.W. Extraction of Lipids from Spent Coffee Grounds with Non-Polar Renewable Solvents as Alternative. Ind. Crops Prod. 2018, 119, 152–161. [Google Scholar] [CrossRef]
- Yang, F.; Xiang, W.; Sun, X.; Wu, H.; Li, T.; Long, L. A Novel Lipid Extraction Method from Wet Microalga Picochlorum sp. at Room Temperature. Mar. Drugs 2014, 12, 1258–1270. [Google Scholar] [CrossRef]
- Ramalakshmi, K.; Raghavan, B. Caffeine in Coffee: Its Removal. Why and How? Crit. Rev. Food Sci. Nutr. 1999, 39, 441–456. [Google Scholar] [CrossRef]
- Lu, W.; Wang, Z.; Yuan, Z. Characteristics of Lipid Extraction from Chlorella sp. Cultivated in Outdoor Raceway Ponds with Mixture of Ethyl Acetate and Ethanol for Biodiesel Production. Bioresour. Technol. 2015, 191, 433–437. [Google Scholar] [CrossRef]
- Sarkar, S.; Manna, M.S.; Bhowmick, T.K.; Gayen, K. Extraction of Chlorophylls and Carotenoids from Dry and Wet Biomass of Isolated Chlorella Thermophila: Optimization of Process Parameters and Modelling by Artificial Neural Network. Process Biochem. 2020, 96, 58–72. [Google Scholar] [CrossRef]
- Wood, L.W. Chloroform–Methanol Extraction of Chlorophyll a. Can. J. Fish. Aquat. Sci. 1985, 42, 38–43. [Google Scholar] [CrossRef]
- Sun, H.; Wang, Y.; He, Y.; Liu, B.; Mou, H.; Chen, F.; Yang, S. Microalgae-Derived Pigments for the Food Industry. Mar. Drugs 2023, 21, 82. [Google Scholar] [CrossRef]
- Becker, E.W. Micro-Algae as a Source of Protein. Biotechnol. Adv. 2007, 25, 207–210. [Google Scholar] [CrossRef] [PubMed]
- Wang, Y.; Tibbetts, S.M.; McGinn, P.J. Microalgae as Sources of High-Quality Protein for Human Food and Protein Supplements. Foods 2021, 10, 3002. [Google Scholar] [CrossRef]
- Bleakley, S.; Hayes, M. Algal Proteins: Extraction, Application, and Challenges Concerning Production. Foods 2017, 6, 33. [Google Scholar] [CrossRef] [PubMed]
- Phongthai, S.; Lim, S.T.; Rawdkuen, S. Ultrasonic-Assisted Extraction of Rice Bran Protein Using Response Surface Methodology. J. Food Biochem. 2017, 41, e12314. [Google Scholar] [CrossRef]
- Xie, T.; Xia, Y.; Zeng, Y.; Li, X.; Zhang, Y. Nitrate Concentration-Shift Cultivation to Enhance Protein Content of Heterotrophic Microalga Chlorella vulgaris: Over-Compensation Strategy. Bioresour. Technol. 2017, 233, 247–255. [Google Scholar] [CrossRef]
- Zhu, Z.; Sun, J.; Fa, Y.; Liu, X.; Lindblad, P. Enhancing Microalgal Lipid Accumulation for Biofuel Production. Front. Microbiol. 2022, 13, 1024441. [Google Scholar] [CrossRef]
- Zhang, K.; Sun, B.; She, X.; Zhao, F.; Cao, Y.; Ren, D.; Lu, J. Lipid Production and Composition of Fatty Acids in Chlorella vulgaris Cultured Using Different Methods: Photoautotrophic, Heterotrophic, and Pure and Mixed Conditions. Ann. Microbiol. 2014, 64, 1239–1246. [Google Scholar] [CrossRef]
- Markou, G.; Angelidaki, I.; Georgakakis, D. Microalgal Carbohydrates: An Overview of the Factors Influencing Carbohydrates Production, and of Main Bioconversion Technologies for Production of Biofuels. Appl. Microbiol. Biotechnol. 2012, 96, 631–645. [Google Scholar] [CrossRef]
- Weber, S.; Grande, P.M.; Blank, L.M.; Klose, H. Insights into Cell Wall Disintegration of Chlorella vulgaris. PLoS ONE 2022, 17, e0262500. [Google Scholar] [CrossRef]
- Hamed, S.B.; Hamed, M.B.B.; Kassouar, S.; Abi Ayad, S.E.-A. Physicochemical Analysis of Cellulose from Microalgae Nannochloropsis Gaditana. Afr. J. Biotechnol. 2016, 15, 1201–1206. [Google Scholar]
- Baudelet, P.H.; Ricochon, G.; Linder, M.; Muniglia, L. A New Insight into Cell Walls of Chlorophyta. Algal Res. 2017, 25, 333–371. [Google Scholar] [CrossRef]
- Colusse, G.A.; Carneiro, J.; Duarte, M.E.R.; de Carvalho, J.C.; Noseda, M.D. Advances in Microalgal Cell Wall Polysaccharides: A Review Focused on Structure, Production, and Biological Application. Crit. Rev. Biotechnol. 2022, 42, 562–577. [Google Scholar] [CrossRef] [PubMed]
- Kostag, M.; El Seoud, O.A. Sustainable Biomaterials Based on Cellulose, Chitin and Chitosan Composites—A Review. Carbohydr. Polym. Technol. Appl. 2021, 2, 100079. [Google Scholar] [CrossRef]
- Duan, Y.; Freyburger, A.; Kunz, W.; Zollfrank, C. Cellulose and Chitin Composite Materials from an Ionic Liquid and a Green Co-Solvent. Carbohydr. Polym. 2018, 192, 159–165. [Google Scholar] [CrossRef]
- Gul, S.; Karahan, Y.; Kurtur, O.B.; Budama-Kilinc, Y. Cellulose, Chitin, and Chitosan Composite-Based Sustainable Biomaterials. In Sustainable Green Biomaterials as Drug Delivery Systems; Malviya, R., Sundram, S., Eds.; Springer Nature: Cham, Switzerland, 2025; pp. 317–342. ISBN 978-3-031-79062-1. [Google Scholar]

Disclaimer/Publisher’s Note: The statements, opinions and data contained in all publications are solely those of the individual author(s) and contributor(s) and not of MDPI and/or the editor(s). MDPI and/or the editor(s) disclaim responsibility for any injury to people or property resulting from any ideas, methods, instructions or products referred to in the content. |
© 2025 by the authors. Licensee MDPI, Basel, Switzerland. This article is an open access article distributed under the terms and conditions of the Creative Commons Attribution (CC BY) license (https://creativecommons.org/licenses/by/4.0/).