Article

Fermentation of Light and Dark Bean Coffee Brews with SCOBY and Lactic Acid Bacteria

by
Rusen Metin Yildirim
Food Engineering Department, Chemical and Metallurgical Engineering Faculty, Yildiz Technical University, 34210 Istanbul, Turkey
Fermentation 2025, 11(3), 158; https://doi.org/10.3390/fermentation11030158
Submission received: 18 February 2025 / Revised: 10 March 2025 / Accepted: 14 March 2025 / Published: 20 March 2025

Abstract

:
This study investigated the effects of fermentation with a SCOBY (symbiotic culture of bacteria and yeast) and lactic acid bacteria (LAB) on the physicochemical and sensory properties of coffee brews prepared from light-roasted (LR) and dark-roasted (DR) coffee beans, with and without the addition of spent coffee grounds (SC). Total phenolic content (TPC), total flavonoid content (TFC), antioxidant activities (DPPH and FRAP), caffeine, and individual phenolic acids were analyzed. Fermentation significantly increased TPC and the concentrations of chlorogenic acids (CGAs), particularly in LR samples, with 5-caffeoylquinic acid (5-CQA) as the most abundant phenolic acid. The addition of spent coffee grounds further enhanced TPC and CGA levels, with total CGA concentrations increasing from 1412.32 to 2458.57 mg/L in LR samples and from 519.77 to 586.37 mg/L in DR samples. Fermentation also led to the isomerization of 5-CQA into 3-CQA and 4-CQA, as well as the release of caffeic acid in LAB-fermented samples. Acetic acid production was exclusive to SCOBY-fermented samples, with higher levels in LR samples (6658 mg/L) compared to DR samples (4331 mg/L). In contrast, lactic acid production was observed only in LAB-fermented samples, reaching 6559 mg/L in LR samples with spent coffee grounds. Antioxidant activity varied depending on the assay, with FRAP values decreasing in fermented samples, while DPPH values remained largely unchanged. Sensory evaluation identified the dark-roasted SCOBY-fermented sample with spent coffee grounds (SK) as the most preferred, characterized by balanced flavor and high overall acceptability. These findings highlight the influence of roasting degree, fermentation type, and substrate composition on the bioactive and sensory properties of fermented coffee, providing insights for the development of novel coffee-based fermented beverages with enhanced functional and sensory profiles.

1. Introduction

Coffee is one of the most widely consumed beverages globally, valued not only for its stimulating effects but also for its rich composition of bioactive compounds, including phenolic acids, flavonoids, and caffeine [1]. These compounds contribute to the antioxidant, anti-inflammatory, and neuroprotective properties of coffee, making it a functional beverage with potential health benefits [2]. However, the composition and bioactivity of coffee are highly influenced by factors such as the roasting degree, brewing method, and post-harvest processing [3]. In recent years, there has been growing interest in enhancing the functional and sensory properties of coffee through innovative processing techniques.
Fermentation is a traditional food processing method renowned for enhancing the nutritional and sensory qualities of various products. Specifically, fermentation with lac-tic acid bacteria (LAB) has been shown to increase the bioavailability of phenolic compounds and improve antioxidant activity. LAB can hydrolyze complex phenolic compounds into simpler and free forms, thereby enhancing the bioavailability and bioactivity of phenolic derivatives [4,5]. Additionally, LAB fermentation can modify the flavor profile of foods, leading to the development of unique sensory characteristics [6]. Similarly, fermentation using a symbiotic culture of bacteria and yeast (SCOBY) has been associated with increased phenolic content and antioxidant capacity. Kombucha, a beverage fermented with SCOBY, exhibits enhanced antioxidant properties attributed to the release of bioactive compounds during fermentation. Moreover, SCOBY fermentation contributes to the development of distinctive flavor profiles, enriching the sensory experience of the fermented product [7].
Spent coffee grounds (SCGs), a byproduct of coffee brewing, are rich in residual bioactive compounds, including phenolics, caffeine, and polysaccharides [8]. Incorporating SCGs into various processes not only provides a sustainable approach to waste valorization but also has the potential to enhance the functional properties of products. For instance, SCGs exhibit good water and oil-holding capacities, emulsion activity and stability, and antioxidant potential, making them suitable for various biotechnological applications in food and pharmaceutical products [9]. Furthermore, the roasting degree of coffee beans significantly impacts the composition of the substrate available for microbial fermentation, with roasting coffee leading to the formation of Maillard reaction products and melanoidins that can influence microbial activity and metabolite production [1].
Recent studies have begun to explore the potential of fermenting coffee with the SCOBY and LAB, though the literature remains limited. Bueno et al. [10] investigated the microbial diversity of kombucha-style fermented coffee, comparing samples produced with SCOBY alone to those additionally inoculated with Lactobacillus casei (LC) and L. rhamnosus (LG). Their findings highlighted the influence of microbial composition on fermentation outcomes, though the study did not explore the effects on bioactive compounds or sensory properties. In another study, Watawana et al. [11] reported that kombucha fermentation of coffee increased chlorogenic acid content, antioxidant activity (measured by DPPH and ORAC assays), and α-amylase inhibitory potential, suggesting that fermentation can enhance the functional properties of coffee. However, contrasting results were reported by Pavlović et al. [12], who found that fermented coffee exhibited significantly lower DPPH antioxidant activity and that fermentation had no effect on α-amylase inhibition. However, to the best of our knowledge, no studies have yet explored the fermentation of coffee brews prepared from light- and dark-roasted beans with SCOBY or LAB, nor have they investigated the effects of roasting degree, spent coffee grounds, and microbial fermentation on the bioactive and sensory properties of coffee.
This study aimed to investigate the effects of SCOBY and LAB fermentation on the physicochemical, microbial, and sensory properties of coffee brews prepared from light-roasted (LR) and dark-roasted (DR) coffee beans, with and without the addition of spent coffee grounds. Specifically, changes in total phenolic content (TPC), total flavonoid content (TFC), antioxidant activity (DPPH and FRAP), caffeine, and individual phenolic acids were analyzed at the onset (day 0) and after the fermentation period (day 14). The microbial dynamics of acetic acid bacteria (AAB), LAB, and yeast populations, as well as the production of organic acids (acetic and lactic acid), were also evaluated. Finally, sensory evaluations were conducted to assess the impact of fermentation on the acceptability of the coffee brews.

2. Materials and Methods

2.1. Materials

Colombian Arabica green coffee (Coffea arabica) beans were roasted using a commercial drum roaster at a local company in Mersin, Turkey. Beans from the same batch were subjected to light roasting at 180 °C for 10 min and dark roasting at 225 °C for 15 min (Figure 1). Lactobacillus plantarum ELB75 used in this study was isolated from sourdough [13]. SCOBY was obtained from a local producer (Kombuçça, Istanbul, Turkey) and was originally derived from green tea fermentation. The SCOBY was maintained in a sterile sweetened green tea medium at room temperature (25 ± 2 °C) until use. 5-caffeoylquinic acid (5-CQA), 4-caffeoylquinic acid (4-CQA), 3-caffeoylquinic acid (3-CQA), caffeic, ferulic, p-coumaric acids, gallic acid, caffeine, 2,2-Diphenyl-1-picrylhydrazyl radical (DPPH), Folin–Ciocalteu (FC), methanol, and ethyl acetate were bought from Sigma-Aldrich (Steinheim, Germany). Glucose yeast extract calcium carbonate (GYC) agar (Condalab, Madrid, Spain), MRS (De Man Rogosa Sharpe), and Saboraud dextrose agar (Merck, Darmstadt, Germany) were used.

2.2. Preparation of Fermented Coffee Beverages

Whole coffee beans, both dark and light-roasted, were ground and brewed (C) using a coffee machine (Delonghi Magnifica, Treviso, Italy). The grinding level was set to 5 (on a scale of 1 to 7, where 1 represents the finest and 7 the coarsest grind), and the brewing was performed in extra-strong mode. For each brew, 20.80 g of coffee beans were combined with 250 mL of water heated to 80 °C. Spent coffee grounds (SC), obtained as a residue from the brewing process, were incorporated into the C coffee to prepare SC coffee. Additionally, 17.5 g of granulated sugar (7% w/v) was dissolved in all samples, including both C and SC variants of light-roasted (LR) and dark-roasted (DR) coffee brews.
Before coffee samples were inoculated with either SCOBY (S) or Lactobacillus plantarum ELB75 (L), the coffee samples (C and SC) were cooled to room temperature for approximately 2 h. Lactobacillus plantarum ELB75 strains that had been stored at −80 °C were first activated by streaking them on MRS agar for 48 h, followed by incubation in 5 mL of MRS broth at 37 °C for 24 h. The cultures were then transferred to 50 mL of MRS broth and incubated for an additional 20 h. The cell pellets were centrifuged at 8600× g for 10 min at 4 °C. The harvested cells were washed with a NaCl solution (0.9%) and sterile distilled water afterward. The cell pellets were then suspended in 10 mL of sterile distilled water, and the suspensions were added to the coffee drinks at a level of 2% (v/v) to achieve the initial count of 109 CFU/mL. Prior to use, the SCOBY was rinsed with sterile distilled water, and approximately 150 g of it was introduced into 250 mL of coffee samples. The inoculated samples, covered with sterile cotton gauze, were placed in an air-circulated incubator and maintained at 25 °C for a period of 14 days. Upon completion of fermentation, the SCOBY was removed from the kombu coffee (K) and spent coffee added kombu coffee (SK) samples, and any remaining spent coffee grounds were filtered out from the SK and SL coffee brews (Figure 2). On the final day of incubation, samples were collected for microbiological analysis, organic acid quantification, and sensory evaluation. For additional analyses, the samples were preserved at −18 °C until further processing.

2.3. pH, Titratable Acidity (TA%), Organic Acid Determination

The pH levels of the samples were monitored daily during the incubation period (days 0, 1, 4, 6, 8, 11, and 14) using a pH meter (Hanna Instruments, Smithfield, VA, USA). Titratable acidity (TA%) of the samples was performed by titrating 10 mL of the sample with a 0.1 N NaOH solution until the pH reached 8.5, and the results were calculated using the following equation [14]:
TA % = (V × E × 100)/M
V was the spent volume of NaOH (mL); E was 0.006005 g for acetic acid; and M was the sample volume (mL).
Organic acid analysis was performed using a Shimadzu HPLC system equipped (Kyoto, Japan) with an LC-20A pump, DGU-20A5R degasser, SIL-20A HT autosampler, CTO-10ASVP column oven, SPD-20A UV-VIS detector, and CMB-20A communication module. The mobile phase consisted of 0.2 M of KH2PO4 (pH 2.4), delivered at a flow rate of 0.8 mL/min. Filtered samples (10 µL) were injected into an Inert Sustain C18 column (5 µm, 4.6 × 250 mm). Organic acid concentrations were quantified based on calibration curves generated from relevant standards [15], and the results were expressed in mg/L for the coffee beverages.

2.4. Enumeration of Lactic Acid Bacteria (LAB), Acetic Acid Bacteria (AAB), and Yeast

For microbial analysis, 10 mL of coffee samples were serially diluted with 90 mL of sterile peptone water. To enumerate acetic acid bacteria (AAB), the diluted samples were spread onto GYC agar medium and incubated at 30 °C for 5 day. After incubation, cream-colored colonies surrounded by a clear precipitation zone were counted and recorded as AAB [16]. For lactic acid bacteria (LAB) enumeration, MRS agar medium was used, and the plates were incubated at 37 °C for 48 h. Yeast counts were determined by plating on Saboraud dextrose agar, followed by incubation at 30 °C for 48 h [13].

2.5. Bioactive Compound Analysis

2.5.1. Total Phenolic Content (TPC) and Total Flavonoid Content (TFC)

The total phenolic content (TPC) of the samples was determined using the Folin–Ciocalteu (FC) reagent method, as described by Singleton and Rossi [17]. Briefly, 0.5 mL of the sample was mixed with 2.5 mL of 0.2 N FC reagent and 2 mL of a 7.5% (w/v) sodium carbonate (Na2CO3) solution. The mixture was incubated in the dark at room temperature for 30 min, and the absorbance was measured at 760 nm using Shimadzu 150 UV-1800 spectrophotometer (Kyoto, Japan). The results were expressed as milligrams of gallic acid equivalents (GAEs) per milliliter of coffee samples (mg GAE/mL).
The total flavonoid content (TFC) was determined according to the method of Yener et al. [18]. A sample aliquot (1 mL) was mixed with 4 mL of distilled water, 0.3 mL of 5% sodium nitrite (NaNO2), and 0.3 mL of 10% aluminum chloride (AlCl3) solution. After incubation for 6 min, 2 mL of 1 M sodium hydroxide (NaOH) was added, and the final volume was adjusted to 10 mL with distilled water. The absorbance was measured at 510 nm, and the results were reported as milligrams of catechin equivalents (CEs) per milliliter of coffee samples (mg CE/mL).

2.5.2. Antioxidant Activity Assessment

The DPPH radical scavenging activity was performed according to the method of Brand-Williams et al. [19]. A mixture of 4.9 mL of 0.1 mM DPPH solution and 0.1 mL of the sample was incubated in the dark at room temperature for 20 min, and the absorbance was measured at 517 nm by spectrophotometer (Shimadzu 150 UV-1800, Kyoto, Japan).
The ferric reducing antioxidant power (FRAP) assay was performed according to Benzie and Strain [18]. A mixture of 100 µL of the sample, 900 µL of water, and 2 mL of FRAP reagent was incubated in the dark at room temperature for 30 min, and the absorbance was measured at 593 nm. The results for both assays were expressed as milligrams of Trolox equivalents (TEs) per milliliter of coffee (mg TE/mL).

2.5.3. HPLC Analysis of Phenolic Compounds

Phenolic compounds were analyzed using a high-performance liquid chromatography (HPLC) system (Shimadzu Corp., Kyoto, Japan) equipped with an LC-20AD pump, SIL-20A HT autosampler, CTO-10ASVP column oven, DGU-20A5R degasser, and CMB-20A communications bus module, coupled to an SPD-M20A diode array detector. Separation was performed at 40 °C on an Inertsil ODS-3 C18 reversed-phase column (250 × 4.6 mm, 5 µm particle size, GL Sciences, Tokyo, Japan) with an Inertsil ODS-3 guard column (10 × 4 mm, 5 µm particle size, GL Sciences, Tokyo, Japan). The mobile phase consisted of solvent A (Milli-Q water with 0.1% v/v trifluoroacetic acid, TFA) and solvent B (acetonitrile with 0.1% v/v TFA). A linear gradient elution was applied as follows: 95% solvent A at 0 min, 65% solvent A at 50 min, 25% solvent A at 52 min, and a return to initial conditions at 59 min. The flow rate was maintained at 1 mL/min [19]. Chromatograms were recorded at wavelengths of 274, 310, 322, 323, and 325 nm. Identification and quantification of phenolic compounds were achieved using retention times and external standard curves. The results were reported as milligrams per liter of coffee (mg/L) [20].

2.6. Sensory Evaluation

Sensory analyses of the fermented coffee brews were conducted on the 14th day of fermentation. The evaluation focused on several attributes, including appearance, sourness, astringency, palatability, odor, mouthfeel, and overall acceptability. A panel of 15 participants (9 women and 6 men), aged between 25 and 45 years, was selected for the sensory test. Prior to the evaluation, panelists were briefed about the samples and the testing procedure. A 5-point hedonic scale was used for scoring, where 1 indicated “dislike very much”, 2 “dislike slightly”, 3 “neither like nor dislike”, 4 “like slightly”, and 5 “like very much” [21]. To ensure unbiased results, the coffee samples were presented in a randomized order and labeled with three-digit codes. Before tasting each sample, panelists cleansed their palates with spring water to eliminate any residual flavors.

2.7. Statistical Analysis

All experiments were performed in triplicate using duplicated samples, and the results are presented as the mean values ± standard deviation. Statistical analysis was carried out with Minitab 17.3.1 (Minitab Inc., State College, PA, USA). The means of the same sample groups (non-fermented C and SC, and the fermented L, K, SK, SL coffees) for analyzed parameters were compared by one-way analysis of variance (ANOVA) followed by Tukey’s multiple comparison test.

3. Results and Discussion

3.1. pH, Titratable Acidity (TA%), Organic Acid Contents of the Coffee Samples

The optimal fermentation time for kombucha tea varies depending on desired characteristics and fermentation conditions. Studies have suggested a range of 4–14 days, with 7–10 days often yielding favorable results. However, longer fermentation periods (15–20 days) may result in higher polyphenol content but lower sensory acceptance due to increased acidity [22]. In our study, the coffee samples were subjected to a 14-day fermentation process. The pH of kombucha generally ranges from 2.9 to 4.5, with longer fermentation periods resulting in lower pH levels (Table 1). The pH values of non-fermented C and SC samples were measured as 5.10, 5.19 for LR coffee brews and 5.70, 5.89 for DR coffee brews, respectively. The pH of the fermented coffees varied depending on the inoculation culture in each coffee bean group, ranging from 3.39 to 4.62 in LR samples and from 3.29 to 5.25 in DR samples on the 14th day. These results are consistent with previous studies on kombucha-fermented coffee. Bueno et al. fermented coffee brews with a SCOBY for 8 days and reported a pH decrease from 4.01 to 3.51 [10]. Similarly, Watawana et al. fermented fine ground coffee brews with a SCOBY for 7 days and observed a pH reduction from 5.0 to 4.1 [11]. Following a 24 h period of incubation, a more pronounced pH reduction was observed in the K incubated samples for both coffee types, with this reduction maintaining a consistent pattern throughout the incubation period. Samples inoculated with L exhibited a lower pH decrease on the first day, which gradually declined over the course of incubation. The pH level of the L-fermented DR coffees did not demonstrate as dramatic a decrease as the other samples by the end of the fermentation. However, the addition of spent coffee grounds to the coffee brews resulted in enhanced pH reduction capacity of L. plantarum ELB75. This could be explained by the presence of additional fermentable substrates in SCGs, which might promote bacterial metabolism and acid production. Previous studies have highlighted the potential of SCGs as a fermentation substrate due to its rich composition of bioactive compounds [23], which can influence microbial activity and metabolic pathways during fermentation.
TA values of the coffee samples are given in Table 2. In the LR samples, SK had the highest TA value (7.3%) followed by samples inoculated with K (5.6%) by the end of the fermentation. Among the samples prepared from DR coffee beans, K-inoculated coffee brews exhibited the highest TA with 5.2%. In this sample, TA levels remained relatively stable between days 1 and 8 of fermentation and increased thereafter. In both coffee types, the TA levels of L-inoculated samples were lower than those of the K-inoculated ones. This trend was also observed in the organic acid results.
Acetic acid is the primary metabolite in kombucha production due to the activity of acetic acid bacteria (AAB) present in the symbiotic culture of bacteria and yeast (SCOBY) [24,25]. Lactic acid bacteria (LAB), on the other hand, contribute to the production of both lactic and acetic acid through homofermentative and heterofermentative pathways [26]. Given the significance of these organic acids in determining the sensory and functional properties of fermented beverages, this study focused on quantifying their production in fermented coffee samples. The concentrations of acetic acid and lactic acid in the fermented coffee samples are presented in Figure 3. At the end of fermentation, acetic acid production was detected exclusively in K-fermented coffee samples. Acetic acid levels in K and SK coffee brews were similar in LR coffee beans (6658 mg/L). In DR samples, acetic acid levels were measured at 4331 mg/L in K-fermented coffee, while this value decreased to 2797 mg/L when K fermentation was performed with spent coffee grounds. In previous studies on kombucha fermentation, different substrate sources have been reported to result in varying levels of acetic acid production [27,28,29]. The composition of the fermentation medium has been shown to significantly influence the metabolic activity of acetic acid bacteria (AAB), as specific substrate types can enhance acetic acid production [30]. This aligns with the observed differences in acetic acid production between light and dark-roasted coffee samples in this study. In both coffee types, lactic acid production was not detected in K-fermented samples. It can be attributed to the competitive interactions between LAB, AAB, and yeast within the SCOBY consortium. The dominance of acetic acid bacteria (AAB) as the primary microflora in a SCOBY [31] may have inhibited the ability of LAB to produce lactic acid. This could be attributed to the competitive advantage of AAB in acidic environments and their efficient utilization of available nutrients, which often limit the growth and metabolic activity of LAB in traditional kombucha fermentation systems [30]. However, the presence of lactic acid in L-fermented samples highlights the role of LAB in acid production under specific conditions. Although lactic acid was not detected in low-roasted coffee samples inoculated with L, its concentration reached 6559 mg/L in the SL sample. In DR coffee brews, lactic acid production was observed at levels of 3516 mg/L and 3310 mg/L in L and SL samples, respectively.

3.2. Cell Counts of Lactic Acid Bacteria (LAB), Acetic Acid Bacteria (AAB), and Yeast

The three major microbial communities examined in prior studies on kombucha were acetic acid bacteria, lactic acid bacteria, and yeasts [31]. Approximately 9.7 log CFU/mL of lactic acid bacteria (LAB) were inoculated into the L-fermented samples. By the end of the 14-day fermentation period, LAB counts remained stable in the L-fermented LR coffee samples (9.64 log CFU/mL), while a slight decline was observed in the fermented SL samples (Figure 4). However, no significant difference was detected between dark-roasted L and SL samples. In the coffee brewed with DR samples, LAB counts decreased from 9.8 log CFU/mL to 8.69 and 8.83 log CFU/mL in L and SL, respectively, by the end of fermentation. Di Cagno et al. (2013) reported that LAB counts remained stable during the fermentation of vegetable-based substrates, provided that the pH and nutrient availability were maintained within favorable ranges [32]. This suggests that similar conditions could support LAB stability in other fermentation systems, including coffee-based substrates. In coffee samples fermented with a SCOBY (K), LAB counts were significantly lower than those in L-fermented samples. LAB counts increased from 6.66 log CFU/mL to 7.69 log CFU/mL when spent coffee grounds were incorporated into the K-fermented LR coffees. In dark-roasted L and SL samples, LAB counts were similar, with values of 8.69 and 8.73 log CFU/mL, respectively. Additionally, the higher LAB counts in SL samples compared to L samples may be explained by the presence of residual nutrients in spent coffee grounds, which could support LAB growth to a limited extent. Spent coffee grounds can serve as a potential substrate for microbial fermentation due to their residual polysaccharides and proteins [8]. The relatively stable LAB counts in light-roasted coffee samples in this study suggest that the composition of the substrate and the fermentation conditions play a critical role in determining microbial dynamics. The roasting degree of coffee beans significantly influences the availability of fermentable sugars and other nutrients, thereby affecting microbial growth and metabolism [2,33].
Acetic acid bacteria (AAB) were detected only in samples fermented with a SCOBY. In the light-roasted coffee group, AAB counts were 4.47 log CFU/mL in K samples and 4.23 log CFU/mL in SK samples. In the dark-roasted group, these values were 3.73 and 4.21 log CFU/mL, respectively. AAB exhibited lower growth in the dark-roasted K sample, while no significant differences were observed among the other samples. AAB counts in kombucha typically range between 4 and 9 log CFU/mL, depending on the substrate, fermentation conditions, and geographical region [24]. The lower AAB growth in the dark-roasted K sample (3.73 log CFU/mL) compared to the light-roasted K sample (4.47 log CFU/mL) may be attributed to the inhibitory effects of compounds formed during the roasting process. The roasting degree of coffee beans significantly influences the availability of nutrients and the presence of inhibitory compounds, thereby affecting microbial growth [2,33]. The absence of significant differences in AAB counts between the light-roasted SK sample (4.23 log CFU/mL) and the dark-roasted SK sample (4.21 log CFU/mL) indicates that the addition of spent coffee grounds may positively influence microbial growth in dark-roasted coffee. This could be attributed to the residual nutrients present in spent coffee grounds, which may support microbial growth to some extent [8]. Spent coffee grounds are known to be sugar-rich lignocellulosic materials composed of high levels of insoluble, soluble, and total dietary fibers, providing a favorable environment for microbial activity [9].
Yeast counts in coffee samples were detected only in K samples. Yeast populations are a critical component of the SCOBY consortium and are primarily responsible for the initial production of ethanol, which serves as a substrate for AAB [31]. In the light-roasted coffee group, yeast counts were 3.68 log CFU/mL in K samples and 3.88 log CFU/mL in SK samples, while, in the dark-roasted group, these values were 4.46 and 3.85 log CFU/mL, respectively. While acetic acid bacteria (AAB) exhibited the lowest growth in the dark-roasted K sample, yeast counts showed the opposite trend, with the highest levels observed in this sample. In previous studies, yeast counts in kombucha typically ranged between 3 and 7 log CFU/mL, depending on the substrate and fermentation conditions [34,35,36]. The higher yeast counts in the dark-roasted K sample (4.46 log CFU/mL) compared to the light-roasted K sample (3.68 log CFU/mL) may be attributed to the availability of carbon sources that promote yeast growth. The dark roasting of coffee beans leads to the formation of oligosaccharides with increased size, structural isomer diversity, and abundance, which can serve as additional carbon sources for microbial activity, including yeast [37].

3.3. TPC, TFC, Antioxidant Activities, Caffeine, and Phenolic Constituents of Samples

The TPC, TFC, and antioxidant activities (DPPH and FRAP) of samples are given in Table 3. The initial TPC (2.74 mg GAE/mL) and TFC (6.78 mg CE/mL) in non-fermented control coffee brewed from light-roasted beans were significantly higher than the values for dark-roasted beans, which were 0.52 mg GAE/mL and 1.87 mg CE/mL, respectively. Compared to DR beans, the antioxidant activities of samples brewed from LR beans were also higher, particularly noticeable in FRAP values. The different trend noted between the FRAP and DPPH assays might be attributed to their antioxidant mechanisms. The FRAP assay functions through single-electron transfer (SET) and could provide an overall picture of oxidation/reduction in all antioxidants present in the sample, whereas DPPH was reported to function through SET and hydrogen atom transfer [38]. Vignoli et al. [3] also reported that roasting led to the degradation of chlorogenic acids, while antioxidant activity remained largely unchanged depending on the assay employed. When chain-breaking activity (DPPH) and redox potential values of the freshly prepared light-, medium-, and dark-roasted coffee brews were compared previously, the brewing process strongly affected the redox potential than the chain-breaking activity [39].
The caffeine content and individual phenolic acids of our samples are also presented in Table 4. The primary phenolic acids detected were 5-caffeoylquinic acid (5-CQA), 4-caffeoylquinic acid (4-CQA), and 3-caffeoylquinic acid (3-CQA), with concentration ranked as 5-CQA > 4-CQA > 3-CQA. All determined CQA values were higher in non-fermented control light-roasted coffee brews (285.23–681.02 mg/L), compared to dark-roasted counterparts (106.04–232.67 mg/L). Chlorogenic acids (CGAs) are major thermolabile constituents of coffee beans that undergo degradation during roasting through a series of reactions including isomerization, lactonization, and partial hydrolysis [2].
Following the addition of spent coffee grounds to their control, significantly elevated TPC values were measured in the SC samples of both LR and DR beans (Table 3). However, the rise in TFC was only significant in the SC samples of DR beans. Spent coffee grounds, which account for 48% of the total ground coffee beans, have demonstrated considerable potential for the extraction of high-value bioactive components, including phenolic compounds [40]. Non-inoculated coffees with spent coffee grounds from LR and DR beans exhibited higher amounts of individual phenolic acids compared to their control, depending on the roasting status (Table 4). The total CQA concentration of coffee brew from LR beans increased from 1412.32 to 2458.57 mg/L with the addition of spent coffee grounds, whereas it rose from 519.77 to 586.37 mg/L in the samples from DR beans. In addition to phenolics, spent coffee grounds may contain other water-soluble components such as caffeine, trigonelline, and Maillard reaction products [41], which could exhibit antioxidant properties [42]; therefore, their incorporation into control coffees could enhance the antioxidant activities depending on the roasting status of beans.
The fermentation of control coffee brews of LR and DR beans with L or K for 14 days resulted in significantly higher TPC values (Table 3). The elevation of TPC of kombucha tea during the course of fermentation had also been reported in previous studies [43]. However, the increase in TPC also revealed itself in the content of CQAs (Table 4), particularly apparent in fermented brews of LR beans, especially regarding the concentration of 5-CQA. For example, the L and K inoculation of LR coffee brews elevated 5-CQA content from 681.02 mg/L to 754.72 and 709.71 mg/L, respectively. Sales et al. [44] also reported similar findings regarding kombucha beverages produced through coffee cascara infusion. This result may be ascribed to the degradation of large molecular polyphenols in coffee into smaller monomers or the conversion of insoluble-bound polyphenols into soluble free polyphenols by enzymes generated by the microorganisms [45].
The increased concentrations of CGAs in fermented coffee brews, specifically in LR beans, may be attributed to the release of chlorogenic acids integrated into Maillard reaction products formed during the roasting of coffee beans. Previous studies suggested that both intact CGA and its subunits, quinic and caffeic acids, were incorporated in the structure of melanoidins at varying levels during roasting, as their content in coffee brew could be up to 25% of the dry matter. For example, the level of acrylamide was reported as 400 μg/kg in unbrewed coffee grounds and varied from 6 to 16 μg/L in brewed coffees [46]. In a study conducted by Albedwawi et al. [47], the potential of 40 isolates was screened for their reduction potential of acrylamide; L. plantarum demonstrated the highest capability of acrylamide reduction (36%). When Akillioglu and Gokmen [48] solubilized instant coffee and sugar and inoculated the mixture with S. cerevisiae at 30 °C, acrylamide concentration showed an exponential decay during a 24 h long fermentation period, depending on the concentrations of sugar and yeast.
Compared to their control, the increase of 3-CQA and 4-CQA in all fermented samples could also be related to the isomerization of 5-CQA during the incubation period. Similarly, Huang et al. [45] reported a significant increase in 3-CQA and 4-CQA concentrations in their samples.
A significant increase in caffeic acid was also detected in only L-inoculated samples in both coffee beans. Coffee is a rich source of chlorogenic acids (CGAs), a diverse family of esters formed between quinic acid and certain phenolic acids, mainly hydroxycinnamic acids such as caffeic (CA), ferulic (FA), and p-coumaric acids. Previously, Lactobacillus species, including L. fermentum, L. plantarum, L. reuteri, L. johnsonii, L. helveticus, L. acidophilus, and L. rahmnosus, have been reported to have cinnamoyl esterase enzymes that hydrolyze the ester bond, resulting in the release of caffeic acid [49,50,51]. In different studies, CGA lactones, the heat-induced transformation product of CGA, were also hydrolyzed by esterase enzymes [52,53].
Compared to their inoculated control, TFC and FRAP values were substantially reduced (p < 0.05), while DPPH values were largely unaffected in fermented samples. Similar to our findings, Huang et al. [45] reported a significant increase in TPC and a significant reduction in TFC in kombucha prepared by coffee leaves. When the fermented samples prepared with added spent coffee grounds of both beans, TPC, TFC and FRAP values were all decreased by fermentation. The change in DPPH values depended on the bean type, it did not change in DR beans, whereas it was significantly reduced in LR beans. Fermentation occurred under aerobic conditions at 25 °C, during which coffee samples underwent oxidation reactions that could generate radicals in coffee beverages, resulting in the formation of nonradical forms and the generation of other chemically distinct radical species from those initially present [39].
The caffeine concentrations of control coffees brewed from LR and DR beans were at similar levels (873.84 and 900.49 mg/L, respectively). This result was in agreement with previous studies [54,55]. The caffeine concentration of coffee samples having spent LR coffee grounds increased to 1345.71 mg/L, whereas it did not change with the addition of spent DR coffee grounds (904.14 mg/L). This increase could be related to the extraction of residual caffeine remained in the spent coffee grounds. Fermented coffee brews had a variable trend in their caffeine content depending on the substrate and inoculation (Table 4). For example, compared to their controls, both of the L-fermented coffee brews had a higher amount of caffeine, and K-fermented LR coffees had a lower amount of caffeine. Earlier studies related to the caffeine content of Kombucha teas had varying results. Meanwhile, the study conducted by Kallel et al. [29] indicated that the caffeine content remains relatively stable throughout the fermentation. On the other hand, the caffeine concentration was increased around 44% in coffee cascara beverage during 9 days of fermentation [44], attributed to the release of caffeine from its complex formed with CGA [56].

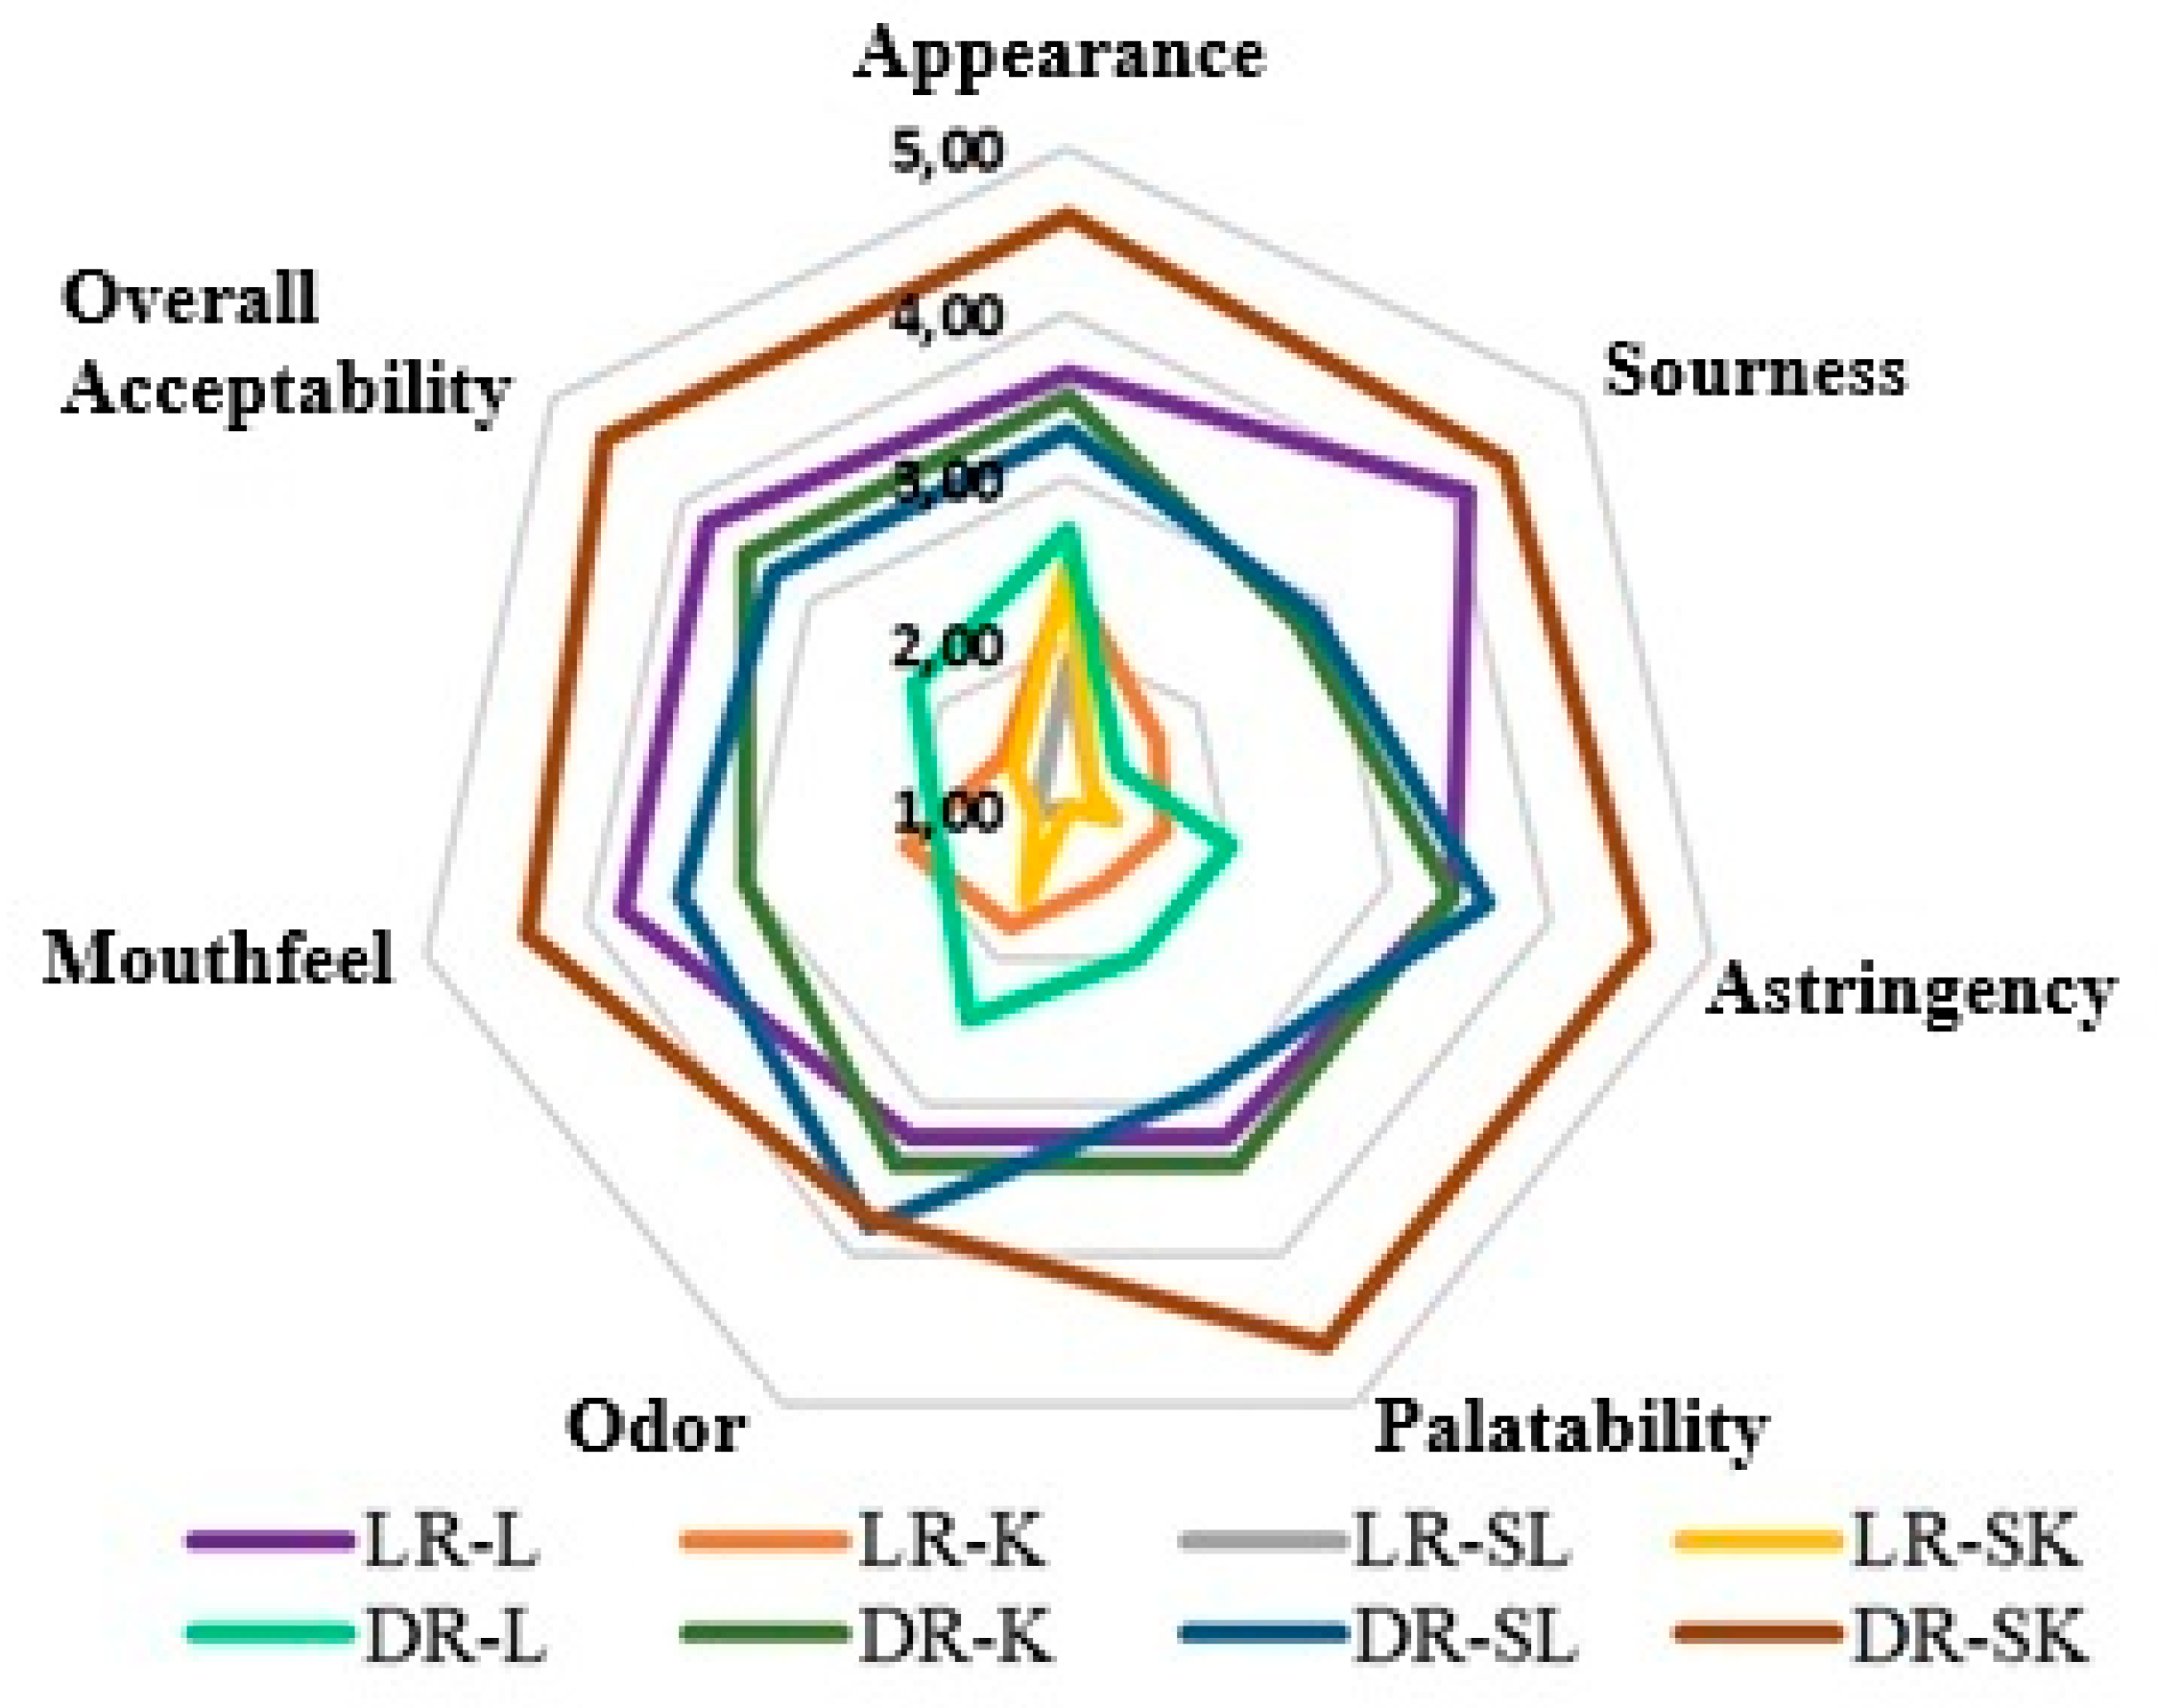
3.4. Sensory Evaluation of Coffee Samples

The results of sensory analyses of the coffee samples are presented in Figure 5. Panelists evaluated the samples according to appearance, sourness, astringency, palatability, odor, mouthfeel, and overall acceptability. The highest-rated sample across all sensory parameters was the dark-roasted SK sample. Panelists described most samples as sour, with the exception of the light-roasted L and the dark-roasted SK samples, which were perceived as more balanced in flavor. In terms of palatability, the L-fermented LR coffee brews received the second-highest score, following the dark-roasted SK sample.
When considering the coffee type, DR samples generally received higher scores for overall acceptability. Within this group, samples inoculated with L had significantly lower mouthfeel scores compared to other DR coffee samples (p < 0.05). The superior sensory performance of the dark-roasted SK sample aligns with previous studies that have emphasized the role of roasting and fermentation in enhancing the flavor complexity of coffee. Additionally, the use of spent coffee grounds in the SK sample likely provided residual nutrients that supported microbial activity, leading to a more balanced and palatable product. The sensory performance of the dark-roasted samples may also be attributed to the formation of Maillard reaction products. The Maillard reaction is a key factor to consider in sensory evaluation, as it significantly influences the development of color, flavor, and aroma during thermal processing, ultimately shaping the organoleptic properties of the final product. This reaction produces various intermediate compounds, such as Schiff bases and α-dicarbonyls, which further contribute to the formation of advanced glycation end products (AGEs) [57]. Notably, 3-deoxyglucosone (3-DG) and methylglyoxal (MGO), which are recognized as precursors of aroma-active compounds [58], were identified in coffee [59]. The sour taste reported in most samples is characteristic of fermented beverages and is primarily attributed to the production of organic acids, such as acetic and lactic acid, by microbial activity. Considering the organic acid results, it was observed that the samples evaluated as sour by the panelists were those with higher organic acid production. In the preferred dark-roasted SK sample, acetic acid production was statistically lower compared to the other samples (p < 0.05). The higher overall acceptability of dark-roasted samples observed in this study is in line with consumer preferences for darker roasts, which are often associated with stronger and more complex flavors.

4. Conclusions

This study demonstrated that fermentation with a SCOBY and lactic acid bacteria (LAB) significantly alters the physicochemical, microbial, and sensory properties of coffee brews, with the effects highly dependent on the roasting degree of the beans and the addition of spent coffee grounds. Light-roasted (LR) coffee brews exhibited higher total phenolic content (TPC) and chlorogenic acid (CGA) concentrations compared to dark-roasted (DR) brews, with fermentation further enhancing these values. Acetic acid production was exclusive to SCOBY-fermented samples, while LAB fermentation led to significant lactic acid production, particularly in samples with spent coffee grounds. Microbial analysis revealed that LAB populations remained stable in LR samples but declined in DR samples, whereas yeast counts were highest in DR SCOBY-fermented samples, likely due to the availability of Maillard reaction products as carbon sources. Sensory evaluation identified the dark-roasted SCOBY-fermented sample with spent coffee grounds (SK) as the most preferred, owing to its balanced flavor profile and high overall acceptability. These results underscore the importance of substrate composition and fermentation conditions in shaping the bioactive and sensory properties of fermented coffee. The findings provide valuable insights for optimizing fermentation processes to develop novel coffee-based fermented beverages with enhanced functional and sensory attributes. Future studies should explore the impact of different fermentation durations and microbial consortia to further refine the production of fermented coffee products. Furthermore, future studies should investigate the role of Maillard reaction products in fermented coffee, as these compounds, formed during the roasting process, may significantly influence the flavor, aroma, and bioactive properties of the final product. Understanding their interaction with microbial activity during fermentation could provide valuable insights for optimizing the functional and sensory qualities of fermented coffee beverages.

Funding

This research received no external funding.

Institutional Review Board Statement

Not applicable.

Informed Consent Statement

Not applicable.

Data Availability Statement

The original contributions presented in this study are included in the article. Further inquiries can be directed to the corresponding author.

Acknowledgments

This research received no specific grant from any funding agency in the public, commercial, or not-for-profit sectors.

Conflicts of Interest

The author declare no conflict of interest.

References

  1. Ludwig, I.A.; Clifford, M.N.; Lean, M.E.J.; Ashihara, H.; Crozier, A. Coffee: Biochemistry and Potential Impact on Health. Food Funct. 2014, 5, 1695–1717. [Google Scholar] [PubMed]
  2. Perrone, D.; Farah, A.; Donangelo, C.M. Influence of Coffee Roasting on the Incorporation of Phenolic Compounds into Melanoidins and Their Relationship with Antioxidant Activity of the Brew. J. Agric. Food Chem. 2012, 60, 4265–4275. [Google Scholar] [CrossRef] [PubMed]
  3. Vignoli, J.A.; Bassoli, D.G.; Benassi, M.T. Antioxidant Activity, Polyphenols, Caffeine and Melanoidins in Soluble Coffee: The Influence of Processing Conditions and Raw Material. Food Chem. 2011, 124, 863–868. [Google Scholar] [CrossRef]
  4. De Montijo-Prieto, S.; Razola-Díaz, M.d.C.; Barbieri, F.; Tabanelli, G.; Gardini, F.; Jiménez-Valera, M.; Ruiz-Bravo, A.; Verardo, V.; Gómez-Caravaca, A.M. Impact of Lactic Acid Bacteria Fermentation on Phenolic Compounds and Antioxidant Activity of Avocado Leaf Extracts. Antioxidants 2023, 12, 298. [Google Scholar] [CrossRef]
  5. Filannino, P.; Bai, Y.; Di Cagno, R.; Gobbetti, M.; Gänzle, M.G. Metabolism of Phenolic Compounds by Lactobacillus spp. during Fermentation of Cherry Juice and Broccoli Puree. Food Microbiol. 2015, 46, 272–279. [Google Scholar] [CrossRef]
  6. Wang, L.; Zhang, H.; Lei, H. Phenolics Profile, Antioxidant Activity and Flavor Volatiles of Pear Juice: Influence of Lactic Acid Fermentation Using Three Lactobacillus Strains in Monoculture and Binary Mixture. Foods 2022, 11, 11. [Google Scholar] [CrossRef]
  7. Jakubczyk, K.; Łopusiewicz, Ł.; Kika, J.; Janda-Milczarek, K.; Skonieczna-Żydecka, K. Fermented Tea as a Food with Functional Value—Its Microbiological Profile, Antioxidant Potential and Phytochemical Composition. Foods 2024, 13, 50. [Google Scholar] [CrossRef]
  8. Murthy, P.S.; Madhava Naidu, M. Sustainable Management of Coffee Industry By-Products and Value Addition—A Review. Resour. Conserv. Recycl. 2012, 66, 45–58. [Google Scholar]
  9. Ballesteros, L.F.; Teixeira, J.A.; Mussatto, S.I. Chemical, Functional, and Structural Properties of Spent Coffee Grounds and Coffee Silverskin. Food Bioproc. Technol. 2014, 7, 3493–3503. [Google Scholar] [CrossRef]
  10. Bueno, F.; Chouljenko, A.; Sathivel, S. Development of Coffee Kombucha Containing Lactobacillus rhamnosus and Lactobacillus casei: Gastrointestinal Simulations and DNA Microbial Analysis. LWT 2021, 142, 110980. [Google Scholar] [CrossRef]
  11. Watawana, M.I.; Jayawardena, N.; Waisundara, V.Y. Enhancement of the Functional Properties of Coffee Through Fermentation by “Tea Fungus” (Kombucha). J. Food Process Preserv. 2015, 39, 2596–2603. [Google Scholar] [CrossRef]
  12. Pavlović, M.O.; Stajić, M.; Gašić, U.; Duletić-Laušević, S.; Ćilerdžić, J. The Chemical Profiling and Assessment of Antioxidative, Antidiabetic and Antineurodegenerative Potential of Kombucha Fermented Camellia sinensis, Coffea arabica and Ganoderma lucidum Extracts. Food Funct. 2022, 14, 262–276. [Google Scholar] [CrossRef] [PubMed]
  13. Yildirim, R.M.; Arici, M. Effect of the Fermentation Temperature on the Degradation of Phytic Acid in Whole-Wheat Sourdough Bread. LWT 2019, 112, 108224. [Google Scholar] [CrossRef]
  14. Karadag, A.; Bozkurt, F.; Bekiroglu, H.; Sagdic, O. Use of Principal Component Analysis and Cluster Analysis for Differentiation of Traditionally-Manufactured Vinegars Based on Phenolic and Volatile Profiles, and Antioxidant Activity. Pol. J. Food Nutr. Sci. 2020, 70, 347–360. [Google Scholar] [CrossRef]
  15. Karadag, A.; Ozkan, K.; Sagdic, O. Development of Microencapsulated Grape Juice Powders Using Black ‘Isabel’ Grape Peel Pectin and Application in Jelly Formulation with Enhanced in Vitro Bioaccessibility of Anthocyanins. J. Food Sci. 2024, 89, 2067–2083. [Google Scholar] [CrossRef]
  16. Kim, D.H.; Chon, J.W.; Kim, H.; Seo, K.H. Development of a Novel Selective Medium for the Isolation and Enumeration of Acetic Acid Bacteria from Various Foods. Food Control 2019, 106, 106717. [Google Scholar] [CrossRef]
  17. Singleton, V.L.; Rossi, J.A. Colorimetry of Total Phenolics with Phosphomolybdic-Phosphotungstic Acid Reagents. Am. J. Enol. Vitic. 1965, 16, 144–158. [Google Scholar] [CrossRef]
  18. Yener, E.; Saroglu, O.; Sagdic, O.; Karadag, A. The Effects of Different Drying Methods on the In Vitro Bioaccessibility of Phenolics, Antioxidant Capacity, and Morphology of European Plums (Prunes domestica L.). ACS Omega 2023, 9, 12711–12724. [Google Scholar] [CrossRef]
  19. Brand-Williams, W.; Cuvelier, M.E.; Berset, C. Use of a Free Radical Method to Evaluate Antioxidant Activity. LWT Food Sci. Technol. 1995, 28, 25–30. [Google Scholar] [CrossRef]
  20. Yang, Z.; Qin, C.; Weng, P.; Zhang, X.; Xia, Q.; Wu, Z.; Liu, L.; Xiao, J. In Vitro Evaluation of Digestive Enzyme Inhibition and Antioxidant Effects of Naked Oat Phenolic Acid Compound (OPC). Int. J. Food Sci. Technol. 2020, 55, 2531–2540. [Google Scholar] [CrossRef]
  21. Zhi, R.; Zhao, L.; Shi, J. Improving the Sensory Quality of Flavored Liquid Milk by Engaging Sensory Analysis and Consumer Preference. J. Dairy Sci. 2016, 99, 5305–5317. [Google Scholar] [CrossRef]
  22. Fernando dos Santos, D.; Leonarski, E.; Araújo Rossoni, M.; Alves, V.; Tavares dos Passos Francisco, C.; Zanella Pinto, V.; Bergler Bitencourt, T. Honey-Kombucha Beverage with Yerba Maté Infusion: Development, Polyphenols Profile, and Sensory Acceptance. Int. J. Gastron. Food Sci. 2024, 36, 100909. [Google Scholar] [CrossRef]
  23. Milić, M.D.; Buntić, A.V.; Mihajlovski, K.R.; Ilić, N.V.; Davidović, S.Z.; Dimitrijević-Branković, S.I. The Development of a Combined Enzymatic and Microbial Fermentation as a Viable Technology for the Spent Coffee Ground Full Utilization. Biomass Convers. Biorefin. 2023, 13, 6747–6759. [Google Scholar] [CrossRef]
  24. Freitas, A.; Sousa, P.; Wurlitzer, N. Alternative Raw Materials in Kombucha Production. Int. J. Gastron. Food Sci. 2022, 30, 100594. [Google Scholar] [CrossRef]
  25. Ojo, A.O.; de Smidt, O. Microbial Composition, Bioactive Compounds, Potential Benefits and Risks Associated with Kombucha: A Concise Review. Fermentation 2023, 9, 472. [Google Scholar] [CrossRef]
  26. Gänzle, M.G. Lactic Metabolism Revisited: Metabolism of Lactic Acid Bacteria in Food Fermentations and Food Spoilage. Curr. Opin. Food Sci. 2015, 2, 106–117. [Google Scholar] [CrossRef]
  27. Aung, T.; Eun, J.B. Production and Characterization of a Novel Beverage from Laver (Porphyra Dentata) through Fermentation with Kombucha Consortium. Food Chem. 2021, 350, 129274. [Google Scholar] [CrossRef]
  28. Malbaša, R.; Lončar, E.; Djurić, M.; Došenović, I. Effect of Sucrose Concentration on the Products of Kombucha Fermentation on Molasses. Food Chem. 2008, 108, 926–932. [Google Scholar] [CrossRef]
  29. Kallel, L.; Desseaux, V.; Hamdi, M.; Stocker, P.; Ajandouz, E.H. Insights into the Fermentation Biochemistry of Kombucha Teas and Potential Impacts of Kombucha Drinking on Starch Digestion. Food Res. Int. 2012, 49, 226–232. [Google Scholar] [CrossRef]
  30. Jayabalan, R.; Malbaša, R.V.; Lončar, E.S.; Vitas, J.S.; Sathishkumar, M. A Review on Kombucha Tea-Microbiology, Composition, Fermentation, Beneficial Effects, Toxicity, and Tea Fungus. Compr. Rev. Food Sci. Food Saf. 2014, 13, 538–550. [Google Scholar] [CrossRef]
  31. Marsh, A.J.; O’Sullivan, O.; Hill, C.; Ross, R.P.; Cotter, P.D. Sequence-Based Analysis of the Bacterial and Fungal Compositions of Multiple Kombucha (Tea Fungus) Samples. Food Microbiol. 2014, 38, 171–178. [Google Scholar] [CrossRef]
  32. Di Cagno, R.; Coda, R.; De Angelis, M.; Gobbetti, M. Exploitation of Vegetables and Fruits through Lactic Acid Fermentation. Food Microbiol. 2013, 33, 1–10. [Google Scholar] [CrossRef] [PubMed]
  33. Oosterveld, A.; Voragen, A.G.J.; Schols, H.A. Effect of Roasting on the Carbohydrate Composition of Coffea arabica Beans. Carbohydr. Polym. 2003, 54, 183–192. [Google Scholar] [CrossRef]
  34. Grassi, A.; Cristani, C.; Palla, M.; Di Giorgi, R.; Giovannetti, M.; Agnolucci, M. Storage Time and Temperature Affect Microbial Dynamics of Yeasts and Acetic Acid Bacteria in a Kombucha Beverage. Int. J. Food Microbiol. 2022, 382, 109934. [Google Scholar] [CrossRef]
  35. Kahraman-Ilıkkan, Ö. Microbiome Composition of Kombucha Tea from Türkiye Using High-Throughput Sequencing. J. Food Sci. Technol. 2023, 60, 1826–1833. [Google Scholar] [CrossRef] [PubMed]
  36. Jayabalan, R.; Malini, K.; Sathishkumar, M.; Swaminathan, K.; Yun, S.E. Biochemical characteristics of tea fungus produced during kombucha fermentation. Food Sci. Biotechnol. 2010, 19, 843–847. [Google Scholar] [CrossRef]
  37. Tian, T.; Freeman, S.; Corey, M.; German, J.B.; Barile, D. Effect of Roasting on Oligosaccharide Abundance in Arabica Coffee Beans. J. Agric. Food Chem. 2018, 66, 10067–10076. [Google Scholar] [CrossRef]
  38. Karadag, A.; Ozcelik, B.; Saner, S. Review of Methods to Determine Antioxidant Capacities. Food Anal. Methods 2009, 2, 41–60. [Google Scholar] [CrossRef]
  39. Anese, M.; Nicoli, M.C. Antioxidant Properties of Ready-to-Drink Coffee Brews. J. Agric. Food Chem. 2003, 51, 92–96. [Google Scholar] [CrossRef]
  40. Linhares Sabino, N.; Maziero Fogarin, H.; Lucia Murillo-Franco, S.; Oliviera Bérgamo, M.; Vicente Moreno, L.; Danielle Virginio da Silva, D.; Soleo Funari, C.; Johana Dussán, K. Investigating the Influence of Solvents and Extraction Methods on the Efficacy of Phenolic Compound Recovery from Spent Coffee Grounds. Sep. Purif. Technol. 2025, 362, 131793. [Google Scholar] [CrossRef]
  41. Martinez-Saez, N.; García, A.T.; Pérez, I.D.; Rebollo-Hernanz, M.; Mesías, M.; Morales, F.J.; Martín-Cabrejas, M.A.; del Castillo, M.D. Use of Spent Coffee Grounds as Food Ingredient in Bakery Products. Food Chem. 2017, 216, 114–122. [Google Scholar] [CrossRef] [PubMed]
  42. Bekedam, E.K.; Loots, M.J.; Schols, H.A.; Van Boekel, M.A.J.S.; Smit, G. Roasting Effects on Formation Mechanisms of Coffee Brew Melanoidins. J. Agric. Food Chem. 2008, 56, 7138–7145. [Google Scholar] [CrossRef]
  43. Chakravorty, S.; Bhattacharya, S.; Chatzinotas, A.; Chakraborty, W.; Bhattacharya, D.; Gachhui, R. Kombucha Tea Fermentation: Microbial and Biochemical Dynamics. Int. J. Food Microbiol. 2016, 220, 63–72. [Google Scholar] [CrossRef]
  44. Sales, A.L.; Iriondo-DeHond, A.; DePaula, J.; Ribeiro, M.; Ferreira, I.M.P.L.V.O.; Miguel, M.A.L.; del Castillo, M.D.; Farah, A. Intracellular Antioxidant and Anti-Inflammatory Effects and Bioactive Profiles of Coffee Cascara and Black Tea Kombucha Beverages. Foods 2023, 12, 1905. [Google Scholar] [CrossRef] [PubMed]
  45. Huang, G.; Huang, Y.; Sun, Y.; Lu, T.; Cao, Q.; Chen, X. Characterization of Kombucha Prepared from Black Tea and Coffee Leaves: A Comparative Analysis of Physiochemical Properties, Bioactive Components, and Bioactivities. J. Food Sci. 2024, 89, 3430–3444. [Google Scholar] [CrossRef]
  46. Friedman, M.; Levin, C.E. Review of Methods for the Reduction of Dietary Content and Toxicity of Acrylamide. J. Agric. Food Chem. 2008, 56, 6113–6140. [Google Scholar]
  47. Albedwawi, A.S.; Al Sakkaf, R.; Osaili, T.M.; Yusuf, A.; Olaimat, A.; Liu, S.Q.; Palmisano, G.; Shah, N.P.; Ayyash, M.M. Investigating Acrylamide Mitigation by Potential Probiotics Bifidobacterium breve and Lactiplantibacillus plantarum: Optimization, In Vitro Gastrointestinal Conditions, and Mechanism. LWT 2022, 163, 113553. [Google Scholar] [CrossRef]
  48. Akillioglu, H.G.; Gökmen, V. Mitigation of Acrylamide and Hydroxymethyl Furfural in Instant Coffee by Yeast Fermentation. Food Res. Int. 2014, 61, 252–256. [Google Scholar] [CrossRef]
  49. Aguirre Santos, E.A.; Schieber, A.; Weber, F. Site-Specific Hydrolysis of Chlorogenic Acids by Selected Lactobacillus Species. Food Res. Int. 2018, 109, 426–432. [Google Scholar] [CrossRef]
  50. Bel-Rhlid, R.; Thapa, D.; Kraehenbuehl, K.; Hansen, C.E.; Fischer, L. Biotransformation of Caffeoyl Quinic Acids from Green Coffee Extracts by Lactobacillus johnsonii NCC 533. AMB Express 2013, 3, 1–7. [Google Scholar] [CrossRef]
  51. Barthelmebs, L.; Diviès, C.; Cavin, J.-F.; Barthelmebs, L. Molecular Characterization of the Phenolic Acid Metabolism in the Lactic Acid Bacteria Lactobacillus plantarum. Le Lait 2001, 81, 161–171. [Google Scholar] [CrossRef]
  52. Kraehenbuehl, K.; Page-Zoerkler, N.; Mauroux, O.; Gartenmann, K.; Blank, I.; Bel-Rhlid, R. Selective Enzymatic Hydrolysis of Chlorogenic Acid Lactones in a Model System and in a Coffee Extract. Application to Reduction of Coffee Bitterness. Food Chem. 2017, 218, 9–14. [Google Scholar] [CrossRef] [PubMed]
  53. Verde, C.L.; Pacioles, C.T.; Paterson, N.; Chin, J.; Owens, C.P.; Senger, L.W. Hydrolysis of Chlorogenic Acid in Sunflower Flour Increases Consumer Acceptability of Sunflower Flour Cookies by Improving Cookie Color. J. Food Sci. 2023, 88, 3538–3550. [Google Scholar] [CrossRef]
  54. Mehaya, F.M.; Mohammad, A.A. Thermostability of Bioactive Compounds during Roasting Process of Coffee Beans. Heliyon 2020, 6, e05508. [Google Scholar] [CrossRef] [PubMed]
  55. Liu, Y.; Kitts, D.D. Confirmation That the Maillard Reaction Is the Principle Contributor to the Antioxidant Capacity of Coffee Brews. Food Res. Int. 2011, 44, 2418–2424. [Google Scholar] [CrossRef]
  56. Campa, C.; Doulbeau, S.; Dussert, S.; Hamon, S.; Noirot, M. Qualitative Relationship between Caffeine and Chlorogenic Acid Contents among Wild Coffea Species. Food Chem. 2005, 93, 135–139. [Google Scholar] [CrossRef]
  57. Chen, Q.; Li, Y.; Dong, L.; Shi, R.; Wu, Z.; Liu, L.; Zhang, J.; Wu, Z.; Pan, D. Quantitative Determination of Nε-(Carboxymethyl)Lysine in Sterilized Milk by Isotope Dilution UPLC-MS/MS Method without Derivatization and Ion Pair Reagents. Food Chem. 2022, 385, 132697. [Google Scholar] [CrossRef]
  58. Roldan, M.; Loebner, J.; Degen, J.; Henle, T.; Antequera, T.; Ruiz-Carrascal, J. Advanced Glycation End Products, Physico-Chemical and Sensory Characteristics of Cooked Lamb Loins Affected by Cooking Method and Addition of Flavour Precursors. Food Chem. 2015, 168, 487–495. [Google Scholar] [CrossRef]
  59. Papetti, A.; Mascherpa, D.; Gazzani, G. Free α-Dicarbonyl Compounds in Coffee, Barley Coffee and Soy Sauce and Effects of in Vitro Digestion. Food Chem. 2014, 164, 259–265. [Google Scholar] [CrossRef]
Figure 1. Dark roasted (A) and light roasted (B) coffee beans.
Fermentation 11 00158 g001
Figure 2. Coffee samples. LR: Light Roasted; DR: Dark Roasted, L: Lactobacillus plantarum ELB75; K: Kombu coffee (SCOBY-fermented coffee); SL: L-fermented coffee containing spent coffee grounds; and SK: Kombu coffee containing spent coffee grounds.
Fermentation 11 00158 g002
Figure 3. Acetic acid and lactic acid contents of coffee samples. LR: Light Roasted; DR: Dark Roasted; L: Lactobacillus plantarum ELB75; K: Kombu coffee (SCOBY-fermented coffee); SL: L. plantarum ELB75 fermented coffee containing spent coffee grounds; and SK: Kombu coffee containing spent coffee grounds.
Fermentation 11 00158 g003
Figure 4. Lactic acid bacteria (LAB), acetic acid bacteria (AAB), and yeast counts of coffee samples. LR: Light Roasted; DR: Dark Roasted; L: Lactobacillus plantarum ELB75; K: Kombu coffee (SCOBY-fermented coffee); SL: L-fermented coffee containing spent coffee grounds; and SK: Kombu coffee containing spent coffee grounds. Different letters (a–d) indicate significant differences (p < 0.05) among samples (L, K, SL, and SK fermented samples) in DR and LR coffee group.
Fermentation 11 00158 g004
Figure 5. The sensory properties of coffee samples. LR: Light Roasted; DR: Dark Roasted, L: Lactobacillus plantarum ELB75; K: Kombu coffee (SCOBY-fermented coffee); SL: L-fermented coffee containing spent coffee grounds; and SK: Kombu coffee containing spent coffee grounds.
Fermentation 11 00158 g005
Table 1. pH values of coffee samples.
Day
014681114
LRL5.10 ± 0.01 a4.89 ± 0.01 b4.68 ± 0.03 c4.66 ± 0.04 cd4.67 ± 0.02 cd4.60 ± 0.01 e4.62 ± 0.01 de
K5.10 ± 0.01 a4.20 ± 0.01 b4.13 ± 0.02 c3.90 ± 0.01 d3.79 ± 0.03 e3.50 ± 0.02 f3.40 ± 0.02 g
SL5.19 ± 0.01 a4.75 ± 0.01 b4.20 ± 0.01 c3.95 ± 0.01 d3.87 ± 0.03 e3.77 ± 0.04 f3.66 ± 0.02 g
SK5.19 ± 0.02 a4.48 ± 0.02 b4.39 ± 0.01 c4.10 ± 0.02 d4.00 ± 0.03 e3.58 ± 0.02 f3.39 ± 0.03 g
DRL5.70 ± 0.01 a5.70 ± 0.02 a5.50 ± 0.01 b5.38 ± 0.02 c5.38 ± 0.02 c5.28 ± 0.02 d5.25 ± 0.05 d
K5.70 ± 0.01 a4.45 ± 0.05 b4.37 ± 0.03 bc4.28 ± 0.02 c4.12 ± 0.01 d3.59 ± 0.05 e3.29 ± 0.05 f
SL5.86 ± 0.04 a5.68 ± 0.02 b5.47 ± 0.03 c5.28 ± 0.03 d5.16 ± 0.04 e4.78 ± 0.02 f4.47 ± 0.04 g
SK5.86 ± 0.04 a4.65 ± 0.05 bc4.67 ± 0.04 b4.58 ± 0.03 c4.48 ± 0.02 d4.69 ± 0.01 b4.63 ± 0.02 bc
Different letters within the same row are significantly different (p < 0.05). LR: Light roasted; DR: dark roasted; L: Samples fermented with Lactobacillus plantarum ELB75; K: Kombu coffee (SCOBY-fermented coffee); SL: L. plantarum ELB75 fermented coffee containing spent coffee grounds; and SK: Kombu coffee containing spent coffee grounds.
Table 2. Titratable acidity (TA %) of coffee samples.
Day
01681114
LRL0.7 ± 0.05 c1.0 ± 0.04 b1.0 ± 0.05 b0.9 ± 0.05 b0.9 ± 0.05 b1.2 ± 0.06 a
K0.8 ± 0.04 f2.2 ± 0.05 e3.0 ± 0.06 d3.1 ± 0.12 c4.3 ± 0.10 b5.6 ± 0.05 a
SL0.7 ± 0.05 d2.4 ± 0.10 c2.5 ± 0.08 c2.5 ± 0.05 c3.2 ± 0.06 b4.2 ± 0.10 a
SK0.9 ± 0.04 f2.2 ± 0.05 e3.1 ± 0.05 d3.4 ± 0.08 c6.9 ± 0.10 b7.3 ± 0.10 a
DRL0.5 ± 0.05 c0.5 ± 0.04 c0.5 ± 0.05 c0.6 ± 0.04 b0.7 ± 0.04 a0.7 ± 0.05 a
K0.8 ± 0.04 d1.7 ± 0.06 c1.7 ± 0.06 c1.6 ± 0.10 c3.3 ± 0.05 b5.2 ± 0.15 a
SL0.6 ± 0.05 d0.9 ± 0.05 c0.8 ± 0.05 c0.8 ± 0.04 c1.0 ± 0.06 b1.4 ± 0.06 a
SK0.7 ± 0.05 b1.5 ± 0.05 a1.5 ± 0.04 a1.5 ± 0.04 a1.4 ± 0.10 a1.5 ± 0.09 a
Different letters within the same row are significantly different (p < 0.05). LR: Light roasted; DR: dark roasted; L: Samples fermented with Lactobacillus plantarum ELB75; K: Kombu coffee (SCOBY-fermented coffee); SL: L. plantarum ELB75 fermented coffee containing spent coffee grounds; and SK: Kombu coffee containing spent coffee grounds.
Table 3. TPC, TFC, and antioxidant activities (DPPH, FRAP) of coffee samples.
TPC
mg GAE/mL
TFC
mg CE/mL
DPPH
mg TE/mL
FRAP
mg TE/mL
LRC2.74 ± 0.70 c6.78 ± 0.39 a2.97 ± 0.06 b31.79 ± 4.20 b
L5.75 ± 0.46 b1.74 ± 0.19 b3.21 ± 0.06 b4.63 ± 1.20 c
K5.94 ± 0.69 b1.19 ± 0.67 b2.98 ± 0.17 b4.66 ± 0.25 c
SC9.22 ± 1.25 a6.43 ± 0.49 a4.28 ± 0.12 a47.79 ± 8.09 a
SL6.21 ± 0.66 b1.21 ± 0.04 b3.30 ± 0.54 b5.27 ± 1.40 c
SK5.30 ± 1.07 b0.78 ± 0.04 b2.62 ± 0.15 b3.30 ± 1.24 c
DRC0.52 ± 0.45 b1.87 ± 0.14 b2.31 ± 0.09 a21.01 ± 2.99 b
L4.31 ± 0.63 a1.29 ± 0.31 bc2.33 ± 0.49 a2.52 ± 1.09 c
K3.93 ± 0.77 a0.54 ± 0.06 c1.98 ± 0.22 a3.48 ± 0.54 c
SC5.12 ± 1.53 a5.90 ± 0.98 a2.51 ± 0.43 a28.30 ± 4.98 a
SL3.83 ± 0.42 a1.27 ± 0.16 bc2.65 ± 0.24 a3.22 ± 0.83 c
SK4.34 ± 0.41 a0.80 ± 0.09 bc2.47 ± 0.22 a4.06 ± 1.54 c
Different letters within the same column are significantly different (p < 0.05). LR: Light roasted; DR: dark roasted; C: Control (non-fermented coffee); L: Samples fermented with Lactobacillus plantarum ELB75; K: Kombu coffee (SCOBY-fermented coffee); SC: Non-fermented coffee containing spent coffee grounds; SL: L. plantarum ELB75 fermented coffee containing spent coffee grounds; and SK: Kombu coffee containing spent coffee grounds.
Table 4. Phenolic constituents of coffee samples.
CaffeineFerulic Acidρ-Coumaric AcidCaffeic Acid5-CQA4-CQA3-CQATotal CQA
LRC873.84 ± 0.36 d1.66 ± 0.31 d18.36 ± 0.15 b7.47 ± 0.53 c681.02 ± 0.08 d446.07 ± 1.17 d285.23 ± 17.30 d1412.32 ± 18.38 e
L1033.48 ± 0.57 b7.55 ± 0.45 b11.74 ± 0.07 cd36.17 ± 0.39 a754.72 ± 0.70 b526.56 ± 4.25 c320.83 ± 1.16 c1602.11 ± 4.71 c
K788.97 ± 5.15 f1.80 ± 0.21 d13.09 ± 2.66 c3.56 ± 0.23 d709.71 ± 7.44 c459.85 ± 4.16 d294.57 ± 4.17 d1464.14 ± 15.77 d
SC1345.71 ± 1.90 a9.96 ± 1.95 a31.51 ± 0.22 a15.01 ± 1.39 b1177.48 ± 11.67 a806.43 ± 10.99 a 474.97 ± 0.72 a2458.87 ± 0.04 a
SL998.28 ± 0.29 c5.20 ± 0.22 c9.18 ± 0.16 d0.74 ± 0.26 e762.34 ± 3.44 b550.57 ± 2.36 b359.37 ± 0.25 b1672.28 ± 1.33 b
SK866.57 ± 0.20 e1.65 ± 0.36 d12.54 ± 0.55 c1.53 ± 0.05 e771.19 ± 6.44 b544.36 ± 7.89 b360.44 ± 0.83 b1675.99 ± 2.27 b
DRC900.49 ± 2.38 d4.71 ± 0.53 a15.82 ± 0.41 a6.93 ± 0.40 b232.64 ± 0.12 d181.10 ± 2.66 f106.04 ± 1.21 f519.77 ± 3.75 e
L991.58 ± 1.31 b2.78 ± 0.28 c6.20 ± 0.56 d11.27 ± 0.51 a232.66 ± 0.61 d222.49 ± 0.26 c137.56 ± 0.39 c592.71 ± 0.74 c
K938.55 ± 0.17 c4.32 ± 0.01 ab13.59 ± 0.55 b6.74 ± 0.03 b240.39 ± 0.11 c208.82 ± 1.82 d128.31 ± 1.82 d577.52 ± 3.53 d
SC904.14 ± 1.37 d4.83 ± 0.22 a15.27 ± 0.16 a7.11 ± 0.21 b265.27 ± 0.00 b201.42 ± 0.94 e119.68 ± 0.38 e586.37 ± 1.32 c
SL1022.13 ± 3.86 a1.47 ± 0.15 d7.54 ± 0.36 c2.64 ± 0.28 c262.67 ± 5.73 b235.78 ± 3.10 b156.51 ± 0.12 b654.95 ± 2.75 b
SK934.18 ± 7.44 c3.63 ± 0.56 bc8.30 ± 0.52 c3.45 ± 0.54 c343.57 ± 1.21 a263.94 ± 0.46 a173.10 ± 0.62 a780.61 ± 2.29 a
Results are expressed in mg/L. Different letters within the same column are significantly different (p < 0.05). CQA: caffeoylquinic acid; LR: Light roasted; DR: dark roasted; C: Control (non-fermented coffee); L: Samples fermented with Lactobacillus plantarum ELB75; K: Kombu coffee (SCOBY-fermented coffee); SC: Non-fermented coffee containing spent coffee grounds; SL: L. plantarum ELB75 fermented coffee containing spent coffee grounds; SK: Kombu coffee containing spent coffee grounds; and CQA: Caffeoylquinic acid.
Disclaimer/Publisher’s Note: The statements, opinions and data contained in all publications are solely those of the individual author(s) and contributor(s) and not of MDPI and/or the editor(s). MDPI and/or the editor(s) disclaim responsibility for any injury to people or property resulting from any ideas, methods, instructions or products referred to in the content.

