Abstract
Purple phototrophic bacteria (PPB) offer a sustainable approach for biological wastewater treatment while simultaneously producing valuable by-products such as polyhydroxyalkanoates (PHAs). This study investigates the effects of continuous light wavelengths over a two-stage nutrient reduction setup on PHA accumulation in a mixed PPB culture grown on fuel synthesis wastewater (FSW). The first stage promoted biomass production under nutrient availability, while the second stage targeted the enhancement of PHA accumulation through nitrogen (N) or phosphorus (P) reduction. Biomass growth remained stable under P reduction but significantly increased under N reduction. The results showed that organics removal efficiency decreased under nutrient reduction, particularly under P reduction, while N reduction conditions enhanced P uptake from the media. Maximum PHA accumulation reached 12.6% CDW under N reduction and 10.0% CDW under P reduction. Light type played a dominant role, with a full-spectrum light that included ultraviolet (UV) and infrared (IR) promoting the highest PHA accumulation, whereas white light with far-red wavelengths (700–770 nm) enhanced biomass growth. These findings highlight the potential of optimizing light conditions and nutrient availability to enhance PHA biosynthesis, paving the way for improved bioplastic production from wastewater streams.
1. Introduction
Biological wastewater treatment technologies are low cost and low energy treatments that were initially aimed at the treatment of wastewater alone. However, recently, the focus of these technologies has expanded to include the recovery of nutrients and organics. One of the emerging anaerobic approaches is treatment with purple phototrophic bacteria (PPB), which has achieved high organic and nitrogen removal rates while simultaneously generating by-products such as poly-phosphate (poly-P), polyhydroxyalkanoates (PHAs), and pigments [1]. PPB are versatile microorganisms with the ability to grow under photoheterotrophic, photoautotrophic, or chemotrophic conditions depending on the environment. However, PPB show the best growth under photoheterotrophic conditions in the presence of light. They can assimilate a variety of organic compounds under micro-aerobic or anaerobic conditions and have been proven to have a high tolerance for toxicity and polluted environments [2], which provides an advantage for the bioremediation and treatment of various wastewater streams.
In addition to wastewater treatment, PPB have been reported to conduct additional metabolic functions such as the accumulation of polymers, hydrogen production, or nitrogen fixation [3]. The production of PHAs by PPB has been gaining attention, as PHA is a promising bioplastic with a short biodegradation period that could potentially help alleviate the worldwide plastic pollution crisis [4]. PHAs are accumulated inside the cells as an adaptation mechanism to unbalanced environmental conditions. The polymer has shown similar properties to petrochemical-based plastics. However, high production costs have limited the mass production and commercialization of PHAs. In order for the bioplastic to have a competitive advantage in the market, it is important to decrease production costs. The combination of a mixed culture and organic substrates from waste sources can potentially reduce production costs significantly.
PPB have the capacity to grow using a wide range of complex substrates that are typically found in various wastewaters. Industrial wastewater from the gas and oil industry is an abundant by-product in Qatar, and, therefore, is a sustainable feedstock of organics. Fuel synthesis wastewater (FSW) is a by-product of the Fischer-Tropsch process, which involves converting syngas from hydrogen and carbon monoxide to liquid hydrocarbon. The FSW is rich in organic compounds such as alcohols and carboxylic acids, with a chemical oxygen demand (COD) that can reach up to 30 g-COD L−1 [5]. This poses a challenge for its safe disposal into the environment, which can be mitigated through carbon recovery by PPB in the form of PHAs. Moreover, it is a clear liquid with no notable solids content, making it an ideal substrate for phototrophic cultures.
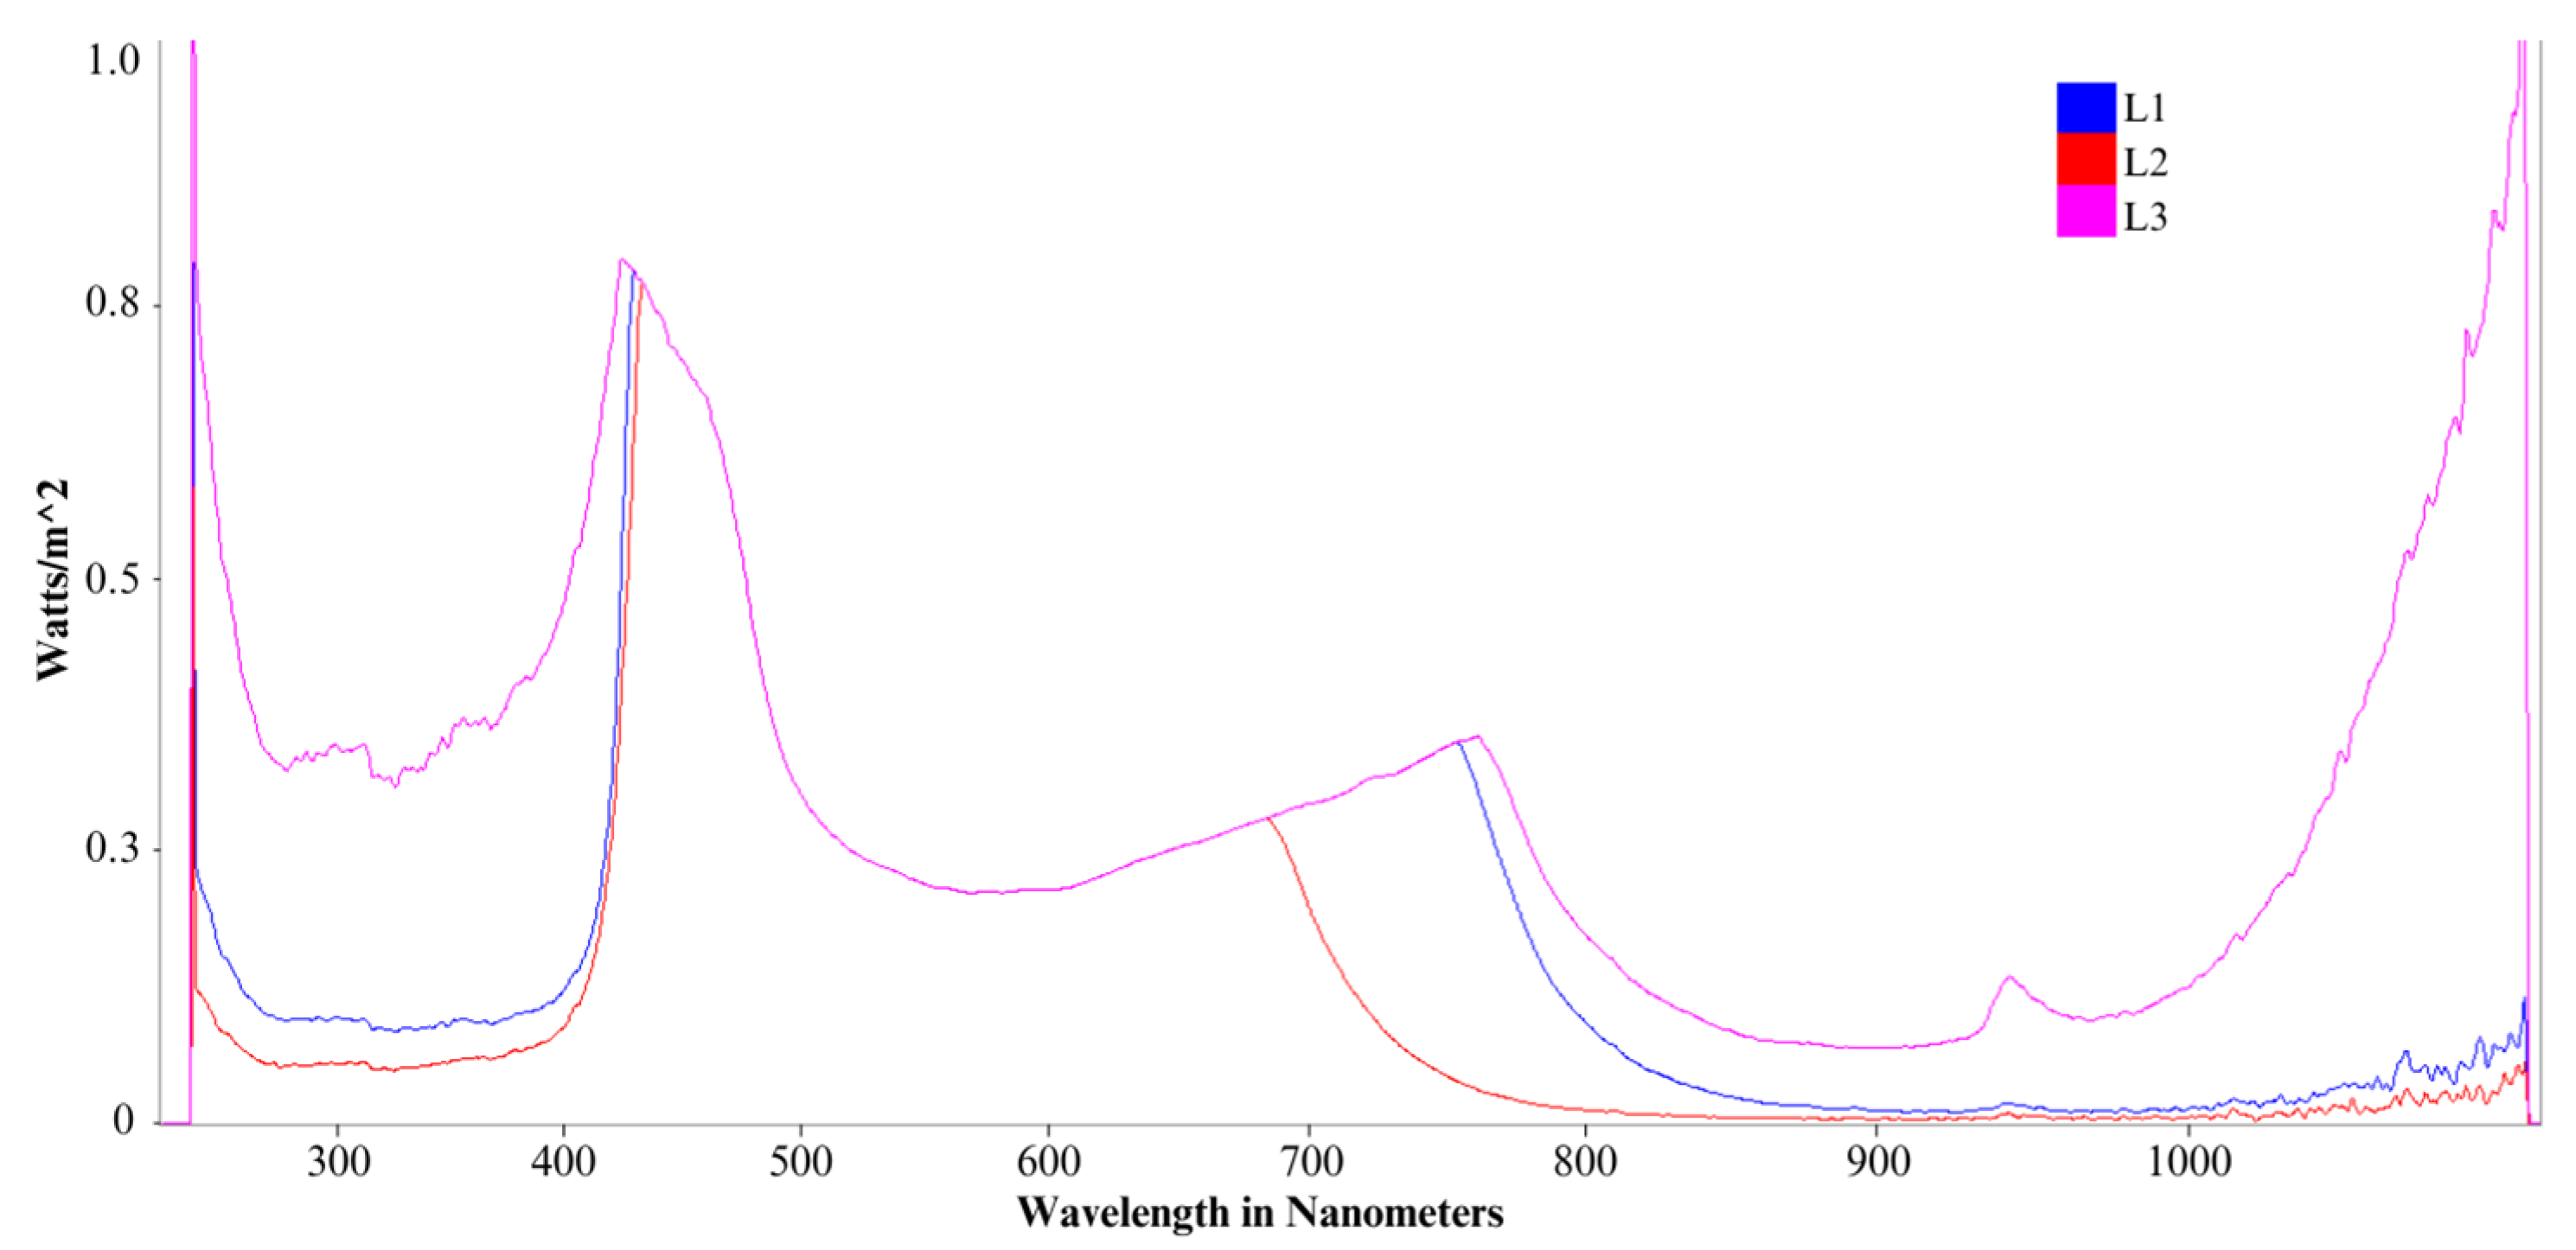
Some environmental factors are fundamental to the production of PHAs, as PPB are known to accumulate under stressful conditions such as high-carbon substrate, limitation/depletion of nutrients, alkali pH, and dark/light conditions, among others. Many factors have been explored; however, an optimized system for mixed PPB growth and PHA accumulation is yet to be developed. A high C/N ratio through a combination of high mixed-carbon substrate concentrations and the limitation/absence of nutrients has achieved a good PHA accumulation of 40% PHA with winery wastewater using a single strain of PPB [6]. A two-stage process consisting of a delayed limitation stage of a key nutrient such as nitrogen or phosphate has also shown promising results, where the successive different stages are able to provide a competitive advantage for PHA accumulation over biohydrogen production [7,8]. Additionally, it was revealed that the exposure to different light sources including infrared (IR) wavelengths and intensities affects the growth of PPB and their ability to accumulate by-products [9,10]. Different wavelengths have been investigated, with a particular emphasis on red and IR wavelengths (600–900 nm), which have been proven to enhance PPB growth and metabolic activities. For instance, Zhou et al. [11] studied various color LEDs and incandescent lamps and found that, for a strain of Rhodopseudomonas, red LED light (650 nm) was optimal for biomass accumulation, organics uptake, and carotenoid to BChl ratio, while yellow provided the greatest BChl production. In comparison, in another study of Rhodopseudomonas palustris that investigated various LED sources, incandescent lights, and fluorescent lights, it was found that blue spectra LEDs provided the optimal biomass growth and carotenoid production. Qi et al. [12] studied three monochromatic NIR wavelengths (760, 840, and 940 nm) at various intensities with an isolated strain of Rhodopseudomonas and found that 850 nm promoted the highest accumulation of BChl production and biomass growth. Although power inputs did vary between light sources in some studies, these cannot explain the differences observed. For instance, in the study by Kuo and colleagues, the blue LED had a power output almost a quarter of the red LED, which was found optimal by Zhou and colleagues. Given these findings and differences, the lights selected for this study were broad spectrum LEDs, each with a strong violet/blue component. One contained a visible range only up to the far red region (400–750 nm with a 680 nm peak), another reached and had its secondary peak in the short near infrared region (400–850 nm with a 750 nm peak), and another contained a moderate contribution in the UV and wider NIR regions (250–1100 nm) with increasing intensity and no distinct peaks. A relative intensity threshold of 0.05 was used to define spectral range endpoints, ensuring consistency in determining UV and IR contributions. These additional ranges allow us to assess the impact of specific red components and IR on PPB growth and metabolism. Moreover, the existing studies provide valuable information about biomass growth and metabolic response to different wavelengths, but do not specifically evaluate the impacts of wavelength on PHA accumulation, a gap that this study aims to address. The majority of these studies also investigate the growth of either a pure strain or a mixed culture fed a single compound substrate. Research investigating the growth of mixed phototrophic cultures on a complex substrate and their ability to accumulate by-products is scarce. This present study aims to investigate the impact of continuous but differing light wavelength ranges on the accumulation of PHAs in a mixed consortium of PPB through batch tests over a period of 14 days using an industrial wastewater substrate. In order to maximize biopolymer production, a two-stage setup is implemented. The initial stage consists of nutrient availability targeting an enhanced production of cells, while the latter stage aims at increasing the intracellular accumulation of PHAs under limited concentrations of a key nutrient, in two separate tests. Simultaneously, wastewater treatment capabilities of PPB are assessed with an emphasis on the removal of COD and the recovery of nutrients.
2. Materials and Methods
2.1. Inoculum and Wastewater Substrate
PPB inoculum was obtained from a 4 L Minifors2 bioreactor (Infors HT, Bottmingen, Switzerland) operated at the laboratory. The cells were cultivated through a combination of a modified ATCC 2728 medium, where organic acids were replaced by FSW, and an inoculum sourced from a mixture of seawater and landscape pond water. The bacteria culture was maintained for over a year, with FSW diluted 5 times along with nutrients, vitamins, and trace elements according to the ATCC 2728 medium. The bioreactor was subjected to continuous light exposure and was operated in batch mode, renewed on a weekly basis to ensure constant growth.
FSW was supplied from a GTL plant located in Qatar as a by-product of the Fischer–Tropsch process. The wastewater was stored at 4 °C at the laboratory until its utilization. The wastewater characterization tests showed no detectable nitrogen (N), phosphate (P), or sulfate (S), and it was strongly acidic with a pH of 3.5. Initial COD and TOC values were 5820 mg-COD L−1 and 1304 mg-TOC L−1, respectively, with a dominance of acetate that comprised more than 50% of the total volatile fatty acids (VFAs). FSW was clear in color, with no visible particulate matter. The chemical and physical properties of FSW allowed its direct utilization in the experiments without additional treatments. Prior to each leg of the experiment, FSW was diluted twice for better bacterial adjustment to the high-strength substrate.
2.2. Batch Experiment Design
Batch experiments were prepared in 1 L anaerobic Duran glass bottles using an inoculum enriched for PPB. Six similar bottles were operated under two consecutive stages, each with its own combination of nutrients and light. Two nutrient conditions were tested, limiting P and N, respectively. In the first stage (P1, N1), both had nutrient concentrations per the modified Pfennig’s medium (ATCC MD-2728), while, in the second stage, the P or N concentration was reduced on a stoichiometric basis and are referred to as P2 and N2, respectively. There were three bottles for each nutrient condition, with each exposed to one of three light sources (L1, L2, L3) with different wavelengths, as detailed in Table 1 and Figure 1. The medium composition during the first stage was similar across all six bottles, with a COD:N:P ratio equivalent to 100:3.30:2.80, equivalent to 2480 mg-COD L−1, 81.8 mg-N L−1, 70.7 mg-P L−1, and 652 mg-TOC L−1. After 7 days of operation, the medium was centrifuged (Sorvall Lynx 6000, ThermoScientific, Waltham, MA, USA) and the supernatant was taken for analysis. The biomass was resuspended in fresh medium based on its test condition, as summarized in Table 1. The changes in concentrations were selected in order to trigger PHA accumulation through the reduction of a key nutrient and lasted a further 7 days.

Table 1.
Experimental setup at the beginning of the second stage (P2, N2) as COD:N:P ratio. Light ranges show the span for the dominant spectra intensity of I/Imax > 0.05.
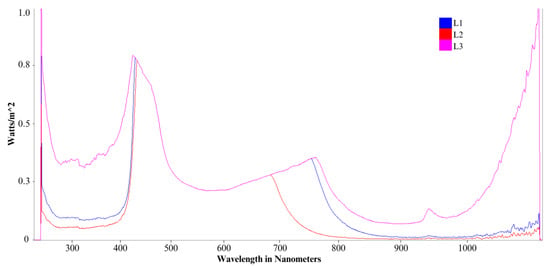
Figure 1.
Comparative light emission spectrum for each L1, L2, and L3 lights.
During both stages, FSW was diluted two times, and its pH was adjusted to 7.5 with 0.1 M NaOH at the beginning of the experiment but was not controlled throughout the experiment. The pH was adjusted to 6.5 for the P2 condition to introduce an additional stress factor that promoted PHA accumulation, as opposed to a single stress factor (N-reduction) for the N2 condition. Since FSW was devoid of any nutrients necessary for the survival of bacteria, vitamins and trace elements were added to the medium according to ATCC MD-VS and ATCC MD-TMS solution recipes. The experiment was conducted at room temperature and subjected to continuous mixing at approximately 300 rpm on a magnetic stirring plate (Stuart UC152, Cole-Parmer, Vernon Hills, IL, USA).
2.3. Analytical Procedures
FSW quality and properties were evaluated at the beginning, middle, and end of the experiment. Samples were centrifuged at 10,000× g, then filtered with a 0.45 µm pore size membrane (Millipore PVDF, Merck-Millipore, Darmstadt, Germany). The supernatant was tested for chemical oxygen demand (COD), total organic carbon (TOC), N, VFA, and P concentrations. COD was sampled daily and determined spectrophotometrically via Hach high-range COD test kits (0–1500 mg L−1). TOC and N were determined with a TOC analyzer (TOC-L with TNM-1, Shimadzu, Kyoto, Japan) at the end of each stage. VFA and P concentrations were measured with ion chromatography (940 Professional Vario, Metrohm, Herisau, Germany) and were measured at the end of each stage. The supernatant was diluted as needed to meet the detection limits of each equipment. All sample testing procedures were performed in duplicate.
The final biomass content at each stage of the experiment was measured as total suspended solids (TSS) and volatile suspended solids (VSS) as per the gravimetric APHA method [13]. The pH was measured by a pH multimeter (Orion Star A321, ThermoFisher Scientific, Waltham, MA, USA) on a daily basis. Biomass was harvested through centrifugation and freeze-dried for 24 h, then stored at −80 °C until further testing. Quantitative PHA determination was achieved using the crotonic acid assay method, as described by Law et Slepecky [14] on freeze-dried biomass, then PHA measurements were taken by measuring absorbance at 235 nm on the UV-vis spectrophotometer (Shimadzu, UV-3600 Plus, Kyoto, Japan). A standard curve was prepared for the PHA concentration calculation as described by Shaikh et al. [15] and the PHA concentration was plotted against its measured absorbance to generate the standard curve. Samples from the experiments were prepared following the same procedures and plotted against the standard curve. All samples’ properties were determined in duplicate. Statistical analysis was conducted to determine the statistical difference between the properties with the use of coefficient of variation (CV) and one-way ANOVA test at a 5% level of significance. The results presented are in the form of average and standard deviation.
3. Results and Discussion
3.1. FSW Treatment Under Nutrients’ Reduction
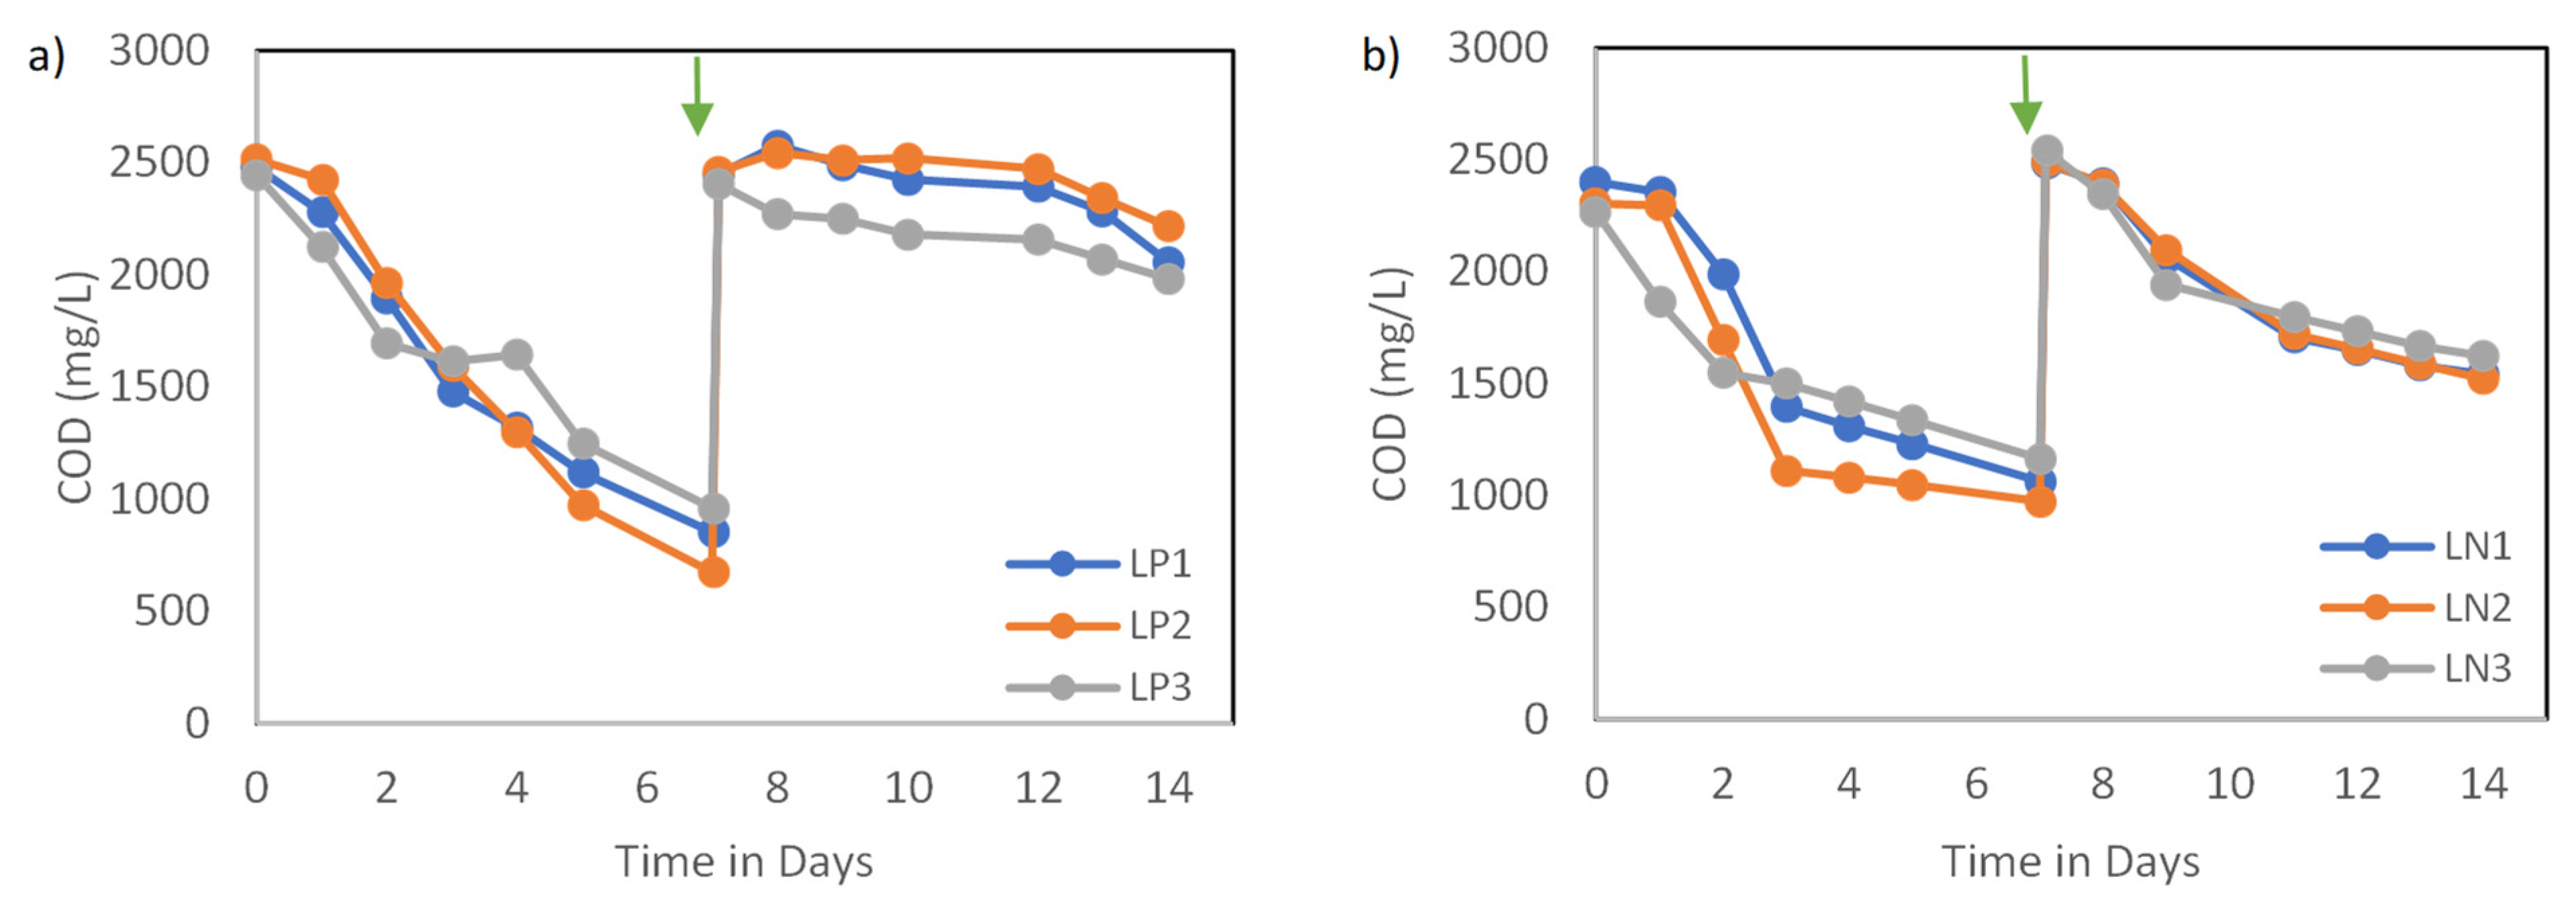
The effects of nutrient concentration were independently evaluated for two key nutrients over two stages. While the experiments were conducted under different lights, preliminary analysis suggested that the general trends and patterns of the chemical variables were similar. Thus, the results from different lighting setups were combined. Conditions with high CV values (greater than 15%) were examined and contributing factors were discussed. Overall, the chemical properties of the six setups exhibited similar trends for carbon and nutrient assimilation at each stage. COD removal over the first stage was significantly higher than the second stage, as seen in Figure 2. This indicates that the concentration reduction of a key macronutrient negatively affects the activity and assimilation of the biomass. The COD removal rates reached an average of 235.7 mg-COD (L.d)−1 and 179.6 mg-COD (L.d)−1 for P1 and N1 sets, respectively, over the first stage. COD efficiencies dropped during the second stage to reach 50.3 mg-COD (L.d)−1 and 134.9 mg-COD (L.d)−1 for P2 and N2 sets, respectively, over the same period of time. The CV was acceptable for most conditions, except P2, which indicates that light type becomes more influential in the system, leading to inconsistent COD removals under the reduction of P. Research groups have reported similar trends where low nutrient concentration or deficiency negatively affected the removal of organics, with N having the most noticeable effects [16,17]. However, given that nutrients remained at the end of each stage, it is more likely that light availability became the limiting factor during the second stage. Higher cell concentrations were observed at the end of the first stage compared with the first stage, which could have reduced light penetration, and potentially restricted the metabolic activities. Fradinho et al. [18] observed that PPB growth decreased significantly under limited light availability, confirming that higher biomass density can restrict illumination penetration and therefore metabolic activity.
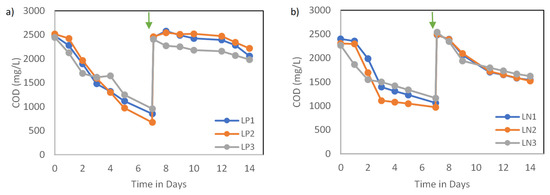
Figure 2.
(a) COD consumption trends over 14 days under P-reduced conditions and (b) COD consumption trends over 14 days under N-reduced conditions. The arrow indicates the beginning of the second stage, where a fresh substrate with nutrient reduction was supplied.
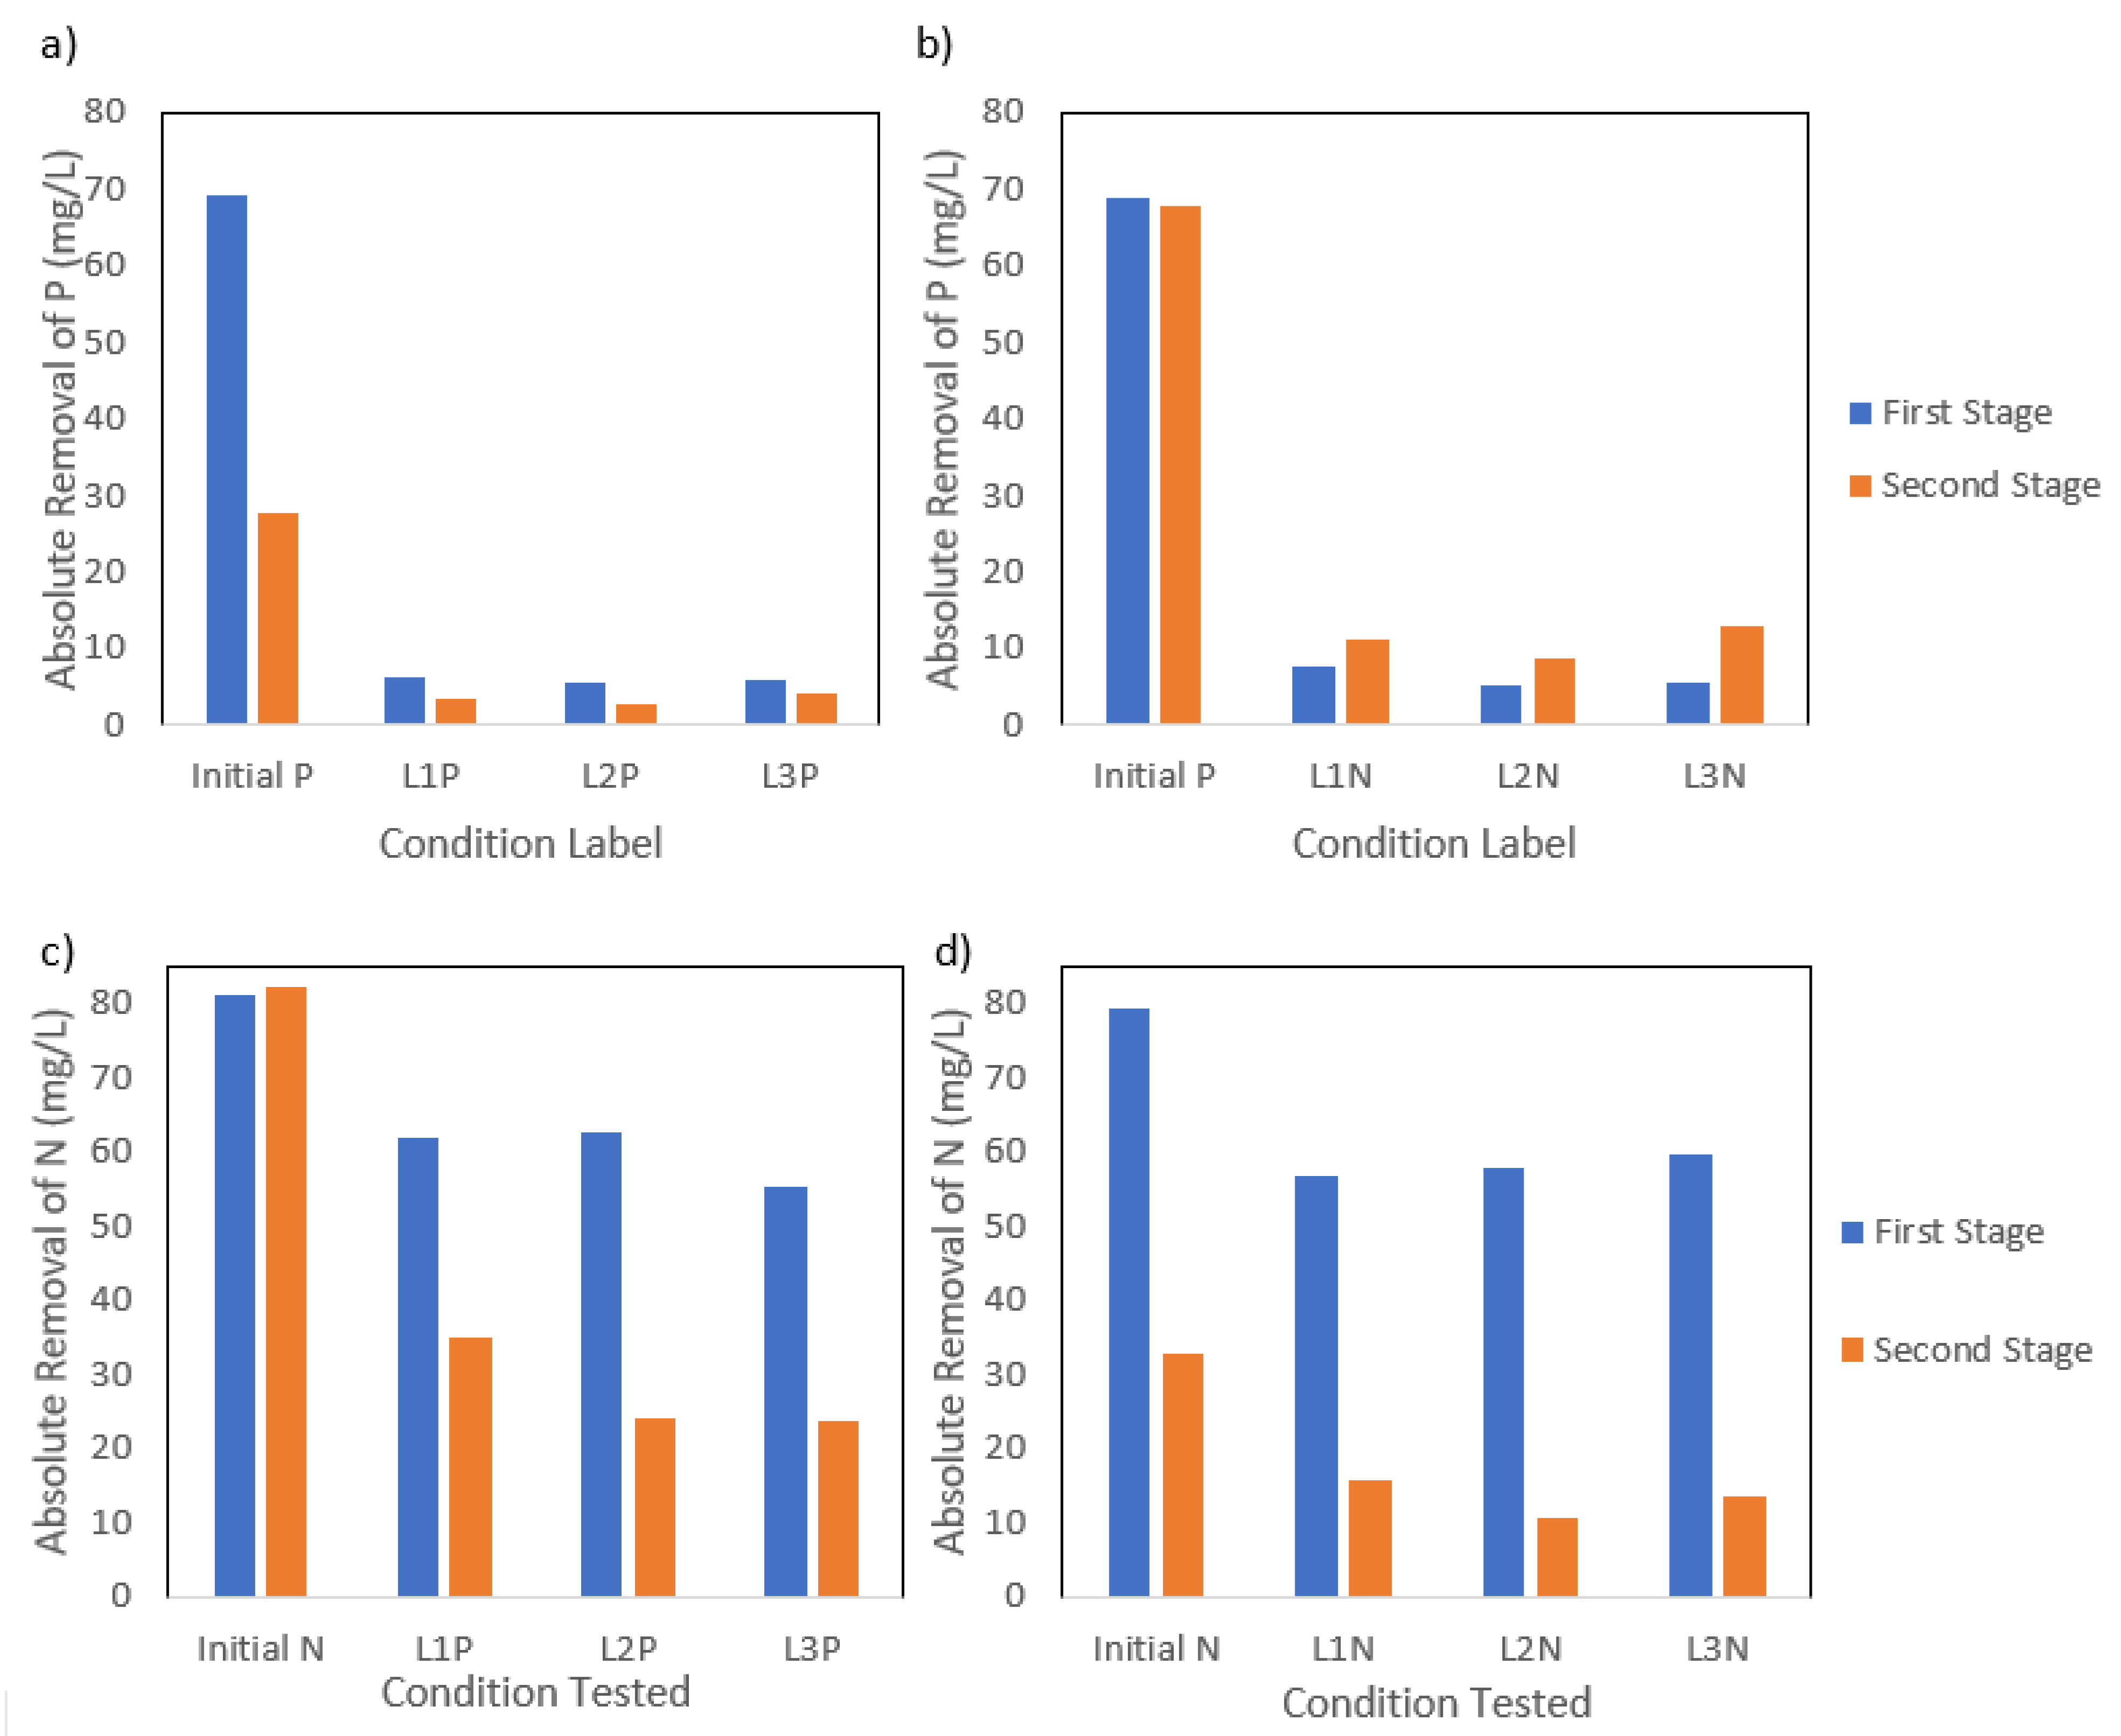
The removal of N from the media was lower during the second stage, as observed in Figure 3, while P removal increased over the second stage regardless of the nutrient concentration tested. The P reduction condition showed a decrease in N removal efficiency, with values decreasing from 59.9 mg-N L−1 during P1 to 27.6 mg-N L−1 during P2, despite a constant initial N concentration. This trend aligned with a simultaneous decline in carbon removal efficiency, suggesting a possible correlation between the N and organics uptake. P removal efficiency declined, decreasing from 6.0 mg-P L−1 to 3.5 mg-P L−1 removal during the second stage, as the initial P concentration was lowered during P2. While the improvement in P removal efficiency was notable, the values suggest that P was likely not a limiting factor. Other conditions such as alkalinity may have played a role in inhibiting nutrient assimilation. Similarly, the N reduction condition showed a drop in N removal efficiency from 58.1 mg-N L−1 to 13.2 mg-N L−1 under lower N concentrations, during the second stage, while P removal efficiency doubled, increasing from 6.1 mg-P L−1 to 11.0 mg-P L−1 under N reduction conditions. Additionally, the second stage showed a higher variability (19.1–23.7%) between the N and P removal conditions, indicating that the light type has a more significant role in directing the metabolic activities during the concentration reduction of one nutrient. Considering that N was not fully depleted, it is likely that biomass growth continued through a metabolic pathway that favors PHA or Poly-P accumulation triggered by an imbalance in nutrient availability rather than absolute depletion. However, the high variance observed could also be due to differences in initial biomass concentrations in each stage, given that the biomass was carried over from the first to the second stage. Studies have shown that PPB can continue to grow at lower rates under low N availability by reallocating energy and carbon fluxes while simultaneously storing PHAs [8,19], which indicates a partial metabolic shift toward carbon storage.
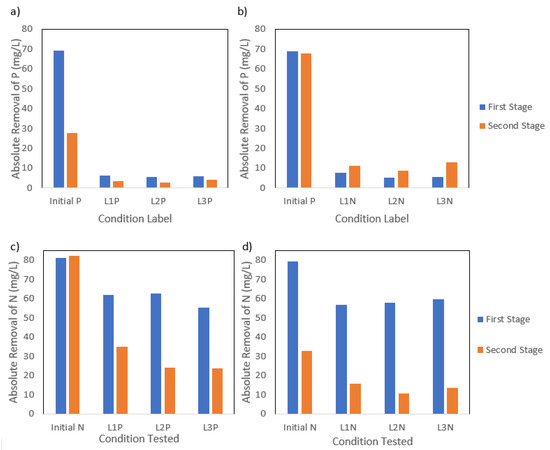
Figure 3.
(a) P absolute removal values at the end of the first and second stage of P reduction and (b) N reduction; (c) N absolute removal values at the end of the first and second stage of P reduction and (d) N reduction.
In this study, P reduction appeared to have a greater effect on carbon assimilation than N reduction. However, due to the presence of residual P concentrations at the end of the experiment, the lower initial pH value used in P2 likely played a larger role in directing this trend. The initial pH was set to slightly neutral in the range of 7.2–7.5 and increased to 9.3–9.8 by the end of the first stage for both P1 and N1. In contrast, for the P2 set, the initial pH was set lower at 6.2–6.8 to introduce an additional stress factor during the second stage. This adjustment affected organic uptake rates significantly, with the pH reaching only 7.3–7.5 by the end of the experiment, while low carbon assimilation was also observed. The N2 condition was set at a neutral pH to encourage faster PHA accumulation, as studies have reported that higher pH environments facilitate the uptake of organic acids by bacteria, thereby influencing by-product generation. The final pH for N2 reached 9.7–9.9; these alkaline conditions are unfavorable for most metabolic activities, with increased energy demands for pH homeostasis and cell maintenance [20,21]. This suggests that higher metabolic activities took place before the pH reached moderate to highly alkaline conditions.
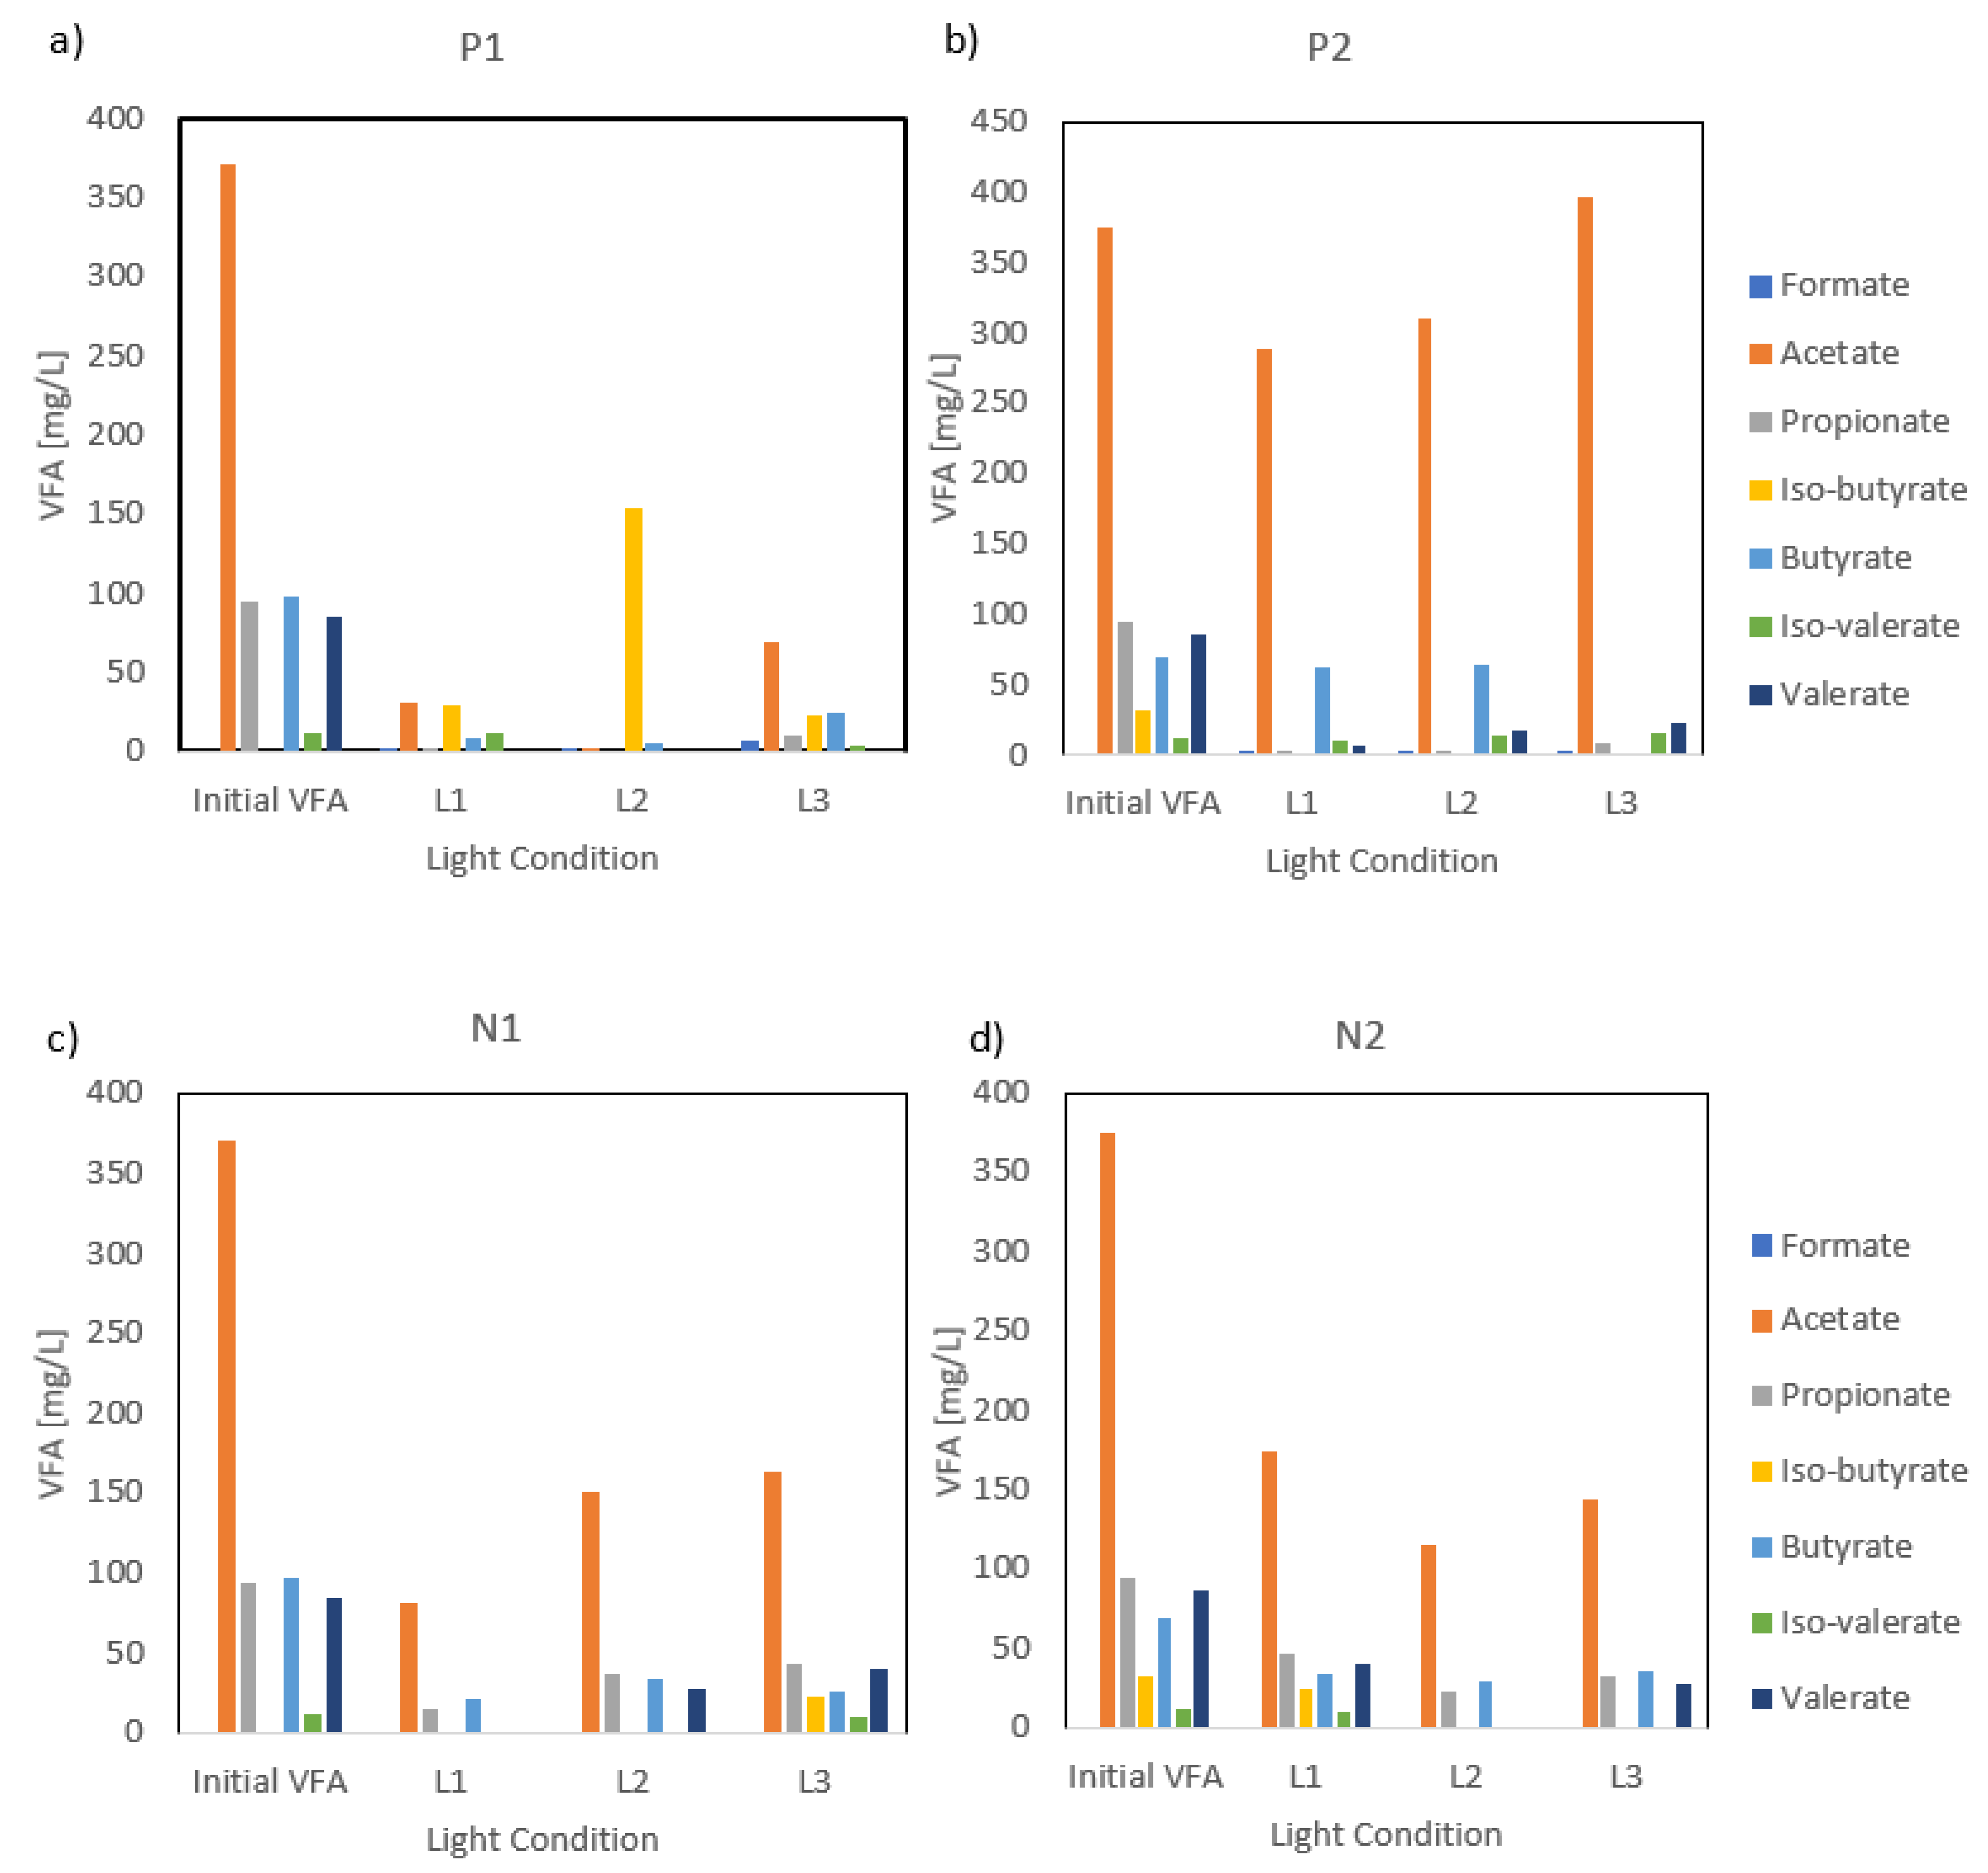
The presence or reduction of N did not affect the assimilation of VFAs, but effects for P were observed. In accordance with carbon removal trends, the removal of VFAs was more pronounced during the P1 treatment compared with P2 (Figure 4). Nutrient availability during P1 showed a preference for acetate, propionate, and valerate consumption, with 91%, 96%, and 100% removal of acetate, propionate, and valerate assimilated from the initial 371 mg-acetate L−1, 94 mg-propionate L−1, and 85 mg-valerate L−1, respectively. P reduction during P2 showed that the production of iso-butyrate was absent as the compound was not detected at the beginning or the end of the P2 stage, while an abundance of P in the medium resulted in an increased iso-butyrate production in the medium, with a value of 86 mg-iso-butyrate L−1 at the end of P1. The enhanced VFA removals during P1 were likely attributed to the more favorable pH conditions, which increased the PPB metabolic activities and organic carbon uptake efficiency. In contrast, the removal values significantly dropped during the second stage and were most likely linked to the initial pH values, as discussed previously. The lower initial pH values observed in P2 (6.2–6.8) may have negatively influenced enzyme activity and transport mechanisms, which may have limited VFA assimilation. Previous studies have confirmed that pH variations can influence organic substrate uptake in PPB and alter metabolic pathways, resulting in different VFA removals [18]. Overall, various VFA assimilations were observed over both stages and wes more likely due to pH-induced metabolic constraints. However, no significant difference was observed between the end of each set of the experiment.
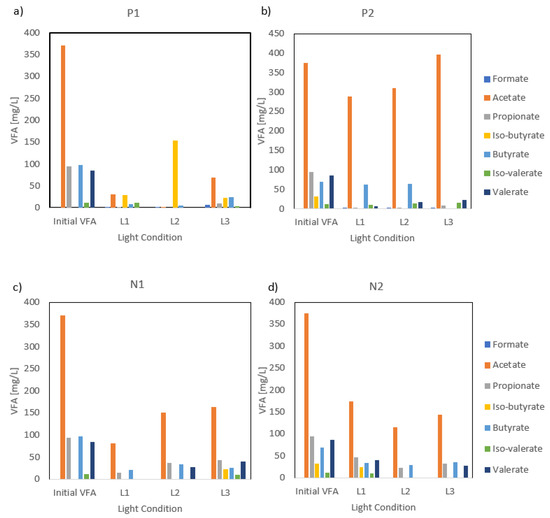
Figure 4.
(a) VFA consumption trends per light type under the first stage of P reduction and (b) the second stage of P reduction; (c) VFA consumption trends per light type under the first stage of N reduction and (d) second stage of N reduction.
Overall, a single-stage operation displayed better nitrogen removal efficiencies, whereas a two-stage setup with a reduction in one nutrient concentration hindered organic uptake and consequently affected other metabolic activities. However, an extended period of N reduction appeared to enhance P uptake from the medium, resulting in higher P removal efficiencies. This indicates that, while single-stage setups are more effective for nitrogen recovery, nutrient imbalance may favor P recovery dynamics. In nitrogen-rich environments, microbial communities prioritize N assimilation, which can affect other nutrient uptakes. However, under N-reduced conditions, the bacteria may shift toward alternative pathways that affect P utilization.
3.2. Biomass Growth
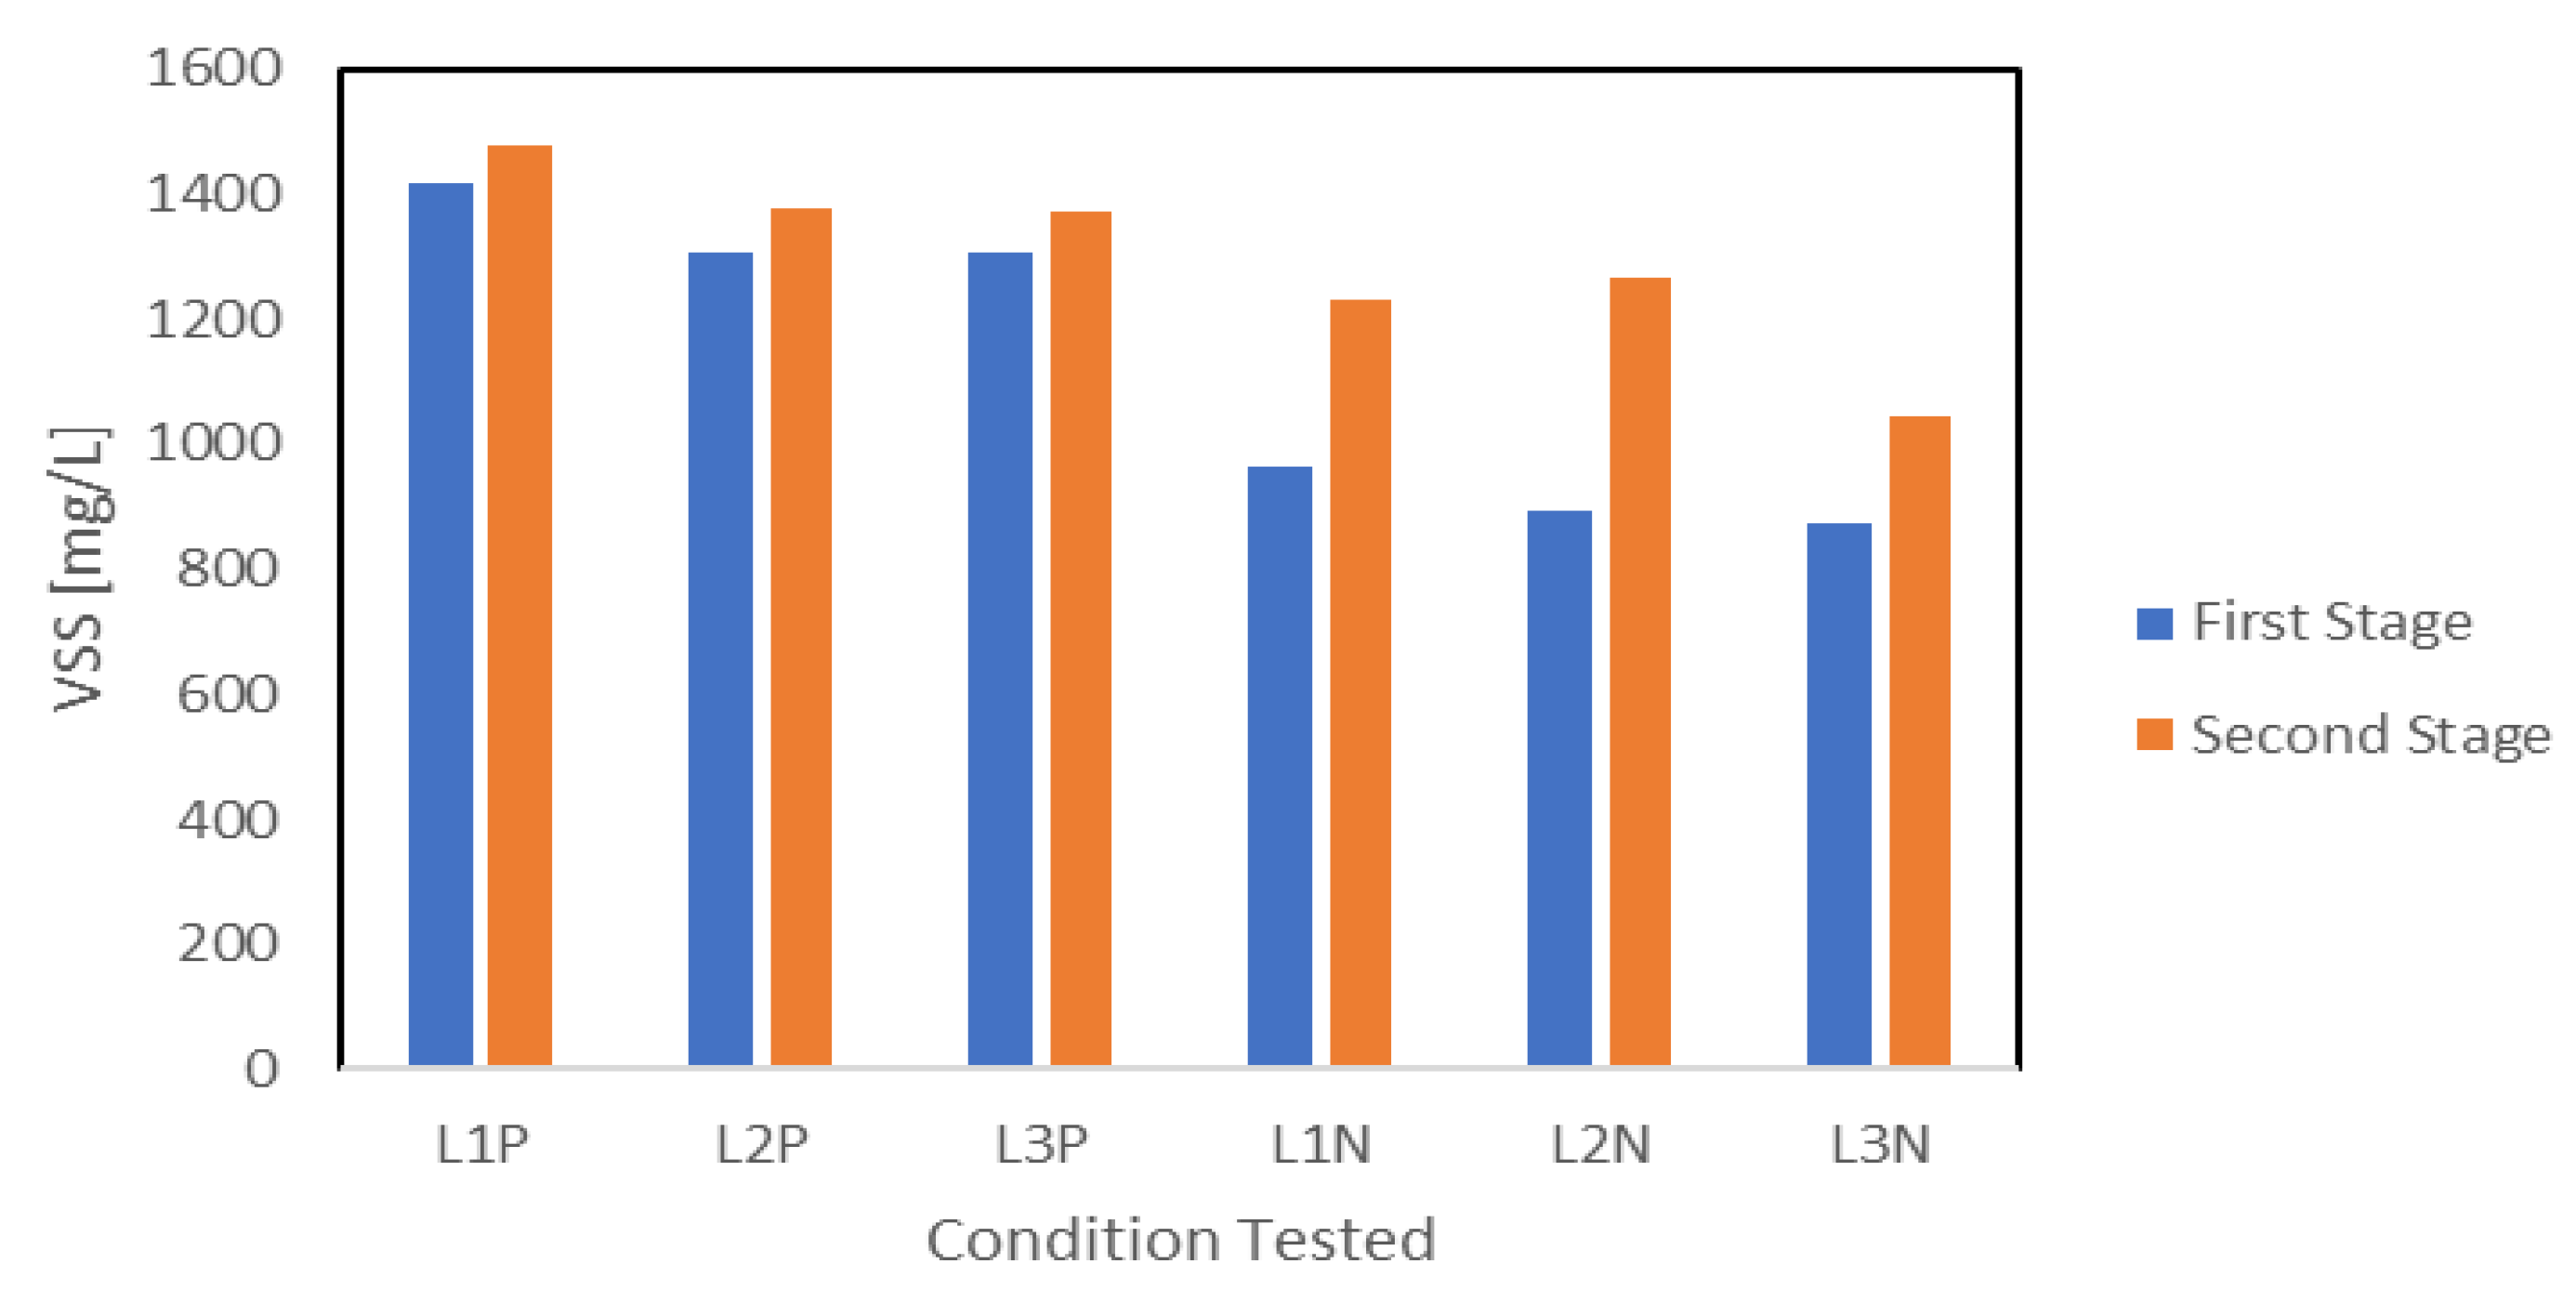
VSS measurements were used to evaluate the biomass growth at the end of each stage. The results are summarized in Figure 5. Biomass accumulation trends indicated that a large percentage of biomass accumulation happened during the first stage under nutrient availability, while limited growth took place during the second stage under nutrient reduction. P reduction conditions resulted in slightly higher biomass accumulation compared with N reduction during the first stage. Biomass growth averaged 1343 mg-VSS L−1 under P1 compared with only 911 mg-VSS L−1 under N1. During the second stage, biomass accumulation reached 1408 mg-VSS L−1 under P2 and 1182 mg-VSS L−1 under N2. Given that the initial conditions of the first stage were identical for P1 and N1, the difference in biomass accumulation observed was attributed to variations in initial biomass concentration rather than operational conditions. P reduction led to minimal additional growth, suggesting that P presence was a key limiting factor. In contrast, N reduction allowed for continued biomass accumulation but at a slower rate compared with the first stage. Slower biomass growth rates were frequently reported under nutrient reduction [7,8,22]. Another important factor influencing biomass accumulation in the second stage was limited light penetration due to increased biomass density. As cell concentrations increased, light penetration likely decreased, reducing the efficiency of phototrophic growth. This phenomenon has been previously observed in PPB systems, where higher biomass densities limited light availability and subsequently slowed down metabolism [18]. Overall, the presence of nutrients played a critical role in supporting growth, while nutrient reduction in addition to limited light penetration led to varying degrees of restriction.

Figure 5.
VSS value reduction and N reduction at the end and second stage.
The substrate-to-biomass conversion ratio (CODbiomass/CODsubstrate) averaged 0.39–0.49 mg-CODbiomass (mg-CODconsumed)−1 for P reduction and 0.24–0.33 mg-CODbiomass (mg-CODconsumed)−1 for N reduction over the first stage (calculated from VSS using a conversion factor of 1.35 [23]). These ratios were less than the near-to-perfect conversion ratio of 1 achieved by Alloul et al. [23], suggesting that not all organic carbon was converted into biomass. During the second stage, the substrate-to-biomass conversion ratio dropped to 0.21–0.38 mg-CODbiomass (mg-CODconsumed)−1 for P reduction, indicating a further shift away from biomass growth. These values imply that a portion of organics was redirected toward other activities such as catabolism or by-product storage. The former would be associated with a strong presence of chemoheterotrophic bacteria within the community. However, the ratio increased to 0.26–0.52 mg-CODbiomass (mg-CODconsumed)−1 for N reduction during the second stage, indicating that a larger fraction of the organics was utilized toward biomass growth compared with the first stage. This was likely due to a reduction in maintenance energy demands, leading to more efficient biomass production.
Biomass accumulation showed only a minor increase from P1 to P2, increasing from an average of 1343 mg-VSS L−1 to 1408 mg-VSS L−1, despite a lower initial pH during P2. The limited growth in P2 suggested that the slightly acidic environment could also be detrimental to biomass growth. In contrast, there was a significant increase in biomass accumulation from 911 mg-VSS L−1 under N1 to 1182 mg-VSS L−1 under N2, alongside a slightly alkaline pH. In addition to N2, both N1 and P1 also showed good growth, but, as a result, all three reached an alkaline final pH that exceeded 9.37, which could have influenced the biomass metabolic activities. Under alkaline conditions, microbial communities can shift toward pathways that enhance NH4+ and P assimilation, supporting continued biomass growth even under nutrient limitation and depletion. This pH shift has been observed previously and is reported to slow down biomass growth while simultaneously promoting by-product synthesis [20,24].
Nutrient availability directly affected biomass accumulation, as both P and N were essential for microbial growth. The yield of biomass per P consumed (YVSS/P) was significant during the nutrient abundance stage but decreased considerably during P2 from 225.9 to 19.1 mg-VSS (mg-P)−1. Similarly, under N reduction, YVSS/P dropped from 152.0 to 26.5 mg-VSS (mg-P)−1 during the second stage. The results suggest that P utilization for biomass production became less efficient due to the reduced microbial growth and metabolic shifts that prioritize cell maintenance and survival overactive growth. The lower YVSS/P values indicate that biomass may have adapted by redirecting available resources toward stress response strategies such as storage of intracellular by-products based on changes in stoichiometric removals [25]. Shifts in nutrient availability alter how P was utilized by cells, with balanced ratios promoting biomass growth and imbalanced conditions favoring alternative pathways. Additionally, the yield of biomass per N consumed (YVSS/N) decreased from 22.5 mg-VSS (mg-N)−1 to 2.5 mg-VSS (mg-N)−1 under P reduction conditions but increased from 15.7 mg-VSS (mg-N)−1 to 21.9 mg-VSS (mg-N)−1 under N reduction. The results indicate a slightly more efficient usage of N under N reduction conditions, likely as a reaction to optimize cell growth.
3.3. Light Wavelength Impact
Exposure to different light wavelengths can affect PPB growth and metabolic activities. High biomass accumulation was observed under L1, where an additional exposure to far-red wavelengths (700–770 nm) supported PPB growth at a rapid pace regardless of nutrient concentrations. The significant growth can be attributed to the additional far-red wavelengths but also to reduced competition from other microorganisms such as microalgae, which are known to thrive under shorter wavelengths [26]. L2, in contrast, lacked sufficient IR intensity, and its spectral range overlapped more with microalgal optimal growth wavelengths, suggesting that competition with microalgae for light could be a factor in the reduced biomass accumulation. Additionally, lower biomass growth values were observed under the L3 lights, which could be explained by the presence of strong UV peaks below 400 nm. Studies have demonstrated that, while PPB can tolerate UV to a degree, excessive UV radiation may cause photodamage, reduce photosynthetic efficiency, and limit overall metabolic activity [10]. Overall, the broad range of visible wavelengths provided by L1 (400–850 nm) resulted in the highest biomass content, while additional UV and IR wavelengths as seen in L3 did not provide further enhancement in biomass growth. Many studies showed that far-red (700–770 nm) wavelengths enhanced PPB growth significantly. However, the VSS values observed in this study were lower than those typically reported under NIR exposure. For instance, Qi et al. [12] achieved a biomass concentration of 1625 mg-VSS L−1 at 850 nm NIR LED, whereas, in this study, the maximum VSS concentrations were 1371 mg-VSS L−1 under P reduction and 1047 mg-VSS L−1 under N reduction using the L3 light source. While Qi et al. [12]’s experiment was conducted over a shorter duration of 6 days with a higher initial substrate concentration of 4000 mg-COD L−1, this study used a lower COD concentration of 2400 mg-COD L−1, fed twice over a longer period of 14 days. Given the extended experimental time and similar total organic loading of this study, higher biomass might be expected if conditions were optimal. However, the lower biomass observed under L3 suggests that factors beyond substrate and duration may have negatively impacted bacterial metabolism and counteracted the expected benefits of IR. The simultaneous presence of UV in L3 could be a possible explanation for the reduced overall biomass accumulation. This supports the conclusion that, while IR wavelengths promote biomass growth, the presence of shorter-wavelength UV radiation may disrupt microbial metabolic processes and ultimately limit overall biomass yield.
The highest organics removal was observed under L2 lights over the first stage, reaching 73.2% and 57.8% COD removal for P1 and N1, respectively, despite the light type having a lower impact on biomass growth. N reduction showed no significant difference in COD removal based on light type during the N2 stage, as COD removal hovered at 36% to 39%. However, P reduction resulted in a doubling of organics removal compared with other light types under similar testing conditions. A comparison between COD: N:P ratios of influent (beginning of stage 1) and effluent (end of stage 2) for each nutrient condition is presented in Table S1. Findings by Zhou et al. [11] indicated that red LED (650 nm) light achieved the highest COD removal and outperformed the incandescent lamp and white light (400–700 nm). Qi et al. [12] found that an NIR wavelength of 850 nm resulted in the highest COD removal efficiency of 70.6%, whereas longer IR wavelengths led to lower organic degradation efficiency. Additionally, Yu et al. [27] demonstrated that full-spectrum light (400–2500 nm) achieved high COD removal, exceeding 90%, while IR light alone performed worse. Our results are in line with the literature findings, where longer wavelengths improved COD removal, but longer IR wavelength exposure, such as in L3, did not enhance carbon degradation efficiency.
In terms of VFAs, the profiles varied slightly based on the light type used (Figure 3). Acetate degradation was dominant in all the conditions tested, suggesting a preference for acetate as a primary source of organics. VFA profiles of L1 and L3 showed comparable trends for P1 and N1, with minor variations in individual VFA concentrations. However, the L2 profile exhibited a distinct pattern regarding the consumption of iso-butyrate. Under P1 conditions, iso-butyrate production occurred, reaching 153.1 mg L−1, but under N1 conditions, iso-butyrate was completely depleted. Despite similar testing conditions, this suggests that L2 might trigger different metabolic pathways depending on the interaction with the initial culture. Overall, L1 showed the highest removal concentrations for each individual VFA for all P1, P2, and N1. However, L2 displayed the highest VFA degradation values under N reduction, suggesting that N might play a more significant role in VFA uptake in the absence of the far-red range. Previous studies have reported that VFA consumption fluctuates depending on the type of light and light cycling, with far-red and IR ranges being associated with higher VFA removal efficiencies [26]. However, our findings indicate that this trend is not universal. This study showed that UV and IR ranges did not result in the highest VFA removals, suggesting that light wavelengths alone do not influence VFA degradation. Additional factors such as microbial community shifts and/or retention time might play a larger role in influencing VFA consumption [23].
During the first stage, N and P removal values averaged 59.0 mg-N L−1 and 6.0 mg-P L−1, respectively, with minimal variations across different light wavelengths. However, in the second stage, following N or P reduction, N removal decreased significantly, with L1 achieving the highest values of 15.5 mg-N L−1 under N2 and 35.1 mg-N L−1 under P2. On the other hand, P removal trends differed between the two stages. Under P reduction, P removal decreased, with L3 showing the highest value 4.35 mg-P L−1. However, under N reduction, P removal increased, reaching a maximum of 13.0 mg-P L−1 under L3. This suggests that an imbalance of nutrients can trigger other metabolic activities to adapt to light conditions.
The results suggest that lights with red and/or far-red wavelengths, such as L1, are the most suitable for biomass growth and N removal. A narrow visible range, such as L2, resulted in moderate biomass growth and chemical characteristics, while a full spectrum of light that included UV and IR ranges did not improve biomass growth performance or the organics uptake, but it did improve P recovery under N reduction conditions only. Additionally, these findings indicate that under nutrient availability, nutrient removal seems to be governed by biomass growth rather than light conditions. However, under nutrient imbalance, exposure to red wavelengths such as L1, or longer wavelengths, such as those in L3, can improve nutrient assimilation, suggesting that specific spectral ranges may aid metabolic adaptation under reduced nutrient concentrations.
3.4. PHA Accumulation
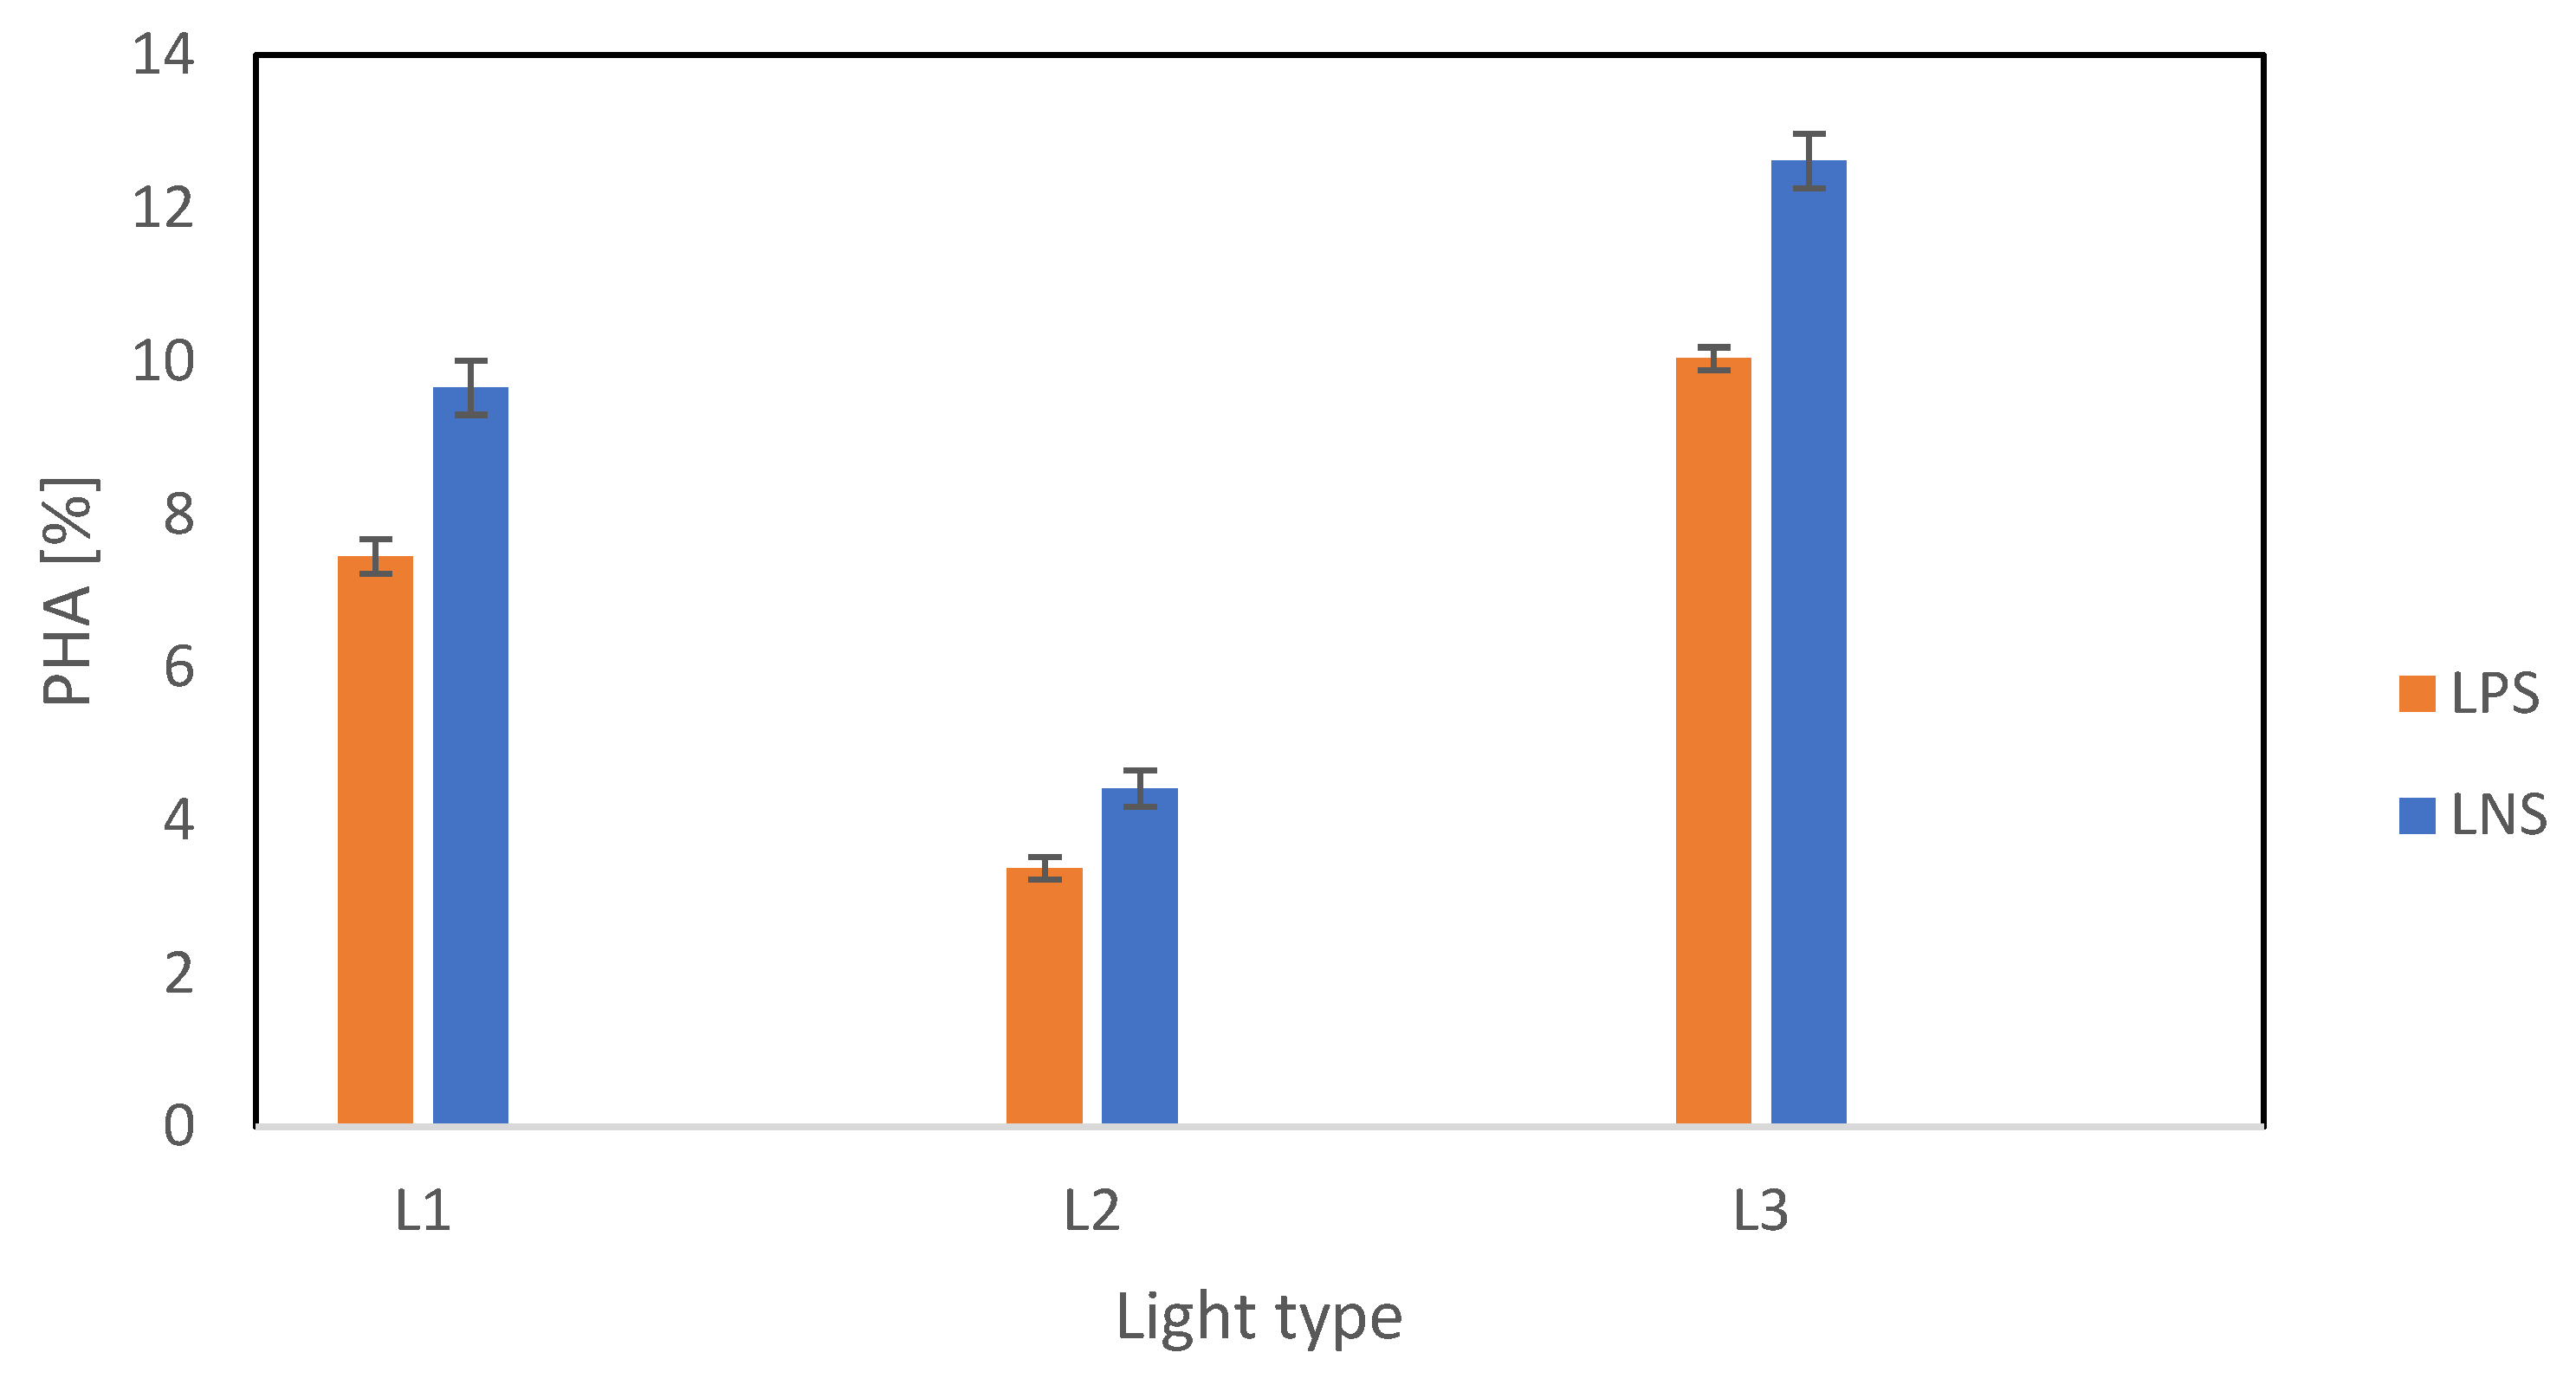
PHA accumulation was measured at the end of the second stage. The results summarized in Figure 6 show significant variation across the three light types. The highest PHA content was recorded under L3, with values of 10.0% CDW and 12.6% CDW for P2 and N2, respectively. This suggests that a full spectrum of light is optimal for PHA accumulation. L1 resulted in moderate PHA accumulation, while the lowest biopolymer productivity was observed under L2, with values of 3.4% CDW and 4.4% CDW for P2 and N2, respectively, confirming that a narrow light spectrum is suboptimal for PHA accumulation. It is clear that light wavelengths play a substantial role in PHA accumulation in PPB. An inverse relationship between biomass growth and PHA accumulation was observed. The lowest biomass growth resulted in the highest PHA content, especially under L3. Higher PHA accumulation was previously observed in conditions with low biomass content [28]. This implies that a maximal biomass is not required to achieve the highest PHA content, but it reaffirms the role of light quality in regulating the pathways of carbon usage for biomass growth and by-product accumulation.

Figure 6.
PHA content as cell content percentage across different light types under P-reduction and N reduction.
N reduction resulted in higher PHA content compared with P reduction, irrespective of the light condition. This was a result of reduced nitrogenase activity from the environment, which diverted metabolic pathways from N assimilation and biohydrogen production toward carbon storage. This study’s final N concentrations ranged between 49.4 and 57.3 mg-N L−1 for P2, while the final concentrations for N2 ranged between 17.9 and 21.6 mg-N L−1. The literature suggests that nitrogenase inhibition begins at N concentrations as low as 0.36 mg-N L−1 [29] and is completely repressed at concentrations exceeding 36 mg-N L−1 [30], indicating nitrogenase may be partially active for N2 but fully repressed for P2. P reduction resulted in 10.0% CDW. Although less effective than N reduction, our results suggest that PHA production can still be significant under P reduction. Multi-step approaches involving P reduction have been previously investigated, with P cycling resulting in 20% PHA/VSS content [31] and combined N and P reduction resulting in the highest PHA content of 23.4% CDW [32]. Two-step setups have been shown to be beneficial for PHA accumulation, as demonstrated by Vincenzini et al.’s work [8].
PHA accumulation is primarily governed by the light type. High PHA content does not correlate with high COD removal, particularly under N reduction, where carbon uptake is directed toward intracellular storage rather than cell growth. This is supported by Montiel-Corona and Buitrón’s work [16], which investigated the impact of N and P deficiency on PHA accumulation. The group reported that the absence of N resulted in 6.8% PHA and 39% COD removal, while P deficiency resulted in 3.8% PHA and 52% COD removal. These findings highlight that, while P reduction promotes a direct link between organics uptake and PHA accumulation, N reduction induces a metabolic shift where carbon is preferentially stored rather than utilized for biomass growth.
4. Conclusions
This study explored the ability of PPB to accumulate PHAs using a two-stage setup and varied light wavelengths, and wastewater treatment capabilities. The first stage focused on maximizing biomass under nutrient availability, while the second stage targeted PHA accumulation through the reduction of N or P concentrations. Organics removal decreased during the second stage of nutrient reduction, especially under P reduction, while N reduction was associated with doubled P recovery from the media. Biomass growth was highest under nutrient-available conditions. While biomass remained almost stationary under P reduction with limited growth, a comparatively larger increase in biomass content was observed under N reduction conditions Nutrient reduction appeared to influence PHA content, with maximum PHA content reaching 12.6% and 10.0% CDW under N reduction and P reduction, respectively. Full spectrum light with UV and IR found in L3 proved most effective for enhancing PHA accumulation, whereas white light with far-red wavelengths, found in L1, was associated with higher biomass growth. The results support the observed inverse relationship between PHA accumulation and biomass growth under nutrient reduction, where lower biomass coincided with higher PHA accumulation. These findings highlight the complex relationships between PPB, environmental factors, and by-products, but also suggest the potential to optimize initial environmental concentrations and light conditions to achieve specific targets, such as maximizing PHA accumulation, nutrient recovery, or organic removal. Future research could explore the effects of dark/light cycling and the light photo period to further optimize PHA accumulation and scale up this application.
Supplementary Materials
The following supporting information can be downloaded at: https://www.mdpi.com/article/10.3390/fermentation11040216/s1, Table S1: Stoichiometric COD:N:P ratios of influent (initial concentrations, Stage 1) and effluent (final concentrations, Stage 2) across nutrient conditions. Ratios are normalized to COD = 100.fi.
Author Contributions
Conceptualization, S.S. and H.R.M.; Methodology, S.S. and H.R.M.; Formal Analysis, S.S.; Investigation, S.S.; Data Curation, S.S.; Writing—Original Draft Preparation, S.S.; Writing—Review and Editing, G.M. and H.R.M.; Supervision, G.M. and H.R.M.; Project Administration, G.M. and H.R.M.; Funding acquisition, H.R.M. All authors have read and agreed to the published version of the manuscript.
Funding
This research was funded by the Qatar National Research Fund, Grant number NPRP11-S-0110-180245.
Institutional Review Board Statement
Not applicable.
Informed Consent Statement
Not applicable.
Data Availability Statement
The data presented in this study are available on request from the corresponding author.
Acknowledgments
The authors would like to acknowledge the Shell Research and Technology Centre for their technical support.
Conflicts of Interest
The authors declare no conflicts of interest.
Abbreviations
The following abbreviations are used in this manuscript:
| APHA | American Public Health Association |
| ANOVA | Analysis of Variance |
| ATCC | American Type Culture Collection |
| BChl | Bacteriochlorophyll |
| CDW | Cell Dry Weight |
| COD | Chemical Oxygen Demand |
| C/N Ratio | Carbon-to-Nitrogen Ratio |
| C/P Ratio | Carbon-to-Phosphorus Ratio |
| CV | Coefficient of Variation |
| FSW | Fuel Synthesis Wastewater |
| GTL | Gas-to-Liquid |
| IR | Infrared |
| L1, L2, L3 | Light sources used in the experiment |
| N | Nitrogen |
| NIR | Near-Infrared |
| P | Phosphorus |
| PHA | Polyhydroxyalkanoates |
| PPB | Purple Phototrophic Bacteria |
| PVDF | Polyvinylidene Fluoride |
| TSS | Total Suspended Solids |
| TOC | Total Organic Carbon |
| UV | Ultraviolet |
| UV-vis | Ultraviolet-visible Spectrophotometry |
| VFA | Volatile Fatty Acids |
| VSS | Volatile Suspended Solids |
References
- Hülsen, T.; Batstone, D.J.; Keller, J. Phototrophic Bacteria for Nutrient Recovery from Domestic Wastewater. Water Res. 2014, 50, 18–26. [Google Scholar] [CrossRef] [PubMed]
- Tanskul, S.; Srisai, S.; Nualla-Ong, A. A Purple Non-Sulfur Bacterium Producing Polyhydroxybutyrate and the Conserved Region of PHA Synthase Gene. Biosci. J. 2016, 32, 1341–1351. [Google Scholar] [CrossRef]
- Basak, N.; Das, D. The Prospect of Purple Non-Sulfur (PNS) Photosynthetic Bacteria for Hydrogen Production: The Present State of the Art. World J. Microbiol. Biotechnol. 2007, 23, 31–42. [Google Scholar] [CrossRef]
- Carpine, R.; Olivieri, G.; Hellingwerf, K.J.; Pollio, A.; Marzocchella, A. Industrial Production of Poly-β-Hydroxybutyrate from CO2: Can Cyanobacteria Meet This Challenge? Processes 2020, 8, 323. [Google Scholar] [CrossRef]
- Majone, M.; Aulenta, F.; Dionisi, D.; D’Addario, E.N.; Sbardellati, R.; Bolzonella, D.; Beccari, M. High-Rate Anaerobic Treatment of Fischer–Tropsch Wastewater in a Packed-Bed Biofilm Reactor. Water Res. 2010, 44, 2745–2752. [Google Scholar] [CrossRef]
- Montiel-Corona, V.; Buitrón, G. Polyhydroxyalkanoates and 5-Aminolevulinic Acid Production by a Mixed Phototrophic Culture Using Medium-Chain Carboxylic Acids from Winery Effluents. Bioresour. Technol. 2023, 373, 128704. [Google Scholar] [CrossRef]
- Carlozzi, P.; Giovannelli, A.; Traversi, M.L.; Touloupakis, E.; Di Lorenzo, T. Poly-3-Hydroxybutyrate and H2 Production by Rhodopseudomonas sp. S16-VOGS3 Grown in a New Generation Photobioreactor under Single or Combined Nutrient Deficiency. Int. J. Biol. Macromol. 2019, 135, 821–828. [Google Scholar] [CrossRef]
- Vincenzini, M.; Marchini, A.; Ena, A.; De Philippis, R. H and Poly-β-Hydroxybutyrate, Two Alternative Chemicals from Purple Non Sulfur Bacteria. Biotechnol. Lett. 1997, 19, 759–762. [Google Scholar] [CrossRef]
- Fradinho, J.C.; Reis, M.A.M.; Oehmen, A. Beyond Feast and Famine: Selecting a PHA Accumulating Photosynthetic Mixed Culture in a Permanent Feast Regime. Water Res. 2016, 105, 421–428. [Google Scholar] [CrossRef]
- Kuo, F.-S.; Chien, Y.-H.; Chen, C.-J. Effects of Light Sources on Growth and Carotenoid Content of Photosynthetic Bacteria Rhodopseudomonas palustris. Bioresour. Technol. 2012, 113, 315–318. [Google Scholar] [CrossRef]
- Zhou, Q.; Zhang, P.; Zhang, G. Biomass and Pigments Production in Photosynthetic Bacteria Wastewater Treatment: Effects of Light Sources. Bioresour. Technol. 2015, 179, 505–509. [Google Scholar] [CrossRef]
- Qi, X.; Ren, Y.; Tian, E.; Wang, X. The Exploration of Monochromatic Near-Infrared LED Improved Anoxygenic Photosynthetic Bacteria Rhodopseudomonas sp. for Wastewater Treatment. Bioresour. Technol. 2017, 241, 620–626. [Google Scholar] [CrossRef]
- APHA. Standard Methods for the Examination of Water and Wastewater, 21st ed.; American Public Health Association: Washington, DC, USA; American Water Works Association: Denver, CO, USA; Water Environment Federation: Alexandria, VA, USA, 2005.
- Law, J.H.; Slepecky, R.A. Assay of Poly-β-Hydroxybutyric Acid. J. Bacteriol. 1961, 82, 33–36. [Google Scholar] [CrossRef]
- Shaikh, S.; Rashid, N.; McKay, G.; Liberski, A.R.; Mackey, H.R. Nitrogen Influence on Suspended vs Biofilm Growth and Resource Recovery Potential of Purple Non-Sulfur Bacteria Treating Fuel Synthesis Wastewater. Biochem. Eng. J. 2023, 190, 108754. [Google Scholar] [CrossRef]
- Montiel-Corona, V.; Buitrón, G. Polyhydroxybutyrate Production in One-Stage by Purple Phototrophic Bacteria: Influence of Alkaline pH, Ethanol, and C/N Ratios. Biochem. Eng. J. 2022, 189, 108715. [Google Scholar] [CrossRef]
- Puyol, D.; Hülsen, T.; Padrino, B.; Batstone, D.J.; Martinez, F.; Melero, J.A. Exploring the Inhibition Boundaries of Mixed Cultures of Purple Phototrophic Bacteria for Wastewater Treatment in Anaerobic Conditions. Water Res. 2020, 183, 116057. [Google Scholar] [CrossRef] [PubMed]
- Fradinho, J.C.; Allegue, L.D.; Ventura, M.; Melero, J.A.; Reis, M.A.M.; Puyol, D. Up-Scale Challenges on Biopolymer Production from Waste Streams by Purple Phototrophic Bacteria Mixed Cultures: A Critical Review. Bioresour. Technol. 2021, 327, 124820. [Google Scholar] [CrossRef] [PubMed]
- Doki, M.M.; Mehta, A.K.; Chakraborty, D.; Ghangrekar, M.M.; Dubey, B.K.; Alloul, A.; Moradvandi, A.; Vlaeminck, S.E.; Lindeboom, R.E.F. Recovery of Purple Non-Sulfur Bacteria-Mediated Single-Cell Protein from Domestic Wastewater in Two-Stage Treatment Using High Rate Digester and Raceway Pond. Bioresour. Technol. 2024, 413, 131467. [Google Scholar] [CrossRef]
- Kourmentza, C.; Kornaros, M. Biotransformation of Volatile Fatty Acids to Polyhydroxyalkanoates by Employing Mixed Microbial Consortia: The Effect of pH and Carbon Source. Bioresour. Technol. 2016, 222, 388–398. [Google Scholar] [CrossRef]
- Zhou, W.; Colpa, D.I.; Geurkink, B.; Euverink, G.J.W.; Krooneman, J. The Impact of Carbon to Nitrogen Ratios and pH on the Microbial Prevalence and Polyhydroxybutyrate Production Levels Using a Mixed Microbial Starter Culture. Sci. Total Environ. 2022, 811, 152341. [Google Scholar] [CrossRef]
- Khatipov, E.; Miyake, M.; Miyake, J.; Asada, Y. Accumulation of Poly-β-Hydroxybutyrate by Rhodobacter sphaeroides on Various Carbon and Nitrogen Substrates. FEMS Microbiol. Lett. 1998, 162, 39–45. [Google Scholar] [CrossRef]
- Alloul, A.; Wuyts, S.; Lebeer, S.; Vlaeminck, S.E. Volatile Fatty Acids Impacting Phototrophic Growth Kinetics of Purple Bacteria: Paving the Way for Protein Production on Fermented Wastewater. Water Res. 2019, 152, 138–147. [Google Scholar] [CrossRef] [PubMed]
- McKinlay, J.B.; Oda, Y.; Rühl, M.; Posto, A.L.; Sauer, U.; Harwood, C.S. Non-Growing Rhodopseudomonas palustris Increases the Hydrogen Gas Yield from Acetate by Shifting from the Glyoxylate Shunt to the Tricarboxylic Acid Cycle. J. Biol. Chem. 2014, 289, 1960–1970. [Google Scholar] [CrossRef]
- Boelee, N.C.; Temmink, H.; Janssen, M.; Buisman, C.J.N.; Wijffels, R.H. Nitrogen and Phosphorus Removal from Municipal Wastewater Effluent Using Microalgal Biofilms. Water Res. 2011, 45, 5925–5933. [Google Scholar] [CrossRef]
- Hülsen, T.; Hsieh, K.; Tait, S.; Barry, E.M.; Puyol, D.; Batstone, D.J. White and Infrared Light Continuous Photobioreactors for Resource Recovery from Poultry Processing Wastewater—A Comparison. Water Res. 2018, 144, 665–676. [Google Scholar] [CrossRef]
- Yu, S.; Xu, Y.; Liang, C.; Lou, W.; Peng, L. Spectral Bands of Incandescent Lamp Leading to Variable Productivity of Purple Bacteria Biomass and Microbial Protein: Full Is Better than Segmented. Sci. Total Environ. 2022, 823, 153736. [Google Scholar] [CrossRef]
- Cabrera, F.; Torres, Á.; Campos, J.L.; Jeison, D. Effect of Operational Conditions on the Behaviour and Associated Costs of Mixed Microbial Cultures for PHA Production. Polymers 2019, 11, 191. [Google Scholar] [CrossRef]
- Wu, T.Y.; Hay, J.X.W.; Kong, L.B.; Juan, J.C.; Jahim, J.M. Recent Advances in Reuse of Waste Material as Substrate to Produce Biohydrogen by Purple Non-Sulfur (PNS) Bacteria. Renew. Sustain. Energy Rev. 2012, 16, 3117–3122. [Google Scholar] [CrossRef]
- Ghosh, S.; Dairkee, U.K.; Chowdhury, R.; Bhattacharya, P. Hydrogen from Food Processing Wastes via Photofermentation Using Purple Non-Sulfur Bacteria (PNSB)—A Review. Energy Convers. Manag. 2017, 141, 299–314. [Google Scholar] [CrossRef]
- Almeida, J.R.; Serrano, E.; Fernandez, M.; Fradinho, J.C.; Oehmen, A.; Reis, M.A.M. Polyhydroxyalkanoates Production from Fermented Domestic Wastewater Using Phototrophic Mixed Cultures. Water Res. 2021, 197, 117101. [Google Scholar] [CrossRef]
- Carlozzi, P.; Touloupakis, E.; Filippi, S.; Cinelli, P.; Mezzetta, A.; Seggiani, M. Purple Non-Sulfur Bacteria as Cell Factories to Produce a Copolymer as PHBV under Light/Dark Cycle in a 4-L Photobioreactor. J. Biotechnol. 2022, 356, 51–59. [Google Scholar] [CrossRef] [PubMed]
Disclaimer/Publisher’s Note: The statements, opinions and data contained in all publications are solely those of the individual author(s) and contributor(s) and not of MDPI and/or the editor(s). MDPI and/or the editor(s) disclaim responsibility for any injury to people or property resulting from any ideas, methods, instructions or products referred to in the content. |
© 2025 by the authors. Licensee MDPI, Basel, Switzerland. This article is an open access article distributed under the terms and conditions of the Creative Commons Attribution (CC BY) license (https://creativecommons.org/licenses/by/4.0/).