Article

Optimized Amino Acid-Enhanced Medium for Efficient L-Asparaginase II Production in E. coli: From Shake Flask to Bioreactor

by
Nicolás Lefin
1,
Javiera Miranda
1,
Iris Munhoz Costa
2,
Alejandro Pedroso Reynaldo
3,
Gisele Monteiro
2,
Mauricio Zamorano
1,
Adalberto Pessoa, Jr.
2 and
Jorge G. Farias
1,*
1
Department of Chemical Engineering, Universidad de La Frontera, Temuco 4811230, Chile
2
Department of Biochemical and Pharmaceutical Technology, School of Pharmaceutical Sciences, University of São Paulo, São Paulo 05508-000, Brazil
3
Departamento de Ciencias Básicas, Facultad de Ciencias, Universidad Santo Tomas, Temuco 8370003, Chile
*
Author to whom correspondence should be addressed.
Fermentation 2025, 11(5), 239; https://doi.org/10.3390/fermentation11050239
Submission received: 11 March 2025 / Revised: 7 April 2025 / Accepted: 16 April 2025 / Published: 23 April 2025
(This article belongs to the Special Issue Research on Microbial Protein Synthesis: 2nd Edition)

Abstract

:
L-asparaginase (L-ASNase) is a key enzyme in the treatment of leukemia and lymphoma, with high demand in cancer therapies. Advances in recombinant protein production have improved yields and reduced costs, enabling large-scale production. However, optimizing culture conditions remains crucial for maximizing production. This study focused on optimizing the production of double mutant L-ASNase expressed in Escherichia coli BL21 (DE3) by supplementing media with amino acids. Five amino acids were evaluated at a shake flask scale using the design of experiments, with arginine and aspartate showing the most positive effects. Under optimized conditions (14.5 mM arginine, 12.7 mM aspartate, and 0 mM cysteine), the activity model reached 12,513 U L−1, experimentally validated at 10,089 U L−1. The maximum specific cell growth rate was µx,max = 0.74 h−1, with substrate–biomass conversion factor Yx/s = 1.16 g/g and cell–product conversion factor Yp/x = 13,891 U/gcell. Amino acid supplementation resulted in a ten-fold increase in L-ASNase activity. Finally, at the bioreactor scale, adding amino acids and the inducer at the end of the exponential phase increased activity by 135% compared to conventional MD, demonstrating its potential for industrial-scale production.

1. Introduction

The enzyme market has experienced growth in recent years due to the increase in the variety of applications of these molecules. Enzymes are used in industry to accelerate chemical processes, and when more applications are available for their use, new opportunities open for their use in different industries and purposes. This has increased the demand for enzymes, which has driven the enzyme market. For example, enzymes can be used in food production to accelerate fermentation or ripening, or in the production of drugs for the treatment of different diseases [1]. A recent report states that the global market for industrial enzymes for food purposes reached nearly USD 3.12 billion in 2022 and is expected to increase at a compound annual growth rate (CAGR) of 4.7% between 2022 and 2032, reaching revenue of USD 4.94 billion [2], while in 2021 the total biopharmaceuticals marker reached USD 345.84 billion and is estimated to reach USD 974.48 billion by 2030 with a CAGR of 11.7% [3]. Among the enzymes with the highest global production is L-asparaginase (L-ASNase), which contributes to one-third of the global requirement for anti-leukemic and anti-lymphoma agents, establishing it as one of the therapeutics enzymes with the highest industrial potential [4]. Advances in recombinant protein production have made it possible for yields to be much higher at lower costs, enabling the production of this type of protein on an industrial scale [5,6]. Escherichia coli (E. coli) is a frequently used host for recombinant protein production, and this is due to its rapid growth rates, easy handling, and cost-effectiveness in recombinant protein production [5,7,8]. However, the choice of culture conditions and their subsequent optimization are of great importance as they directly impact the volumetric yield of the recombinant protein. Therefore, it is essential to evaluate each culture condition for L-ASNase expression to enable its optimization [8]. This is because after the successful development of the host strain capable of producing the protein, culture conditions (e.g., medium composition, pH, growth temperature, cell density, inducer concentration, induction time, etc.) that affect the level of recombinant protein expression must be evaluated [6]. According to Tripathi (2016), the first step in improving recombinant protein expression is to optimize the media composition and conditions at the shake flask scale [9]. Macro- and microelements, inducers, growth factors, temperature, inoculum concentration, and pre-inoculum preparation should be determined to enable maximum growth and productivity. Important parameters, such as cell growth; final cell concentration and product yield; substrate consumption and production rate; and productivity as a function of time, are commonly used to characterize bioprocesses [10]. Shake flask experiments are important to study the performance of microorganisms with minimal costs and material; therefore, it is widely used to optimize some process conditions, such as carbon and nitrogen sources and concentrations, and the presence of microelements, among others [11]. Recently, the importance of the use of amino acids in the optimization of defined media has been observed [12,13,14]. High-density culture of E. coli has been the preferred method for obtaining large quantities of recombinant proteins for years. These media are called chemically defined media (CDM) and generally use specific carbon and nitrogen sources, along with trace elements indispensable for the organisms, to ensure the precise control of bacterial culture and low variability. However, this media does not maximize protein expression and therefore, does not guarantee optimal performance, and additional high glucose concentrations and the lack of amino acids affect bacterial growth, so various techniques have been proposed to reduce this problem such as controlled feeding glucose [15]. Additionally, complex media have been used to satisfy the metabolic demand of amino acids, which are indispensable precursor molecules for protein synthesis, in addition to being a source of undefined nitrogen and carbon. These media (e.g., Luria–Bertani (LB)) generally used yeast, or peptone extracts, due to their large amounts of amino acids. The problem with using these media is the impurities, poor cleanliness, and batch-to-batch variation in these amino acid sources compared to defined media, making it difficult to further process proteins for therapeutic use [13]. Therefore, optimizing CDM supplemented with critical amino acids could enhance the production of enzymes for therapeutic use while maintaining purity during their processing. This media is called chemically defined media optimized, and by taking as a basis the defined medium and additionally incorporating adjustments and strategies such as the addition of amino acids and other chemical compounds that favor cell growth and proliferation and protein production, in this case, L-asparaginase, efficiency can be maximized based on experimental optimization and adaptability. As mentioned above, prior to scale-up, the optimization of process variables is required. Statistical tools have been employed to determine the effect of culture and yield parameters and process outcomes [16].
One of the best approaches to examine the effect of multiple factors, as well as the effect of their interactions on a process, is the statistical design of experiments (DoE) approach [17,18]. This approach has been successfully used in the development, optimization, and evaluation of many biochemical processes [19]. L-ASNase is an enzyme capable of catalyzing the hydrolysis of L-asparagine, delivering mainly L-aspartic acid and ammonia as a product [20]. This enzyme is currently used as a mitigating agent for acrylamide, a known potential carcinogen (level 2A) and a major neurotoxicant in the food industry, to reduce its formation in many food products [1]. In addition, it is widely used as an antitumor drug for the treatment of acute lymphoblastic leukemia (ALL), as well as to treat other hematological and non-hematological diseases, such as pancreatic cancer, lymphosarcoma, and acute myeloid leukemia. Currently, there are several formulations of L-ASNase commercially available for clinical use, including those of bacterial origin, such as native, PEGylated, and recombinant L-ASNase from E. coli, as well as those from native Dickeya dadantii (D. dadantii). In addition, there are L-ASNases of fungal origin that are approved for food use, such as those from Aspergillus oryzae and Aspergillus niger [21,22]. All these formulations have been tested to improve their safety [23,24,25]. However, none of these formulations has been able to efficiently reduce side effects. Therefore, it is of relevance to look for products that allow the decrease in harmful clinical reactions, taking care of the composition used for production, such as the immunological effects of the body caused by the bacterially derived L-ASNase itself [1,26]. On the other hand, a study by our group conducted by Munhoz Costa et al. (2022), by directed evolution, obtained a double mutant ASNase from D. dadantii. The term double mutant refers to two specific mutations that were introduced into the asnB gene, the asparaginase gene of D. dadantii. One of the mutations was Q227E, which introduces a negative charge, and the other mutation was V272M, which replaces the amino acid valine with a methionine on the surface of the protein. These mutations, in addition to having a 46% higher specific activity than the wild-type enzyme, also present a reduction in glutaminase activity by 40% and a decrease in the immunogenic effect of 62.5%, making this a promising enzyme [27].
The present study allows the development of an optimization strategy to produce the double mutant L-ASNase from D. dadantii expressed in recombinant E coli BL21 (DE3) with reduced immunogenicity at the shake flask scale, by design of experiments for the evaluation of five amino acids (serine, glutamine, arginine, cysteine, and aspartate), using a 25 factorial design.
After selecting the most significant nutrients, we will proceed to their optimization using response surface methodology (RSM), taking as a response variable the total volumetric activity of the L-ASNase produced (UL-1), to finally evaluate and compare the productivities of both the optimized and non-optimized cultures at batch bioreactor scale [27].

2. Materials and Methods

2.1. Microorganism, Pre-Inoculum Preparation, and Fermentation Conditions

The clone of double mutant ASNase from ASNase derived from Dickeya dadantii (Erw_DM/pET-15b) expressed in Escherichia coli BL21 (DE3) strain [27] used in all the experiments was kindly provided by Dr. Gisele Monteiro from University of Sao Paulo, Brazil. The standard stock was prepared by inoculating isolate colonies into 250 mL baffled Erlenmeyer flask with 50 mL of LB medium (5.00 g L−1 of yeast extract; 10.00 g L−1 of tryptone; 5.00 g L−1 of sodium chloride; and 0.05 g L−1 of carbenicillin). This was incubated in an orbital shaker (New Brunswick Innova 4242R, Eppendorf, Hamburg, Germany) at 37 °C and 180 rpm for 16 h. This pre-inoculum was centrifugated at 4000× g for 20 min at 4 °C, and the cells were suspended in 40 mL cryopreservation medium (80% LB medium and 20% glycerol). Aliquots of 0.5 mL were maintained in cryotubes at −80 °C.

2.1.1. Inoculum Preparation and Cultivation Conditions

The inoculum (primary culture) was prepared by incubating 0.25 mL of the −80 °C glycerol cell stock in 50 mL of chemically defined medium (CDM) adapted from [28] Riesenberg et al. (1991) in a 250 mL baffled Erlenmeyer flask for 16 h at 37 °C and 250 rpm. The composition of the CDM was 5.00 g L−1 of glucose; 13.30 g L−1 of KH2PO4; 4.00 g L−1 of (NH4)2HPO4; 1.70 g L−1 of citric acid; 1.20 g L−1 of MgSO4·7H2O; 0.06 g L−1 of Iron(III) Citrate; 1.50 × 10⁻² g L−1 of MnCl2·4H2O; 0.80 × 10⁻² g L−1 of Zn(CH3COO)2·H2O; 0.30 × 10⁻² g L−1 of H3BO3; 0.25 × 10⁻² g L−1 of Na2MoO4·2H2O; 0.25 × 10⁻² g L−1 of CoCl2·6H2O; 0.15 × 10⁻² g L−1 of CuCl2·2H2O; 0.84 × 10⁻² g L−1 of EDTA·Na2; 0.45 × 10⁻² g L−1 of thiamine· HCl; and 0.05 g L−1 of carbenicillin. The pH was adjusted to 6.8 using 7N HCl and 10N NaOH solutions.

2.1.2. Shake Flask Experiments for 25 Full Factorial Design

All shake flasks of secondary cultures were performed in a 250 mL baffled Erlenmeyer (Schott Duran, Mitterteich, Germany) containing 50 mL of CDM supplemented with amino acids (CDM-S). This was inoculated by adding primary culture with an initial optical density (OD600nm) of 0.1. CDM containing each of the amino acids studied (arginine, aspartate, cysteine, serine, and glutamine) were prepared. These culture media were prepared with 37.5 mM of each amino acid (X5 of the highest concentration level of the experimental design (7.5 mM)), and it was sterilized using Stericup Quick Release, PVDF, 0.22 µm pore size (Merck Millipore, Burlington, MA, USA).
A total of 36 cultivation runs were performed at this step. The cultivation media were formulated according to the conditions and design presented in Table 1 and Table 2. The concentration of each component was selected based on the literature [12,14,29].
Aliquots of 0.50 mL were taken during the culture and the total volume removed was less than 10% of the initial volume. The experiments were incubated for 5 h (time in which half of the exponential phase was reached for supplemented CDM), and then the cells were induced by adding 0.5 mM Isopropyl β-d-1-thiogalactopyranoside (IPTG) for 3 h (these conditions were obtained in previous experiments). Finally, the bacterial cells were harvested through centrifugation (10,000× g for 10 min at 4 °C). The pellets were stored at −20 °C overnight and the supernatant was discarded.

2.1.3. Shake Flask Experiments for Central Composite Rotatable Design (CCRD)

All shake flasks of secondary cultures were performed in a 250 mL baffled Erlenmeyer (Schott Duran, Germany) containing 50 mL of CDM supplemented with the most three significant amino acids obtained in the 25 full factorial design. This was inoculated by adding primary culture with an initial Optical Density (OD600nm) of 0.1. CDM containing each of the amino acids studied (arginine, aspartate, and cysteine) were prepared. These culture media were prepared with 59.4 mM of each amino acid (X3 of the highest concentration level of the experimental design (19.8 mM)), and it was sterilized using Stericup Quick Release, PVDF, 0.22 µM pore size (Merck Millipore). The culture conditions of CCRD were the same as those mentioned in Section 2.1.2 for the 25 full factorial design experiments.

2.2. Bioreactor Experiments

To determine which is the best condition for L-asparaginase production, tables and graphs comparing cell growth and enzyme production under different experimental conditions were analyzed. In addition, the type of medium, the addition of amino acids, and the different induction points were examined to see which combination produces the best results in terms of enzyme yield in total and specific activity. The growth and enzyme production curves also help to evaluate how biomass and enzyme activity levels change over time, helping to establish the ideal time for induction and harvesting. Additionally, the implementation of experimental design and statistical analysis, such as ANOVA, simplifies the detection of fundamental interactions between variables, which allows for improving production conditions. Based on these analyses, the best growing conditions were selected for bioreactor experiments, prioritizing those that maximize L-asparaginase production and stability, while minimizing process variability.
All bioreactor runs were conducted in a 3 L BIOSTAT B Plus bioreactor (Sartorius Stedim, Goettingen, Germany) with a working volume of 1.3 L of culture medium. The components of the chemically defined medium (CDM), except for glucose, magnesium sulfate, thiamine HCl, carbenicillin, and amino acids, were dissolved in 1.17 L of Milli-Q water, and the pH was adjusted to 6.8 prior to sterilization. The bioreactor was sterilized by autoclaving at 121 °C for 30 min. Glucose and magnesium sulfate were autoclaved separately, while thiamine HCl and carbenicillin were sterilized through filtration using PVDF membrane filters with a pore size of 0.22 µm (Merck Millipore, Billerica, MA, USA). All the components were added to the bioreactor just before the start of the run to ensure sterility and maintain the integrity of heat-sensitive substances. The inoculum was centrifugated for 20 min at 3200× g at 25 °C (Centrifuge 5804R, Eppendorf, Hamburg, Germany), and its volume was decided based on the initial OD of the primary culture. The glucose concentration in the culture medium was adjusted to 27.5 g L−1. For each bioreactor run, the initial OD was kept between 0.4 and 0.5 OD. Dissolved oxygen (DO) was monitored by the DO probe (Mettler Toledo, Columbus, OH, USA) and was controlled at a minimum of 30% saturation by cascading the stirrer speed (300–1500 rpm) and air flow rate of 1.2 vvm of compressed air/oxygen used during the fermentation. The pH of the media was monitored by a pH probe (Mettler Toledo, Columbus, OH, USA) and was maintained at 6.8 ± 0.5 using 3M NH4OH. It was not necessary to perform acid addition. The temperature was maintained at 37 °C. The culture was induced with 180 µmol of IPTG per gram of cells. This concentration was obtained by our research group to increase enzyme productivity in high-density cultures (unpublished data). All the bioreactor experiments were performed in duplicate.
Four sets of experiments were performed in the bioreactors with E. coli BL21(DE3)/Erw_DM with differences in amino acid and inducer addition times and amino acid concentration (Table 1). Each of the experiments was compared with the control experiment, which was using the defined medium without optimization and induced at the mid-exponential phase.

Soluble L-ASNase Extraction

The pellet, stored at −20 °C, was treated with BugBuster MasterMix® Protein Extraction Reagent (Merck Millipore), and phenylmethylsulfonyl fluoride (PMSF) (0.05 mM) was added as a protease inhibitor. The BugBuster reagent was added using a ratio of 5 mL of reagent per gram of humid cell, and incubated with agitation for 30 min at room temperature. Finally, it was centrifuged for 20 min at 16,000× g at 4 °C (Centrifuge 5804R, Eppendorf), obtaining the soluble proteins in the supernatant.

2.3. Statistical Analysis and Modeling

2.3.1. 25 Full Factorial Design

For these 5 amino acids studied, the 25 full factorial design was used. This design allows the evaluation of all the combinations of effects, including the main effects and their interactions. This design consists of two levels (−1 and +1), which are specified in Table 1, and 36 experimental runs covering all the combinations (Table 2). For this case, the total enzymatic activity of L-ASNase (U L−1) was evaluated.
The results obtained using the 25 full factorial design were processed using the Design Expert V.13 software (Stat-ease Inc). To determine statistically significant effects (p-value ≤ 0.05), an analysis of variance (ANOVA) was performed. This analysis allows us to determine the significance of the effects and whether there is a lack of fit between the model and the experimental data. All the experiments were performed randomly and the experiment had 4 center points.

2.3.2. Central Composite Rotatable Design (CCRD)

The three factors that were the most significant in the 25 full factorial design were examined in more detail with the use of a response surface methodology, using the central composite design (CCD), to obtain the ideal concentrations to be used. The upper and lower limits were defined empirically based on previous studies [13]. The factors (culture medium components) to be evaluated and their levels (−α, −1, 0, 0, +1, and + α), with α = ±1.96 and the concentrations, are shown in Table 3, and the design matrix consists of 20 experimental trials (8 factorial points, 6 central, and 6 axial), which are shown in Table 4.
The total L-ASNase activity produced (U L−1) will be used as the response variable. The results of the CCRD were adjusted with a 2nd-order polynomial equation (Equation (1)) as follows [17]
Y E r w _ D M = β 0 + β i X i + β i i X i 2 + β i j X i X j
where YErw_DM is the response (total activity (UT)); β0 is the intercept of the model; βi, βii, βij are the linear, squared, and interactive coefficients terms, respectively; and Xi and Xj are the independent variables.
The results obtained using the CCRD were processed using the Design Expert V.13 software (Stat-ease Inc). The data were normalized using the square root function as a transformation (y’ = √(y + k)) (λ = 0.50; k = 0), which was chosen using a Box–Cox test. This test allows us to determine the power transformation of the data that best fits a normal distribution. To determine statistically significant effects (p-value ≤ 0.05), an analysis of variance (ANOVA) was performed. This analysis allows us to determine the significance of the effects and whether there is a lack of fit between the model and the experimental data. All the experiments were performed randomly and the experiment had 6 center points.

2.4. Analyses

2.4.1. L-ASNase Activity Assay

The Nessler method was employed for the quantitative expression analysis, which indirectly quantifies the enzymatic activity of L-asparaginase by the metal complexation of ammonia to form a colored complex at 436 nm. For this purpose, the methodology described by Simas et al. (2021) was modified, and 96-well microplate assays were utilized [30]. In each well, 160 μL of 50 mM Tris-HCl pH 8.6 and 32 μL of 100 mM asparagine were added, followed by 16 μL of the analyte (in this case, the Bugbuster solution containing ASNase) and 128 μL of distilled water to obtain a final volume of 336 μL. After a static incubation at 37 °C for 30 min, 16 μL of 1.50 mM trichloroacetic acid (TCA) was added to each well to stop the reaction. The preparation of blanks for each sample followed the same procedure, except that the enzyme was added after the TCA addition. The final concentrations in blanks, controls, and standards were 22.70 mM of Tris-HCl, pH 8.60, and 68.20 mM of TCA. The enzymatic reactions and blanks also contained 4.50 mM asparagine. The production was compared to a standard curve of ammonium sulfate [NH4)2SO4] [31]. This was prepared using concentrations ranging from 14 μM to 273 μM of (NH4)2SO4.
A 35 μL volume from each reaction well was transferred to a new microplate well containing 35 μL of Nessler’s reagent (K2HgI4 in a KOH solution, Sigma-Aldrich, St. Louis, MO, USA, CAS: 7783-33-7) and 280 μL of water. After 10 min of incubation at room temperature, the absorbance at 436 nm was measured and NH4+ concentration was determined using a standard curve. ASNase activity was calculated using Equation (2).
L A S N a s e   a c t i v i t y   U m L = N H 4 +   μ M 350 μ L 352 μ L 35 μ L 30 m i n 16   μ L 1000   m L L
where a unit (U) of ASNase activity is defined as the amount of L-asparagine hydrolyzed by the enzyme per minute at 37 °C [32].
Additionally, the total activity of L-ASNase was calculated based on the biomass yield per liter of culture medium (Equation (3)). This calculation was necessary because the enzymatic activity only determines the activity per mL of extract and does not consider biomass concentration.
T o t a l   E n z .   a c t i v i t y   U T = E n z .   a c t i v i t y U m L · X   g c e l l L · 5 m L g c e l l
where X is the biomass concentration and 5 (mL/g_cell) represents the amount of Bugbuster added per gram of cells.

2.4.2. Determination of Cell Dry Weight

For the determination of cell dry weight, 15.00 mL falcon tubes were used. The tubes were washed with distilled water and dried at 70 °C for 24 h. After cooling to room temperature with a vacuum desiccator, the collecting tubes were weighed on an analytical scale. Aliquots (15.00 mL) of the cell culture (OD600nm = 0.20, 0.40, 0.60, 0.80, 1.00, and 1.30) were transferred to the previously weighed tubes, in triplicate, centrifuged for 10 min at 10,000× g, and the cell pellet was washed with 5.00 mL of distilled water. Finally, the tubes were placed to dry in an oven at 70 °C up to constant weight. After plotting the OD600nm data versus cell dry weight, the equation of the line y = 0.3279x + 0.0022 with that of R2 = 0.9889 was obtained.

2.4.3. Glucose Quantification

Glucose concentration was measured by the enzymatic method of glucose oxidase/invertase [33], using the Glucose GOD PAP kit (LABORLAB®, Guarulhos, Brazil). This is based on glucose oxidation catalyzed by glucose oxidase (GOD) according to the following reaction:
G l u c o s e + O 2 + H 2 O G O D   G l u c o n i c   a c i d + H 2 O 2
2 H 2 O 2 + 4 A F + 4 h y d r o x y b e n z o a t e P O D   R e d   c o l o r   ( 505 n m )
The hydrogen peroxide formed (Reaction (1)) reacts with 4-aminophenazone (4-AF) and 4-hydroxybenzoate present in the medium under the action of peroxidase (POD), forming antipyrylquinonimine, whose red color intensity is proportional to the concentration of glucose in the medium (Reaction (2)). The wavelength used was 505 nm. The following equations was used to calculate the amount of glucose present in the medium:
G l u c o s e m g d L = O D 505 n m ×   f
f = 100 m g d L P
where f is the glucose standard factor and P is the OD505nm obtained by adding 100 mg/dL glucose (concentration of the standard).

2.5. Extraction of Metabolites from Spent Media

Spent media samples were collected from the bioreactor culture strategies (1.3 L) at specific time intervals. The spent media samples were centrifuged for 30 min at 4000 rpm and 4 °C and then filtered through 0.22 μm filters to remove any remaining cellular debris.

2.6. Determination of Amino Acids by LC-MS/MS

Samples were analyzed using an LC/MS/MS system, which consisted of a 3200 Q TRAP® triple quadrupole linear ion trap spectrometer (Applied Biosystems/MDS Sciex, Darmstadt, Germany). The analytes were resolved chromatographically on an InertSustain PFP HP 3 μm, 2.1 × 150 mm column (GL Sciences Inc., Tokyo, Japan). The analysis was performed by the Omics Unit of the Bioresources Scientific and Technological Nucleus (BIOREN-UFRO, Temuco, Chile).

3. Results and Discussion

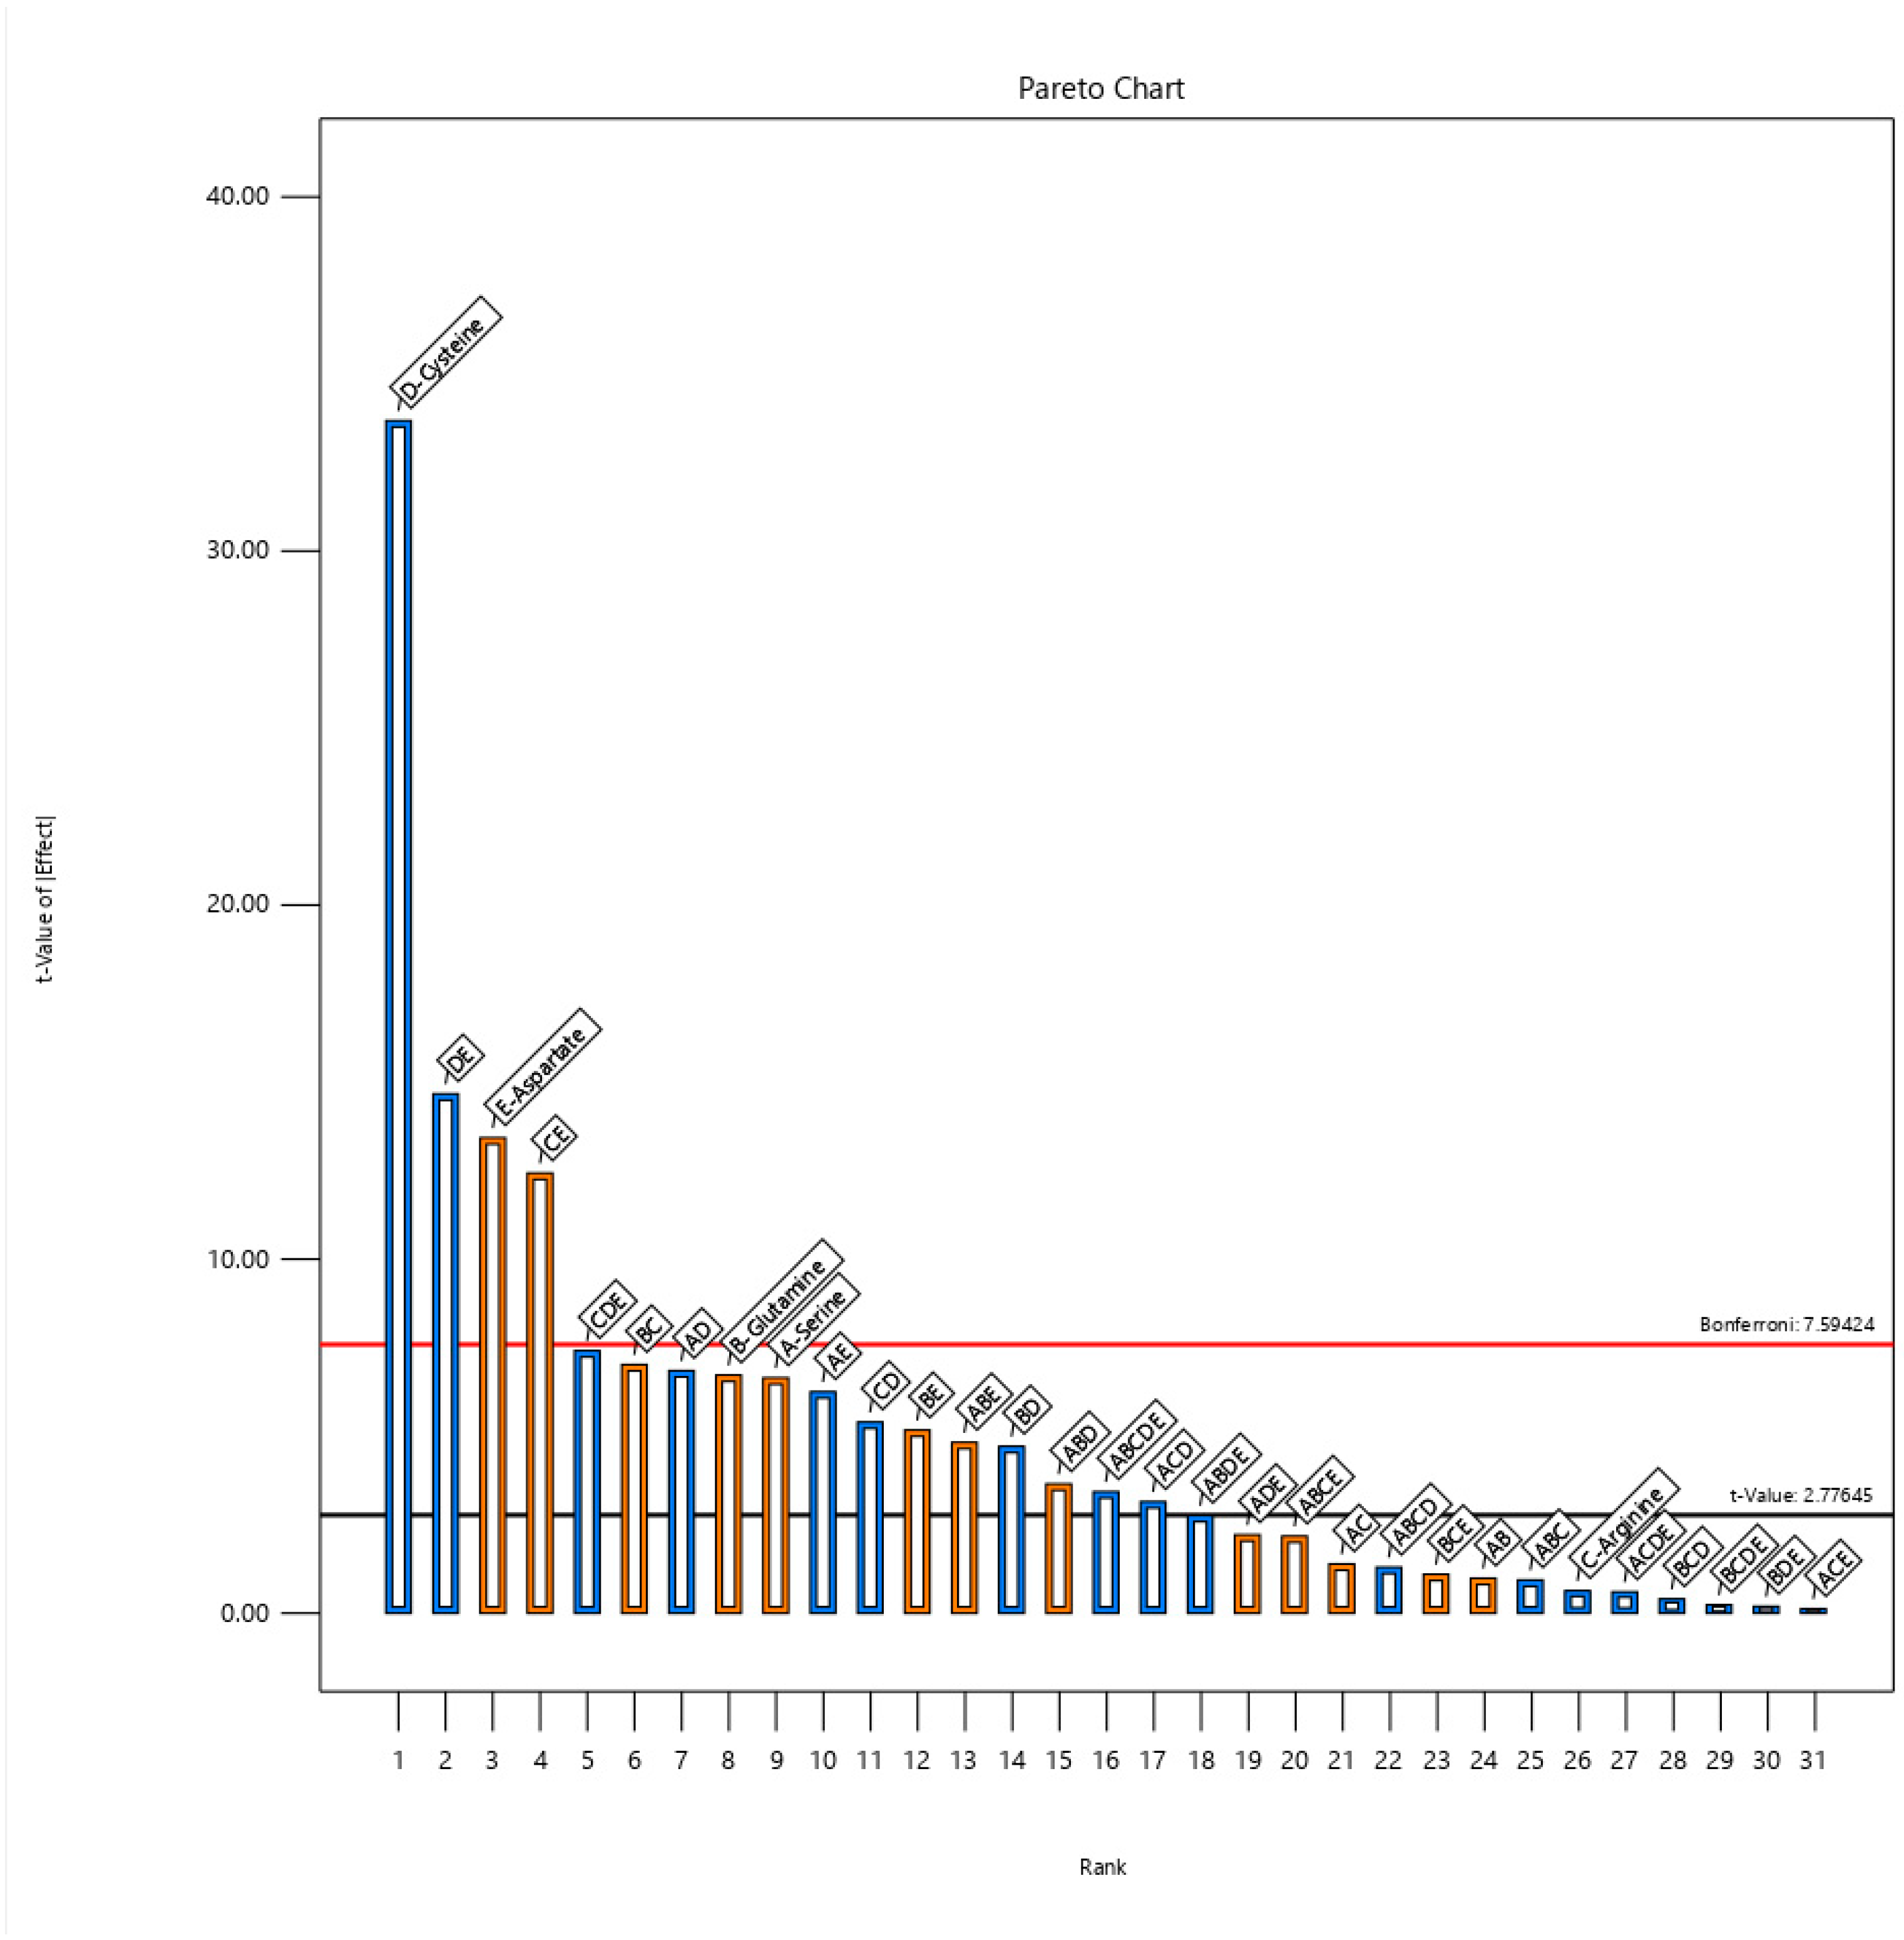
3.1. Screening of Amino Acids Using 25 Full Factorial Design

A full factorial design was initially used in this study to select critical amino acids (serine, glutamine, arginine, cysteine, and aspartate) previously reported as supplementation in CDM for ASNase production. Given the large variety of amino acids that could be tested, it was necessary to reduce the number of them and choose those with the most documented impact on E. coli metabolism and recombinant protein production. The selection of these five amino acids was based on scientific studies that focused on optimized E. coli culture media.
Key amino acids known to promote cell growth and reduce metabolic burden were identified. A study comparing the growth of E. coli BW25113 in nutrient-rich media (supplemented with amino acids) versus minimal media revealed that under rich conditions, E. coli preferentially consumes amino acids over glucose [14]. Serine was the most consumed amino acid (41% of total uptake), followed by aspartate, cysteine, and glutamine, all of which are strong chemoattractants for E. coli and closely related to the TCA cycle and glycolysis. In addition, arginine demonstrated a positive synergistic effect with glutamine and aspartate, providing additional evidence for its selection [12,29]. These amino acids have been shown to contribute to several critical functions, promoting cell growth, enhancing recombinant protein synthesis, and acting as metabolic modulators.
In addition, the supplementation with the 20 essential amino acids is an economically unfeasible process. However, some of these have been shown to reduce metabolic load at the time of induction of protein production [12,13,14].
Table 5 records the dependent values (total activity (U L−1)) obtained for each culture sample under the conditions indicated for each level reported on the 25 full factorial design.
The experiment based on the 25 full factorial design showed a variation in the total enzymatic activity ranging from 49 to 4131 U L−1. These variations reflect the significance of amino acids in L-asparaginase production. The Box–Cox test was used to analyze the data to determine if it was normalized. The model obtained from the 25 full factorial design had an R2 of 99.86%, as determined by an analysis of variance (ANOVA), which is represented in Table 6. The significance level of the factors considered was determined using the Student’s t-test and p-value. A confidence level greater than 95% (α = 0.05) was used to determine statistical significance. The selected parameters are represented in the Pareto diagram of standardized effects (Figure 1). According to the results of the Student’s t-test and p-value performed by the Design Expert V13 software, most of the effects were significant using the Student’s t-test limit. Since only three factors were selected, factors with an absolute significance level (effects exceeding the Bonferroni limit) were considered. For each parameter, the model yielded absolute significance for the following factors: cysteine (D) (p-value < 0.0001); the interaction between cysteine and aspartic acid (DE) (p-value = 0.0007); aspartic acid (E) (p-value = 0.0009); and the interaction between arginine and aspartic acid (CE) (p-value = 0.0011).
The 25 full factorial design allows the reduction in the initially selected five amino acids from the literature to only three for optimization.
Regarding the main effects of the amino acids, only cysteine reached significance over the Bonferroni limit, albeit with a negative effect. Some studies have shown a positive synergy of L-cysteine in the production of recombinant proteins. However, these studies have analyzed cysteine by adding amino acids that complementarity has been observed such as isoleucine, alanine, and valine [13,14,34]. This point will be discussed in more detail in Section 3.2. Nevertheless, this variable was still considered for further optimization to observe the inhibition it exerts. Additionally, a synergistic effect between arginine and aspartate was observed, which had the highest level of significance. Therefore, arginine, aspartate, and cysteine were selected for further optimization of the culture medium using RSM.

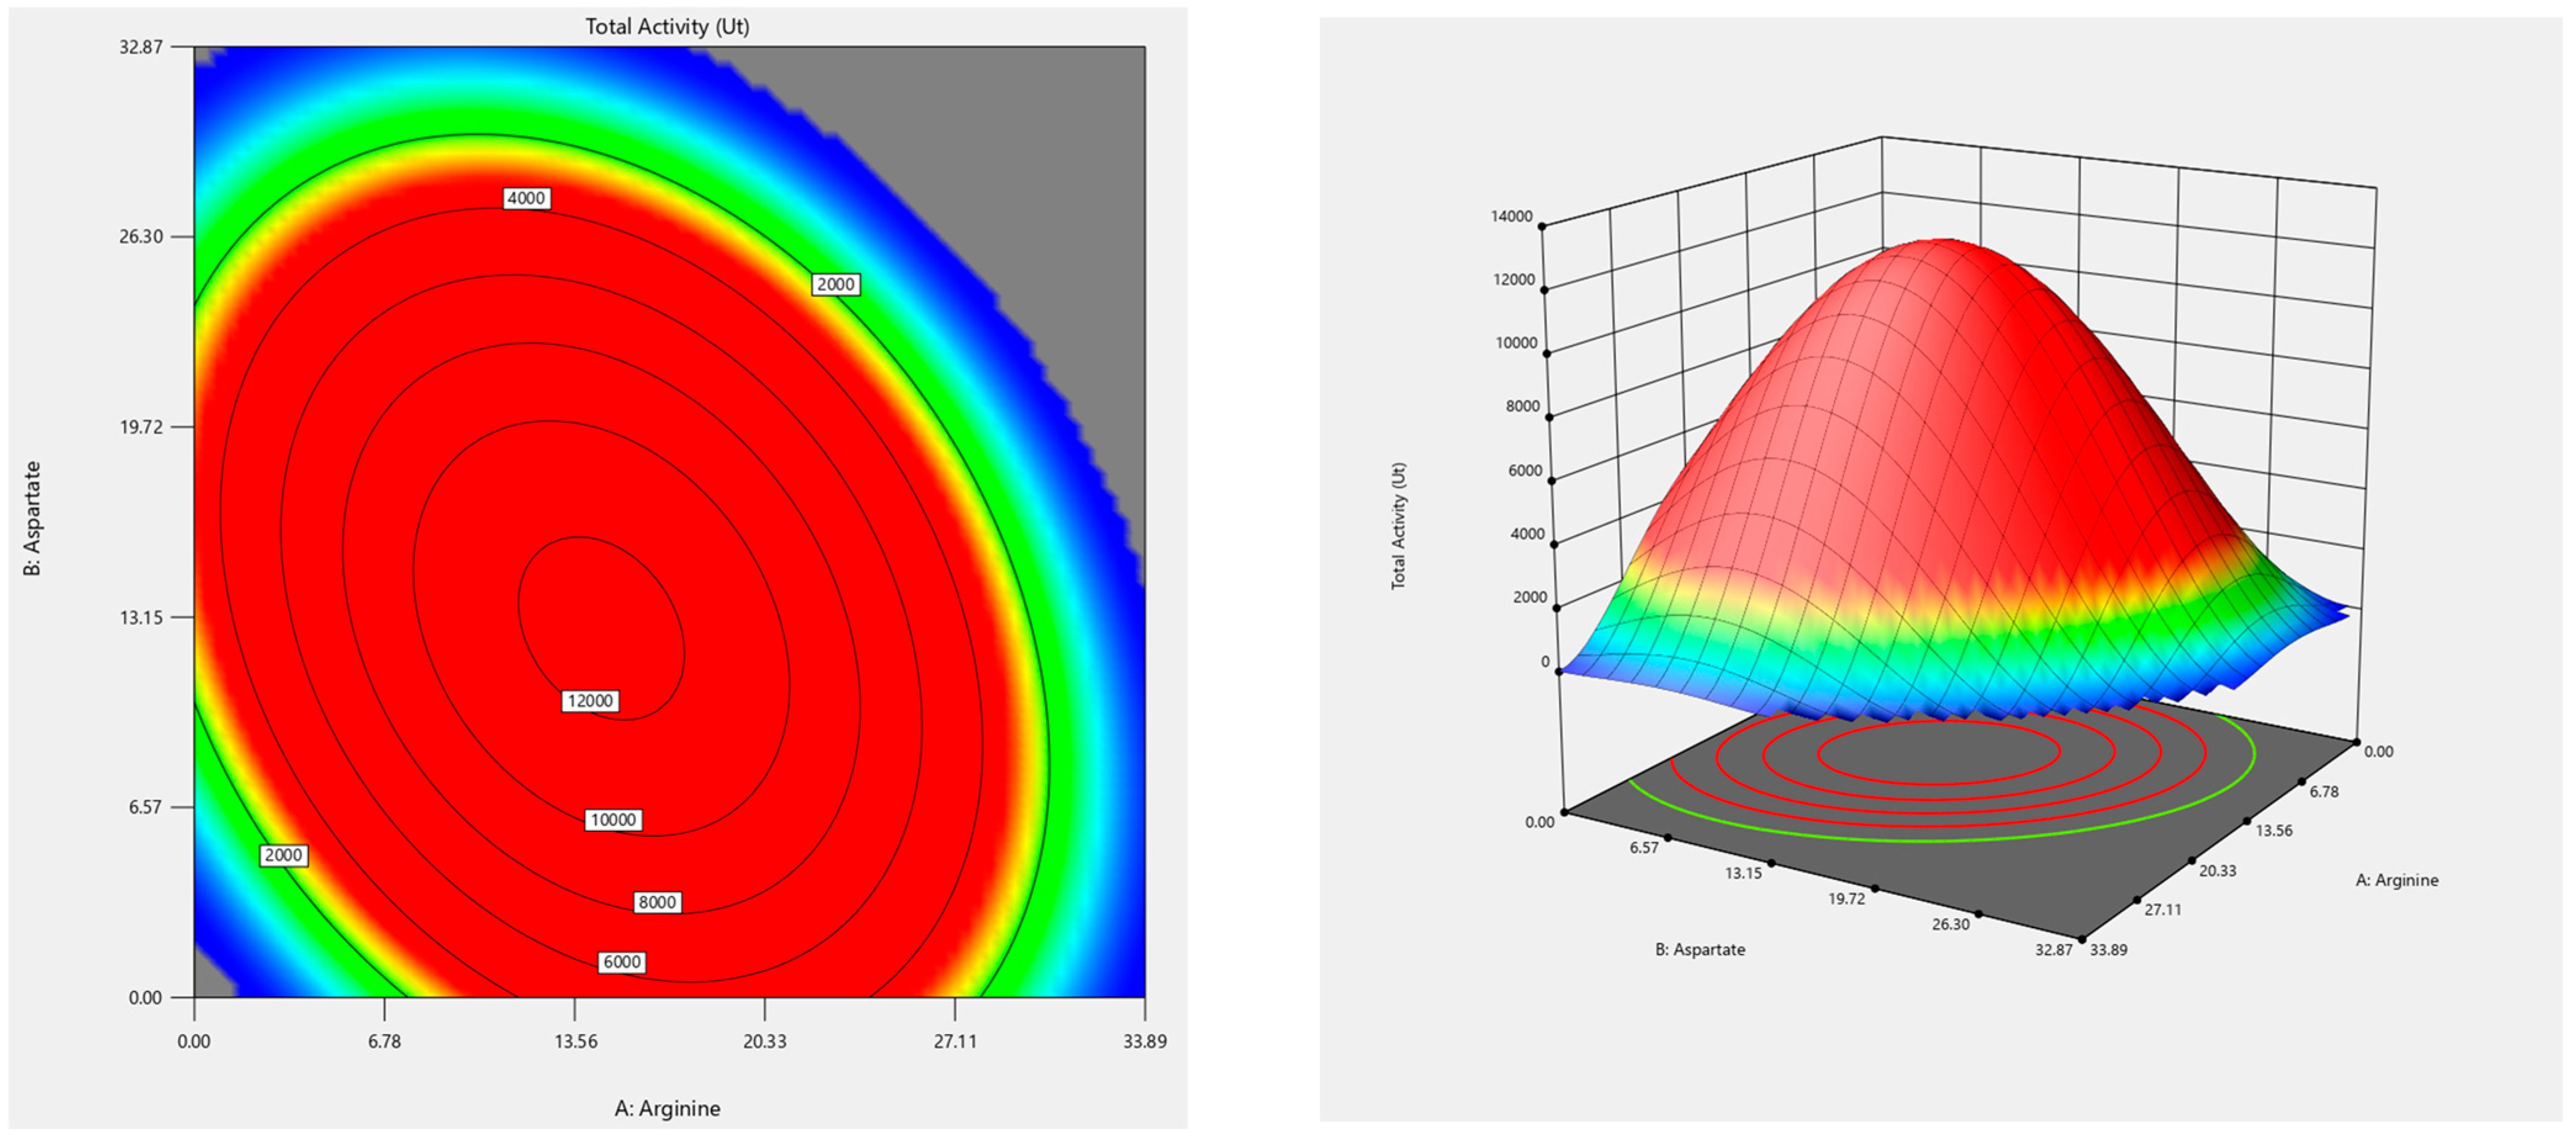
3.2. Optimization of Amino Acids in Defined Medium

After evaluating the main and secondary effects of five amino acids selected from the literature, a central composite rotatable design (CCRD) was used to determine the concentration of the three amino acids that had a significant effect on L-asparaginase production in the 25 full factorial design. Five concentration levels were tested for each amino acid in 20 (=2k + 2k + 6) experiments, where k is the number of independent variables, with the total enzymatic activity (U L−1) evaluated as the response (Table 4 and Table 6). Five central points were included, and the effects were assessed using an analysis of variance (ANOVA).
The total activity of L-ASNase was analyzed using regression analysis with the least squares method using the Design Expert V13 software. The experiment based on the CCRD showed a variation in total enzymatic activity ranging from 27 to 3228 U L−1. These variations reflect the significance of the amino acids in L-asparaginase production.
For this design, the model was fitted with an R2 of 96.04%, an RAdj2 of 92.77%, and an RPred2 of 74.59%, with a p-value < 0.0001, as determined by ANOVA (Table 7). The significance level of the considered factors was determined based on the statistical parameter p-value. A confidence level greater than 95% (α = 0.05) was used to determine statistical significance. The regression coefficient was calculated by fitting it to a quadratic model (Equation (6)). The factors that were significant in this model were cysteine (C) (p-value < 0.0001); the interaction between arginine and cysteine (AC) (p-value = 0.0014); arginine (A) (p-value = 0.0049); the interaction between aspartate and cysteine (BC) (p-value = 0.007); and aspartate (B) (p-value = 0.0087). The model had a lack of fit of 0.0361, indicating its significance. However, both the standard deviation (std. dev.) and the coefficient of variation (C.V%) were good (std. dev. = 4.11 and C.V% = 15.98) and had an adequate precision of 19. An adequate precision > 4 indicates a favorable discrimination of the model.
A S N a s e   U T = 16.36 + 10.18 · A r g i n i n e + 8.51 · A s p a r t a t e + 1.77 · C y s t e i n e 0.148 · A r g i n i n e · A s p a r t a t e 1.01 · A r g i n i n e · C y s t e i n e 0.79 · A s p a r t a t e · C y s t e i n e 0.29 · A r g i n i n e 2 0.25 · A s p a r t a t e 2 + 0.15 · C y s t e i n e 2
Figure 2 shows the effects of the evaluated amino acids (arginine, aspartate, and cysteine) on the production of double mutant L-asparaginase from D. dadantii. The contour and 3D plots in Figure 2 indicate higher total activity as the surface turns redder and lower in the navy-blue zone.
This model indicates that L-ASNase production is highly dependent on the amount of cysteine in the culture medium because as we increase the concentration, the total activity is decreased. Studies have described that cysteine can inhibit the growth of E. coli [35,36,37]. Although these studies do not suggest a clear reason for this cause, they mention that this growth inhibition may be because cysteine inhibits threonine deaminase (TD) (ilvA gene), a precursor of isoleucine [37]. This inhibition causes some strains of E. coli to be unable to synthesize isoleucine, valine, and alanine, resulting in starvation [36]. However, it has been observed that the addition of certain branched-chain amino acids such as alanine, valine, and even isoleucine itself, confer protective effects on cysteine inhibition, so it is speculated that not only would TD inhibit it, but also some precursor of valine and alanine called acetohydroxyacid isomeroreductase (ilvC gene) [37] The possible pathways that are inhibited by cysteine can be seen in more detail in Figure 3. Kumar et al. (2020) [13], reported a positive effect on the use of cysteine for pramlintide production. However, this was used together with branched-chain amino acids (leucine and alanine), so it is possible that cysteine was consumed in the production of pramlintide and did not affect growth. Recently, Zhou and Imlay (2022) managed to discover a transmembrane protein called CyuP, which allows the passage of cysteine to the intracellular medium, and the enzyme called cysteine desulfidase (CyuA) capable of degrading cysteine in E. coli [34]. However, it could be elucidated that the iron–sulfur cofactor required by this enzyme is inactivated by oxygen, so it is speculated that cysteine is a carbon source that can only be used in anoxic environments. Currently, this inhibition by cysteine has not been reported in E. coli BL21 (DE3); however, this study, with the design of experiments performed, suggests that this strain is highly inhibited by cysteine.
Additionally, a large positive effect of arginine and aspartate can be observed, responsible for the increase in activity, with arginine having the greatest effect in the model (best p-value). To determine the optimal condition of total enzyme activity, the optimization tool of the Design Expert V13 software was used, which gave the following concentrations: 14.5 mM arginine, 12.7 mM aspartate, and 0 mM cysteine, with a predicted value of 12,513 U L−1. These results can be observed by extending the range of the model outside the experimental range, and the maximum point can be observed at the concentrations previously delivered by the software (Figure 4).

3.3. Validation

When using the CDM, the total enzyme activity was 1067 U L−1 (Figure 5A), and a 10-fold increase in enzyme activity was achieved after optimizing the medium by RSM (CDM-S). The predicted maximum enzyme activity of L-ASNase was estimated to be 12,513 U L−1 by model prediction. To validate the experimental design, an experiment was performed under the optimized conditions, obtaining a total activity of 10,089 U L−1 (Figure 5B). This experimental value is in good agreement with the predicted value, since this value has an 80.6% fit to the model, being higher than 74.59% ( R P r e d 2 ) , which validates the model design.
Additionally, the kinetics of substrate consumption and production rate were evaluated in CDM, CDM-S, and LB media (Table 7). It can be observed that the optimized defined medium improves both the specific growth rate and the substrate yield compared to the defined medium. This is mainly due to the availability of nitrogen sources in the growth medium, as the moment the nitrogen source (di-ammonium phosphate) of the defined medium is depleted, the specific speed is significantly decreased. This is because nitrogen in E. coli regulates the expression of at least 100 genes, including glutamine synthetase, which allows the assimilation of ammonia, the nitrogen source par excellence of E. coli. However, E. coli can also grow on other sources of nitrogen, including amino acids, but its growth decreases [38]. A study by Bren et al. (2016) showed that glucose versus “poor” nitrogen sources (arginine, proline, or glutamate) showed an inhibitory effect on cell growth [29]. However, the study did not evaluate the effect that the addition of two nitrogen sources could have, as is the case in this study.
Several searches have shown that aspartate is a high-quality nitrogen source [1,39,40]. This is mainly due to its great versatility of functions within the host. This amino acid (1) is able to provide the nitrogen requirement for all the nitrogen-containing components in E. coli; (2) is the second most concentrated amino acid within the cell (4.2 to 9.3 mM); (3) is a precursor for the biosynthesis of nucleic acids and amino acids (asparagine, lysine, methionine, threonine, and arginine); and (4) even participates in the tricarboxylic acid (TCA) cycle [40,41].
Aspartate can provide nitrogen through several pathways which are explained in more detail in the work performed by Strecker et al. (2018) [40]. However, one of them is produced through a pathway produced in aerobiosis called the Krebs–Henseleit metabolic pathway. This pathway converts citrulline and aspartate to arginine, and this is degraded via the arginine N-succinyl-transferase (AST) pathway, producing two ammonium molecules and one glutamate molecule [39]. There are no reports of the addition of arginine and aspartate to defined media; however, under this premise, it can be hypothesized that the addition of arginine to the culture medium enters the AST pathway, causing aspartate to divert its pathway, allowing the biosynthesis of biomolecules and/or entry into the TCA cycle (Figure 6). These make quite a bit of sense, since looking at Figure 6, one can observe a reduction in glucose consumption, or, rather, an increase in the yield (YXS) of CDM-S compared to CDM (Table 8) due to fumarate production. Additionally, a higher biomass growth can be observed compared to the defined medium. Regarding the higher L-ASNase production independent of growth, CDM-S shows a 3-fold increase compared to that obtained in CDM (1246 vs. 415 U mL−1).
Specific growth rate values for both complex medium (LB) and CDM are reported, and these are quite similar to those obtained in this work. A study by Santos (2017) obtained a µx of 1.36 (h−1) and a tg of 0.508 (h) using an LB medium [32]. Barros (2020) obtained a µx of 0.547 (h−1) and an Xmax of 1.8 (g L−1) using Riesenberg chemically defined medium [42].
The yield of the LB medium could not be obtained because it does not contain glucose, and with respect to the yields of product from biomass and its specific rate of production, they gave negative values due to a decrease in the total L-ASNase activity. This happened due to the time in which the culture medium was induced. All the media were induced at 5 h; however, the LB medium, having a higher specific growth rate (µx (h−1)), reached the stationary phase at 3 h (Table 8). The optimal induction time for E. coli BL21 (DE3) for L-ASNase production has been studied, and it was observed that in the LB medium, the optimal induction time was at the end of the exponential phase [43]. The main reason for the reduction in L-ASNase is that the bacteria consumed the enzyme as a source of carbon and nitrogen due to the lack of nutrients in this phase [44].

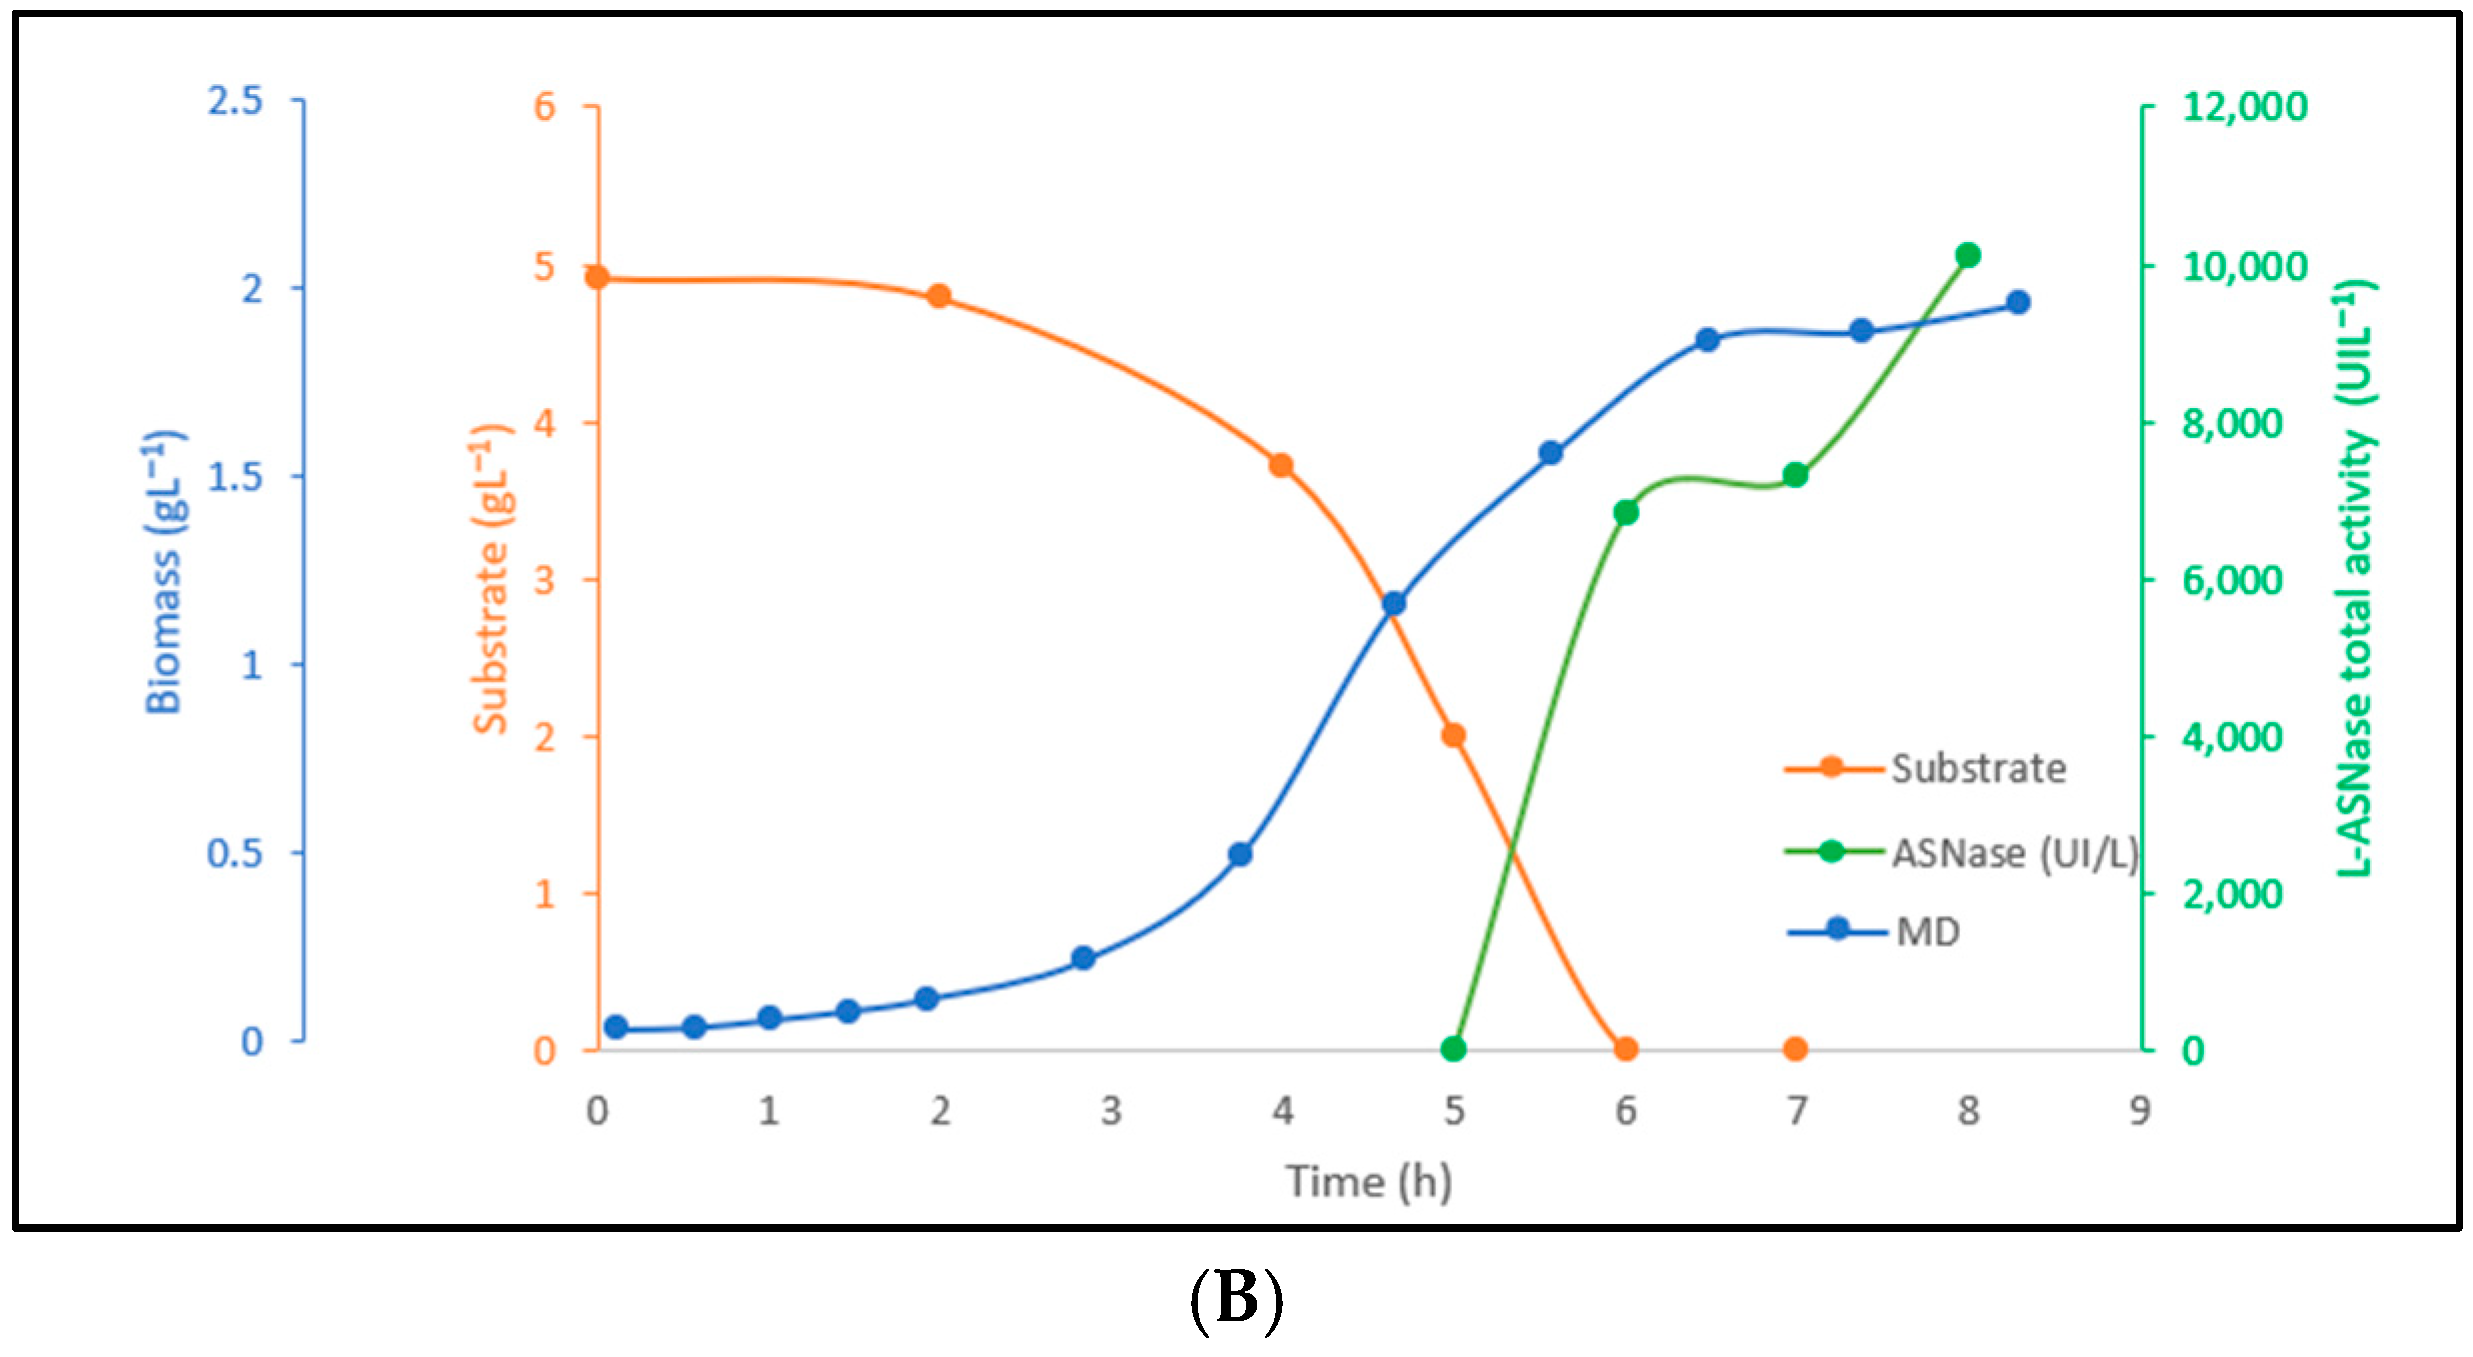
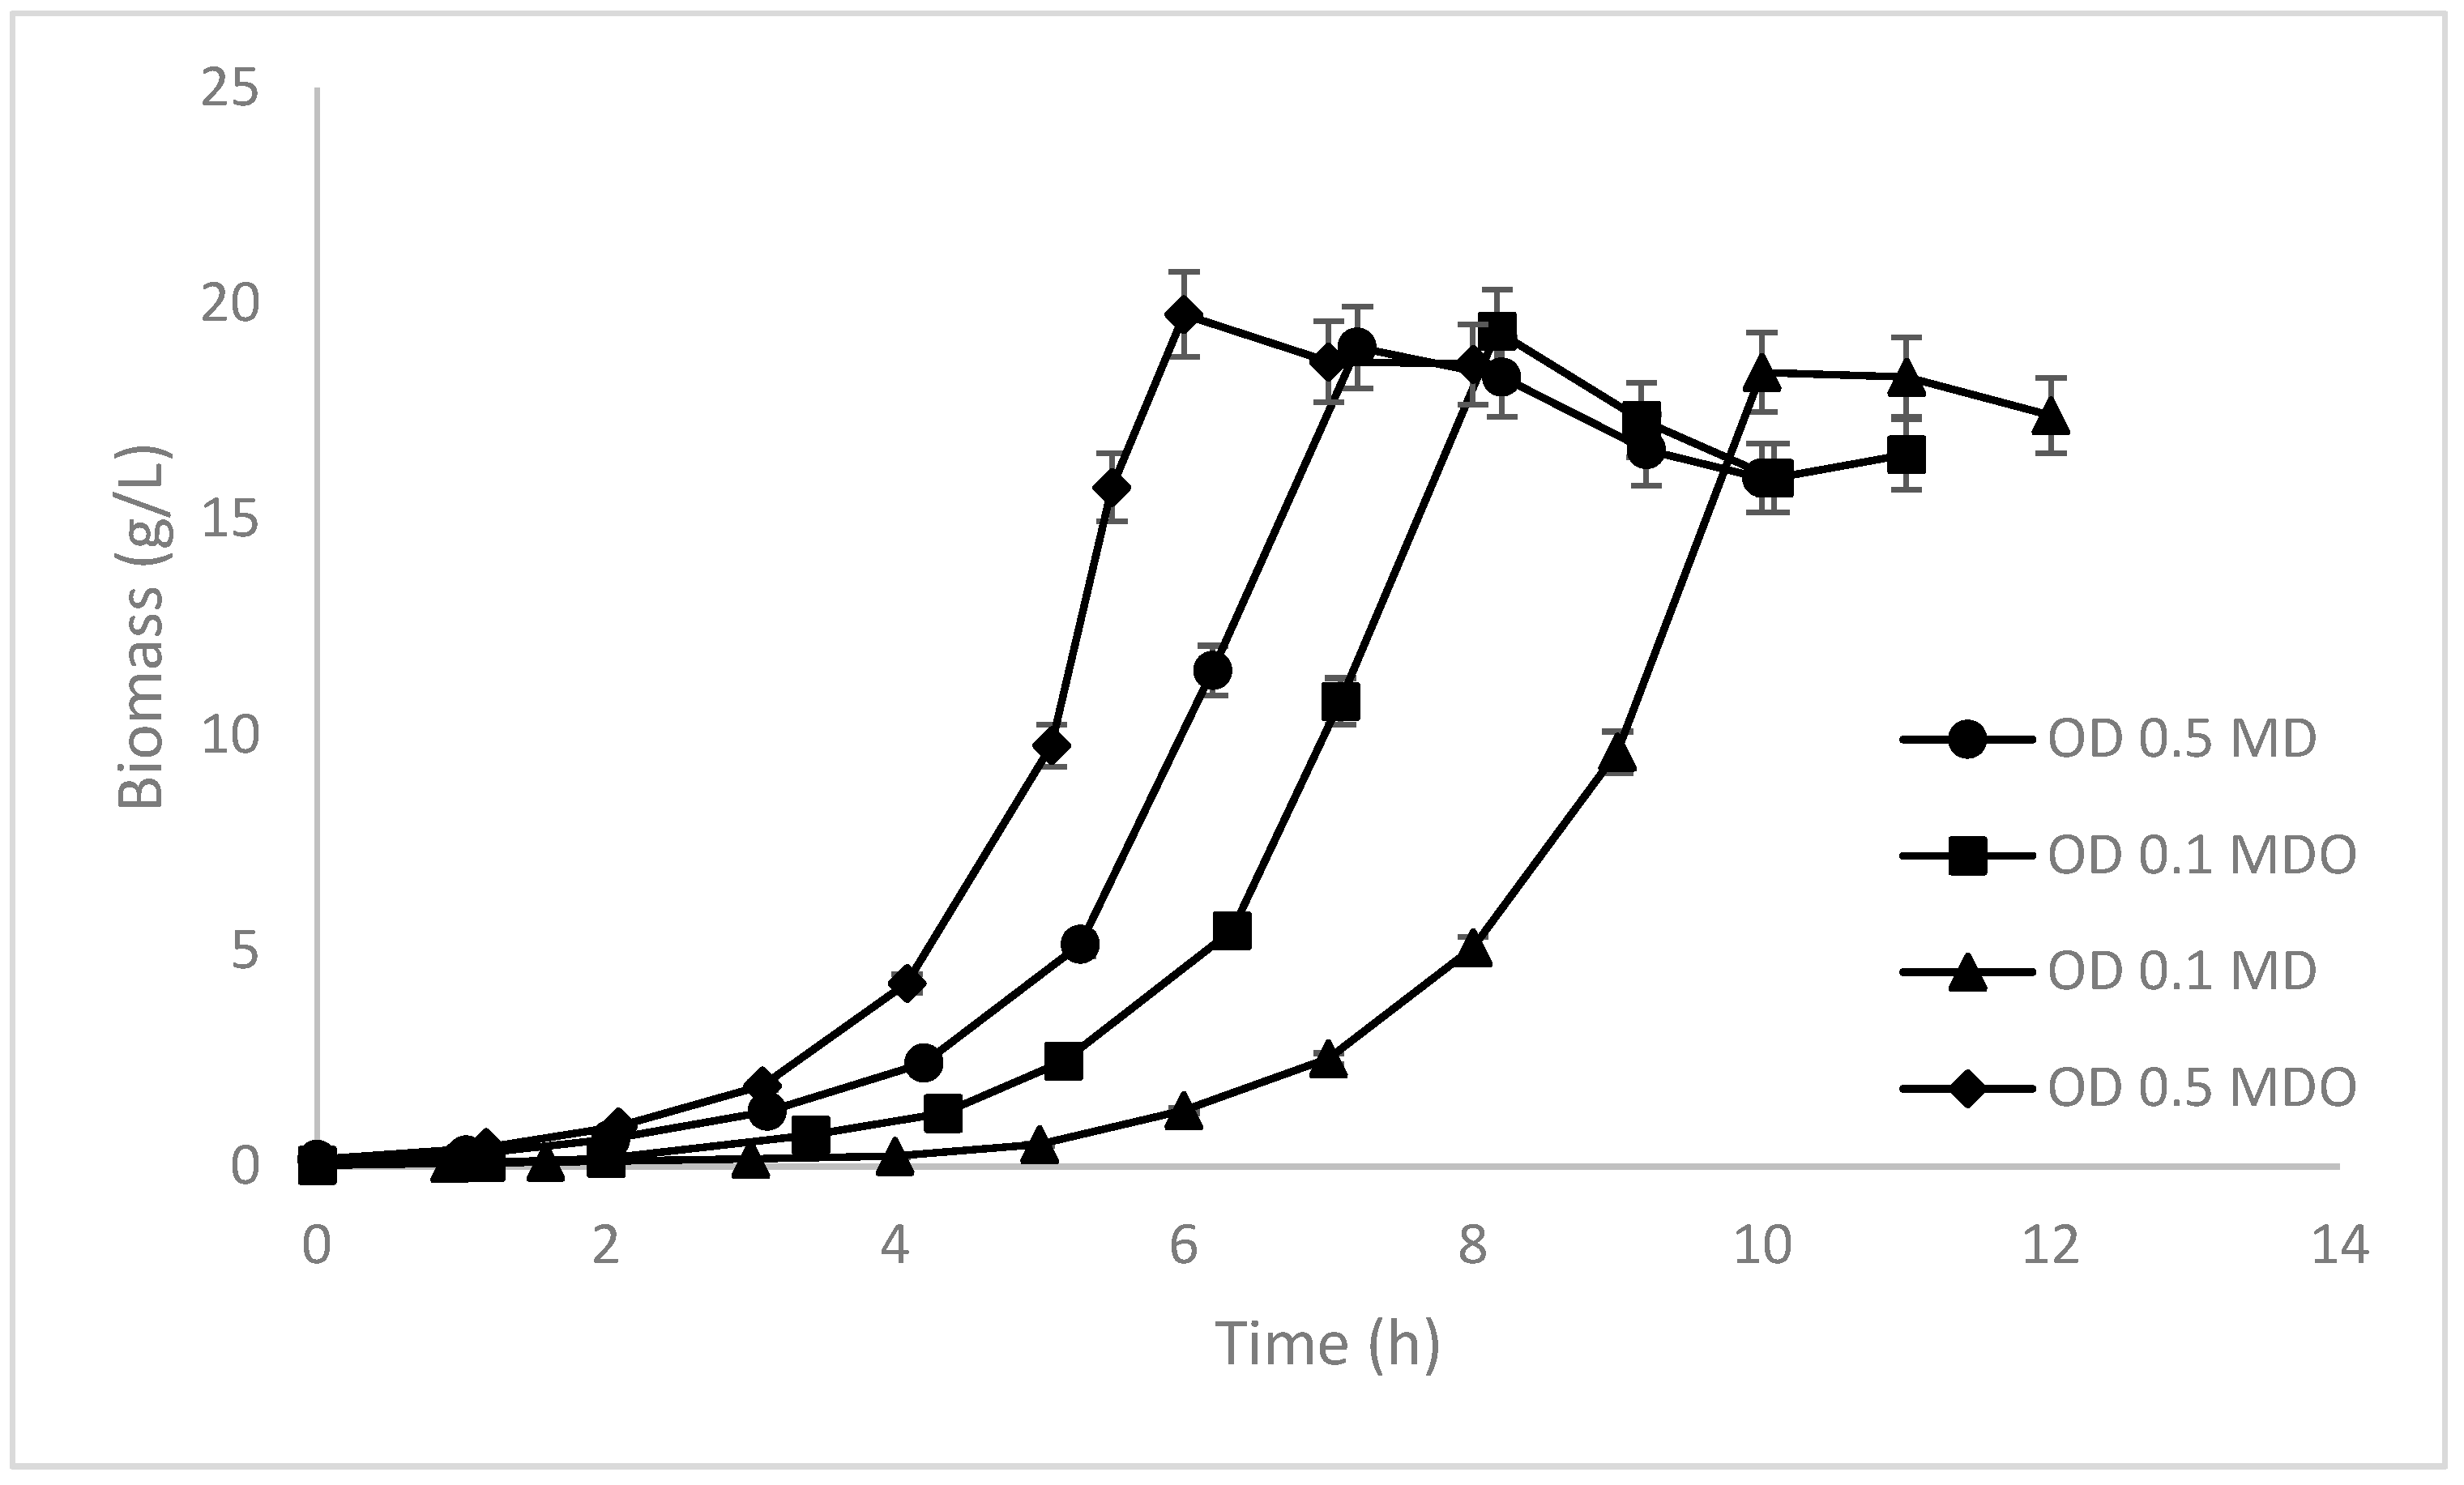
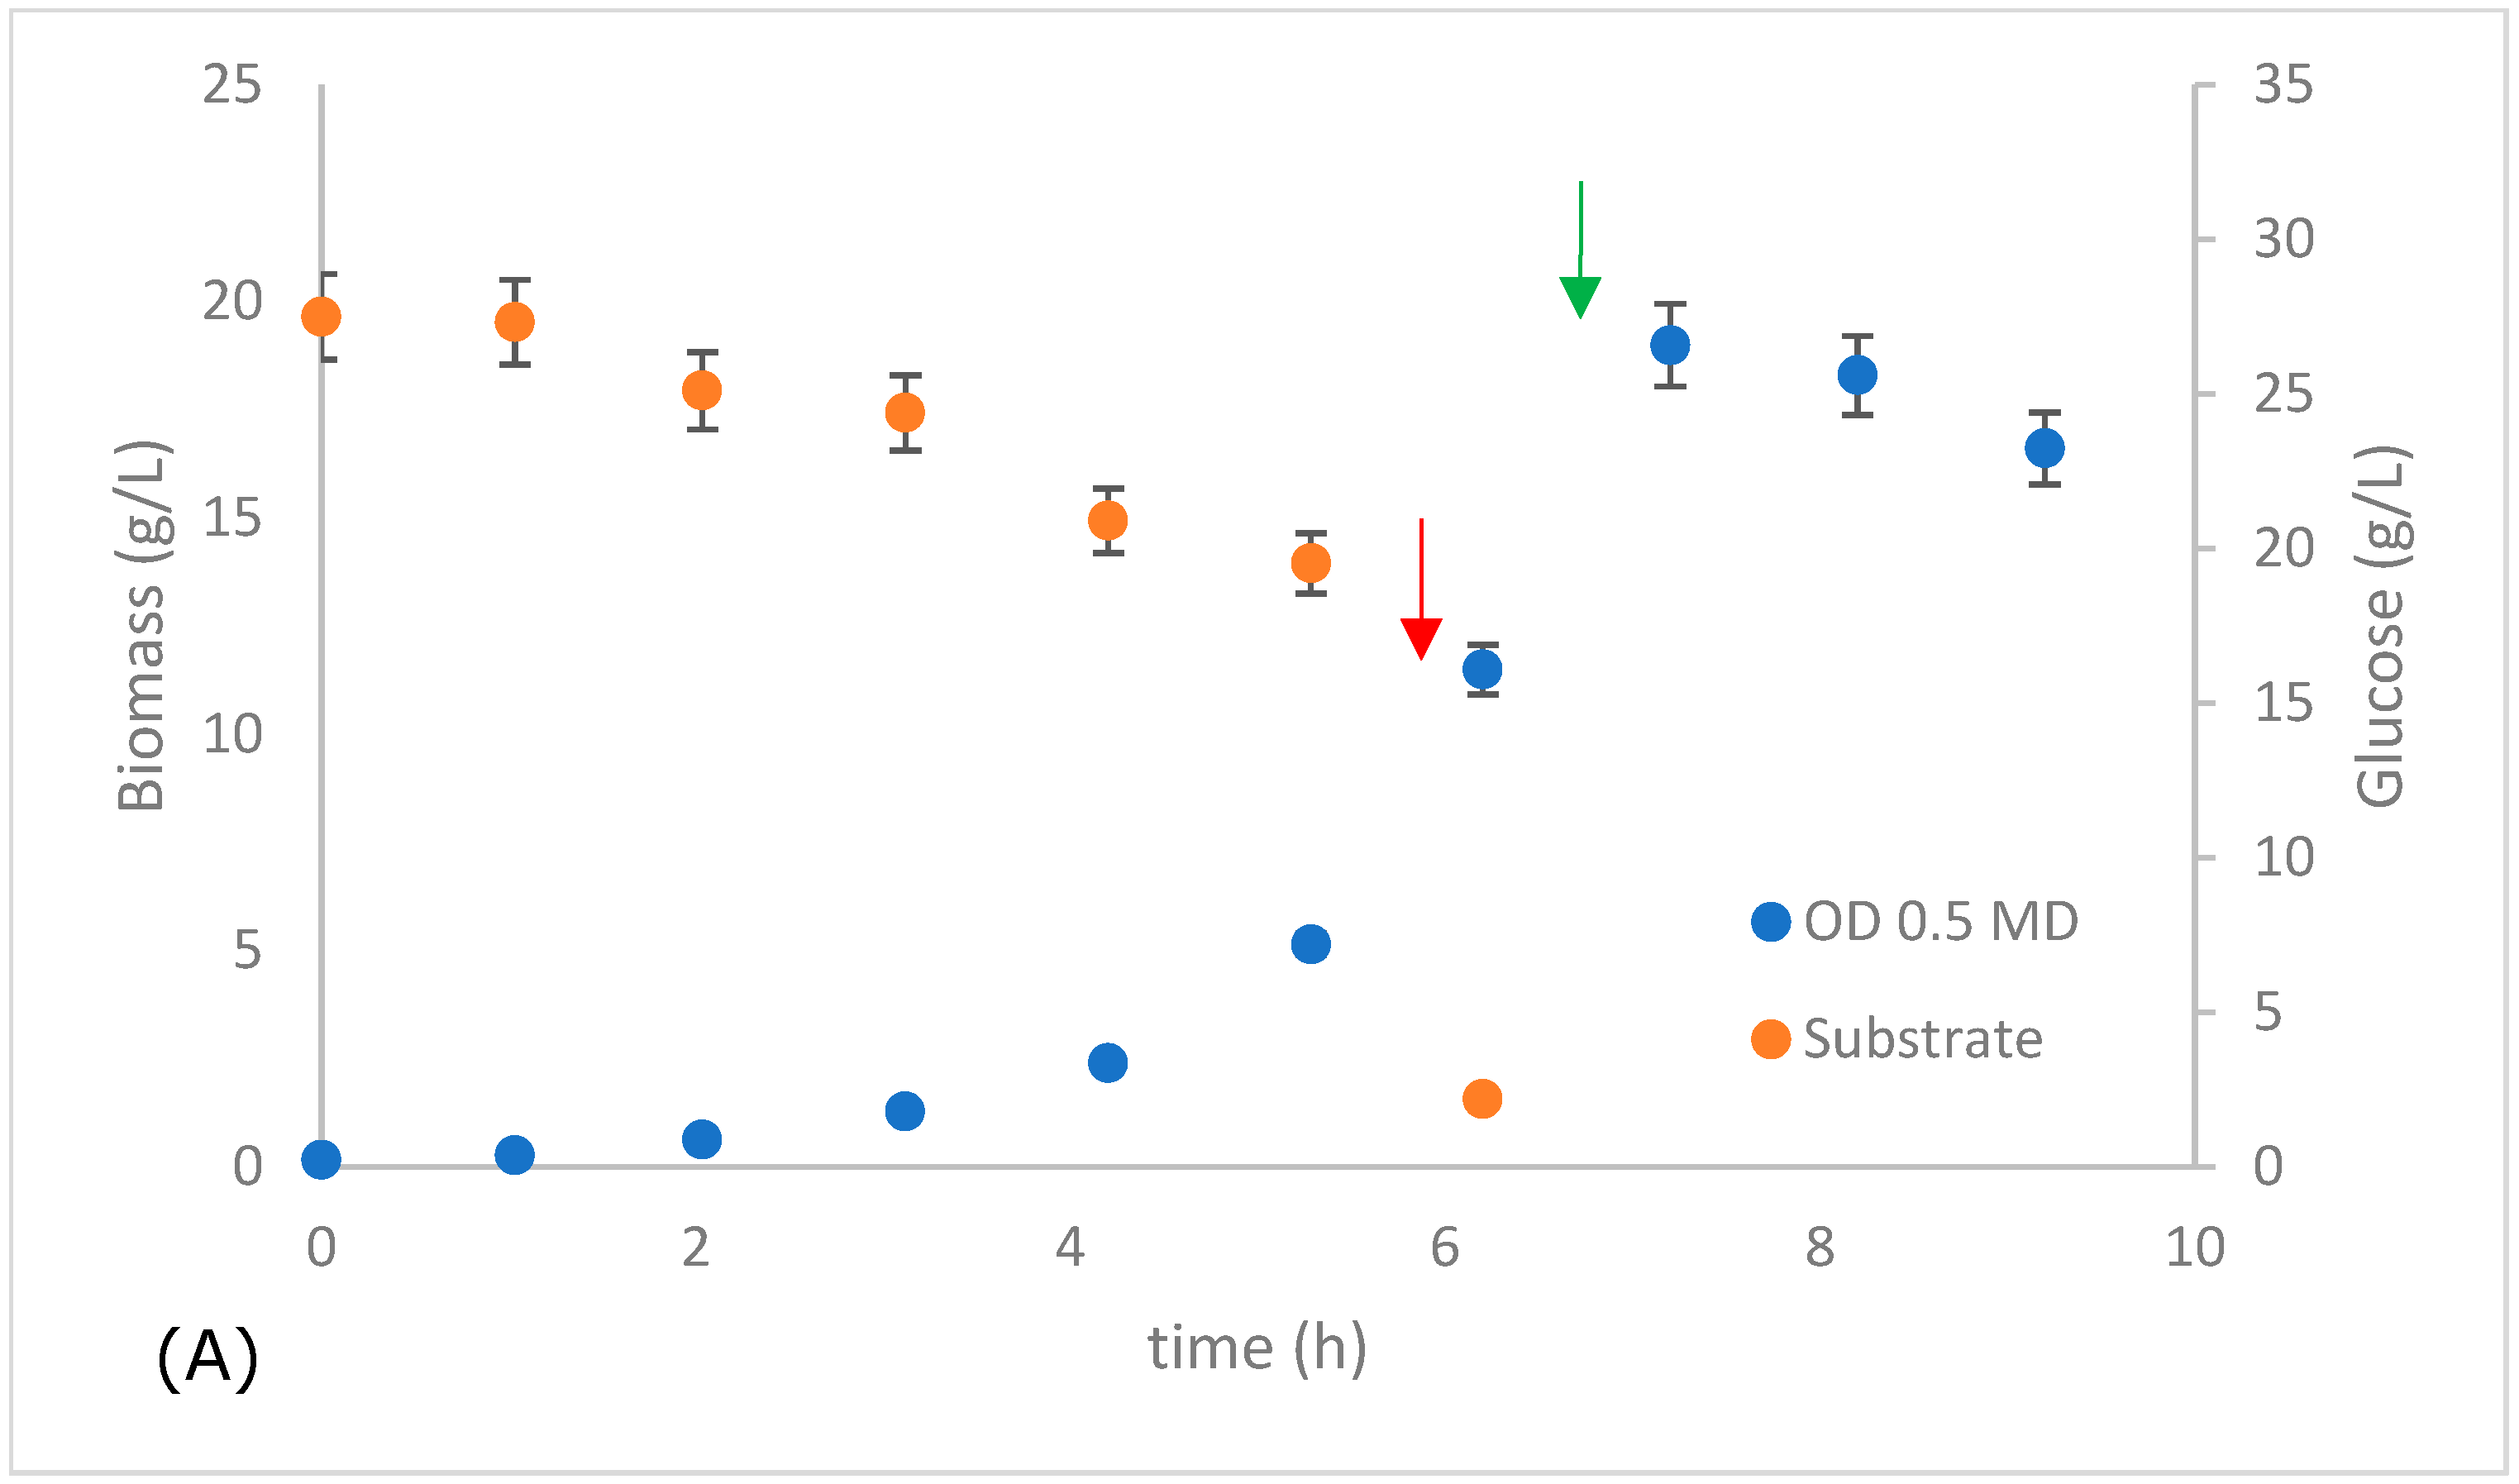
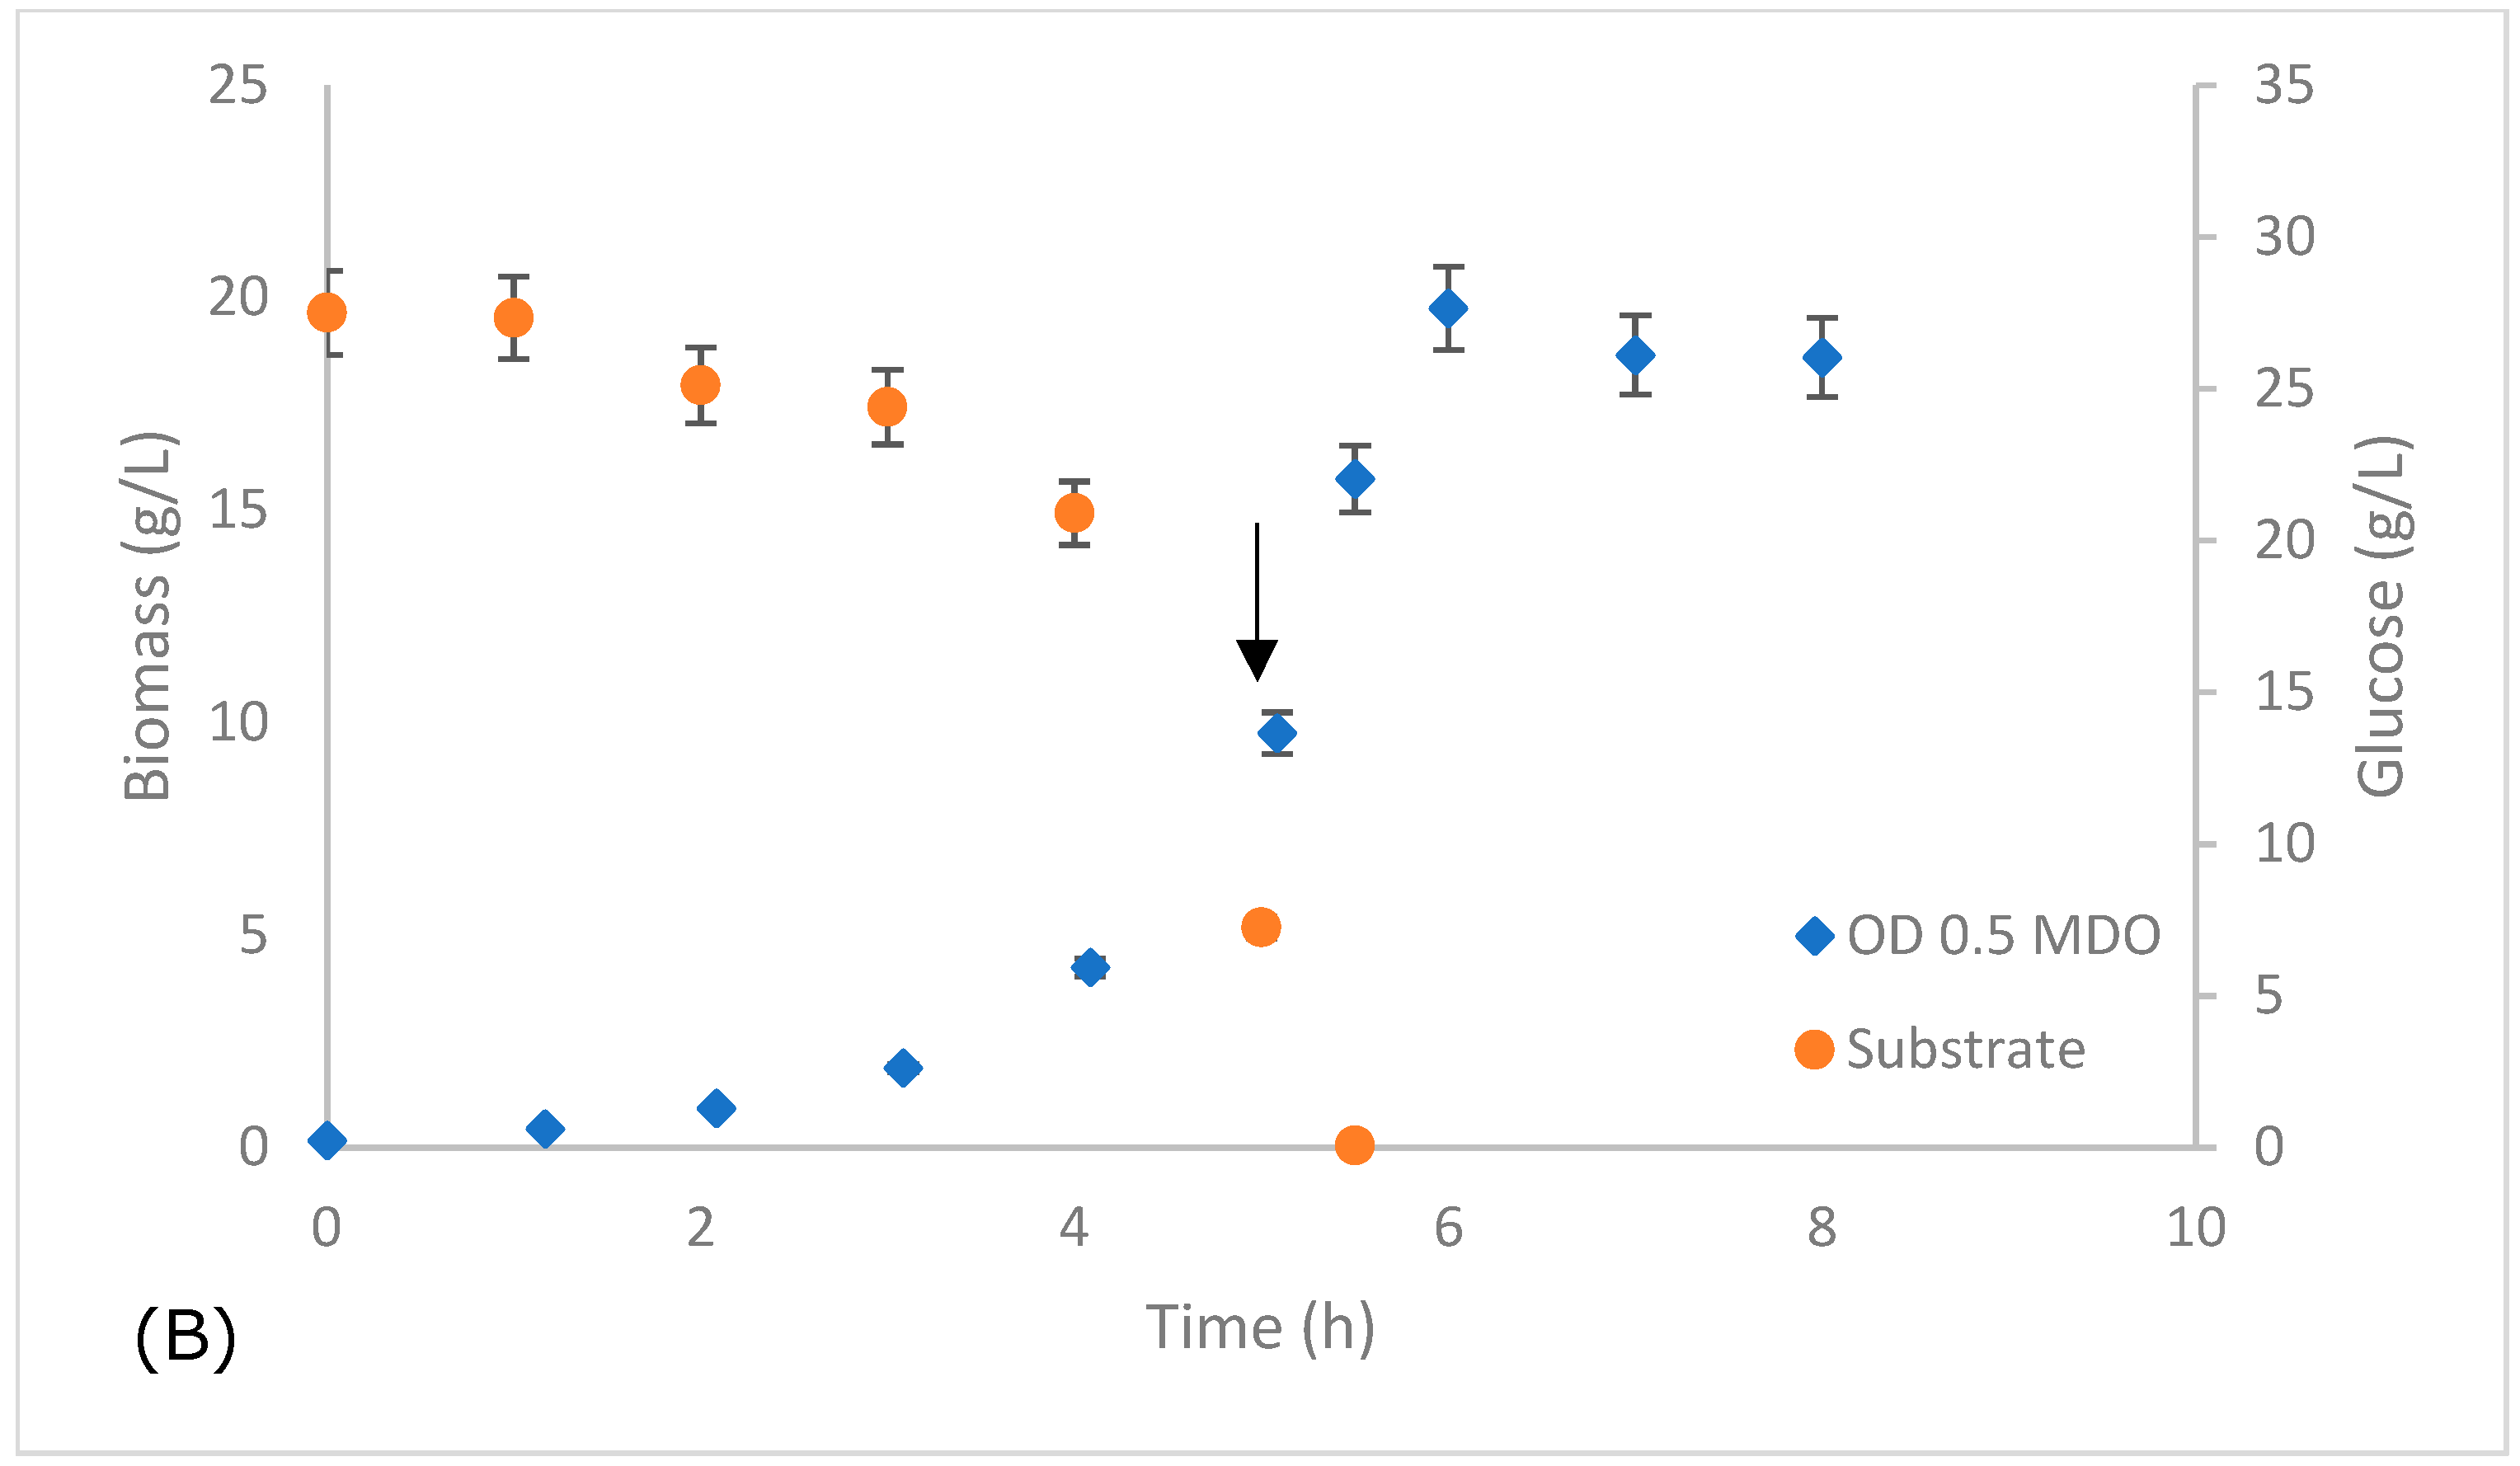
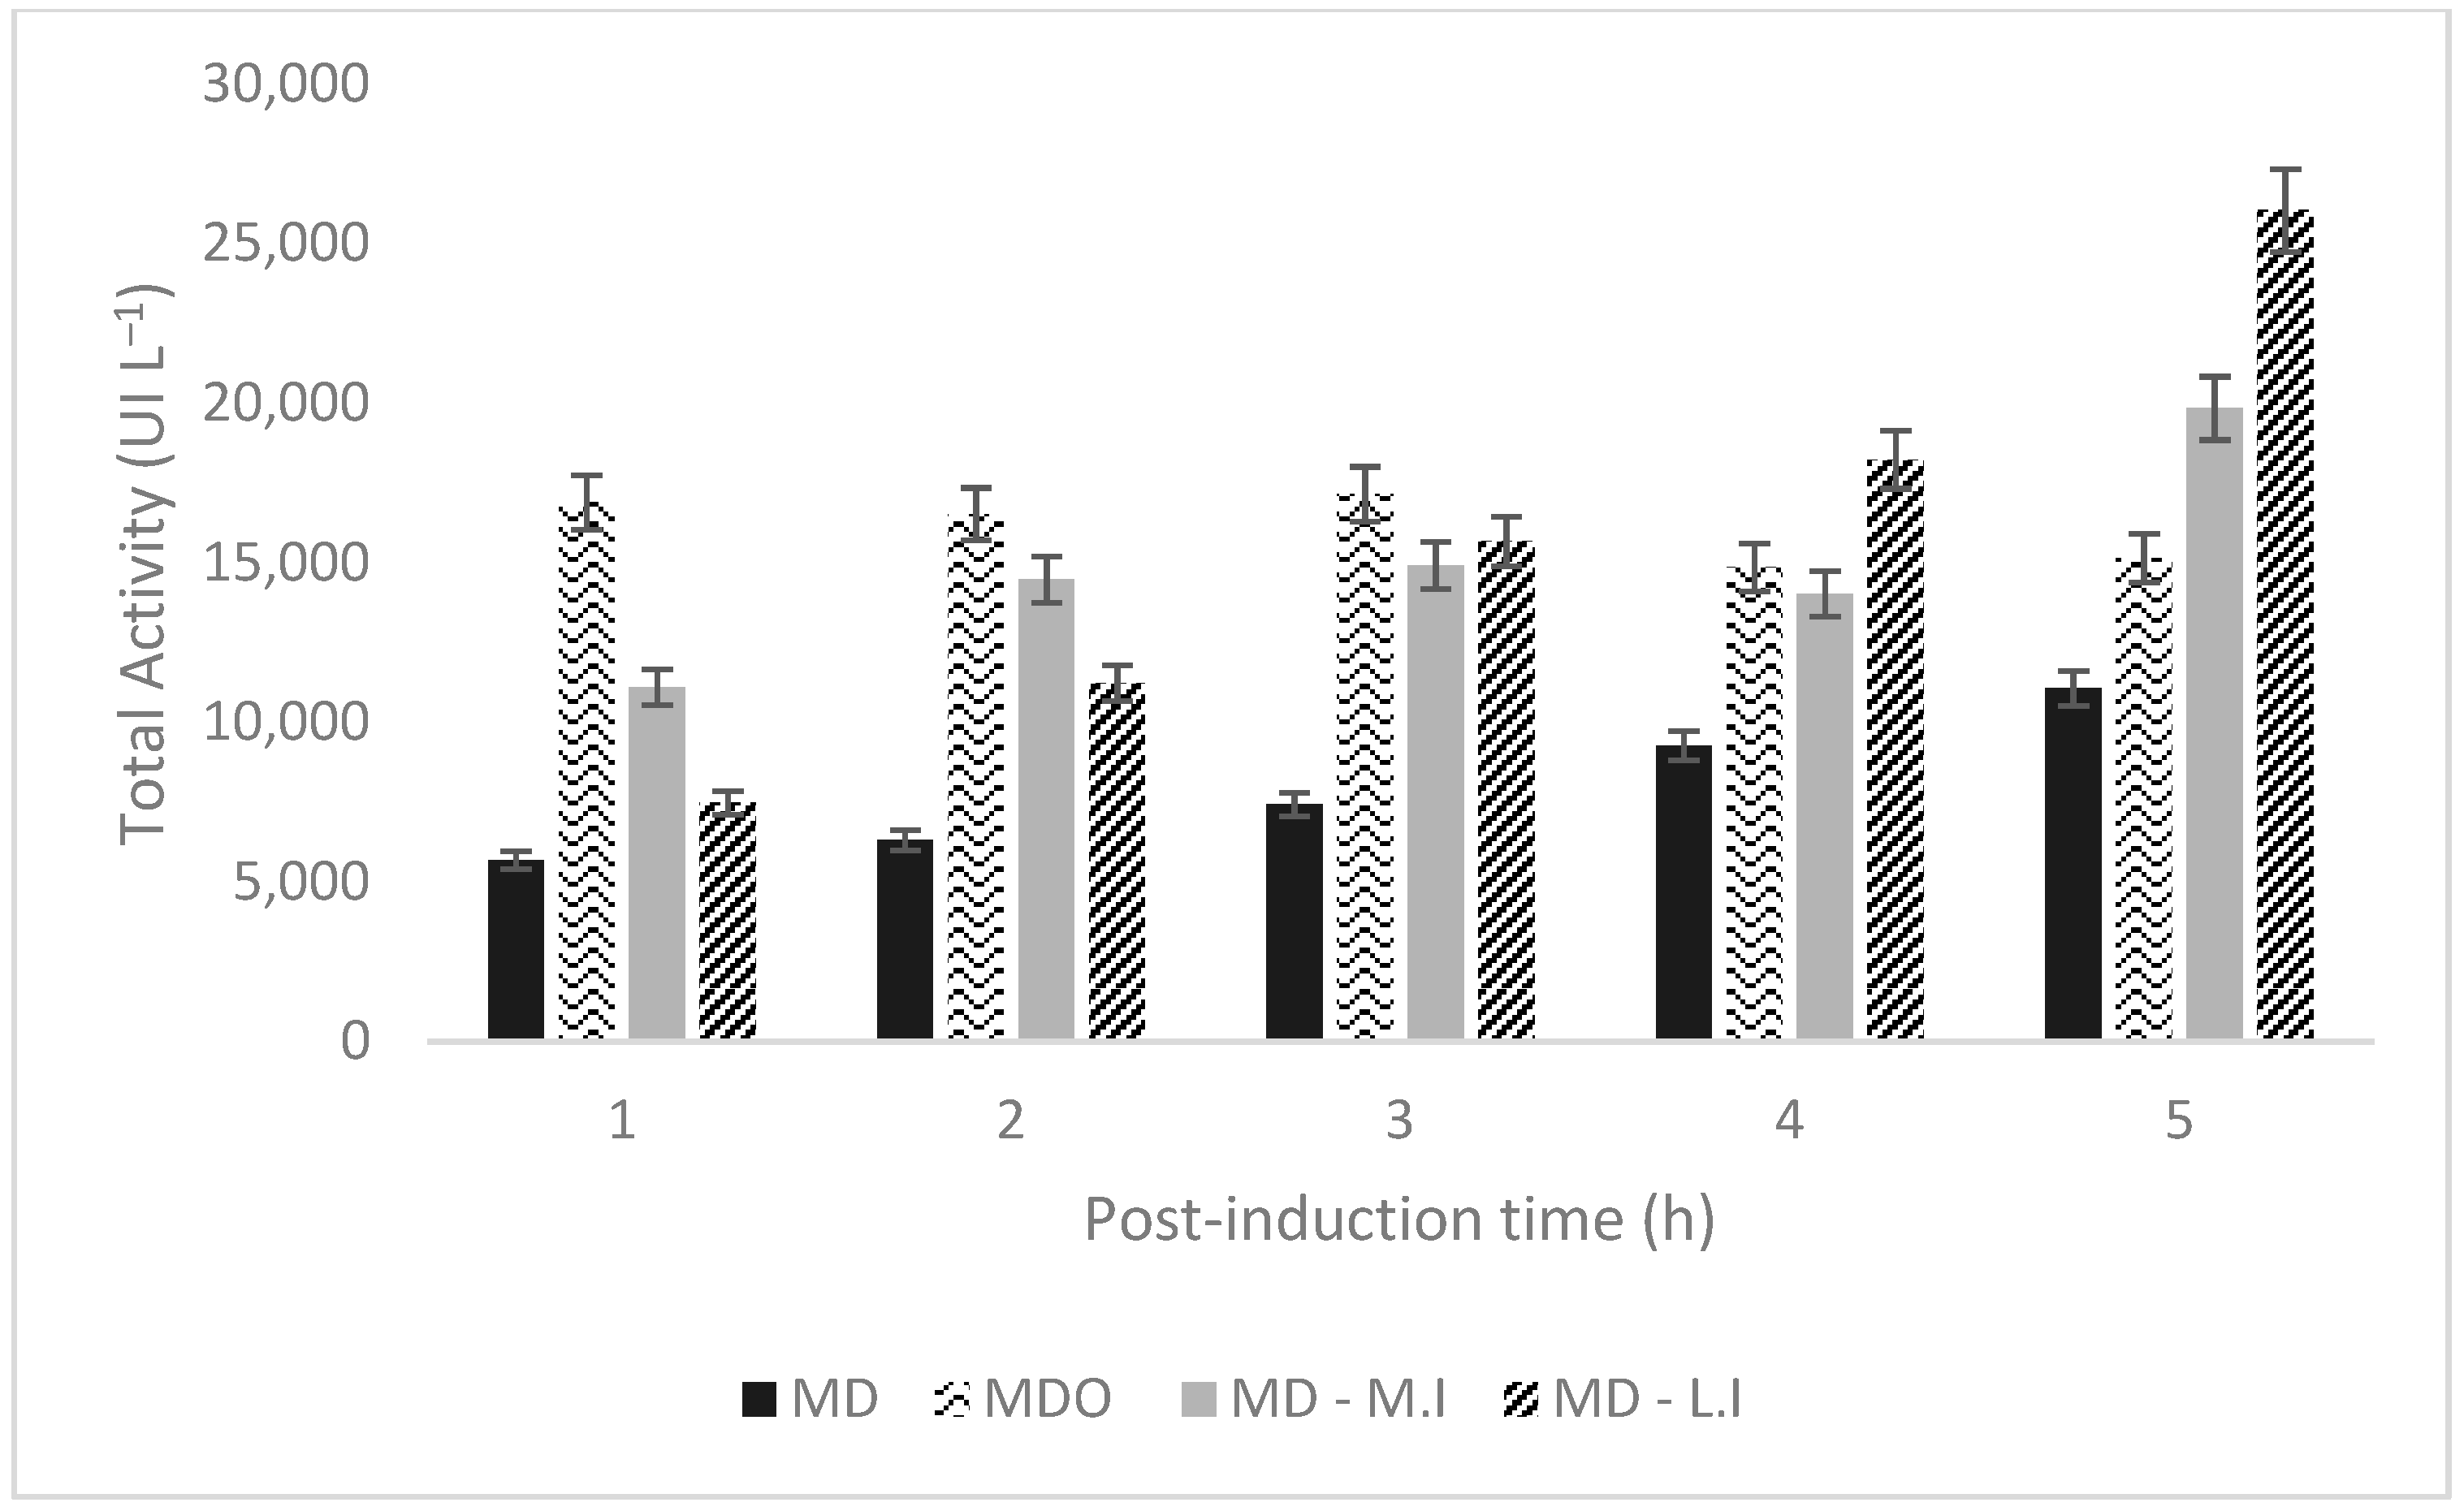
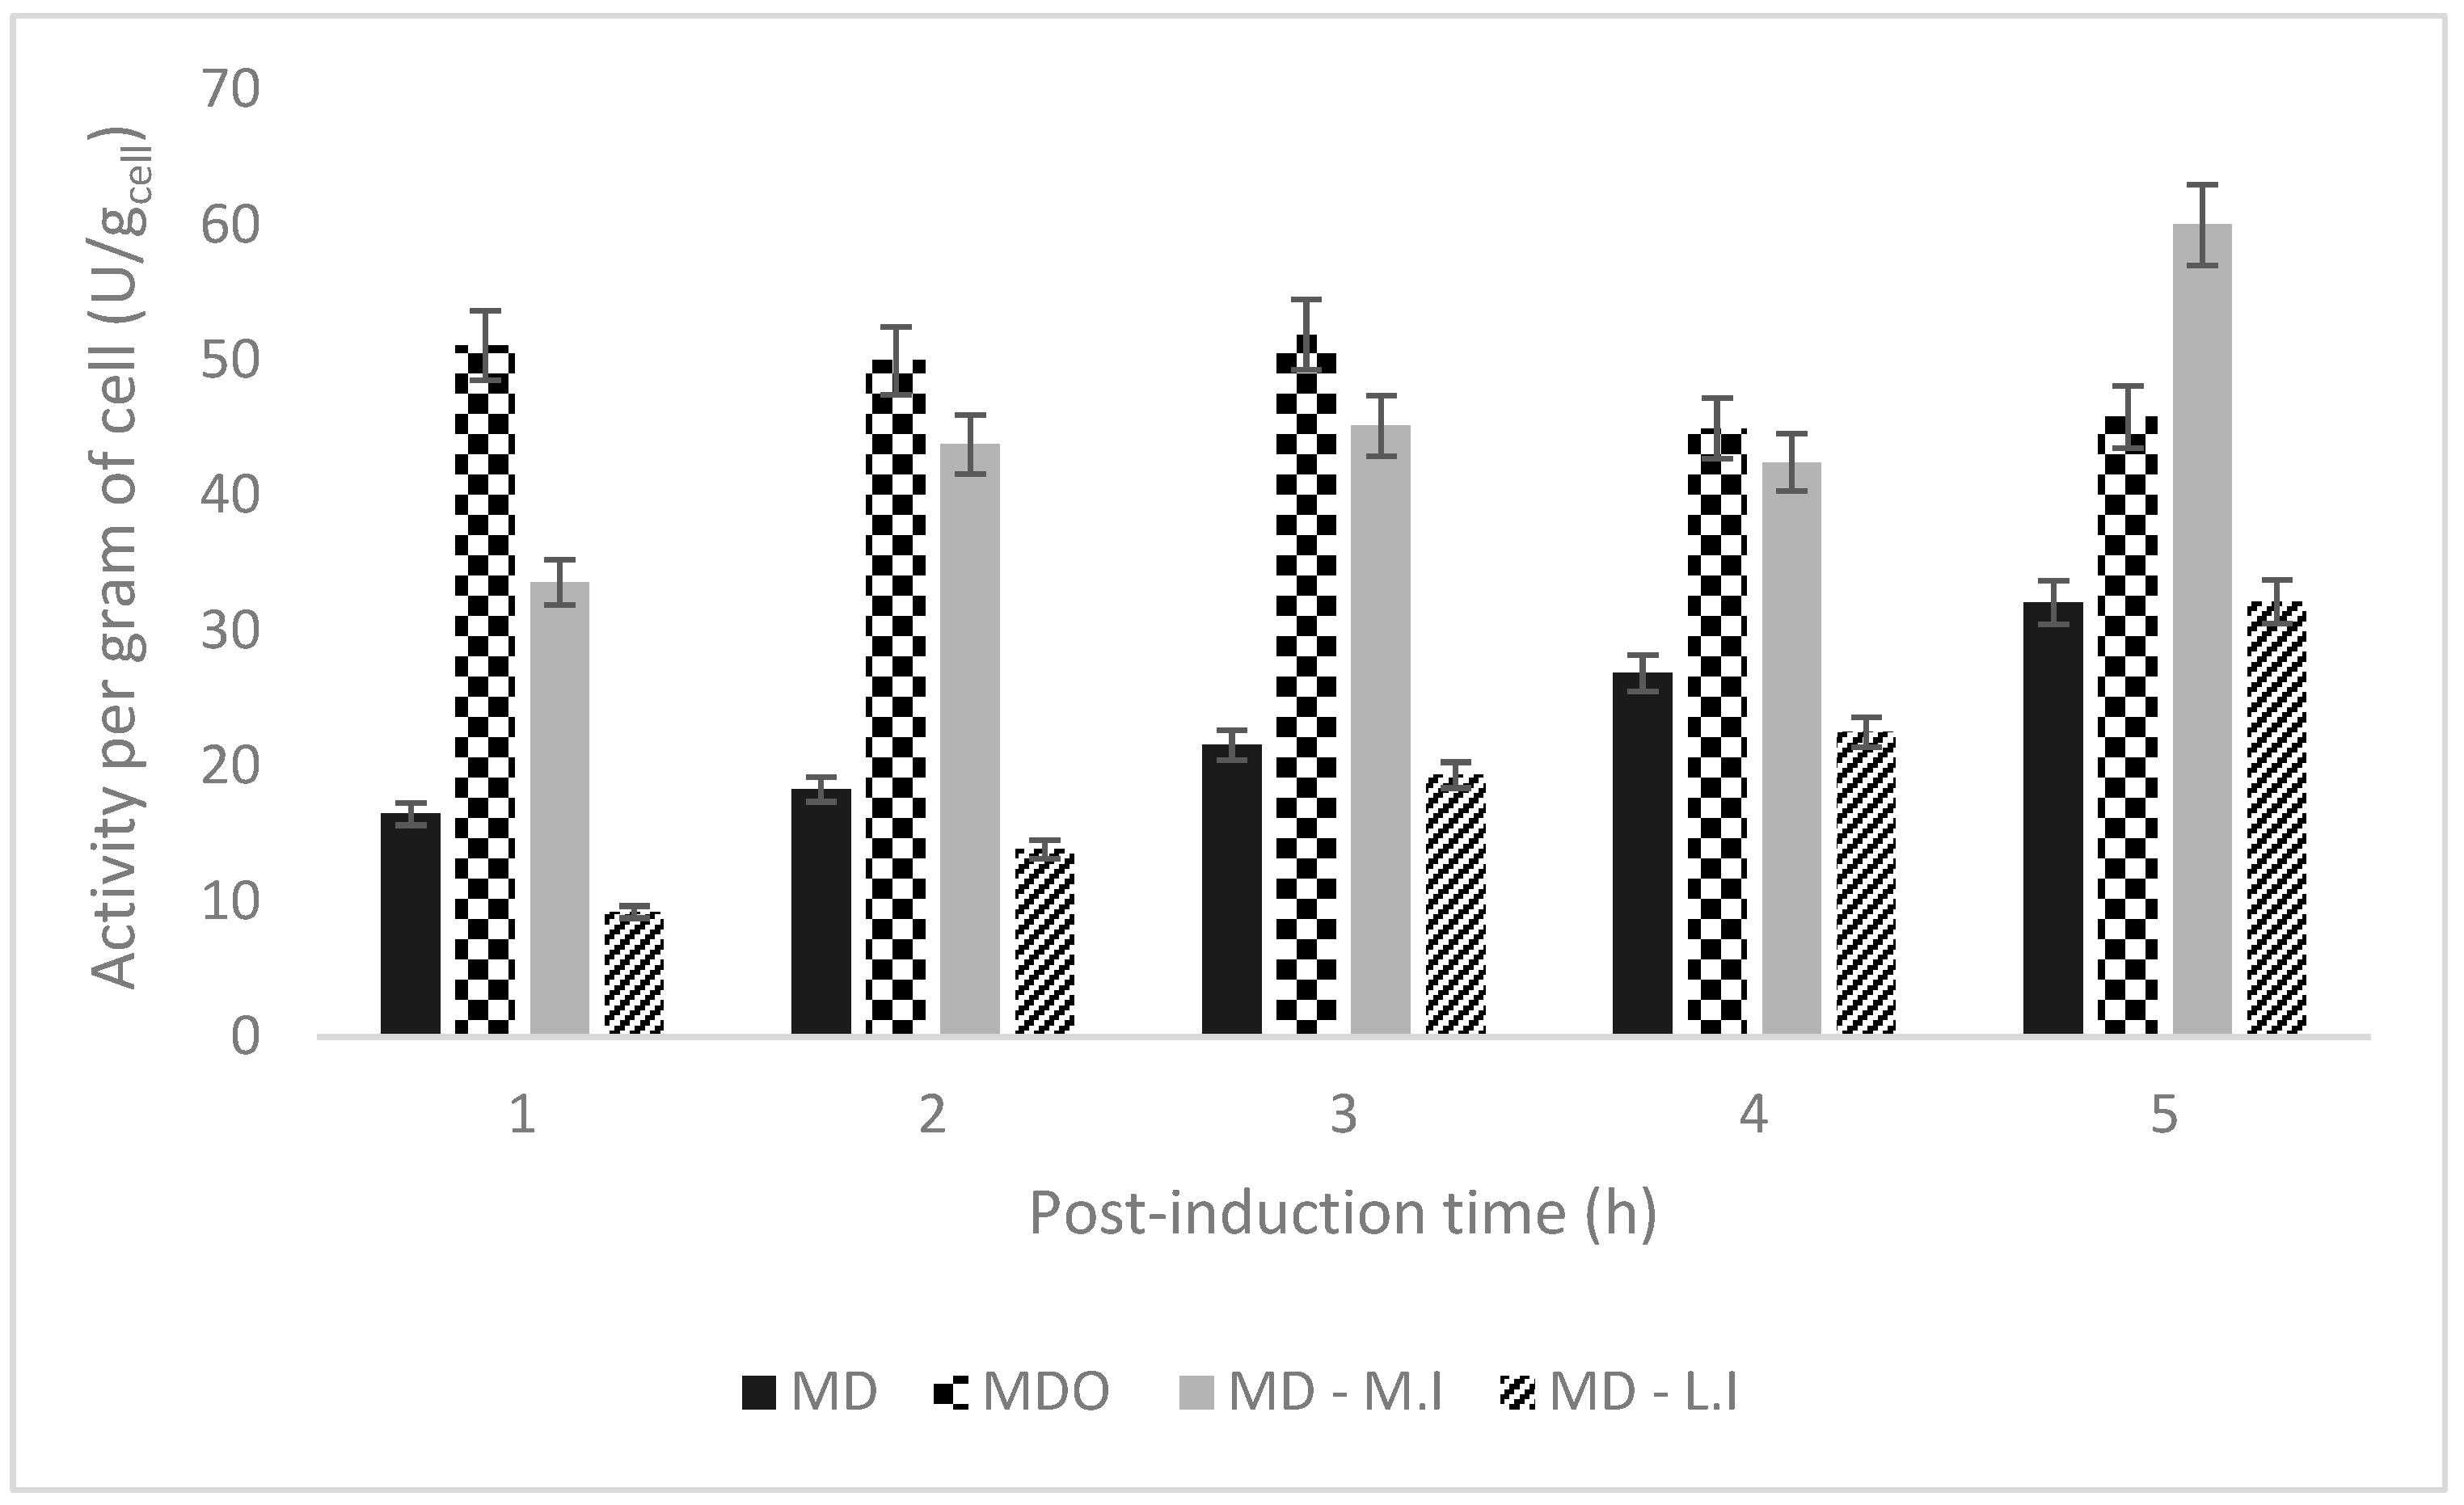
3.4. Evaluation of Induction Conditions and Amino Acids Addition in Bioreactor

The bioreactor tests were conducted with and without the pulse feeding of critical amino acids during the induction phase, taking MD and its induction in the mid-exponential phase as the control. In the case of amino acid feeding, addition was assessed both midway and at the end of the exponential phase.
Initially, an evaluation of the initial biomass concentration was carried out to reduce the potential latency phase of the culture due to high glucose concentrations. The initial OD of the bioreactor cultures was assessed using the MD and MDO media in two tests, first at an initial OD of 0.1 (X = 0.0445 g L−1), and then at an initial OD of 0.5 (X = 0.2143 g L−1) (Figure 7). In the case of the microbial growth curve for MD with an initial OD of 0.1, a more prolonged latency phase can be observed compared to that obtained with an initial OD of 0.5, with a lag or delay of approximately 2 h. Additionally, a decrease in kinetic parameters is noticeable for the culture with an initial OD of 0.1, demonstrating that starting with an initial OD of 0.5 brings these parameters closer to those reported in the literature (Table 9). For this reason, an initial OD of 0.5 will be used for the upcoming bioreactor tests.
For the microbial growth curve in the MDO with an initial OD of 0.1, a more prolonged latency phase can be observed compared to that obtained with an initial OD of 0.5, experiencing a delay of approximately 2 h, similar to the MD. Additionally, a decrease in kinetic parameters is noticeable for the culture with an initial OD of 0.1 (Table 10). Since the pulse-fed- atch cultures were inoculated at OD 0.5, and considering the shorter lag phase observed, this ratio will be maintained for cultures with initially added amino acids.
Regarding biomass growth in the MD, the cells during the growth hours exhibited typical diauxic growth, consuming glucose abruptly between approximately 5.5 and 6.5 h. However, for the MDO, abrupt glucose consumption was observed between 4 and 5.5 h, showing earlier consumption than that observed in the MD. This substrate consumption pattern had previously been reported using glucose and lactose as carbon sources [13].
At the end of the batch culture, a cell density of ~19 g L−1 was achieved for growth in the MD without supplements (Figure 7). In the case of growth supplemented with amino acids at the beginning of the culture, it exhibited a cell density of ~20 g L−1. The growth kinetics and substrate consumption for both the MDO and MD media in the bioreactor are shown in Figure 8.
For the pulse feeding tests, the cells were induced at 6 h (mid-exponential phase) and 7 h (late exponential phase), as indicated by the arrows in Figure 8A. Amino acids were added at concentrations obtained from the response surface design (14.5 mM arginine and 12.7 mM aspartate). Regarding the cultures using MDO, induction occurred at approximately 5.5 h (mid-exponential phase), as indicated by the time stamp in Figure 8B. The choice of several induction points for the defined medium and a single point for the optimized defined medium is given by the characteristics of each medium and the impact on the expression of the protein under study. In the defined medium, several induction points are tested during different stages of bacterial growth since the medium is under suboptimal conditions and presents variability in nutrient availability. Therefore, evaluating induction at different stages, although it may yield inconsistent results, allows us to evaluate which is the right time to maximize the production and expression of the recombinant protein.
On the other hand, the optimized defined medium provides optimal nutritional conditions for bacterial growth, which favors the establishment of a single point of induction. This optimizes bacterial metabolism by minimizing cellular stress and maximizing recombinant protein production in a more controlled, predictable, and cost-effective manner, reducing variability and increasing process efficiency.
The total activity profiles post-induction for both the control (MD) and the amino acid induction tests, as well as the MDO, are illustrated in Figure 9. In both the control and test cultures, except for the MDO, a growing trend in the total activity of L-asparaginase was observed. At the end of the post-induction period (5 h), the total activity of L-asparaginase for the D. dadantii double mutant was 11,063.1 ± 0.00, 19,836.43 ± 1589.9, 26,032.96 ± 3324, and 15,147.15 ± 350.4 UI L−1 for MD, MD—mid-exponential phase induction (MD–M.I), MD—late-exponential phase induction (MD–L.I), and MDO, respectively. All the tests showed improvement compared to the control, with an increase of 16.2%, 79.3%, and 135.3% in total activity for MDO, MD–M.I, and MD–L.I at 5 h post-induction.
However, upon examining the activity profiles obtained per gram of cell (UI/gcell) post-induction for both the control (MD) and the amino acid induction tests, as well as the MDO (Figure 10), it can be observed that the MDO maintained its expression, reaching maximum activity per cell within the first hour. At the end of the post-induction period (5 h), the activity per gram of cell of L-asparaginase for the D. dadantii double mutant was 32.07 ± 0.00, 60 ± 4.8, 32.14 ± 4.1, and 45.81 ± 1.4 UI L−1 for MD, MD–M.I, MD–L.I, and MDO, respectively. All the tests showed improvement compared to the control, with an increase of 42.87%, 87.1%, and 0.23% in activity per gram of cell for MDO, MD–M.I, and MD–L.I, respectively. The MD–M.I condition was the one that achieved the best activity per gram of cell.
The parameters obtained from the strategies of the cultures conducted in the bioreactor, such as total activity, activity per dry mass, yield of activity per gram of glucose, and specific product rate, are summarized in Table 11.
Regarding the total activity (U L−1), these results showed an increasing increase with values ranging from 11,063.1 U L−1 with MD culture (defined medium) to 26,032.96 U L−1 in the MD–L.I strategy (defined medium with in-line feeding). These values can be associated with the continuous supply of nutrients, especially at critical points of fermentation, which maintains cell viability and productivity throughout the process and increases enzyme production.
On the other hand, in the parameter associated with activity per dry mass (U/gcell), the highest activity per cell biomass was obtained with the MD–M.I strategy (defined medium with pulse feeding), with up to 60 U/gcell. This suggests a higher metabolic efficiency of this crop, since strategies that contemplate feeding the culture during the exponential phase and rigorous control of cell density can affect the efficiency of conversion between biomass and product, which translates into an increase in activity per dry mass. Moreover, in this case, bacterial metabolism was focused on enzyme synthesis, possibly due to the selection of induction and feeding conditions that favor production without affecting cell growth.
Additionally, the Activity Yield per Gram of Glucose (U/gglucose) reached values up to 946.65 U/g glucose, and the Specific Production Rate (Qp) reached a value of (2169.41 U/L.h with MD–L.I), respectively. These results demonstrate an optimal utilization of the substrate and can be attributed to an optimal balance between L-asparaginase enzymatic production and energy metabolism and to the use of a defined medium with specific amino acids and glucose control.
These results obtained from bioreactor cultivation strategies are crucial to evaluate the efficiency and effectiveness of L-asparaginase production as they not only increase the total enzyme activity but also optimize the process by improving its efficiency in terms of resources and time.

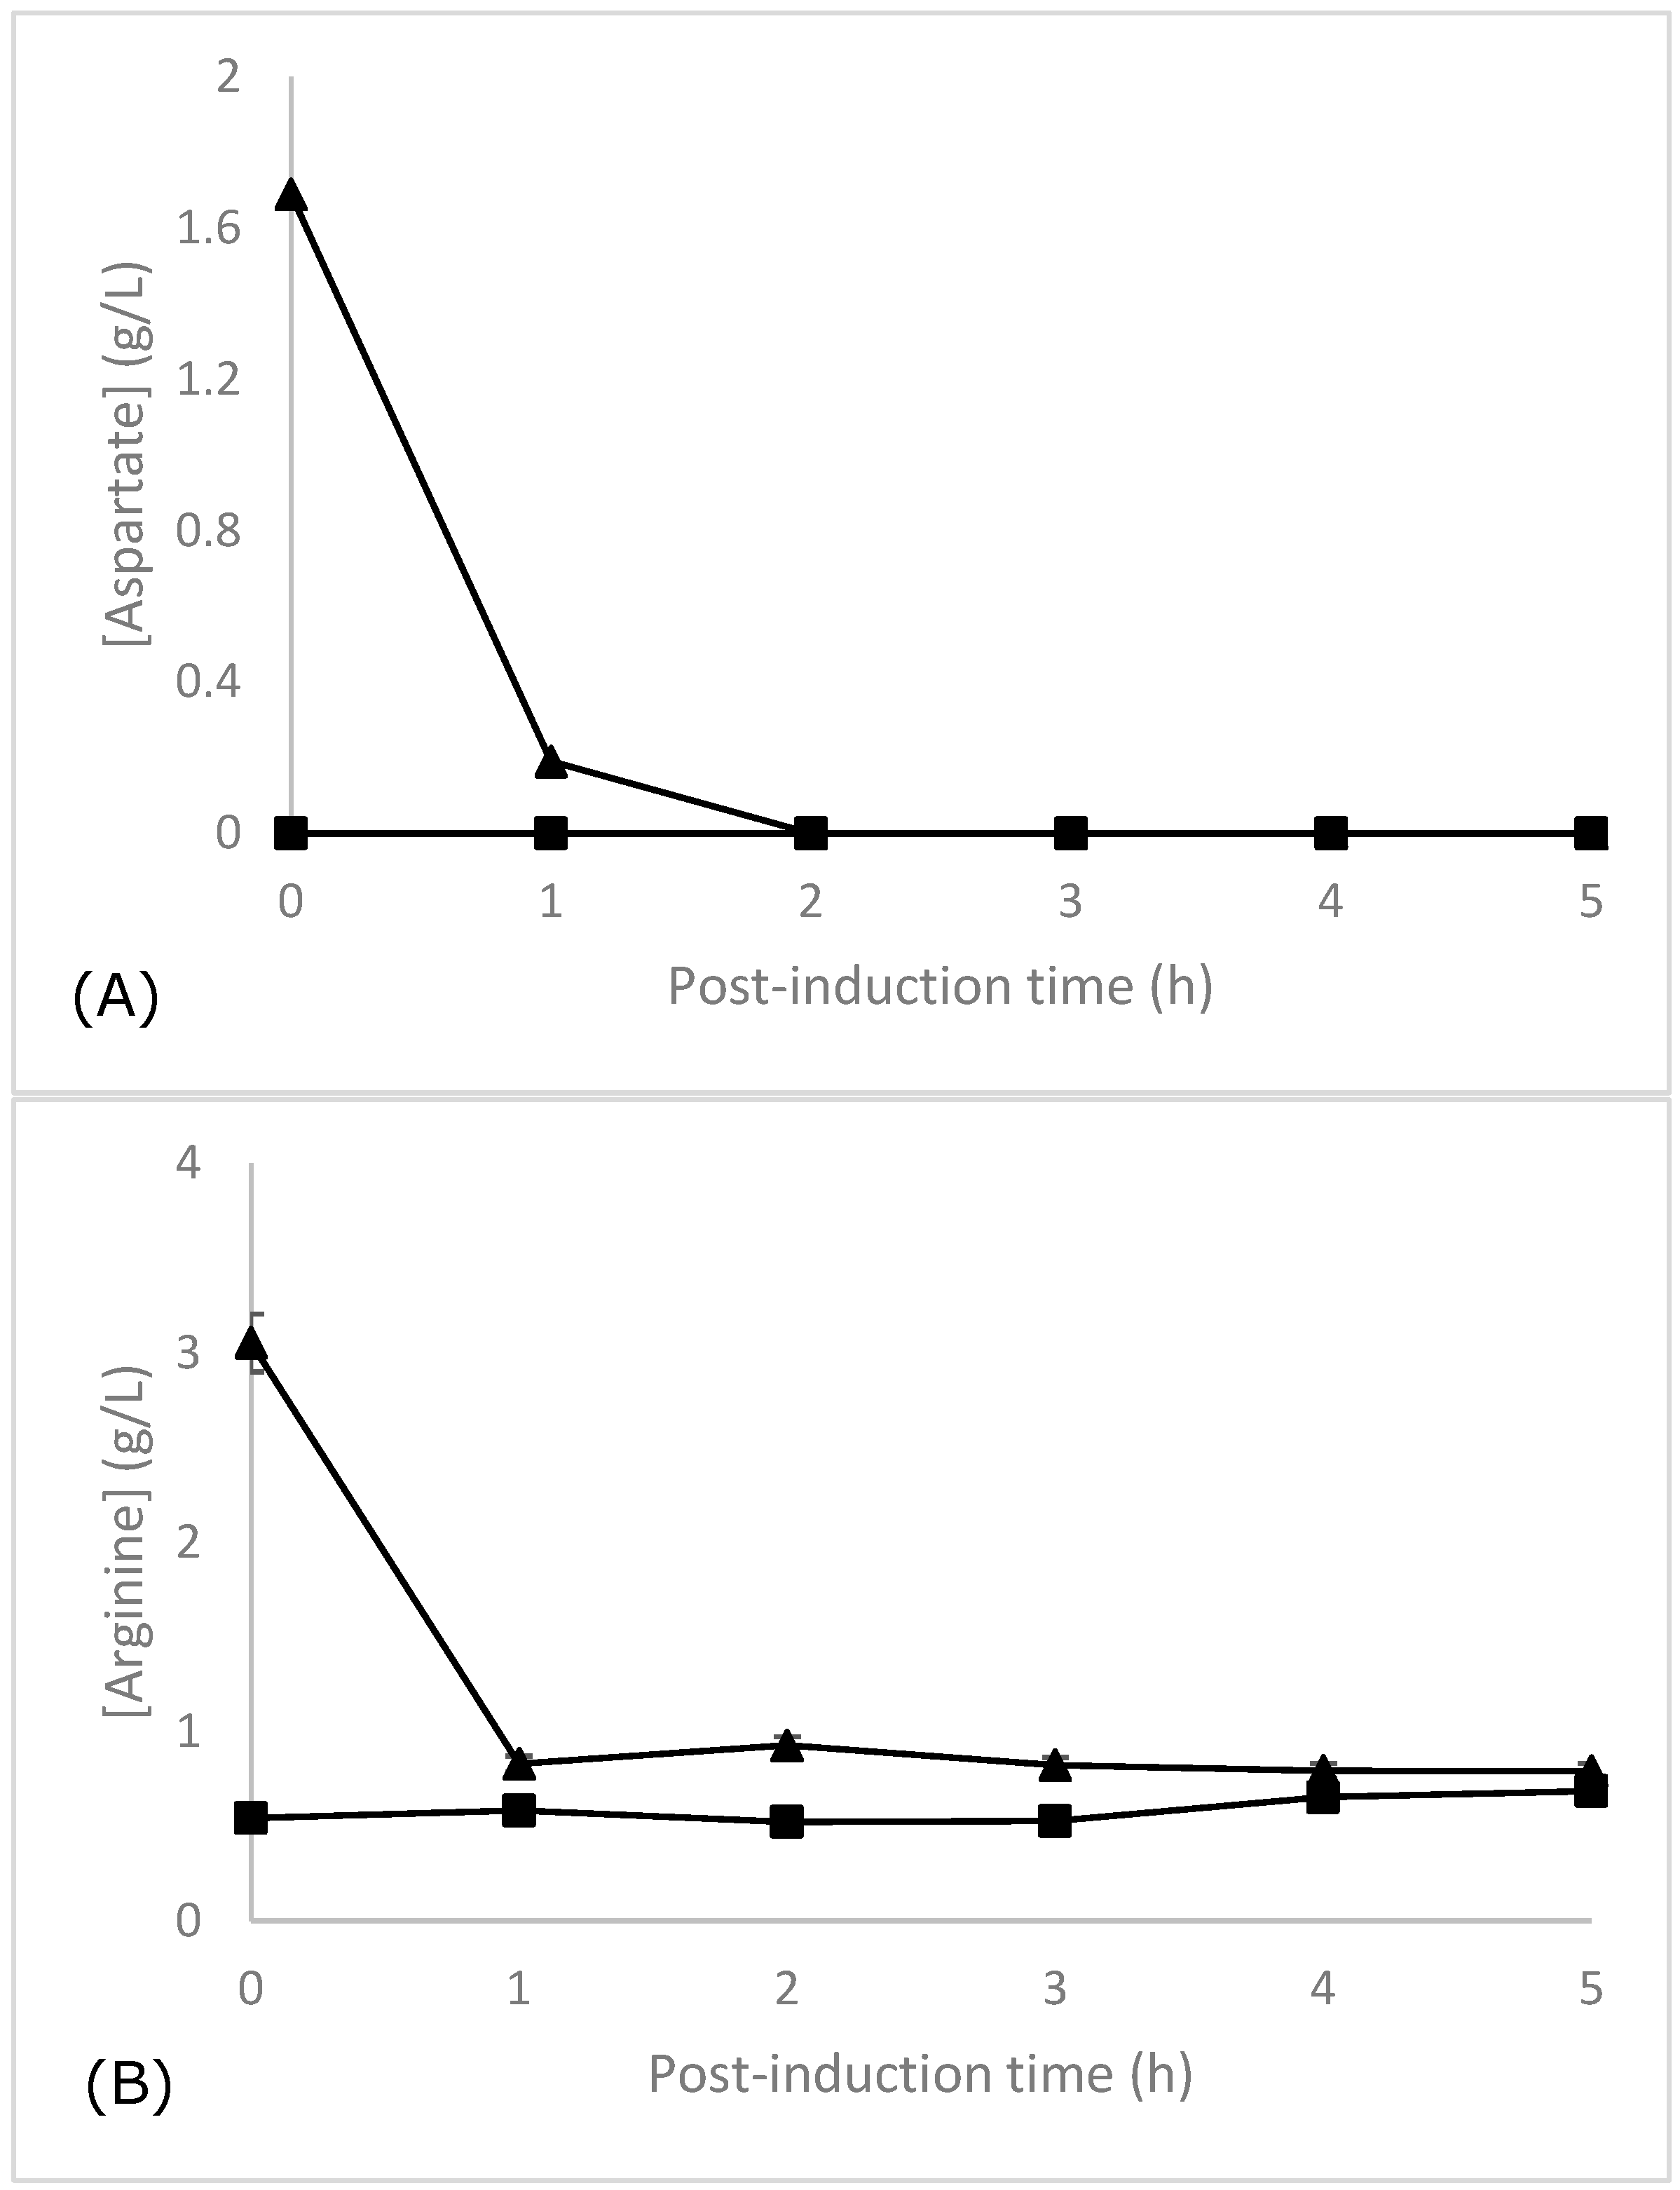
3.5. Amino Acid Analysis by LC-MS/MS

In addition to the analyses of kinetic growth profiles, substrate consumption, and L-asparaginase production, a kinetics study of the amino acids used in this work was conducted for both the MD–L.I and MDO strategies using liquid chromatography–tandem mass spectrometry (LC-MS/MS), as depicted in Figure 11.
Regarding aspartate, in both cases, no residual amino acid was detected in the medium. However, it is noticeable that for both the MD–L.I and MDO, there was an unconsumed fraction of arginine around 0.7–0.8 g L−1. The consumption rates of aspartic acid and arginine for MD–L.I were 1.5 and 2.224 g/L.h, respectively. Additionally, it can be observed that when aspartate is completely consumed, arginine ceases to be consumed (approximately at 1.13 h). As mentioned earlier, the catabolism of aspartate through the Krebs–Henseleit metabolic pathways and the subsequent degradation of arginine through the AST pathway using E. coli K-12 as a model have been reported. However, when observing the consumption of arginine, after aspartate was completely consumed, inhibition of the arginine degradation pathway can be observed. Schneider Barbara et al. (1998) [39], studying arginine catabolism through the AST pathway, observed that this pathway is nitrogen-dependent. Studying the activity of enzymes present in the pathway under different types and conditions of carbon and nitrogen sources in the culture media, it was observed that when aspartate is used as the primary nitrogen source and arginine as a trace nitrogen source, it allows for growth compared to using arginine in higher concentrations than aspartate, where growth inhibition and arginine consumption were observed. Therefore, the results presented in Figure 11 reinforce the idea that upon adding this synergistic mixture of arginine/aspartate, E. coli undergoes a change in the metabolic pathway, allowing an increase in recombinant protein production until the complete consumption of the primary nitrogen source (aspartate) and inhibition of the AST pathway, preventing the consumption of remaining arginine. These pathways mentioned earlier had not been studied in the E. coli BL21 (DE3) strain, so these results provide important insights for a better understanding of the strain’s metabolic response to the introduction of the synergistic mixture of arginine/aspartate. The increase in recombinant protein production associated with the change in the metabolic pathway suggests a potential optimization of cellular resources, highlighting the efficiency of this approach.
However, it is worth noting that the increase in L-asparaginase activity associated with the use of amino acids in culture encompasses factors such as the reduction in the metabolic load, the optimization of the culture medium, and the functional and metabolic characteristics of the strain used to recombinantly produce the protein.
Enzyme synthesis is supported by essential nutrients that promote enzyme synthesis and thus cell growth and proliferation. By reducing the need to synthesize amino acids de novo, the cell can devote all its internal machinery to protein synthesis, in this specific case L-asparaginase.
On the other hand, the use of strain BL21 (DE3) in this case as a producer strain is a key step in the activity of the enzyme since this strain presents an efficient and widely studied system of production and expression of recombinant proteins. It has also been extensively described and characterized, has been tested, and has been shown to have specialized cellular machinery focused on protein production, which has made it one of the first strains worldwide to be used for the production and scaling even at the industrial level of certain compounds of protein origin.

4. Conclusions

The double-mutated L-ASNase from D. dadantii demonstrates immense potential for applications in both the biopharmaceutical and food industries. With a growing need for L-ASNase variants exhibiting improved safety and efficacy, this study highlights a promising enzyme with enhanced specific activity and reduced immunogenicity. The optimization strategy employed in this study yielded remarkable results in the production of the double mutant L-ASNase. By supplementing the defined culture medium with arginine and aspartate at the shake flask scale, L-ASNase production increased nearly tenfold, from 1067.41 U L−1 to 10,088.92 U L−1. The use of the design of experiments (DoE) proved instrumental in identifying optimal amino acid sources and interpreting the complex interplay of nutrient combinations, leveraging E. coli’s ability to utilize diverse carbon and nitrogen sources. This underscores the importance of not only optimization strategies but also a deep understanding of the metabolic burden imposed by recombinant protein production. The kinetic parameter analysis further validated the optimization model and provided critical insights into biomass production, L-ASNase activity, and yields. The optimized defined medium achieved the best results at the shake flask scale. However, at the bioreactor scale, yields were somewhat reduced due to increased cell biomass in the cultures.
In contrast to the results, it must be kept in mind that when extrapolating this methodology to other asparaginases or other proteins, the effect of supplementation of the medium with amino acids may vary and present a differentiated impact on their production, expression, and activity. Each protein has a different nature, which implies different structures, loads, and therefore, different metabolic pathways, which in turn leads to a specific demand for amino acids, thus varying the amount and composition of amino acid supplementation and the protein response to it. Additionally, the strain that is designated as the producer, together with the capacity of this strain to process amino acids, together with other variables such as culture conditions, pH, and temperature, affect protein expression and protein activity. Also, certain proteins need specific post-translational modifications, which implies the supply of specific amino acids to the medium; in addition, many amino acids can interact and the availability of these can favor or not the protein expression. In addition, it is important to take into account that the study is based on a double mutant protein designed to increase its activated asparaginase with an increase of 46% above the normal value. Therefore, these structural modifications may affect the results obtained concerning the activity of the enzyme, in contrast with the native asparaginase or other variants of this protein or in comparison with other types of proteins.
Taking into account these considerations and despite this limitation, the study achieved a 135% (2.35-fold) improvement in total L-ASNase activity by employing amino acid feeding and pulse induction at the end of the exponential growth phase. These findings highlight the value of rational amino acid supplementation in formulating defined culture media for biotherapeutic production.

Author Contributions

Drafting: N.L.; conceptualization and design: N.L.; methodology, N.L. and J.M.; investigation, N.L., J.M., A.P.J. and J.G.F.; resources, G.M., I.M.C., J.G.F. and A.P.J.; writing—original draft preparation, N.L.; supervision, A.P.J., J.G.F. and M.Z.; review, correction, and editing, A.P.R. All authors have read and agreed to the published version of the manuscript.

Funding

This work was supported by the state of São Paulo Research Foundation and Universidad de La Frontera, FAPESP-UFRO (grant number 2020/06982-3) and by the Chilean National Research and Development Agency (ANID) Fondecyt program (grants number 11230701 and 1240197).

Institutional Review Board Statement

Not applicable for this study.

Informed Consent Statement

Not applicable for this study.

Data Availability Statement

The original contributions presented in this study are included in the article. Further inquiries can be directed to the corresponding author.

Acknowledgments

Thanks to ANID (Agencia Nacional de Investigación y Desarrollo) Master Scholarship, (grant number 22220584).

Conflicts of Interest

The authors declare no conflicts of interest.

References

  1. Wang, Y.; Xu, W.; Wu, H.; Zhang, W.; Guang, C.; Mu, W. Microbial production, molecular modification, and practical application of l-Asparaginase: A review. Int. J. Biol. Macromol. 2021, 186, 975–983. [Google Scholar] [CrossRef] [PubMed]
  2. Jangra, S.; Srivastava, S. Microbial Enzymes in Food Industries: Enhancing Quality and Sustainability. In Food Microbial Sustainability: Integration of Food Production and Food Safety; Karnwal, A., Mohammad Said Al-Tawaha, A.R., Eds.; Springer Nature: Singapore, 2023; pp. 193–221. [Google Scholar] [CrossRef]
  3. Ofori-Boateng, C. (Ed.) Global Market Profile of Bioproducts from Thermochemical Conversion Technologies. In Sustainability of Thermochemical Waste Conversion Technologies; Springer International Publishing: Cham, Switzerland, 2024; pp. 29–54. [Google Scholar] [CrossRef]
  4. Chand, S.; Mahajan, R.V.; Prasad, J.P.; Sahoo, D.K.; Mihooliya, K.N.; Dhar, M.S.; Sharma, G. A comprehensive review on microbial l-asparaginase: Bioprocessing, characterization, and industrial applications. Biotechnol. Appl. Biochem. 2020, 67, 619–647. [Google Scholar] [CrossRef] [PubMed]
  5. Cardoso, V.M.; Campani, G.; Santos, M.P.; Silva, G.G.; Pires, M.C.; Gonçalves, V.M.; Giordano, R.d.C.; Sargo, C.R.; Horta, A.C.; Zangirolami, T.C. Cost analysis based on bioreactor cultivation conditions: Production of a soluble recombinant protein using Escherichia coli BL21(DE3). Biotechnol. Rep. 2020, 26, e00441. [Google Scholar] [CrossRef]
  6. Tripathi, N.K.; Shrivastava, A. Recent Developments in Bioprocessing of Recombinant Proteins: Expression Hosts and Process Development. Front. Bioeng. Biotechnol. 2019, 7, 420. [Google Scholar] [CrossRef]
  7. Kante, R.K.; Vemula, S.; Somavarapu, S.; Mallu, M.R.; Boje Gowd, B.H.; Ronda, S.R. Optimized upstream and downstream process conditions for the improved production of recombinant human asparaginase (rhASP) from Escherichia coli and its characterization. Biologicals 2018, 56, 45–53. [Google Scholar] [CrossRef]
  8. Rosano, G.L.; Morales, E.S.; Ceccarelli, E.A. New tools for recombinant protein production in Escherichia coli: A 5-year update. Protein Sci. 2019, 28, 1412–1422. [Google Scholar] [CrossRef]
  9. Tripathi, N.K. Production and Purification of Recombinant Proteins from Escherichia coli. ChemBioEng Rev. 2016, 3, 116–133. [Google Scholar] [CrossRef]
  10. Doran, P.M. Bioprocess Engineering Principles; Elsevier: Amsterdam, The Netherlands, 1995. [Google Scholar]
  11. Gamboa-Suasnavart, R.A.; Marín-Palacio, L.D.; Martínez-Sotelo, J.A.; Espitia, C.; Servín-González, L.; Valdez-Cruz, N.A.; Trujillo-Roldán, M.A. Scale-up from shake flasks to bioreactor, based on power input and Streptomyceslividans morphology, for the production of recombinant APA (45/47 kDa protein) from Mycobacteriumtuberculosis. World J. Microbiol. Biotechnol. 2013, 29, 1421–1429. [Google Scholar] [CrossRef]
  12. Behravan, A.; Hashemi, A.; Marashi, S.A. A Constraint-based modeling approach to reach an improved chemically defined minimal medium for recombinant antiEpEX-scFv production by Escherichia coli. Biochem. Eng. J. 2022, 179, 108339. [Google Scholar] [CrossRef]
  13. Kumar, J.; Chauhan, A.S.; Shah, R.L.; Gupta, J.A.; Rathore, A.S. Amino acid supplementation for enhancing recombinant protein production in E. coli. Biotechnol. Bioeng. 2020, 117, 2420–2433. [Google Scholar] [CrossRef]
  14. Maser, A.; Peebo, K.; Vilu, R.; Nahku, R. Amino acids are key substrates to Escherichia coli BW25113 for achieving high specific growth rate. Res. Microbiol. 2020, 171, 185–193. [Google Scholar] [CrossRef] [PubMed]
  15. Kaleta, C.; Schäuble, S.; Rinas, U.; Schuster, S. Metabolic costs of amino acid and protein production in Escherichia coli. Biotechnol. J. 2013, 8, 1105–1114. [Google Scholar] [CrossRef] [PubMed]
  16. Brumano, L.P.; da Silva, F.V.S.; Costa-Silva, T.A.; Apolinário, A.C.; Santos, J.H.P.M.; Kleingesinds, E.K.; Monteiro, G.; Rangel-Yagui, C.d.O.; Benyahia, B.; Junior, A.P. Development of L-Asparaginase Biobetters: Current Research Status and Review of the Desirable Quality Profiles. Front. Bioeng. Biotechnol. 2019, 6, 212. [Google Scholar] [CrossRef]
  17. Papaneophytou, C. Design of Experiments As a Tool for Optimization in Recombinant Protein Biotechnology: From Constructs to Crystals. Mol. Biotechnol. 2019, 61, 873–891. [Google Scholar] [CrossRef]
  18. Uhoraningoga, A.; Kinsella, G.K.; Henehan, G.T.; Ryan, B.J. The goldilocks approach: A review of employing design of experiments in prokaryotic recombinant protein production. Bioengineering 2018, 5, 89. [Google Scholar] [CrossRef]
  19. Lee, K.M.; Gilmore, D.F. Statistical experimental design for bioprocess modeling and optimization analysis. Appl. Biochem. Biotechnol. 2006, 135, 101–115. [Google Scholar] [CrossRef]
  20. Shakambari, G.; Ashokkumar, B.; Varalakshmi, P. L-asparaginase—A promising biocatalyst for industrial and clinical applications. Biocatal. Agric. Biotechnol. 2019, 17, 213–224. [Google Scholar] [CrossRef]
  21. Battistel, A.P.; da Rocha, B.S.; dos Santos, M.T.; Daudt, L.E.; Michalowski, M.B. Allergic reactions to asparaginase: Retrospective cohort study in pediatric patients with acute lymphoid leukemia. Hematol. Transfus. Cell Ther. 2021, 43, 9–14. [Google Scholar] [CrossRef]
  22. Jia, R.; Wan, X.; Geng, X.; Xue, D.; Xie, Z.; Chen, C. Microbial L-asparaginase for application in acrylamide mitigation from food: Current research status and future perspectives. Microorganisms 2021, 9, 1659. [Google Scholar] [CrossRef]
  23. Burke, M.J. How to manage asparaginase hypersensitivity in acute lymphoblastic leukemia. Future Oncol. 2014, 10, 2615–2627. [Google Scholar] [CrossRef]
  24. Parizotto, L.d.A.; Kleingesinds, E.K.; da Rosa, L.M.P.; Effer, B.; Lima, G.M.; Herkenhoff, M.E.; Li, Z.; Rinas, U.; Monteiro, G.; Pessoa, A.; et al. Increased glycosylated L-asparaginase production through selection of Pichia pastoris platform and oxygen-methanol control in fed-batches. Biochem. Eng. J. 2021, 173, 108083. [Google Scholar]
  25. Effer, B.; Kleingesinds, E.K.; Lima, G.M.; Costa, I.M.; Sánchez-Moguel, I.; Pessoa, A.; Santiago, V.F.; Palmisano, G.; Farías, J.G.; Monteiro, G. Glycosylation of Erwinase results in active protein less recognized by antibodies. Biochem. Eng. J. 2020, 163, 107750. [Google Scholar] [CrossRef]
  26. Kishore, V.; Nishita, K.P.; Manonmani, H.K. Cloning, expression and characterization of l-asparaginase from Pseudomonas fluorescens for large scale production in E. coli BL21. 3 Biotech 2015, 5, 975–981. [Google Scholar] [CrossRef]
  27. Costa, I.M.; Moura, D.C.; Lima, G.M.; Pessoa, A.; dos Santos, C.O.; de Oliveira, M.A.; Monteiro, G. Engineered asparaginase from enhances asparagine hydrolase activity and diminishes enzyme immunoreactivity—A new promise to treat acute lymphoblastic leukemia. J. Chem. Technol. Biotechnol. 2022, 97, 228–239. [Google Scholar] [CrossRef]
  28. Riesenberg, D.; Schulz, V.; Knorre, W.A.; Pohl, H.D.; Korz, D.; Sanders, E.A.; Roß, A.; Deckwer, W.-D. High cell density cultivation of Escherichia coli at controlled specific growth rate. J. Biotechnol. 1991, 20, 17–27. [Google Scholar] [CrossRef]
  29. Bren, A.; Park, J.O.; Towbin, B.D.; Dekel, E.; Rabinowitz, J.D.; Alon, U. Glucose becomes one of the worst carbon sources for E. coli on poor nitrogen sources due to suboptimal levels of cAMP. Sci. Rep. 2016, 6, 24834. [Google Scholar] [CrossRef]
  30. Simas, R.G.; Krebs Kleingesinds, E.; Pessoa Junior, A.; Long, P.F. An improved method for simple and accurate colorimetric determination of l-asparaginase enzyme activity using Nessler’s reagent. J. Chem. Technol. Biotechnol. 2021, 96, 1326–1332. [Google Scholar] [CrossRef]
  31. Magri, A.; Soler, M.F.; Lopes, A.M.; Cilli, E.M.; Barber, P.S.; Pessoa, A.; Pereira, J.F.B. A critical analysis of L-asparaginase activity quantification methods—Colorimetric methods versus high-performance liquid chromatography. Anal. Bioanal. Chem. 2018, 410, 6985–6990. [Google Scholar] [CrossRef]
  32. Santos, J.C.F. Cultivo de Escherichia coli BL21 (DE3) para Produção de L-Asparaginase II. Master’s Thesis, Faculdade de Ciências Farmacêuticas, Universidade de São Paulo, São Paulo, Brazil, 2017. [Google Scholar]
  33. Thomas, J.A.; Schlender, K.K.; Larner, J. A rapid filter paper assay for UDPglucose-glycogen glucosyltransferase, including an improved biosynthesis of UDP-14C-glucose. Anal. Biochem. 1968, 25, 486–499. [Google Scholar] [CrossRef]
  34. Zhou, Y.; Imlay, J.A. Escherichia coli Uses a Dedicated Importer and Desulfidase to Ferment Cysteine. mBio 2022, 13, e02965-21. [Google Scholar] [CrossRef]
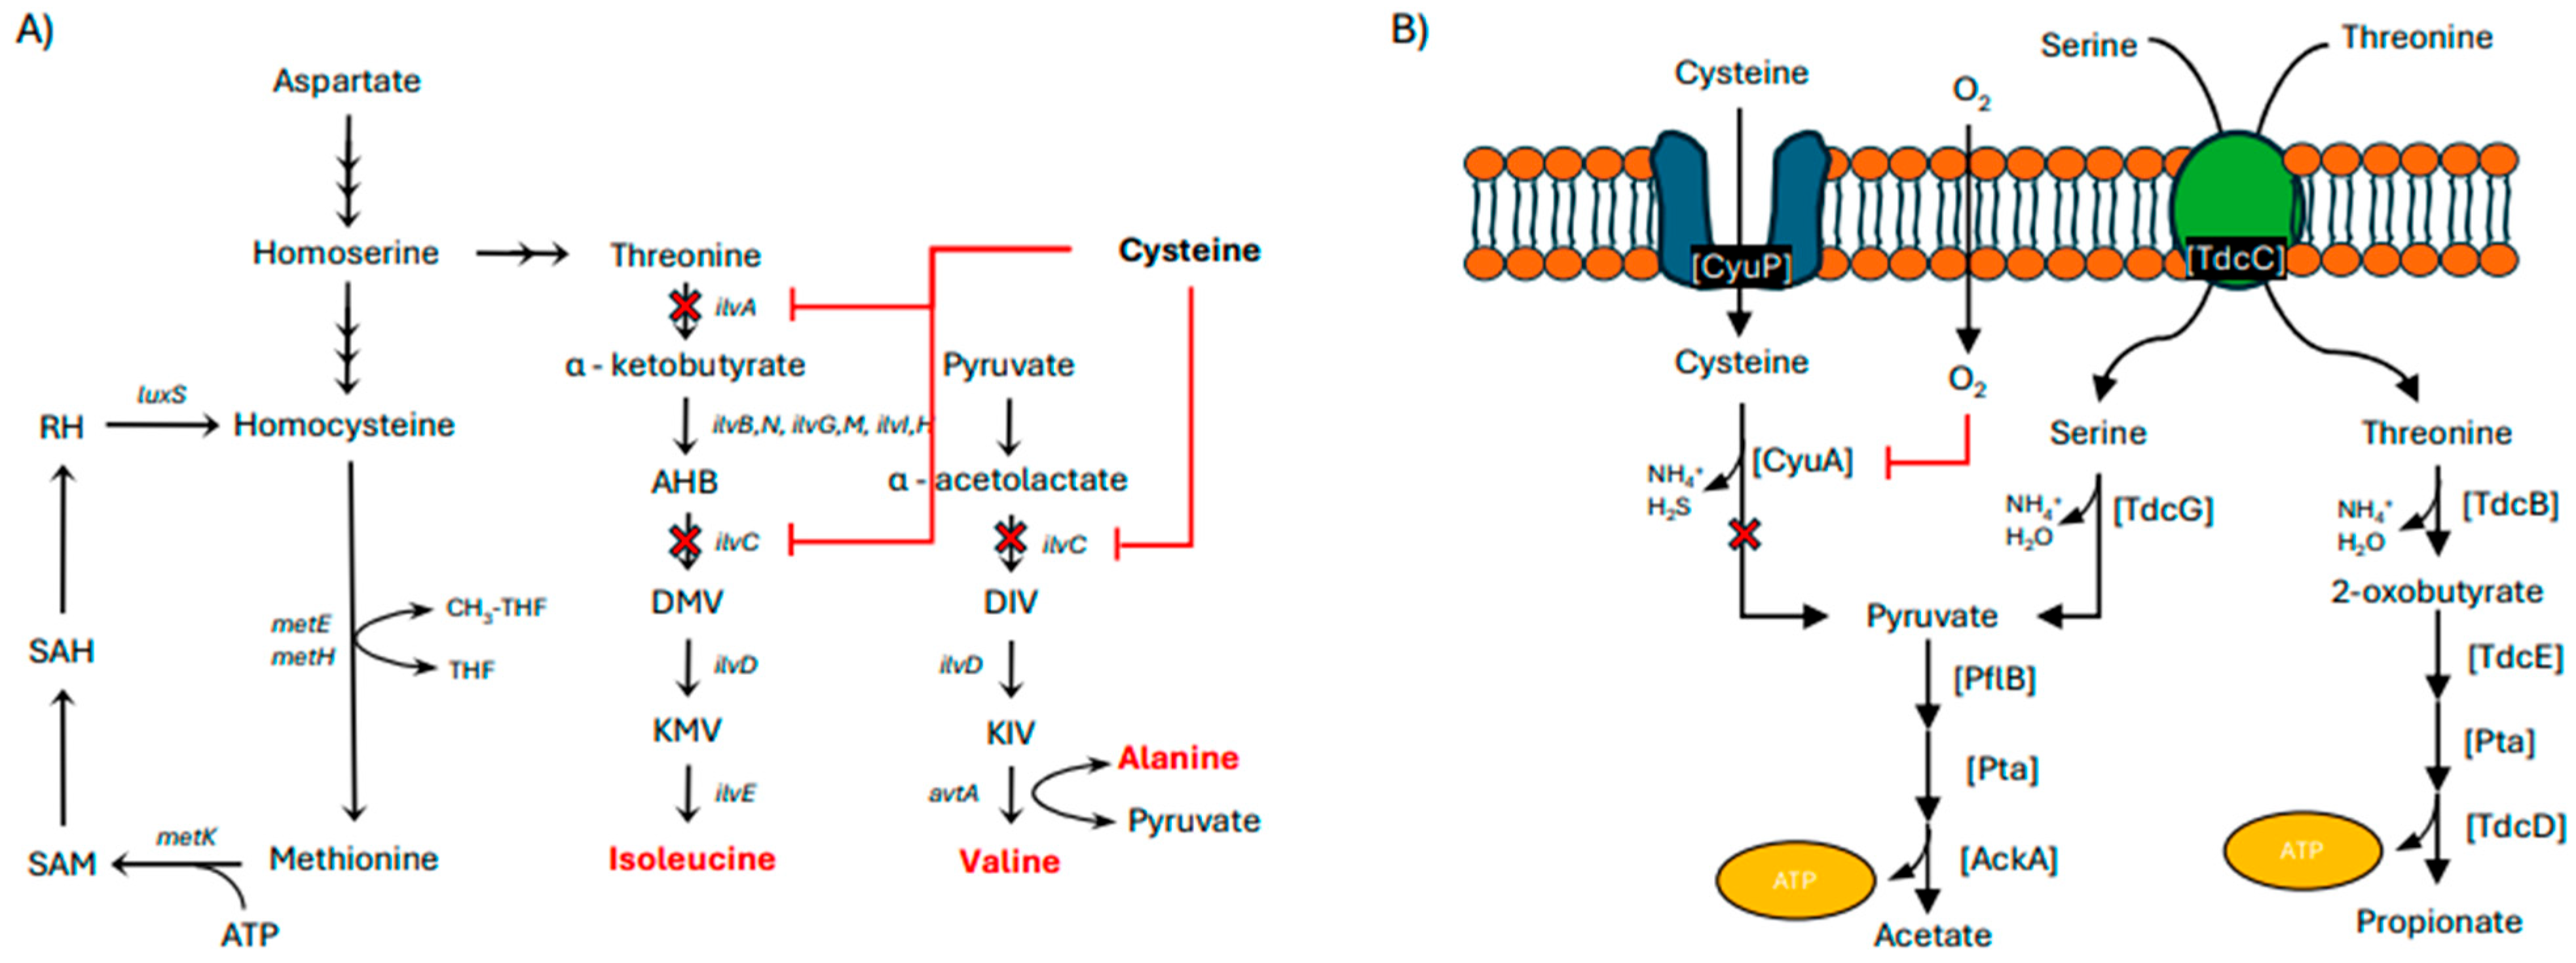
  35. Harris, C.L. Cysteine and growth inhibition of Escherichia coli: Threonine deaminase as the target enzyme. J. Bacteriol. 1981, 145, 1031–1035. [Google Scholar] [CrossRef] [PubMed]
  36. Sørensen, M.A.; Pedersen, S. Cysteine, even in low concentrations, induces transient amino acid starvation in Escherichia coli. J. Bacteriol. 1991, 173, 5244–5246. [Google Scholar] [CrossRef] [PubMed]
  37. Tuite, N.L.; Fraser, K.R.; O’Byrne, C.P. Homocysteine Toxicity in Escherichia coli Is Caused by a Perturbation of Branched-Chain Amino Acid Biosynthesis. J. Bacteriol. 2005, 187, 4362–4371. [Google Scholar] [CrossRef]
  38. Reitzer, L. Nitrogen assimilation and global regulation in Escherichia coli. Annu. Rev. Microbiol. 2003, 57, 155–176. [Google Scholar] [CrossRef]
  39. Schneider, B.L.; Kiupakis, A.K.; Reitzer, L.J. Arginine Catabolism and the Arginine Succinyltransferase Pathway in Escherichia coli. J. Bacteriol. 1998, 180, 4278–4286. [Google Scholar] [CrossRef]
  40. Strecker, A.; Schubert, C.; Zedler, S.; Steinmetz, P.; Unden, G. DcuA of aerobically grown Escherichia coli serves as a nitrogen shuttle (L-aspartate/fumarate) for nitrogen uptake. Mol. Microbiol. 2018, 109, 801–811. [Google Scholar] [CrossRef]
  41. Schubert, C. L-Aspartate Is a High-Quality Nitrogen Source of Escherichia coli: Regulation and Physiology. Ph.D. Thesis, Johannes Gutenberg-Universität Mainz, Mainz, Germany, 2021. [Google Scholar]
  42. Barros, T.d.S. Desenvolvimento de Processos para Produção em Escala da Enzima L-Asparaginase Por Escherichia coli BL21 (DE3) AspB. Master’s Thesis, Universidade de Brasília, Brasília, Brazil, 2020. [Google Scholar]
  43. Flores-Santos, J.C.; Moguel, I.S.; Monteiro, G.; Pessoa, A.; Vitolo, M. Improvement in extracellular secretion of recombinant l-asparaginase II by Escherichia coli BL21 (DE3) using glycine and n-dodecane. Braz. J. Microbiol. 2021, 52, 1247–1255. [Google Scholar] [CrossRef]
  44. Guennadi, S.; Danièle, J.P.; Richard, D. Escherichia coli Physiology in Luria-Bertani Broth. J. Bacteriol. 2007, 189, 8746–8749. [Google Scholar] [CrossRef]
Figure 1. Pareto plot of the factor’s effects on L-asparaginase expression for full factorial design with total activity (UIL−1) as the response (effects in orange color, positive; blue color, negative).
Fermentation 11 00239 g001
Figure 2. Contour and three-dimensional (3D) plot of the response surface of L-ASNase (UI L−1) production as a function of (A) arginine and aspartate; (B) arginine and cysteine; and (C) aspartate and cysteine, in the ranges evaluated experimentally by CCRD.
Fermentation 11 00239 g002
Figure 3. Possible mechanisms of growth inhibition by (A) inhibition of isoleucine, valine, and alanine synthesis pathways by cysteine; and (B) cysteine degradation in E. coli metabolism. Anaerobic catabolism of cysteine, serine, and threonine. All three pathways begin with deamidated dehydration reactions.
Fermentation 11 00239 g003
Figure 4. Response surface generated from the model delivered by the CCRD. The ranges of both the contour and 3D plots were predicted: Aspartate [0; 32.87 mM] and Arginine [0; 33.89 mM] and with cysteine value = 0 mM.
Fermentation 11 00239 g004
Figure 5. Kinetics of growth, kinetics of glucose consumption, and L-ASNase production. (A) CDM and (B) CDM-S.
Fermentation 11 00239 g005aFermentation 11 00239 g005b
Figure 6. Schematic of aspartate transport via the DcuA transporter during aerobic growth and the Krebs–Henseleit and arginine succinyl transferase (AST) pathways, which allow ammonia and fumarate production. The scheme includes the possible inhibition of the AST pathway by supplementing the medium with aspartate together with arginine (red cross and green arrow), allowing the enhancement of both growth and L-ASNase expression (modified from Strecker et al. (2018) [40]).
Fermentation 11 00239 g006
Figure 7. Growth curves were generated in a batch bioreactor mode using a defined medium (MD) with an initial OD of 0.1 (▲) and 0.5 (●) and an optimized defined medium (MDO) with an initial OD of 0.1 (⬛) and 0.5 ().
Fermentation 11 00239 g007
Figure 8. Growth and substrate consumption kinetics of E. coli BL21/pET-15b-Erw_DM in (A) MD with an initial OD of 0.5, including induction times in the mid-exponential phase (Red arrow) and late exponential phase (Green arrow); (B) MDO with an initial OD of 0.5, featuring the induction time in mid-exponential phase (Black arrow).
Fermentation 11 00239 g008aFermentation 11 00239 g008b
Figure 9. Profiles of total L-asparaginase activity of D. dadantii double mutant expressed in E. coli BL21 (DE3) for 5 h post-induction.
Fermentation 11 00239 g009
Figure 10. Profiles of L-asparaginase activity per gram of cell of D. dadantii double mutant expressed in E. coli BL21(DE3) for 5 h post-induction.
Fermentation 11 00239 g010
Figure 11. Temporal consumption profile post-induction of (A) aspartate and (B) arginine by E. coli BL21 (DE3). The graphs depict the nutrient consumption dynamics over time post-induction for the MDO strategy (■) and MD–L.I (▲), revealing the metabolic response of the strain to the addition of a synergistic mixture of arginine/aspartate.
Fermentation 11 00239 g011
Table 1. Different conditions for amino acids and inductors used in recombinant E. coli BL21(DE3) bioreactor experiments.
ConditionsControlSet 1Set 2Set 3
AA’s addition phase-Initial cultureMiddle exponentialFinal exponential
AA’s concentration-1X1X1X
IPTG addition phaseMiddle exponentialMiddle exponentialMiddle exponentialFinal exponential
Table 2. Amino acids tested and their levels to be used in factorial design 25.
VariablesCodeExperimental Values (mM)
Lower (−1)Upper (+1)
Essential amino acids
SerineA2.57.5
GlutamineB2.57.5
ArginineC2.57.5
CysteineD2.57.5
AspartateE2.57.5
Table 3. Conditions used for the central composite rotatable design to the study of arginine, aspartate, and cysteine (α = 1.96).
CodeFactorsRange y Levels
−α−10+1
AArginine (mM)0.12.557.59.9
BAspartate (mM)0.12.557.59.9
CCysteine (mM)0.12.557.59.9
Table 4. Matrix design with its results for the optimization of the CDM using CCRD.
StdRunA:ArginineD:AspartateE:CysteineTotal Activity
mMmMmMUT
1152.52.52.5288
2147.52.52.52165
3182.57.52.51818
4197.57.52.53044
5112.52.57.5207
677.52.57.527
7172.57.57.550
8137.57.57.557
9200.155230
1099.955786
11350.15270
12659.95811
135550.13228
1410559.956
151555686
1616555917
178555607
182555754
194555840
2012555874
Table 5. Full factorial design 25 and response (L-ASNase activity) for the choice of amino acids.
StdRunA:SerineB:GlutamineC:ArginineD:CysteineE:AspartateTotal Activity
mMmMmMmMmMUT
111−1.000−1.000−1.000−1.000−1.0001318
2241.000−1.000−1.000−1.000−1.0002272
328−1.0001.000−1.000−1.000−1.0001526
4131.0001.000−1.000−1.000−1.0002063
55−1.000−1.0001.000−1.000−1.00049
611.000−1.0001.000−1.000−1.0001778
731−1.0001.0001.000−1.000−1.0001201
8161.0001.0001.000−1.000−1.0001640
915−1.000−1.000−1.0001.000−1.0001074
1031.000−1.000−1.0001.000−1.0001129
118−1.0001.000−1.0001.000−1.000562
12291.0001.000−1.0001.000−1.000913
1326−1.000−1.0001.0001.000−1.000376
14171.000−1.0001.0001.000−1.000426
1523−1.0001.0001.0001.000−1.000426
16101.0001.0001.0001.000−1.000609
1727−1.000−1.000−1.000−1.0001.0001949
18251.000−1.000−1.000−1.0001.0001993
1932−1.0001.000−1.000−1.0001.0002328
20361.0001.000−1.000−1.0001.0002284
216−1.000−1.0001.000−1.0001.0002649
22201.000−1.0001.000−1.0001.0002614
2333−1.0001.0001.000−1.0001.0003260
2491.0001.0001.000−1.0001.0004131
2519−1.000−1.000−1.0001.0001.000917
26211.000−1.000−1.0001.0001.000421
2718−1.0001.000−1.0001.0001.000473
28301.0001.000−1.0001.0001.000824
2912−1.000−1.0001.0001.0001.000522
30351.000−1.0001.0001.0001.000108
314−1.0001.0001.0001.0001.000991
3271.0001.0001.0001.0001.000845
33340.0000.0000.0000.0000.000952
3420.0000.0000.0000.0000.000944
35140.0000.0000.0000.0000.000745
36220.0000.0000.0000.0000.000743
Table 6. ANOVA analysis of amino acids effect on total activity of D. dadantii L-ASNase DM obtained from 25 full factorial design.
Sum of SquaresdfMean SquareF-Valuep-Value
Model2.948 × 107319.511 × 10568.530.0025 b
A-Serine6.128 × 10516.128 × 10544.160.0069 b
B-Glutamine6.269 × 10516.269 × 10545.170.0067 b
C-Arginine5551.2515551.250.40000.5720 a
D-Cysteine1.574 × 10711.574 × 1071133.99<0.0001 b
E-Aspartic Acid2.500 × 10612.500 × 106180.100.0009 b
AB13,442.20113,442.200.96850.3976 a
AC26,771.85126,771.851.930.2590 a
AD6.504 × 10516.504 × 10546.870.0064 b
AE5.424 × 10515.424 × 10539.080.0083 b
BC6.840 × 10516.840 × 10549.290.0059 b
BD3.082 × 10513.082 × 10522.210.0181 b
BE3.708 × 10513.708 × 10526.720.0141 b
CD4.041 × 10514.041 × 10529.120.0125 b
CE2.143 × 10612.143 × 106154.410.0011 b
DE2.985 × 10612.985 × 106215.110.0007 b
ABC12,123.11112,123.110.87350.4189 a
ABD1.849 × 10511.849 × 10513.320.0355 b
ABE3.226 × 10513.226 × 10523.250.0170 b
ACD1.376 × 10511.376 × 1059.920.0513 a
ACE209.981209.980.01510.9099 a
ADE68,040.94168,040.944.900.1137 a
BCD2205.9312205.930.15890.7168 a
BCE16,700.86116,700.861.200.3528 a
BDE500.171500.170.03600.8616 a
CDE7.627 × 10517.627 × 10554.950.0051 b
ABCD23,275.35123,275.351.680.2860 a
ABCE65,651.01165,651.014.730.1179 a
ABDE1.059 × 10511.059 × 1057.630.0700 a
ACDE5019.3015019.300.36170.5900 a
BCDE759.351759.350.05470.8301 a
ABCDE1.630 × 10511.630 × 10511.740.0416 b
Curvature0.00000
Curvature9.554 × 10519.554 × 10568.840.0037
Error41,636.36313,878.79
Cor Total3.048 × 10735
a not significant; p > 0.05. b significant; p < 0.05. R2 = 99.86%.
Table 7. ANOVA analysis of the production of double mutant L-asparaginase from D. dadantii using arginine, aspartate, and cysteine according to the CCRD.
Sum of SquaresdfMean SquareF-Valuep-Value
Model4282.169475.828.1<0.0001 b
A-Arginine218.921218.9212.930.0049 b
B-Aspartate178.731178.7310.560.0087 a
C-Cysteine3192.4413192.44188.55<0.0001 b
AB6.8316.830.40340.5396 a
AC323.261323.2619.090.0014 b
BC193.021193.0211.40.0070 b
A274.73174.734.410.0620 a
B257.05157.053.370.0963 a
C221.81121.811.290.2828 a
Residual169.311016.93
Lack of Fit146529.26.260.0327 b
Pure Error23.3154.66
Cor Total4451.4719
a not significant; p > 0.05, b significant; p < 0.05, R2 = 96.2%, R2Adj= 92.77%.
Table 8. Kinetic growth parameters of E. coli BL21 (DE3) in LB, CDM, and CDM-S media at 37 °C and 250 rpm, on orbital shaker.
Culture MediumYxsµx (h−1)Exponential Phasetg (h)Xmax
(g L−1)
Ypxqp (h−1)
CDM0.8220.5020.5 h ≤ t ≤ 6 h1.3811.1491683.77275.46
CDM-S1.160.740.5 h ≤ t ≤ 5 h0.9371.9613,891.273600.62
LB-1.230.5 h ≤ t ≤ 3 h0.5641.09--
µx: growth rate; tg: generation time; X: biomass; Yxs: yield of glucose in biomass; Ypx: yield of biomass in production; qp: specific product formation rate.
Table 9. Kinetic growth parameters of E. coli BL21 (DE3) in defined medium (MD) at different initial biomass concentrations (OD600).
Kinetic ParametersMD ODinitial 0.1MD ODinitial 0.5Laboratory Data
(OD 0.1)
mx (h−1)0.61570.7070.7
td (h)1.1260.980.99
YX/s (gg−1)0.40.4480.52
Xmáx (g L−1)18.39718.98614
Table 10. Kinetic growth parameters of E. coli BL21 (DE3) in optimized defined medium (MDO) at different initial biomass concentrations (OD600).
Kinetic ParametersMDO ODinitial 0.1MDO ODinitial 0.5
mx (h−1)0.7550.832
tg (h)0.9180.835
YX/s (gg−1)0.7030.712
Xmáx (g L−1)19.3619.75
Table 11. Summary of parameters for different bioreactor cultivation strategies for the production of L-asparaginase by D. dadantii double mutant expressed in E. coli BL21(DE3).
Culture StrategieXmax (g L−1)Total Activity (U L−1)Activity Per Dry Mass (U/gcell)Time of Maximum Activity (h)U/gglucoseQp (U/L.h)
MD11.511,063.132.0711
(5 h post-induction)
402.31005.74
MDO11.515,147.1545.816.5
(1 h post-induction)
550.82330.33
MD–M.I11.519,836.436011
(5 h post-induction)
721.321803.31
MD–L.I1826,032.9632.1412
(5 h post-induction)
946.652169.41
Xmax: Maximum Biomass; U/gglucose: activity per gram of glucose; Qp: specific product formation rate.
Disclaimer/Publisher’s Note: The statements, opinions and data contained in all publications are solely those of the individual author(s) and contributor(s) and not of MDPI and/or the editor(s). MDPI and/or the editor(s) disclaim responsibility for any injury to people or property resulting from any ideas, methods, instructions or products referred to in the content.

