
Clustering in Wineinformatics with Attribute Selection to Increase Uniqueness of Clusters

Abstract
1. Introduction
2. Bordeaux Dataset
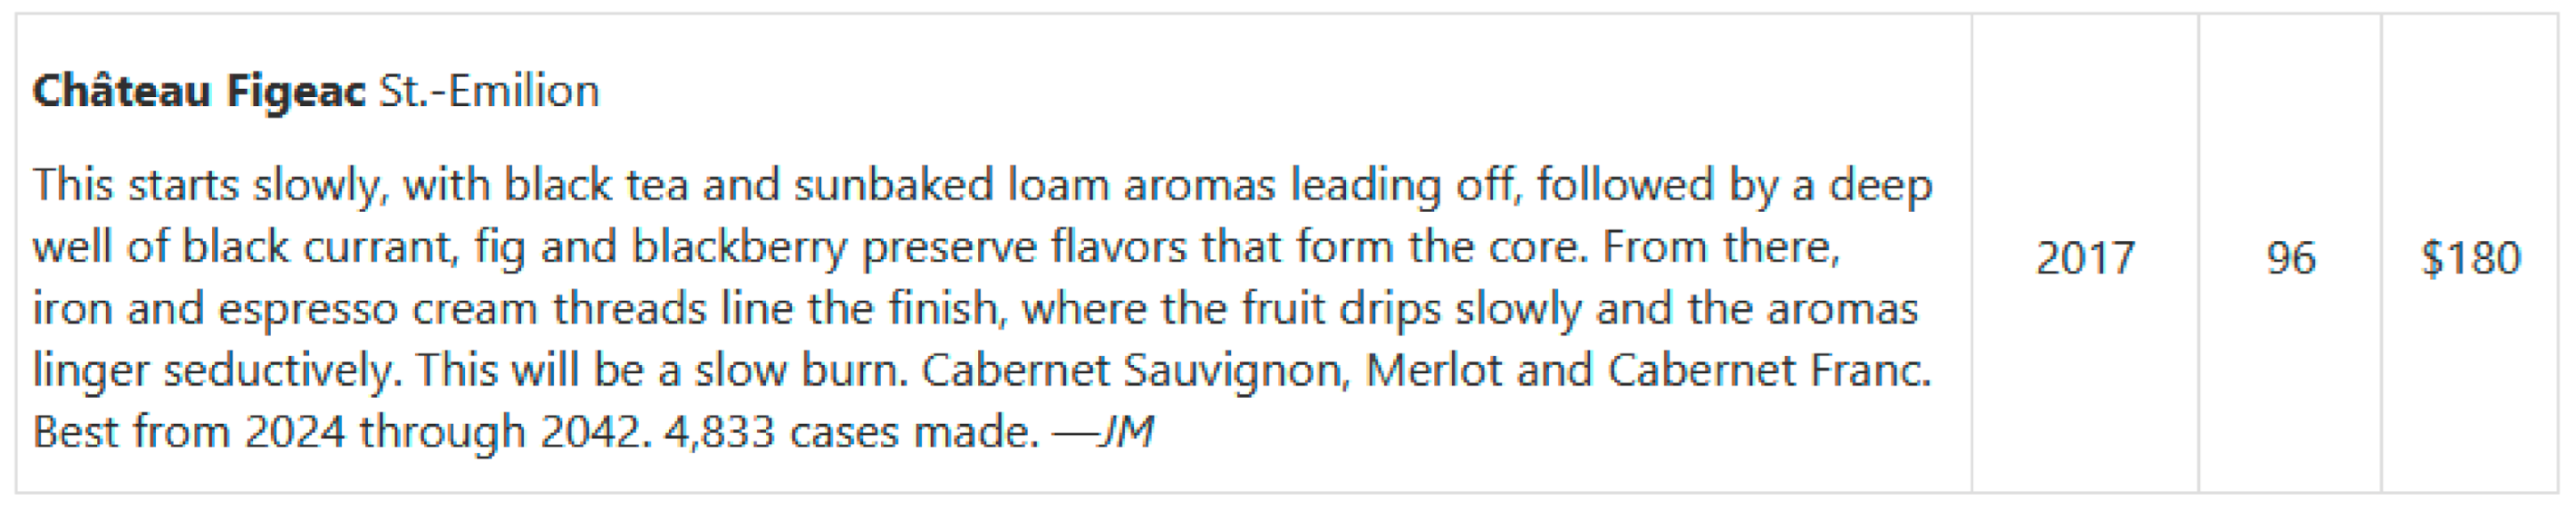
2.1. Wine Spectator
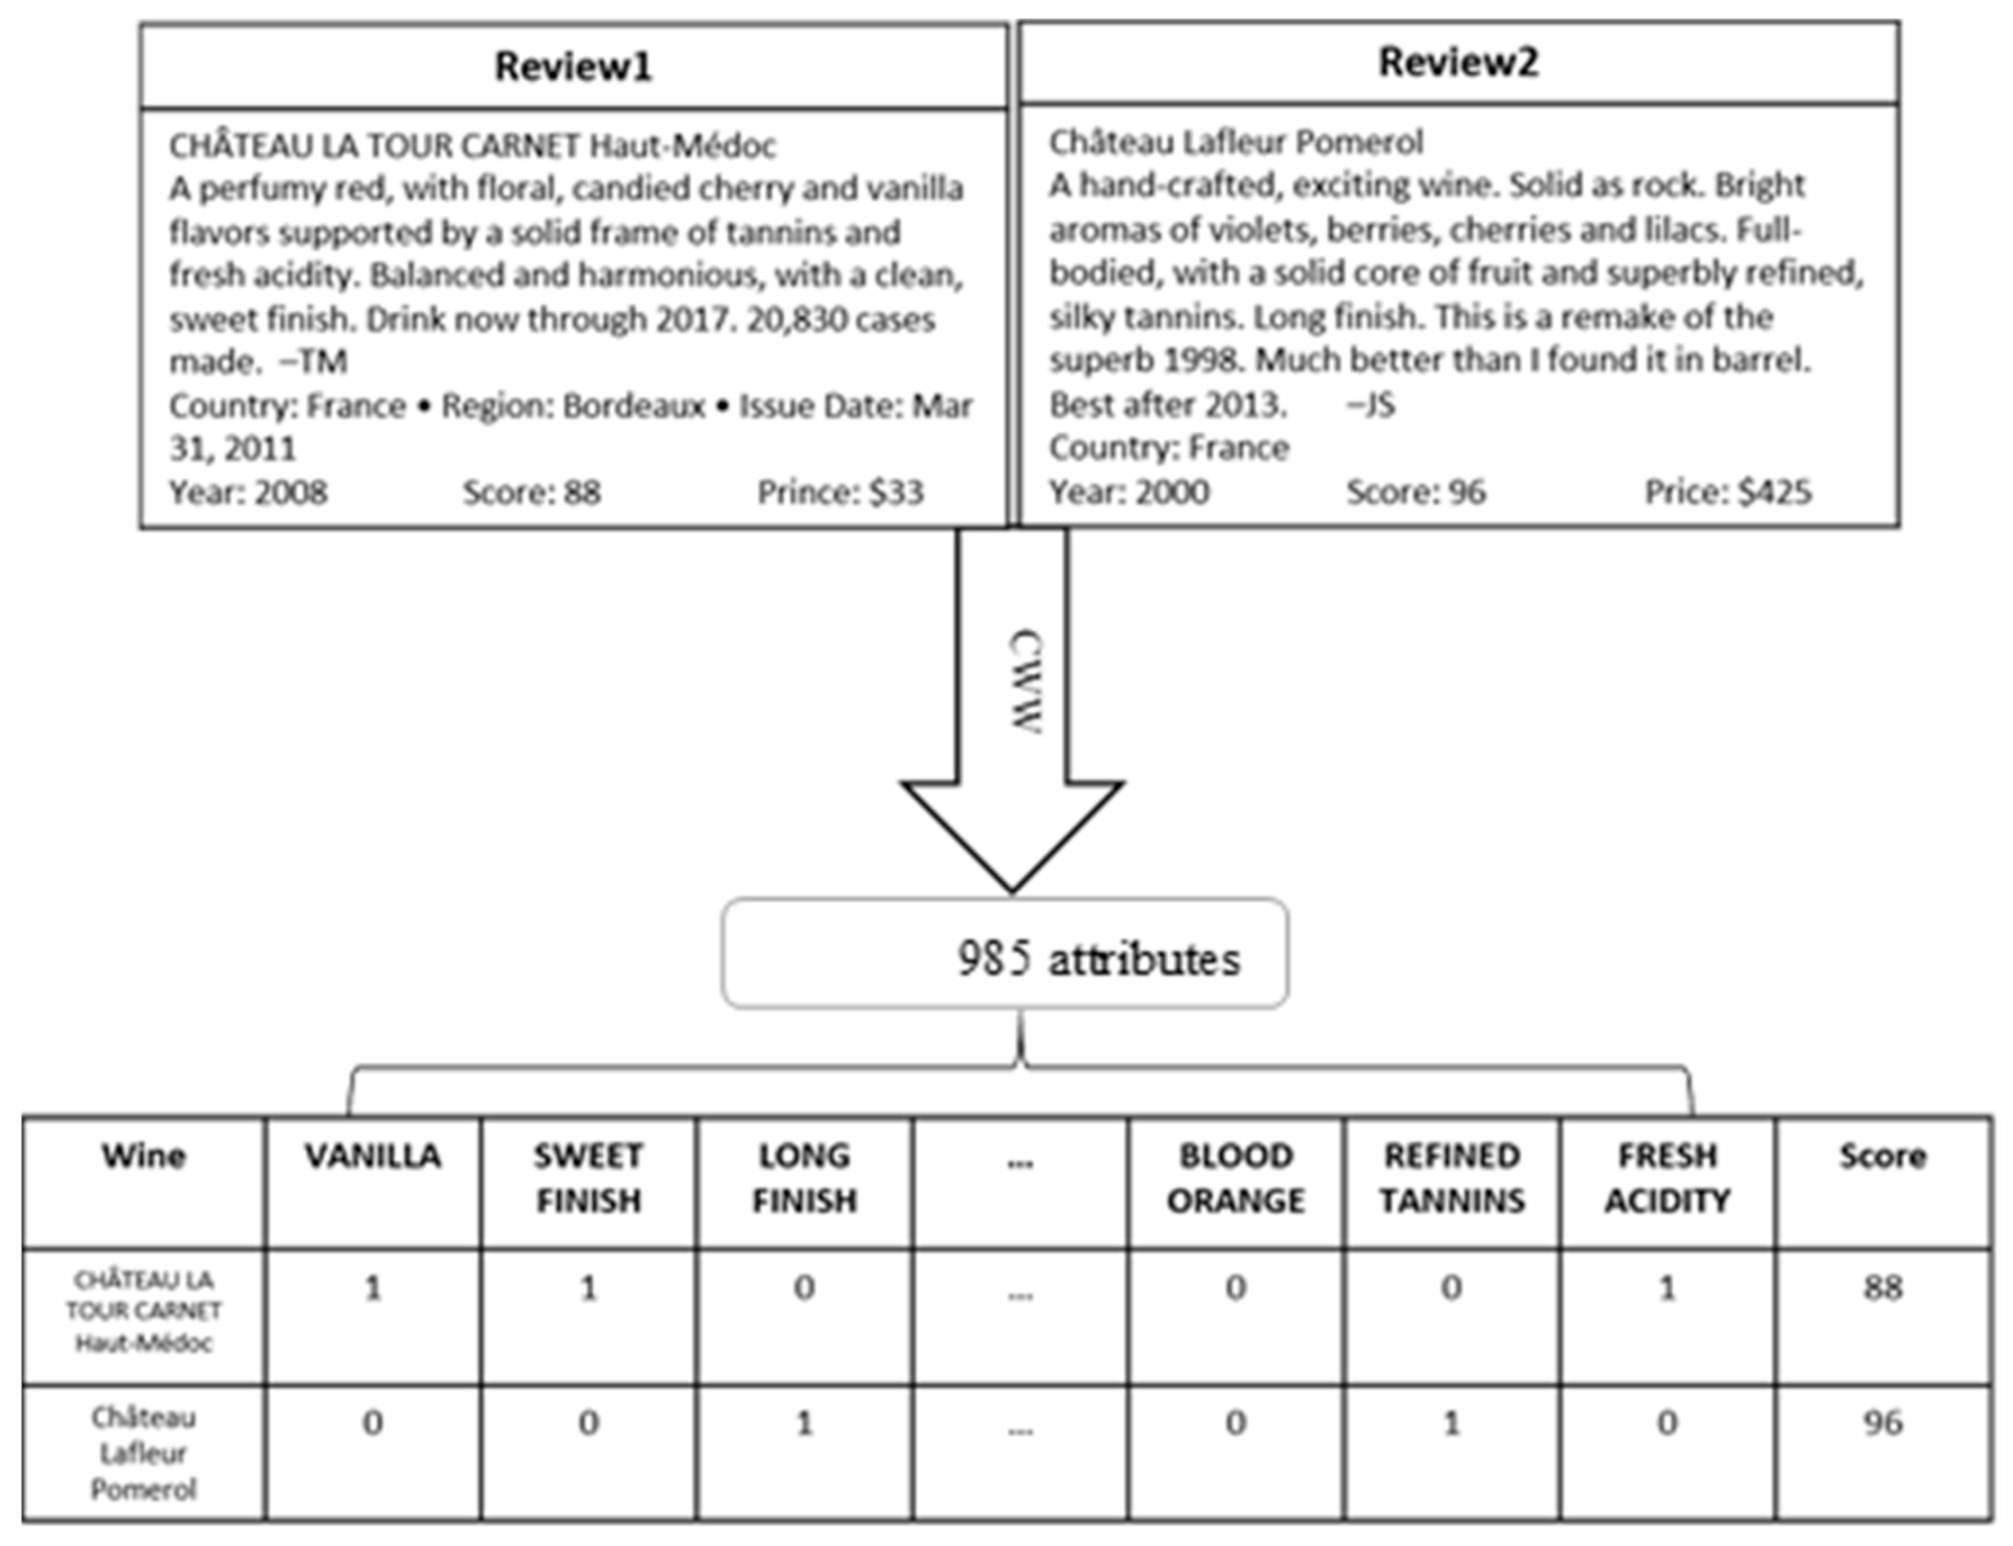
2.2. Bordeaux Dataset
3. Methods
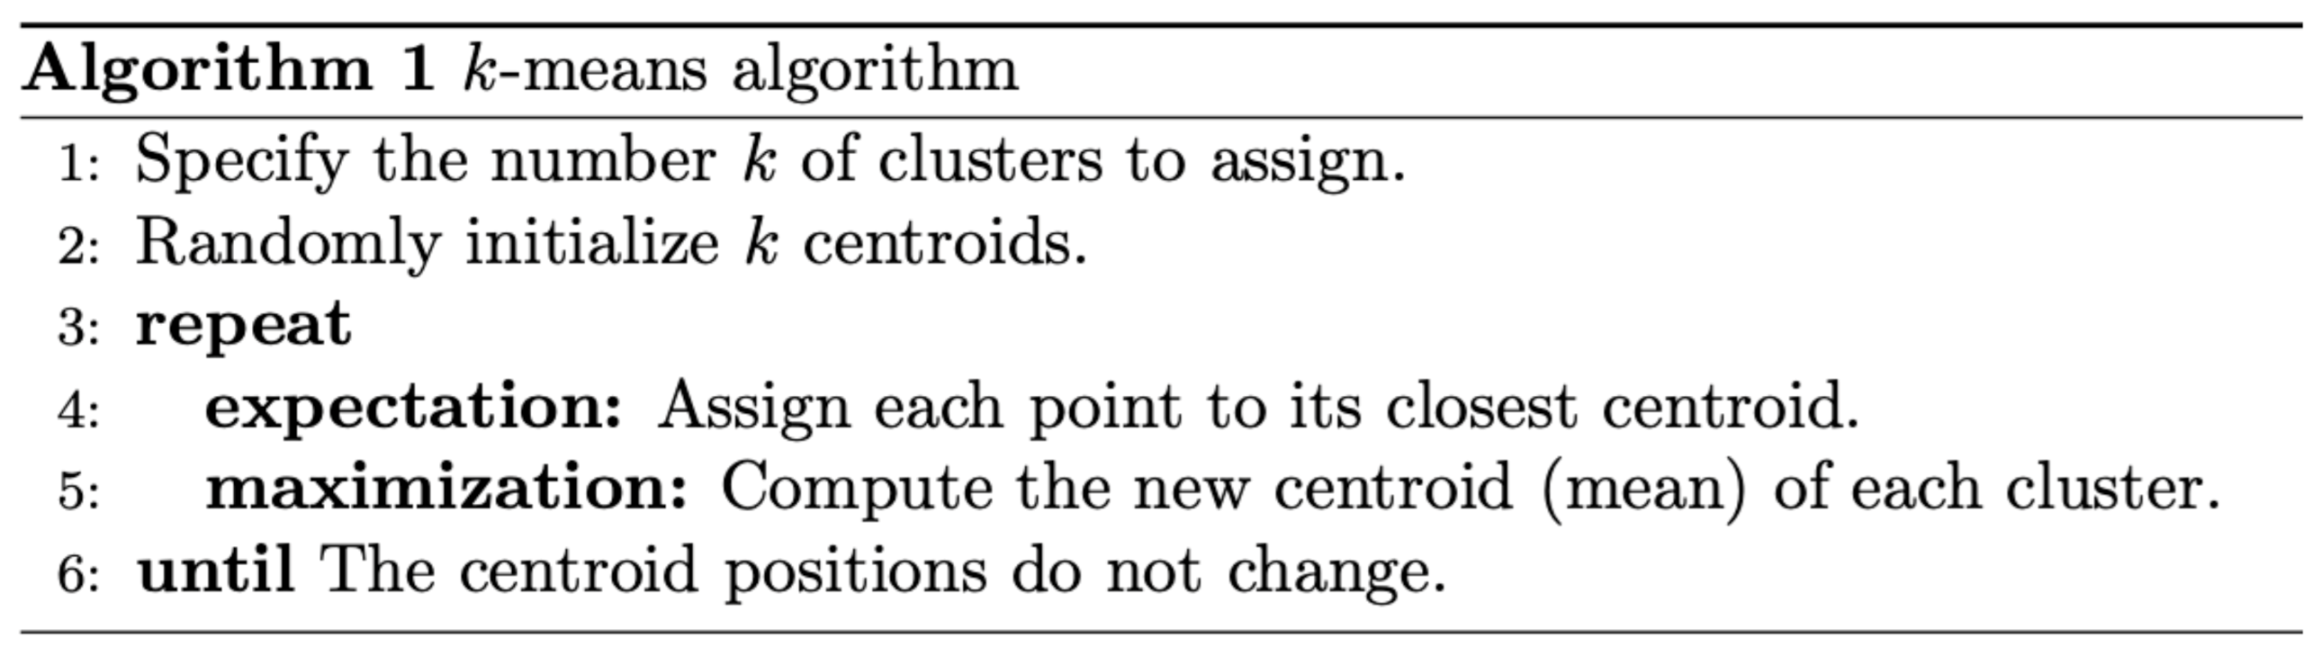
3.1. K-Means Clustering
3.2. Filtering Process
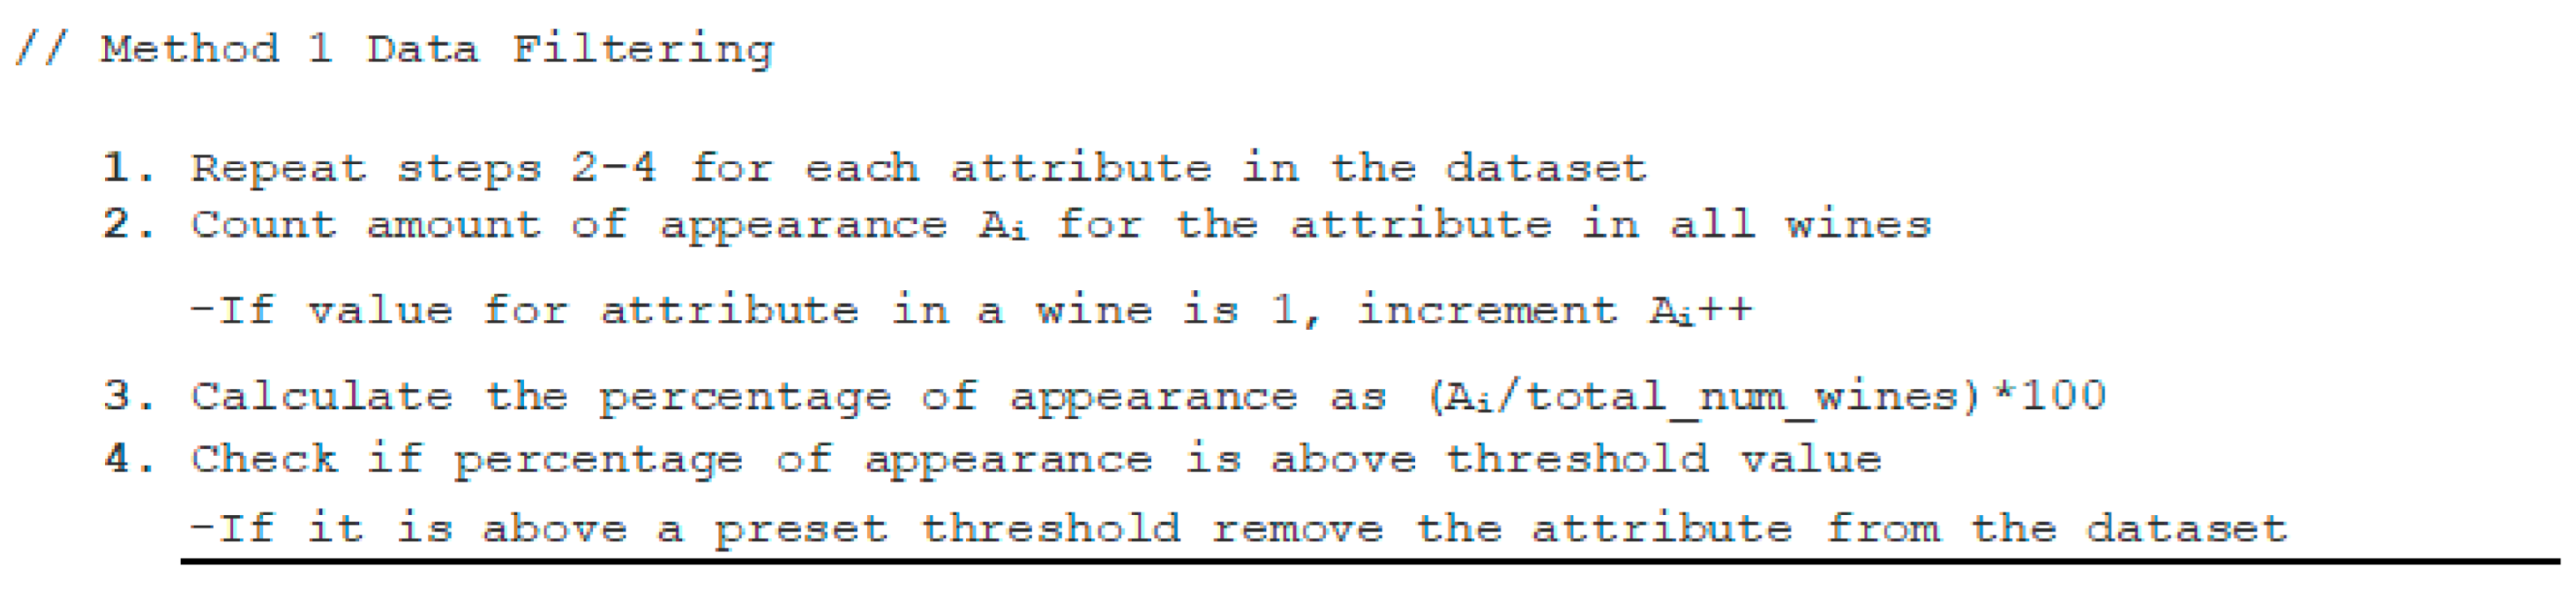
3.2.1. Filtering Method 1: Attributes Filtration
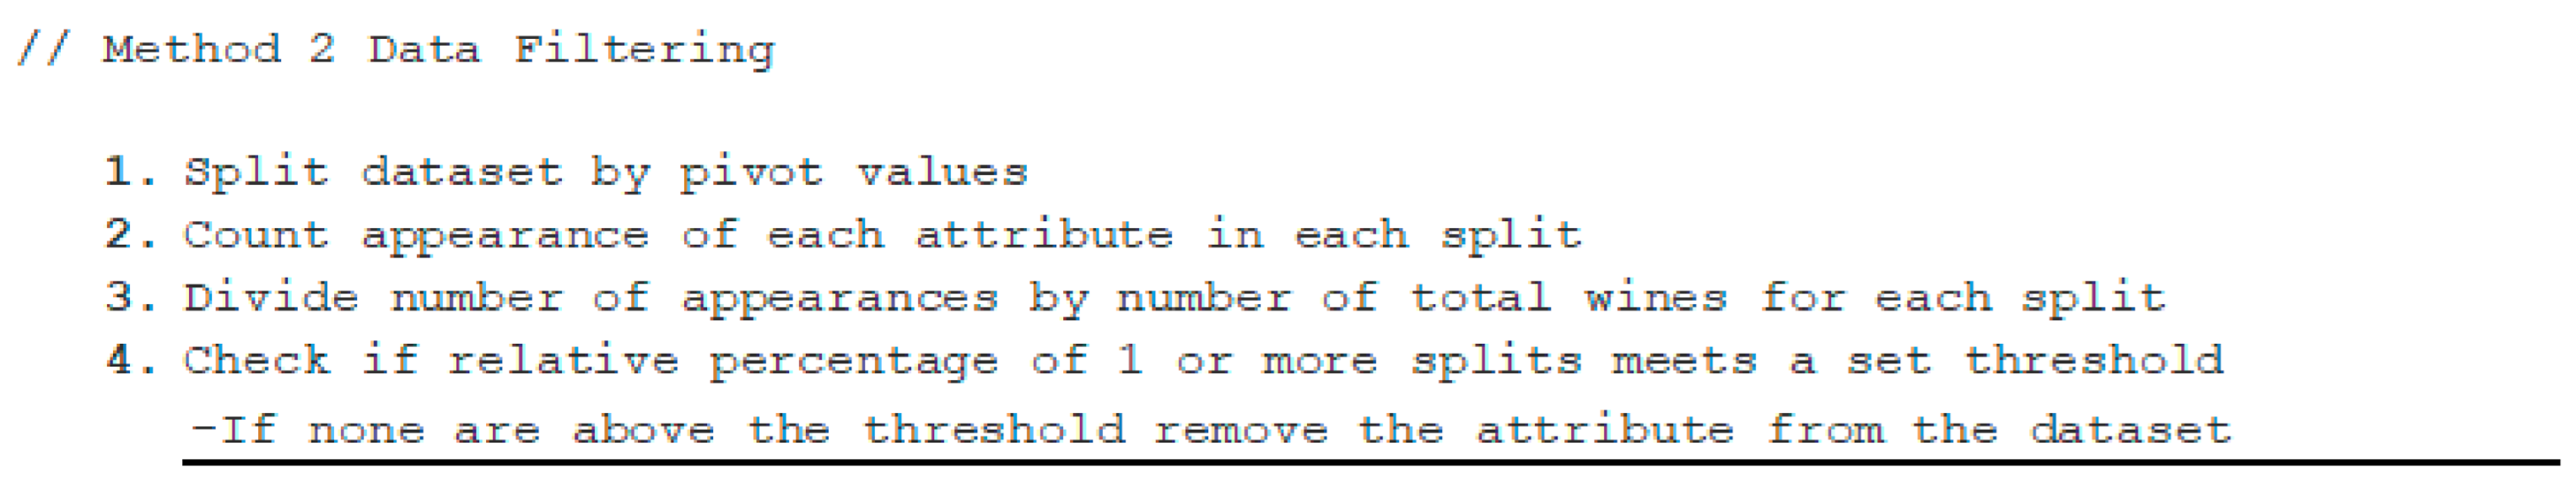
3.2.2. Filtering Method 2: Wine Grade Filtration + Attributes Filtration
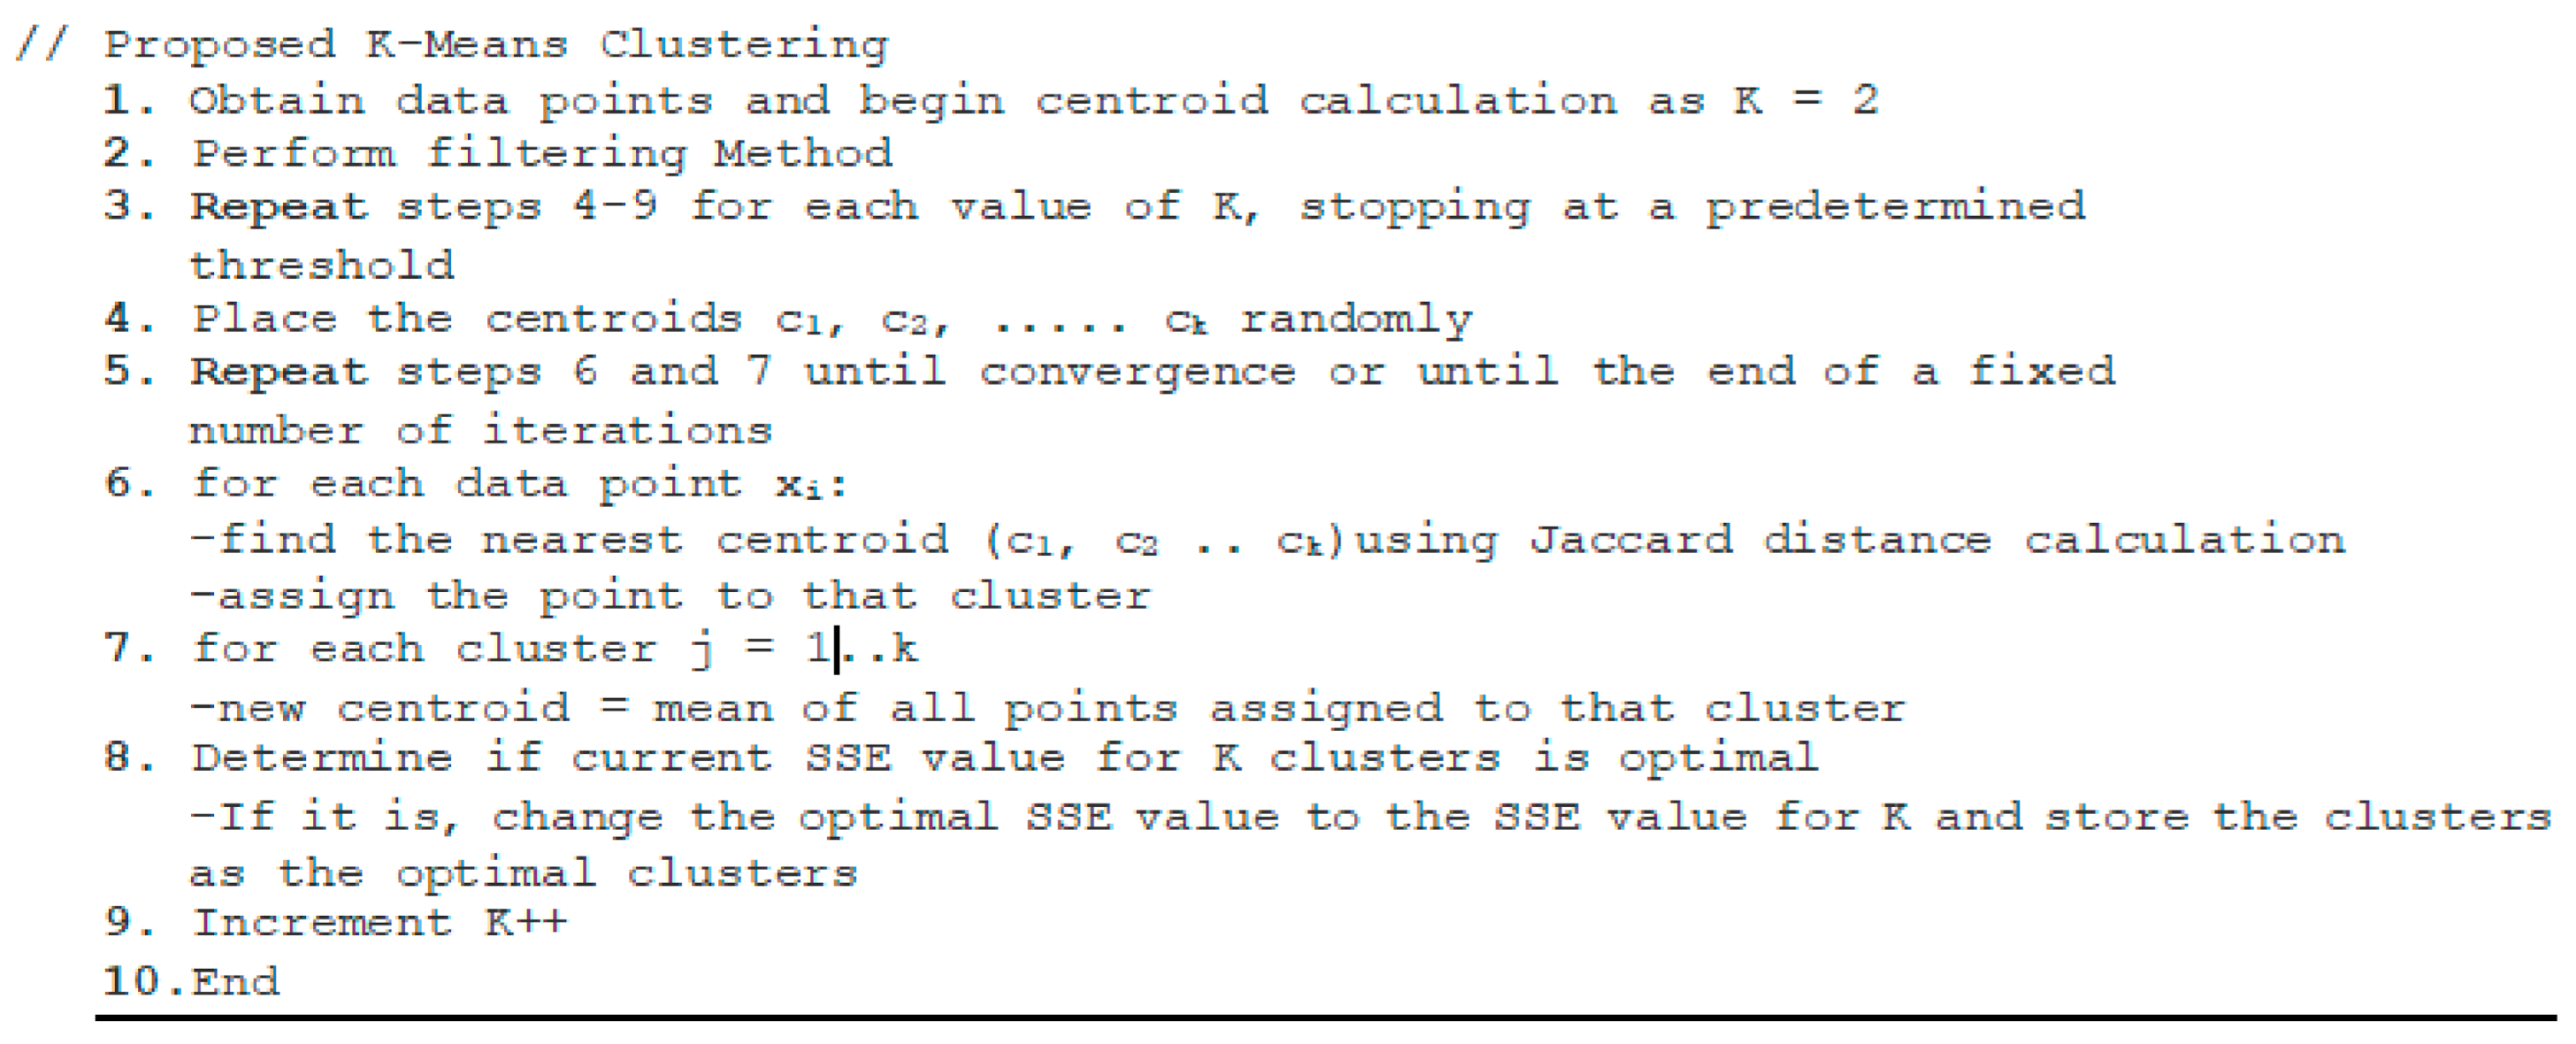
3.3. Proposed K-Means Clustering with Optimal K Search and Filtration Process
4. Results
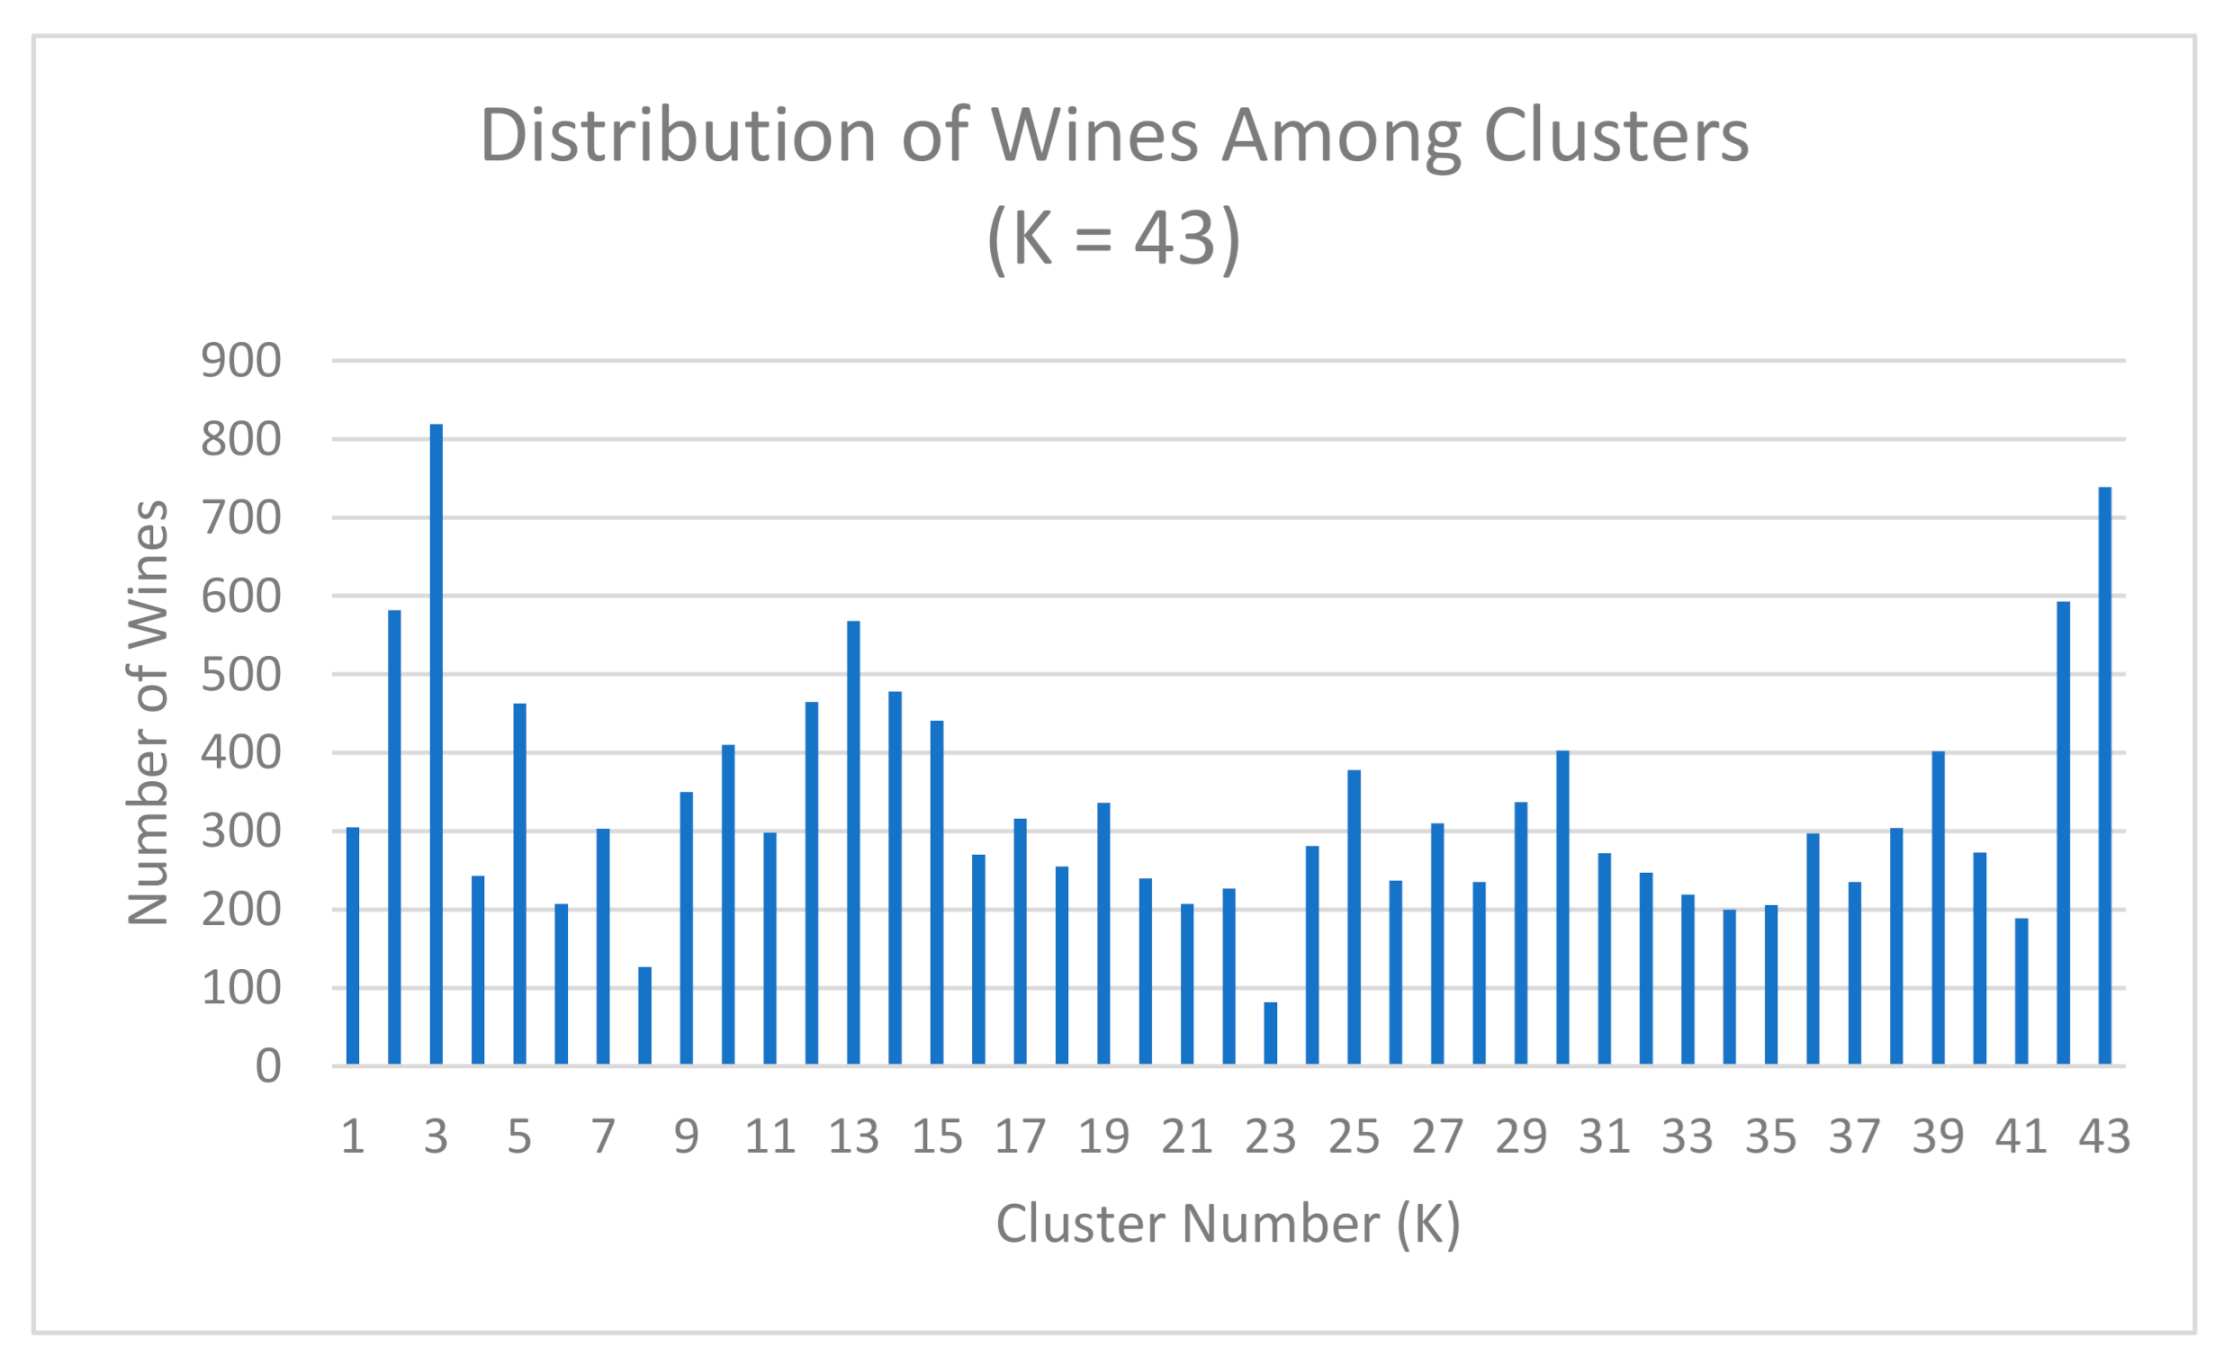
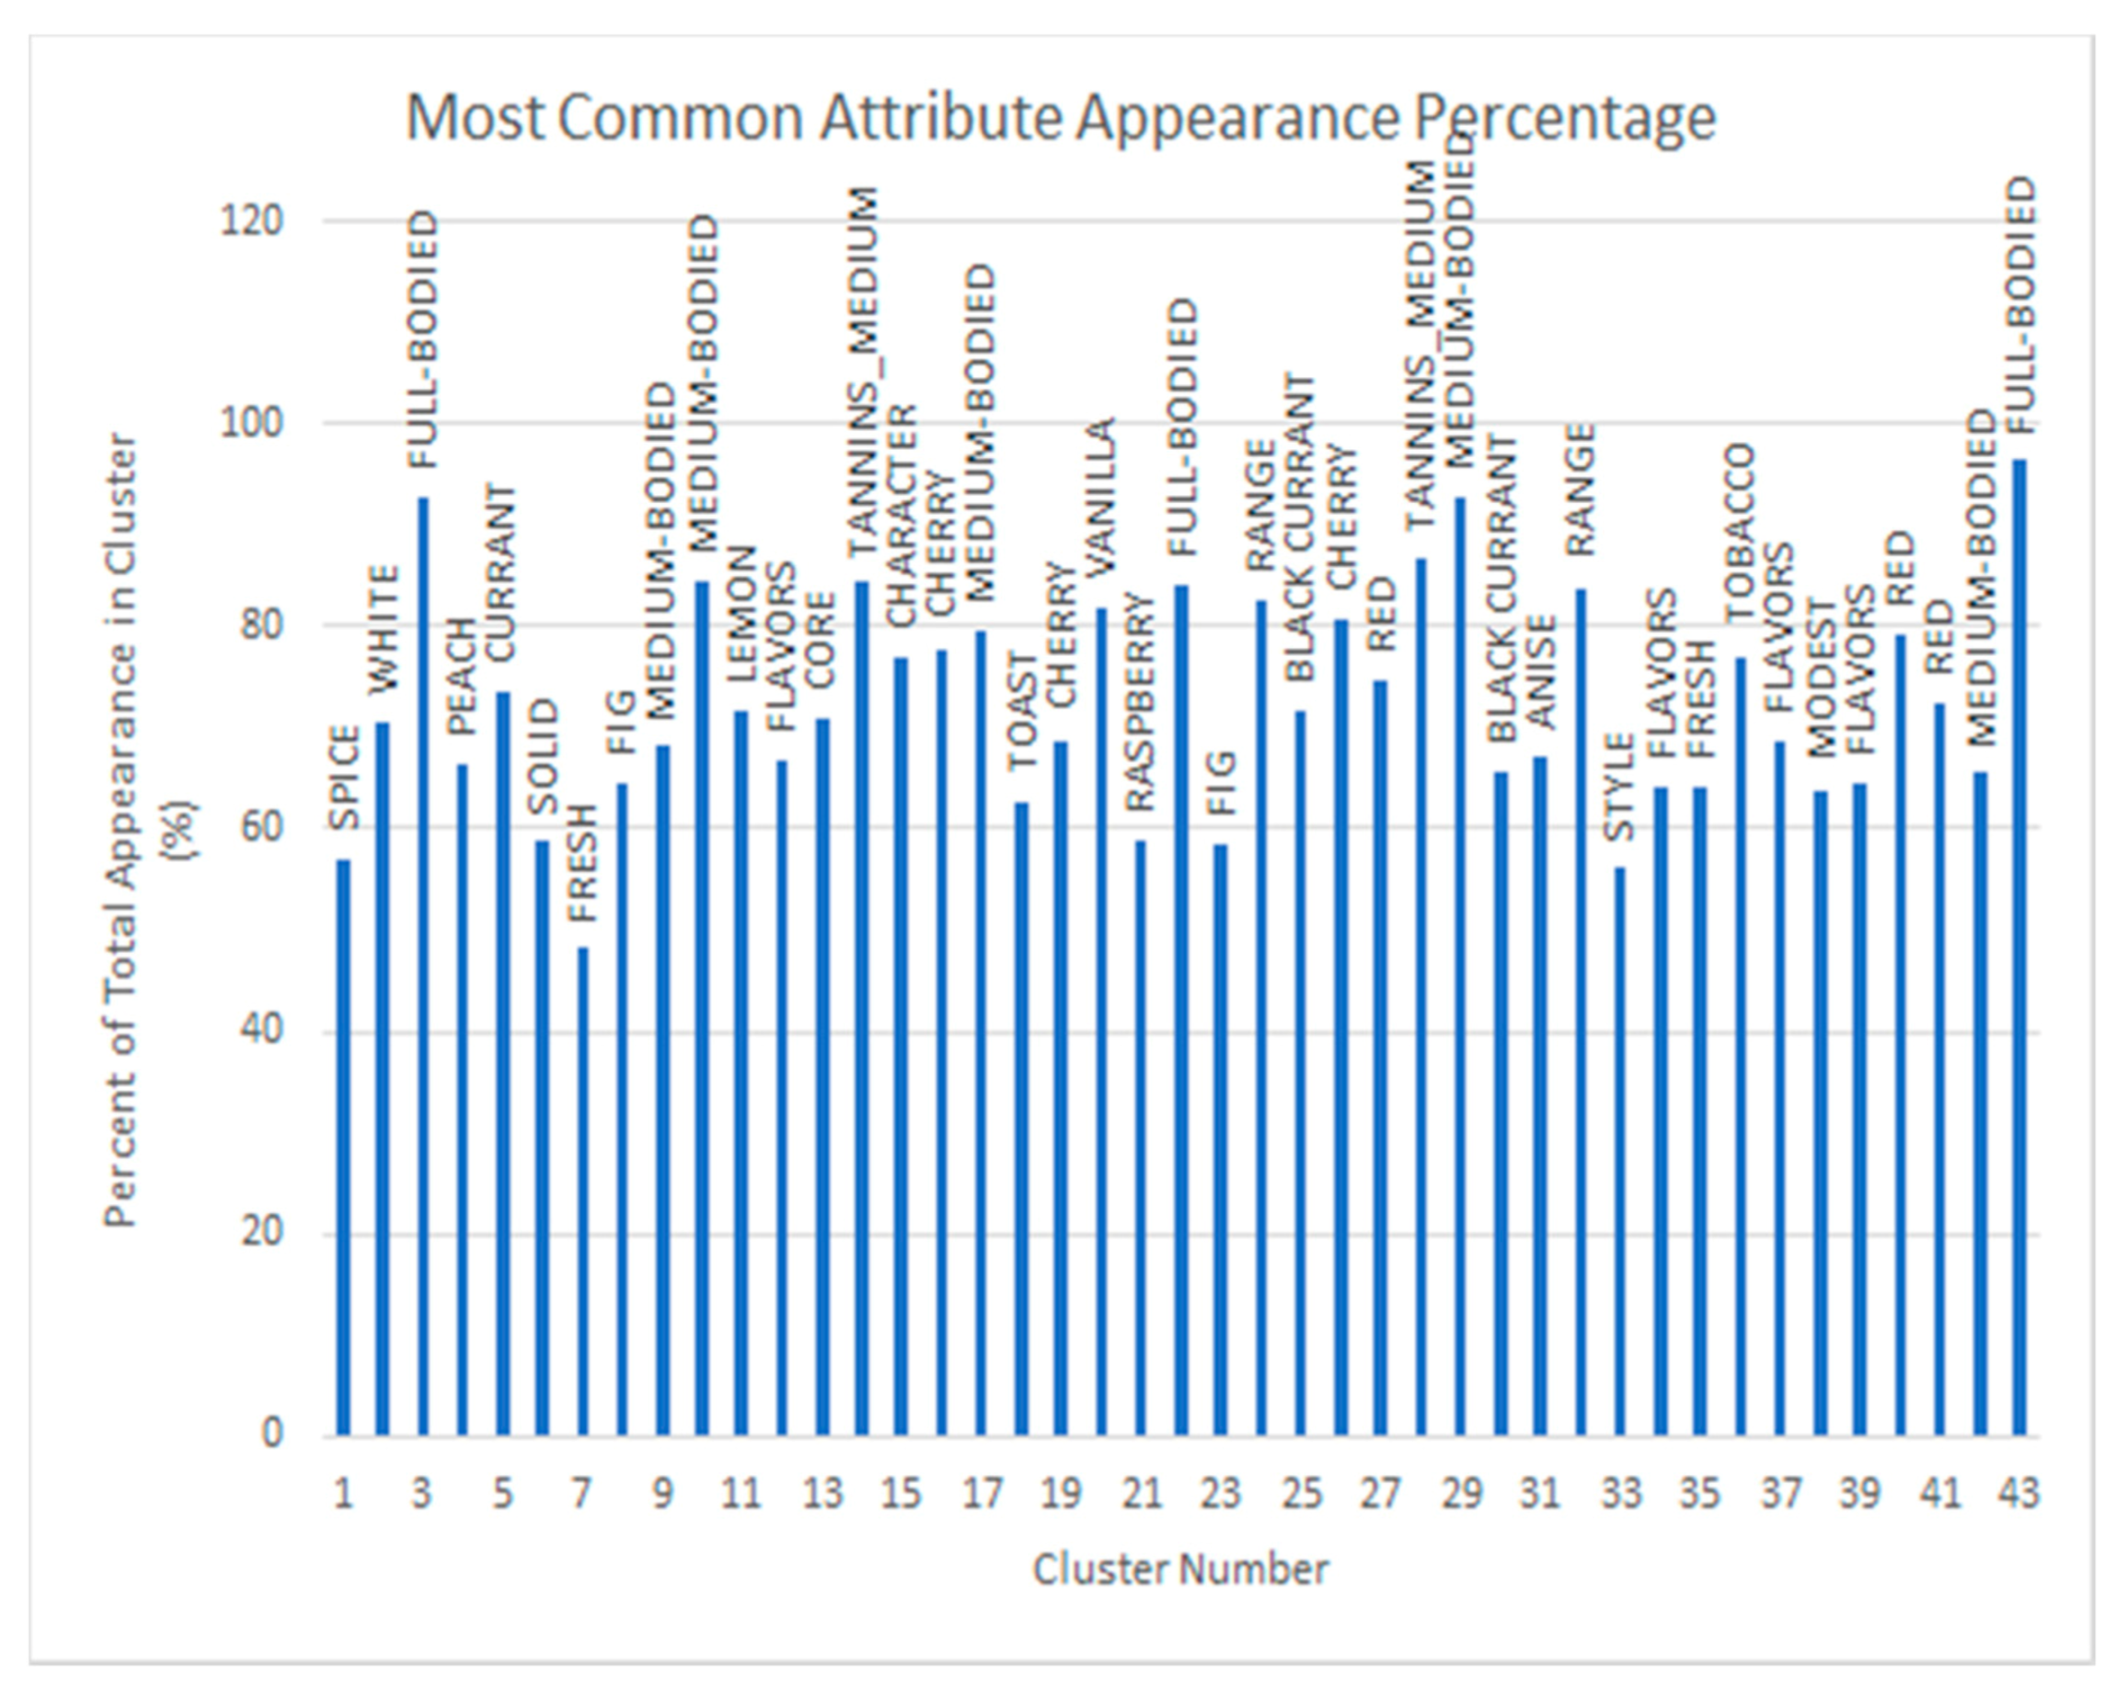
4.1. Clustering with Attributes Filtration
4.2. Clustering with Wine Grade Filtration + Attributes Filtration
5. Conclusions
Author Contributions
Funding
Institutional Review Board Statement
Informed Consent Statement
Data Availability Statement
Conflicts of Interest
References
- Caruana, R.; Niculescu-Mizil, A. An Empirical Comparison of Supervised Learning Algorithms. In Proceedings of the 23rd International Conference on Machine Learning, ICML ’06, New York, NY, USA, 25–29 June 2006; pp. 161–168. [Google Scholar]
- Hastie, T.; Tibshirani, R.; Friedman, J. Unsupervised Learning; Springer: New York, NY, USA, 2009; pp. 485–585. [Google Scholar]
- Zhu, X.; Goldberg, A.B. Introduction to semi-supervised learning. In Synthesis Lectures on Artificial Intelligence and Machine Learning; Morgan and Claypool Publishers: San Rafael, CA, USA, 2009; Volume 3, pp. 1–130. [Google Scholar]
- Levine, S. Reinforcement learning and control as probabilistic inference: Tutorial and review. arXiv 2018, arXiv:1805.00909. Available online: https://arxiv.org/abs/1805.00909 (accessed on 1 January 2021).
- Karlsson, P. World Wine Production Reaches Record Level in 2018, Consumption is Stable. Available online: https://www.bkwine.com/features/more/world-wine-production-reaches-record-level-2018-consumption-stable/ (accessed on 14 April 2019).
- Forbes. Global Wine Production 2019 is Returning to ‘Normal’, Says Pau Roca of the OIV. Available online: https://www.forbes.com/sites/karlsson/2019/11/03/global-wine-production-2019-of-263-mhl-is-a-return-to-normal-says-pau-roca-of-the-oiv/?sh=7a97ff5c745b (accessed on 21 November 2020).
- Han, J.; Pei, J.; Kamber, M. Data Mining: Concepts and Techniques; Elsevier: Amsterdam, The Netherlands, 2011. [Google Scholar]
- Di Vita, G.; Chinnici, G.; D’Amico, M. Clustering attitudes and behaviours of Italian wine consumers. Calitatea 2014, 15, 54. [Google Scholar]
- Hall, D. Exploring wine knowledge, aesthetics and ephemerality: Clustering consumers. Int. J. Wine Bus. Res. 2016, 28, 134–153. [Google Scholar] [CrossRef]
- Vázquez-Fresno, R.; Llorach, R.; Perera, A.; Mandal, R.; Feliz, M.; Tinahones, F.J.; Wishart, D.S.; Andres-Lacueva, C. Clinical phenotype clustering in cardiovascular risk patients for the identification of responsive metabotypes after red wine polyphenol intake. J. Nutr. Biochem. 2016, 28, 114–120. [Google Scholar] [CrossRef] [PubMed]
- Esteban-Fernández, A.; Ibañez, C.; Simó, C.; Bartolomé, B.; Arribas, V.M. Metabolome-based clustering after moderate wine consumption. OENO One 2020, 54, 455–467. [Google Scholar] [CrossRef]
- Gelbard, R.; Goldman, O.; Spiegler, I. Investigating diversity of clustering methods: An empirical comparison. Data Knowl. Eng. 2007, 63, 155–166. [Google Scholar] [CrossRef]
- Venkataramana, B.; Padmasree, L.; Rao, M.S.; Rekha, D.; Ganesan, G. A Study of Fuzzy and Non-fuzzy clustering algorithms on Wine Data. Commun. Adv. Comput. Sci. Appl. 2017, 2017, 129–137. [Google Scholar] [CrossRef][Green Version]
- Chen, B.; Velchev, V.; Palmer, J.; Atkison, T. Wineinformatics: A Quantitative Analysis of Wine Reviewers. Fermentation 2018, 4, 82. [Google Scholar] [CrossRef]
- Palmer, J.; Chen, B. Wineinformatics: Regression on the Grade and Price of Wines through Their Sensory Attributes. Fermentation 2018, 4, 84. [Google Scholar] [CrossRef]
- Cortez, P.; Cerdeira, A.; Almeida, F.; Matos, T.; Reis, J. Modeling wine preferences by data mining from physicochemical properties. Decis. Support Syst. 2009, 47, 547–553. [Google Scholar] [CrossRef]
- Ting, S.L.; Tse, Y.K.; Ho, G.T.S.; Chung, S.H.; Pang, G. Mining logistics data to assure the quality in a sustainable food supply chain: A case in the red wine industry. Int. J. Product. Econom. 2014, 152, 200–209. [Google Scholar] [CrossRef]
- Ishibuchi, H.; Nakashima, T.; Nii, M. Classification and Modeling with Linguistic Information Granules: Advanced Approaches to Linguistic Data Mining; Springer: Berlin/Heidelberg, Germany, 2005. [Google Scholar]
- Urtubia, A.; Pérez-Correa, J.R.; Soto, A.; Pszczólkowski, P.; Pérez-Correa, J.R. Using data mining techniques to predict industrial wine problem fermentations. Food Control 2007, 18, 1512–1517. [Google Scholar] [CrossRef]
- Edelmann, A.; Diewok, J.; Schuster, K.C.; Lendl, B. Rapid method for the discrimination of red wine cultivars based on mid-infrared spectroscopy of phenolic wine extracts. J. Agric. Food Chem. 2001, 49, 1139–1145. [Google Scholar] [CrossRef]
- Chen, B.; Rhodes, C.; Crawford, A.; Hambuchen, L. Wineinformatics: Applying Data Mining on Wine Sensory Reviews Processed by the Computational Wine Wheel. In Proceedings of the 2014 IEEE International Conference on Data Mining Workshop, Shenzhen, China, 14 December 2014; pp. 142–149. [Google Scholar]
- Chen, B.; Rhodes, C.; Yu, A.; Velchev, V. The Computational Wine Wheel 2.0 and the TriMax Triclustering in Wineinformatics. In Advances in Data Mining. Applications and Theoretical Aspects, Proceedings of the Industrial Conference on Data Mining, New York, NY, USA, 18–20 July 2016; Springer: Cham, Switzerland, 2016; pp. 223–238. [Google Scholar]
- Ducard, E. A Complete History of Bordeaux Wine, Tanglewood Wines Limited. 2018. Available online: https://tanglewoodwine.co.uk/blogs/news/complete-history-bordeaux-wine (accessed on 21 November 2020).
- Combris, P.; Lecocq, S.; Visser, M. Estimation of a hedonic price equation for Bordeaux wine: Does quality matter? Econ. J. 1997, 107, 389–402. [Google Scholar] [CrossRef]
- Cardebat, J.M.; Figuet, J. What explains Bordeaux wine prices? Appl. Econ. Lett. 2004, 11, 293–296. [Google Scholar] [CrossRef]
- Ashenfelter, O. Predicting the quality and prices of Bordeaux wine. Econ. J. 2008, 118, F174–F184. [Google Scholar] [CrossRef]
- Shanmuganathan, S.; Sallis, P.; Narayanan, A. Data Mining Techniques for Modelling Seasonal Climate Effects on Grapevine Yield and Wine Quality. In Proceedings of the 2010 2nd International Conference on Computational Intelligence, Communication Systems and Networks, Liverpool, UK, 28–30 July 2010; pp. 84–89. [Google Scholar]
- Noy, F.N.; Sintek, M.; Decker, S.; Crubézy, M.; Fergerson, R.W.; Musen, M.A. Creating semantic web contents with protege-2000. IEEE Intell. Syst. 2001, 16, 60–71. [Google Scholar] [CrossRef]
- Noy, F.N.; McGuinness, D.L. Ontology Development 101: A Guide to Creating Your First Ontology; Technical Report KSL-01-05 and Stanford Medical Informatics Technical Report SMI-2001-0880; Stanford Knowledge Systems Laboratory: Stanford, CA, USA, 2001. [Google Scholar]
- Quandt, R.E. A note on a test for the sum of rank sums. J. Wine Econ. 2007, 2, 98–102. [Google Scholar] [CrossRef]
- Ashton, R.H. Improving experts’ wine quality judgments: Two heads are better than one. J. Wine Econ. 2011, 6, 135–159. [Google Scholar] [CrossRef]
- Ashton, R.H. Reliability and consensus of experienced wine judges: Expertise within and between? J. Wine Econ. 2012, 7, 70–87. [Google Scholar] [CrossRef]
- Bodington, J.C. Evaluating wine-tasting results and randomness with a mixture of rank preference models. J. Wine Econ. 2015, 10, 31–46. [Google Scholar] [CrossRef]
- Dong, Z.; Guo, X.; Rajana, S.; Chen, B. Understanding 21st Century Bordeaux Wines from Wine Reviews Using Naïve Bayes Classifier. Beverages 2020, 6, 5. [Google Scholar] [CrossRef]
- Chen, B. Wineinformatics: 21st Century Bordeaux Wines Dataset. IEEE Dataport. 2020. Available online: https://ieee-dataport.org/open-access/wineinformatics-21st-century-bordeaux-wines-dataset (accessed on 1 January 2021).
- Chen, B.; Velchev, V.; Nicholson, B.; Garrison, J.; Iwamura, M.; Battisto, R. Wineinformatics: Uncork Napa’s Cabernet Sauvignon by Association Rule Based Classification. In Proceedings of the 2015 IEEE 14th International Conference on Machine Learning and Applications, Miami, FL, USA, 9–11 December 2015; pp. 565–569. [Google Scholar]
- Rhodes, C.T. Wine Informatics: Clustering and Analysis of Professional Wine Reviews. Master’s Thesis, University of Central Arkansas, Conway, AR, USA, May 2015. [Google Scholar]
- Chen, B.; Buck, K.H.; Lawrence, C.; Moore, C.; Yeatts, J.; Atkison, T. Granular Computing in Wineinformatics. In Proceedings of the 2017 13th International Conference on Natural Computation, Fuzzy Systems and Knowledge Discovery, Guilin, China, 29–31 July 2017; pp. 1228–1232. [Google Scholar]
- Bird, S.; Klein, E.; Loper, E. Natural Language Processing with Python: Analyzing Text with the Natural Language Toolkit; O’Reilly Media, Inc.: Sebastopol, CA, USA, 2009. [Google Scholar]
- Wine School of Philadelphia. Wine Reviews: The Essential Guide Featured. 20 November 2019. Available online: www.vinology.com/wine-review-guide/ (accessed on 21 November 2020).
- Wine Searcher. What Are Wine Scores? Available online: www.wine-searcher.com/wine-scores (accessed on 21 November 2020).
- Cardebat, J.M.; Livat, F. Wine experts’ rating: A matter of taste? Int. J. Wine Bus. Res. 2016, 28, 43–58. [Google Scholar] [CrossRef]
- Cardebat, J.M.; Figuet, J.M.; Paroissien, E. Expert opinion and Bordeaux wine prices: An attempt to correct biases in subjective judgments. J. Wine Econ. 2014, 9, 282–303. [Google Scholar] [CrossRef]
- Cao, J.; Stokes, L. Evaluation of wine judge performance through three characteristics: Bias, discrimination, and variation. J. Wine Econ. 2010, 5, 132–142. [Google Scholar] [CrossRef]
- Cardebat, J.M.; Paroissien, E. Standardizing expert wine scores: An application for Bordeaux en primeur. J. Wine Econ. 2015, 10, 329–348. [Google Scholar] [CrossRef]
- Hodgson, R.T. An examination of judge reliability at a major US wine competition. J. Wine Econ. 2008, 3, 105–113. [Google Scholar] [CrossRef]
- Hopfer, H.; Heymann, H. Judging wine quality: Do we need experts, consumers or trained panelists? Food Qual. Prefer. 2014, 32, 221–233. [Google Scholar] [CrossRef]
- Sciaretta, G. Wine Spectator. About Us. 19 November 2020. Available online: www.winespectator.com/pages/about-us (accessed on 21 November 2020).
- Wine Spectator. Top 100 Wines. 2020. Available online: https://top100.winespectator.com/lists/ (accessed on 21 November 2020).
- Wine Folly. Bordeaux Wine 101: The Wines and the Region. 12 September 2019. Available online: www.Winefolly.com/deep-dive/a-primer-to-bordeaux-wine/ (accessed on 21 November 2020).
- Davidson, I. Understanding K-means non-hierarchical clustering. SUNY Albany Tech. Rep. 2002, 2, 2–14. [Google Scholar]


| Wine | Item1 | Item2 | Item3 | Item4 | Item5 |
|---|---|---|---|---|---|
| A | 1 | 0 | 1 | 0 | 1 |
| B | 1 | 1 | 0 | 0 | 0 |
| Cluster Number | Wine Name | Wine Year | Wine Score |
|---|---|---|---|
| 0 | Château Suduiraut Sauternes | 2007 | 95 |
| 1 | Château Pape Clément Pessac-Léognan White | 2007 | 95 |
| 2 | Château L’Église Clinet Pomerol | 2009 | 98 |
| 3 | Château Haut-Brion Pessac-Léognan White | 2006 | 95 |
| 4 | Château Lyonnat Lussac-St.-Emilion Réserve de la Famille | 2005 | 87 |
| 5 | Château Latour Pauillac Les Forts de Latour | 2010 | 95 |
| 6 | Château Brown Pessac-Léognan White | 2006 | 90 |
| 7 | Château Langoa Barton St.-Julien | 2016 | 95 |
| 8 | Château Daugay St.-Emilion | 2009 | 90 |
| 9 | Romulus Pomerol | 2008 | 90 |
| 10 | Château Laville Haut-Brion Pessac-Léognan White | 2003 | 95 |
| 11 | Château Le Crock St.-Estephe | 2016 | 92 |
| 12 | Gracia St.-Emilion Les Angelots de Gracia | 2009 | 92 |
| 13 | Château Monregard La Croix Pomerol | 2009 | 90 |
| 14 | Château Pichon-Longueville Baron Pauillac | 2003 | 95 |
| 15 | Château Montrose St.-Estephe | 2016 | 96 |
| 16 | Château Lafleur Pomerol | 2007 | 92 |
| 17 | Château Carignan Premieres Cotes de Bordeaux | 2005 | 88 |
| 18 | Château Capet-Guillier St.-Emilion | 2016 | 90 |
| 19 | Château Laville Haut-Brion Pessac-Léognan White | 2006 | 93 |
| 20 | Château Bellevue-Mondotte St.-Emilion | 2005 | 97 |
| 21 | Château Haut-Brion Pessac-Léognan White | 2007 | 97 |
| 22 | Château Pontet-Canet Pauillac | 2003 | 93 |
| 23 | Château Lamothe Sauternes | 2009 | 90 |
| 24 | Château Lafite Rothschild Pauillac | 2007 | 91 |
| 25 | Château La Gurgue Margaux | 2005 | 90 |
| 26 | Château La Rousselle Fronsac | 2009 | 92 |
| 27 | Château Veyry Castillon Cotes de Bordeaux | 2009 | 90 |
| 28 | Château Destieux St.-Emilion | 2006 | 90 |
| 29 | Château Roquefort Bordeaux White Roquefortissime | 2005 | 87 |
| 30 | Château de Myrat Barsac | 2003 | 95 |
| 31 | Liber Pater Graves | 2009 | 96 |
| 32 | Lucia St.-Emilion | 2009 | 96 |
| 33 | Domaine de Chevalier Pessac-Léognan White | 2006 | 95 |
| 34 | Domaine de Chevalier Pessac-Léognan White | 2007 | 92 |
| 35 | Domaine de Chevalier Pessac-Léognan | 2003 | 90 |
| 36 | Château Talbot St.-Julien | 2016 | 95 |
| 37 | Château Pipeau St.-Emilion | 2007 | 87 |
| 38 | Château Magdelaine St.-Emilion | 2003 | 90 |
| 39 | Château Bonalgue Pomerol | 2009 | 90 |
| 40 | Château Margaux Bordeaux Pavillon Blanc | 2007 | 92 |
| 41 | Château Palmer Margaux | 2007 | 90 |
| 42 | Château Coutet Barsac | 2007 | 95 |
| Cluster Number | Wine Name | Wine Year | Wine Score |
|---|---|---|---|
| 1 | Chateâu Margaux Margaux | 2003 | 95 |
| 2 | Chateâu Beychevelle St.-Julien | 2007 | 85 |
| 3 | Domaine de Chevalier Pessac-Léognan White | 2006 | 95 |
| 4 | Chateâu Pichon-Longueville Baron Pauillac | 2003 | 95 |
| 5 | Liber Pater Graves | 2009 | 96 |
| 6 | Chateâu Doisy Daëne Barsac L’Extravagant | 2009 | 96 |
| 7 | Chateâu Pontet-Canet Pauillac | 2003 | 93 |
| 8 | Chateâu Guiraud Sauternes | 2003 | 95 |
| 9 | Lucia St.-Emilion | 2009 | 96 |
| 10 | Chateâu Ausone St.-Emilion | 2009 | 98 |
| 11 | Chateâu Lafite Rothschild Pauillac | 2007 | 91 |
| 12 | Chateâu Monregard La Croix Pomerol | 2009 | 90 |
| 13 | Chateâu Pape Clément Pessac-Léognan White | 2007 | 95 |
| Cluster Number | Highest Common Attribute | Percent of Appearance |
|---|---|---|
| 1 | DEEP | 9.03% |
| 2 | MOUTHWATERING | 100% |
| 3 | FULL-BODIED | 83.89% |
| 4 | BLACK TEA | 75.55% |
| 5 | FLORAL | 56% |
| 6 | WHITE | 64.70% |
| 7 | SERIOUS | 100% |
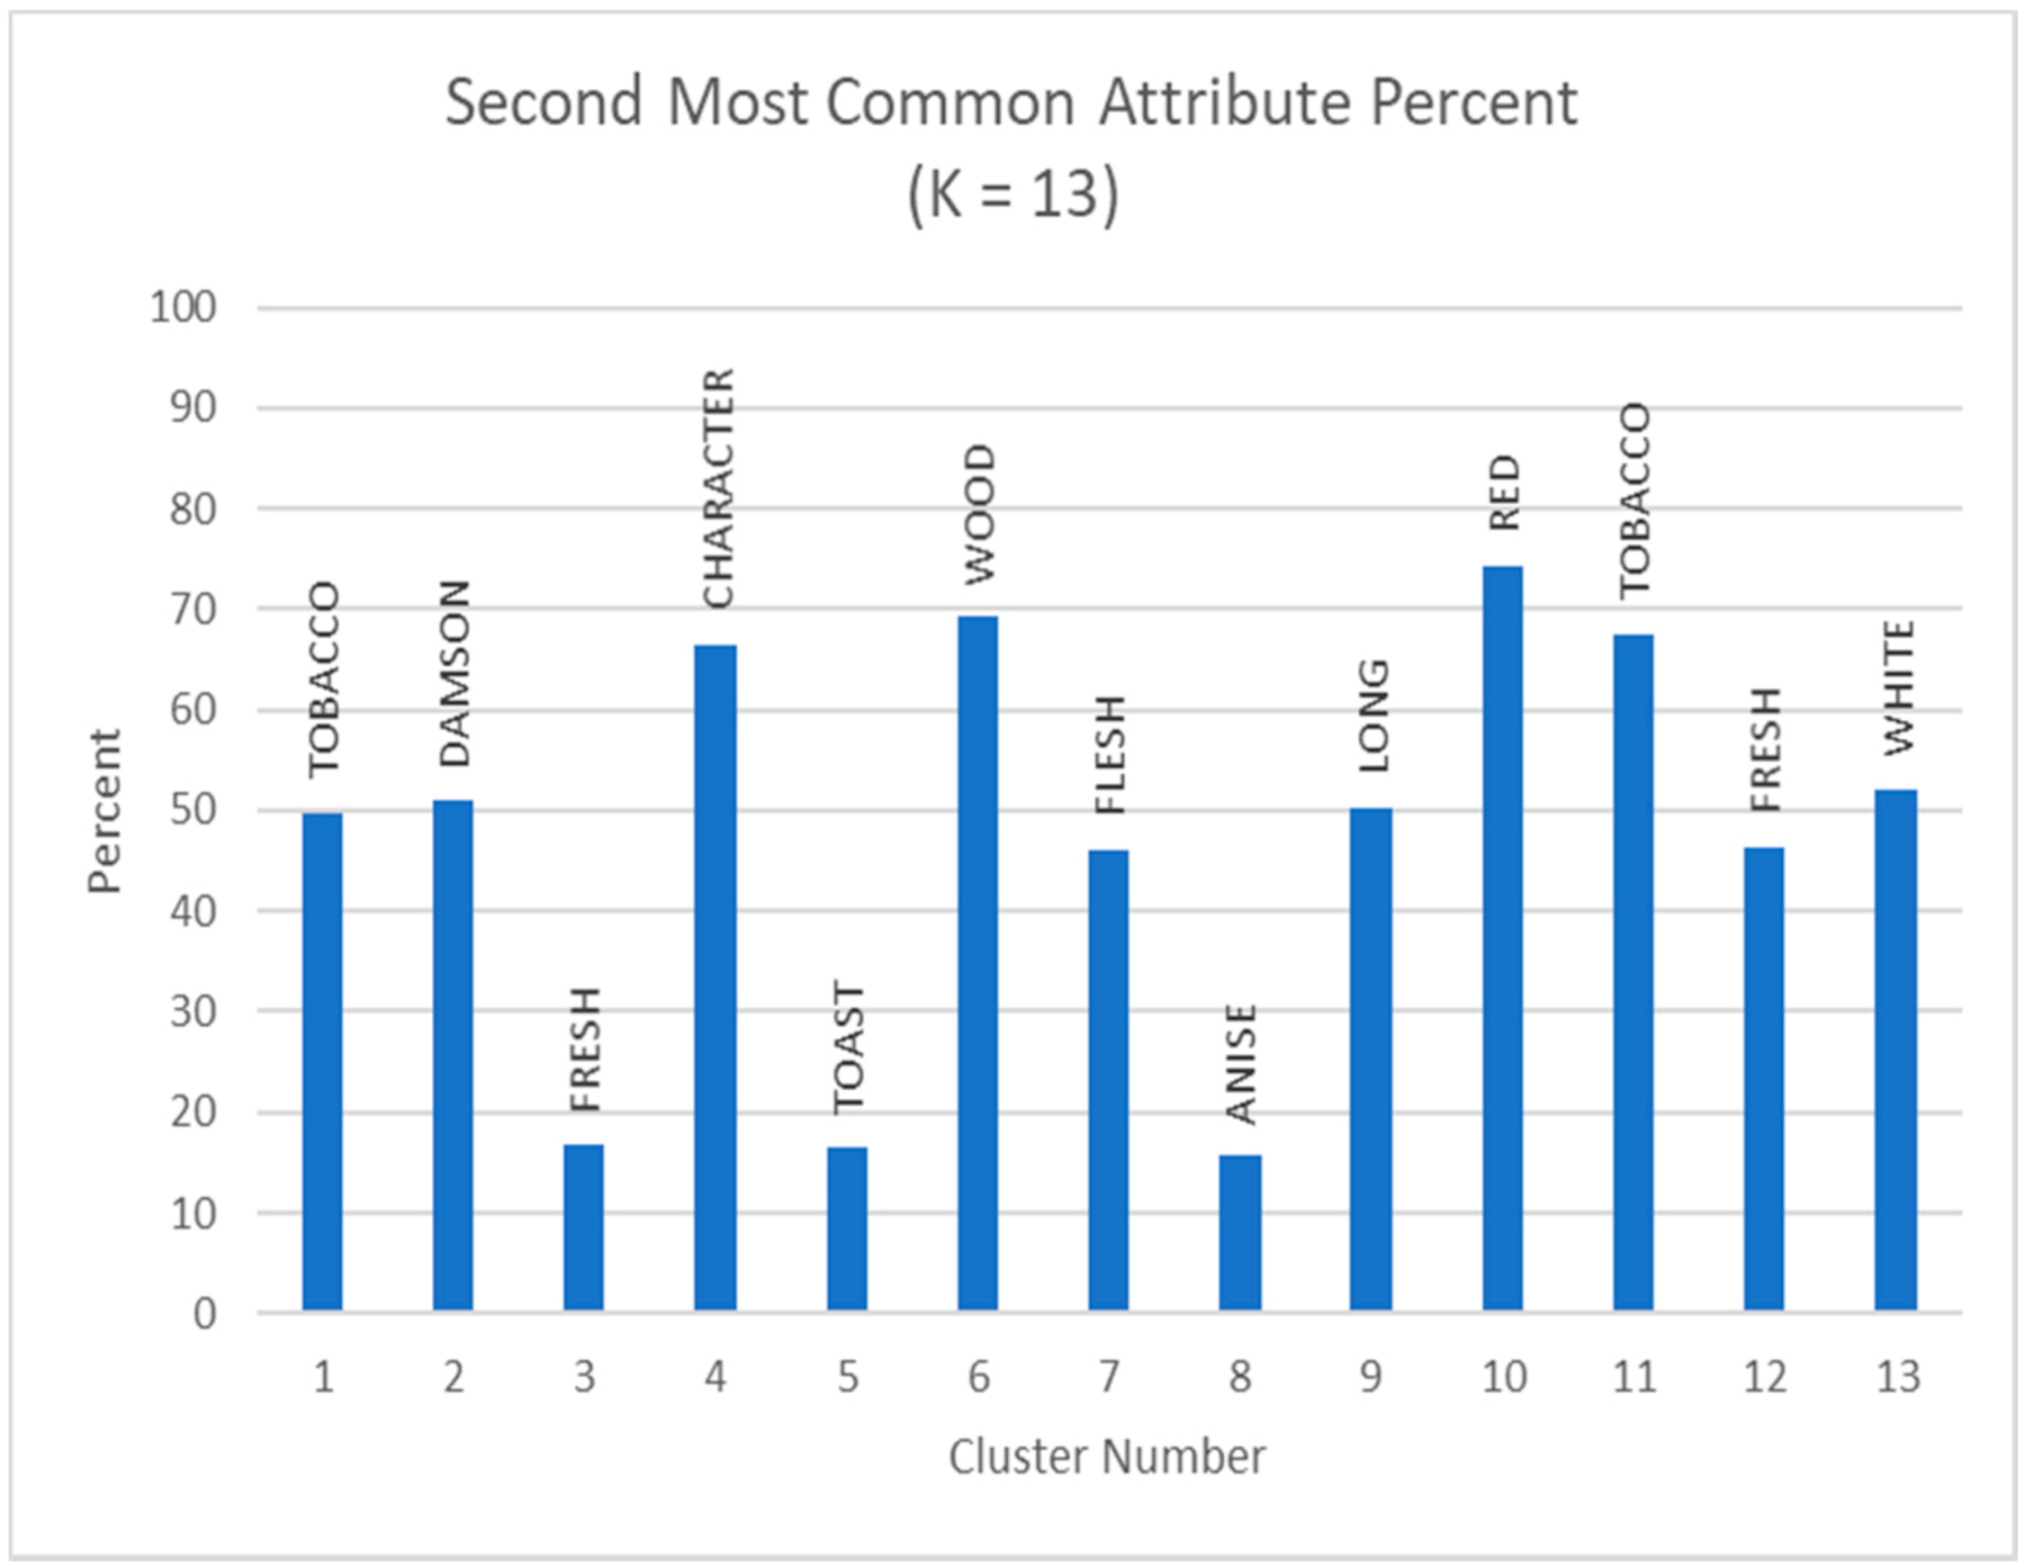
| Cluster Number | Second Highest | Percent of Appearance |
|---|---|---|
| 1 | LENGTH | 7.09% |
| 2 | BLACK TEA | 25% |
| 3 | VELVET | 16.94% |
| 4 | VELVET | 15.55% |
| 5 | BALANCE | 52% |
| 6 | MACADAMIA NUT | 26.47% |
| 7 | BLACK TEA | 11.76% |
| Cluster Number | Wine Name | Wine Year | Wine Score |
|---|---|---|---|
| 1 | Liber Pater Graves | 2009 | 96 |
| 2 | Chateâu Pavie Macquin St.-Emilion | 2016 | 95 |
| 3 | Lucia St.-Emilion | 2009 | 96 |
| 4 | Chateâu Rauzan-Ségla Margaux | 2016 | 95 |
| 5 | Chateâu Lafleur Pomerol | 2003 | 97 |
| 6 | Chateâu de Fargues Sauternes | 2016 | 96 |
| 7 | Chateâu La Clusiére St.-Emilion | 2001 | 98 |
Publisher’s Note: MDPI stays neutral with regard to jurisdictional claims in published maps and institutional affiliations. |
© 2021 by the authors. Licensee MDPI, Basel, Switzerland. This article is an open access article distributed under the terms and conditions of the Creative Commons Attribution (CC BY) license (http://creativecommons.org/licenses/by/4.0/).
Share and Cite
McCune, J.; Riley, A.; Chen, B. Clustering in Wineinformatics with Attribute Selection to Increase Uniqueness of Clusters. Fermentation 2021, 7, 27. https://doi.org/10.3390/fermentation7010027
McCune J, Riley A, Chen B. Clustering in Wineinformatics with Attribute Selection to Increase Uniqueness of Clusters. Fermentation. 2021; 7(1):27. https://doi.org/10.3390/fermentation7010027
Chicago/Turabian StyleMcCune, Jared, Alex Riley, and Bernard Chen. 2021. "Clustering in Wineinformatics with Attribute Selection to Increase Uniqueness of Clusters" Fermentation 7, no. 1: 27. https://doi.org/10.3390/fermentation7010027
APA StyleMcCune, J., Riley, A., & Chen, B. (2021). Clustering in Wineinformatics with Attribute Selection to Increase Uniqueness of Clusters. Fermentation, 7(1), 27. https://doi.org/10.3390/fermentation7010027