Article

Digital Smoke Taint Detection in Pinot Grigio Wines Using an E-Nose and Machine Learning Algorithms Following Treatment with Activated Carbon and a Cleaving Enzyme

by
Vasiliki Summerson
1,
Claudia Gonzalez Viejo
1,
Damir D. Torrico
2,
Alexis Pang
1 and
Sigfredo Fuentes
1,*
1
Digital Agriculture, Food and Wine Group, School of Agriculture and Food, Faculty of Veterinary and Agricultural Sciences, The University of Melbourne, Building 142, Parkville, VIC 3010, Australia
2
Department of Wine, Food and Molecular Biosciences, Faculty of Agriculture and Life Sciences, Lincoln University, Lincoln 7647, Canterbury, New Zealand
*
Author to whom correspondence should be addressed.
Fermentation 2021, 7(3), 119; https://doi.org/10.3390/fermentation7030119
Submission received: 29 June 2021 / Revised: 13 July 2021 / Accepted: 14 July 2021 / Published: 16 July 2021
(This article belongs to the Special Issue Implementation of Digital Technologies on Beverage Fermentation)

Abstract

:
The incidence and intensity of bushfires is increasing due to climate change, resulting in a greater risk of smoke taint development in wine. In this study, smoke-tainted and non-smoke-tainted wines were subjected to treatments using activated carbon with/without the addition of a cleaving enzyme treatment to hydrolyze glycoconjugates. Chemical measurements and volatile aroma compounds were assessed for each treatment, with the two smoke taint amelioration treatments exhibiting lower mean values for volatile aroma compounds exhibiting positive ‘fruit’ aromas. Furthermore, a low-cost electronic nose (e-nose) was used to assess the wines. A machine learning model based on artificial neural networks (ANN) was developed using the e-nose outputs from the unsmoked control wine, unsmoked wine with activated carbon treatment, unsmoked wine with a cleaving enzyme plus activated carbon treatment, and smoke-tainted control wine samples as inputs to classify the wines according to the smoke taint amelioration treatment. The model displayed a high overall accuracy of 98% in classifying the e-nose readings, illustrating it may be a rapid, cost-effective tool for winemakers to assess the effectiveness of smoke taint amelioration treatment by activated carbon with/without the use of a cleaving enzyme. Furthermore, the use of a cleaving enzyme coupled with activated carbon was found to be effective in ameliorating smoke taint in wine and may help delay the resurgence of smoke aromas in wine following the aging and hydrolysis of glycoconjugates.

1. Introduction

The exposure of grapevines to smoke during the critical period between veraison and harvest can result in the uptake and accumulation of volatile phenols and their glycoconjugates in grape berries, which can negatively affect the composition and sensory properties of wines [1,2,3]. Once absorbed, volatile phenols from smoke are rapidly glycosylated and stored in the skin and pulp of grape berries [4,5]. During winemaking, many of these glycoconjugates are hydrolyzed back into their free active forms where they can impart their unpleasant ‘smoky’ aromas, with a large proportion of the glycoconjugate pool remaining in the final wine [5,6,7,8]. Furthermore, the in-mouth hydrolysis of volatile phenol glycoconjugates has also been shown to occur, which may further impact the flavor and aftertaste of smoke-tainted wines [9,10].
The degree of smoke taint in the final wine depends on several factors, including the timing and duration of smoke exposure and winemaking practices such as yeast selection and skin contact time during fermentation [3,6,11,12]. Some techniques have been investigated to mitigate the effects of grapevine smoke exposure in-field and to find methods for ameliorating smoke taint in the final wine. The research by van der Hulst et al. [2] found that a foliar application of kaolin resulted in significantly lower glycoconjugate levels in Merlot grapes following smoke exposure compared to the control; however, no significant differences were found for Sauvignon Blanc and Chardonnay grapes. Further research by Favell et al. [13] found that applying an artificial grape cuticle one week prior to the application of smoke can significantly impede the uptake of smoke-derived volatile phenols. In other research, Szeto et al. [12] found that in-canopy misting partially reduced the uptake of smoke-derived volatile phenols by grapes; however, it was not significant enough to readily influence the concentration of volatile phenols and the negative sensory characteristics associated with smoke taint in the final wine. For the amelioration of smoke taint in wine, Fudge et al. [14] found that reverse osmosis and solid-phase adsorption effectively reduced the concentrations of smoke-derived volatile phenols. Hence, the negative sensory attributes of smoke taint. Further research also found that the treatment of smoke-affected wines with activated carbon was also effective in reducing volatile phenol concentrations and the intensity of smoke-related sensory attributes [15]. However, both activated carbon and reverse osmosis treatments were ineffective at reducing the levels of volatile phenol glycoconjugates. Consequently, over time, the concentration of free volatile phenols and, hence, smoke-related sensory characteristics may increase due to the gradual hydrolysis of glycoconjugates [14,15]. Therefore, to effectively ameliorate smoke taint in wine, it is necessary to reduce both free volatile phenols and their bound glycoconjugates to prevent the gradual return of negative ‘smoky’ characteristics.
Aroma is one of the most important quality attributes for wine. While thousands of volatile compounds have been identified, which contribute to the complexity and varietal character of wine, in the case of smoke taint, they can attribute undesirable characteristics such as ‘smoky’, ‘ash’ and ‘medicinal’ aromas and flavors [8,14,16,17]. To assess the levels of the smoke compounds (both volatile phenols and their glycoconjugates), growers and winemakers are required to send samples of grapes and/or wines to commercial laboratories or conduct mini harvests to perform a sensory analysis. However, the high cost associated with laboratory testing may prevent this form of analysis for many producers, and a sensory analysis is time-consuming and may not allow for timely actions within the time constraints of a vintage [4,18]. There is, therefore, a need for a rapid and affordable alternative method for assessing smoke contamination.
Electronic noses (e-noses) have been developed for olfactory analyses for use in many industries, such as in agriculture and forestry [19] and medical diagnostics [20,21], as well as in the food industry for various applications, including quality control and the assessment of food authentication and adulteration, as well as freshness and shelf-life prediction [22,23,24,25,26]. In most cases, e-noses are comprised of an array of gas sensors with high sensitivity to detect volatile compounds coupled with a data processing unit and pattern recognition methods for identifying aroma profiles [18,24,25]. The portability, ease of use, and nondestructive nature of e-noses have increased interest in their use [23,24], particularly for smoke taint analyses in wine. The research by Antolini et al. [27] found that an e-nose was effective at discriminating between different smoke-treated wines, and it could serve as a useful tool for the early detection of smoke taint before it is perceived by a sensory analysis. Furthermore, the research by Fuentes et al. [18] for the assessment of smoke-tainted grape berries and wine used the readings from a low-cost e-nose as inputs for machine learning algorithms to create different artificial neural network (ANN) models with high accuracy to (1) classify wines according to different smoke and/or misting treatments, (2) predict the levels of 20 glycoconjugates and 10 volatile phenols in grapes at one hour post-smoke exposure and at harvest, as well as in the final wine, and (3) to predict the intensity of 12 wine descriptors based on a consumer sensory evaluation.
This study investigated the effectiveness of enzyme preparation with glycosidase activity in cleaving volatile phenol glycoconjugates prior to treatment with activated carbon for a more effective smoke taint amelioration. In addition to this, the use of a low-cost e-nose to distinguish smoke-tainted and non-smoke-tainted wines was also assessed. Measurements from the e-nose were used as inputs for machine learning modeling to classify wine samples according to the type of smoke taint amelioration treatment applied (activated carbon with/without enzyme treatment) and smoke taint status (smoke-tainted or non-smoke-tainted). This may provide winemakers with an alternative method for assessing the effectiveness of smoke taint amelioration treatment by activated carbon with/without the use of a cleaving enzyme. Furthermore, the use of a glycosidase enzyme treatment before the addition of activated carbon may offer an improved method for ameliorating smoke taint in wine.

2. Materials and Methods

2.1. Wine Samples and Smoke Taint Amelioration Treatments

Commercial Pinot Grigio wines supplied by a winery were used in this study. The smoke-tainted (ST) wines were produced from grapes harvested from a vineyard located in the King Valley, Victoria, Australia exposed to moderate levels of smoke during the 2019/2020 harvest period. The non-smoke-tainted (NS) wines were produced from grapes harvested from a vineyard located in the Murray Valley, Victoria, Australia. From each type of wine, 1.5-L samples were taken and used for two different smoke taint amelioration treatments, as well as for a control treatment (CO, i.e., no treatments applied). The first treatment involved the use of activated carbon (Smartvin® FPS, Enologica Vason, Verona, Italy) (activated carbon treatment; AC) applied at a concentration of 2 g L−1 and left for 48 h. The second treatment involved the use of an enzyme preparation (ZIMAROM®, Enologica Vason) to cleave volatile phenol glycoconjugates at a concentration prior to the addition of activated carbon. The enzyme preparation was applied at a rate of 3 g hL−1 and left to work for four days; after which, the wine underwent treatment with activated carbon, as described above (carbon enzyme treatment; CE). Following treatment with activated carbon, bentonite was added at a rate of 150 g hL−1 to clarify the wines (Flottobent®, Enologica Vason). The bentonite mixture was first allowed to swell in water (ratio of bentonite to water was 1:15) and left to settle for 48 h; after which, the wines were racked and, because of the small volumes of the samples, were filtered using a size four filter paper designed for filtering coffee (E. H. Harris & Co. Pty. Ltd., Kingsgrove, NSW, Australia). During the entire process, wines were stored in a temperature-controlled environment between 20 and 23 °C.

2.2. Chemical Measurements

A sample of 200 mL of each replicate of each treatment was measured for pH using a Fisherbrand Accumet® AB15 pH meter (Fisher Scientific, Hampton, NH, USA) that was calibrated with a buffer solution at pH 7.0. Total dissolved solids (TDS) and electrical conductance (EC) were also assessed using a Yuelong YL-TDS2-A digital water quality tester (Zhengzhou Yuelong Electronic Technology Co., Ltd., Zhengzhou, China). Furthermore, the total soluble solids (TSS) were measured in °Brix (Brix) using a portable Alla France REFBX010 optical refractometer (Alla France Sarl, Chemillé-Melay, France) that was rinsed with distilled water and dried between each measurement. Lastly, the alcohol content of each sample was determined using 20 mL of sample injected into an Alcolyzer Wine M alcohol meter (Anton Paar GmbH, Graz, Austria) that was set to use the wine extension method located in the equipment settings. All measurements were performed in triplicates and at room temperatures between 20 and 23 °C.

2.3. Electronic Nose

A low-cost, portable e-nose comprised of nine different sensors that are sensitive to different gases (Table 1) was used to assess the wine samples in triplicates. The e-nose was developed by the Digital Agriculture, Food and Wine (DAFW) Group from the Faculty of Veterinary and Agricultural Sciences (FVAS) of the University of Melbourne (UoM), and the details have been described previously by Gonzalez Viejo et al. [28]. This e-nose has previously demonstrated great success for smoke taint assessment and the prediction of levels of smoke-derived volatile phenols and their glycoconjugates in Cabernet Sauvignon wines, as illustrated by Fuentes et al. [18]. Measurements were performed by pouring 200 mL of wine sample into a 500-mL beaker with the e-nose placed on top for approximately 3 min to collect the gas readings. The e-nose was calibrated for 20–30 s between samples to prevent any carryover effects and the signal readings monitored to ensure they reached baseline values prior to testing the next sample. Readings were monitored prior to placing the e-nose over the sample, during measurement and after the sample was removed to ensure stability and accuracy of the readings.
Data acquisition was performed using a customized code written in MATLAB® R2020a (Mathworks, Inc., Natick, MA, USA) to identify the stable e-nose signals from the moment the e-nose was placed on the beaker containing the wine sample until prior to its removal. As described by Gonzalez Viejo et al. [29], the e-nose data was automatically divided into ten subdivisions to extract the average values per sensor, which were then used as inputs for the machine learning modeling.

2.4. GC-MS Analysis of Volatile Aroma Compounds

A gas-chromatograph with a mass-selective detector 5977B (GC-MSD; Agilent Technologies, Inc., Santa Clara, CA, USA) with an HP-5MS column (length 30 m, inner diameter 0.25 mm and film 0.25 µ; Agilent Technologies, Inc.) with helium as the carrier gas (flow rate of 1 mL min−1) and an integrated autosampler system PAL3 (CTC Analytics AG, Zwingen, Switzerland) was used to evaluate the aroma compounds present in each of the wine samples (done in triplicates). A total of 5 mL of each wine sample was placed into a 20-mL vial and assessed using the headspace method with a solid-phase microextraction (SPME) divinylbenzene–carboxen–polydimethylsiloxane (DVB–CAR–PDMS) 1.1 mm grey fiber (Agilent Technologies, Inc.). A blank was used at the start to ensure no carryover effects from any previous analyses. Further details about the method used were described by Gonzalez Viejo et al. [30]. Furthermore, the National Institute of Standards and Technology (NIST; National Institute of Standards and Technology, Gaithersburg, MD, USA) library was used to identify the compounds observed, and only compounds with greater than 70% certainty were used.

2.5. Statistical Analysis and Machine Learning Modeling

Results from the chemical measurements and the relative peak areas of the volatile compounds identified by GC-MS were analyzed by analysis of variance (ANOVA) using Minitab® version 19.2020.1 (Minitab Inc., State College, PA, USA), with mean comparisons performed using Fisher’s least significant difference (LSD) post hoc test at α = 0.05 to assess if there were significant differences among the wine samples. A principal components analysis (PCA) was also conducted for the chemical measurements and volatile compounds using a customized code written in MATLAB® R2020a. In addition to this, a matrix was also developed using MATLAB® R2020a to assess the significant correlations (p < 0.05) between the chemical measurements, volatile aroma compounds and e-nose readings.
The ten mean values of each of the e-nose outputs for the NSCO, NSAC, NSCE and STCO were used as inputs for machine learning modeling based on artificial neural networks (ANN) to create a pattern recognition model that classifies the wine samples according to the smoke taint status (i) non-smoked without amelioration treatment (NSCO), (ii) non-smoked with carbon treatment (NSAC), (iii) non-smoked with carbon and enzyme treatment and (iv) smoked (SMCO). The model was developed using a customized code written in MATLAB® R2020a that tested 17 different training algorithms, with the optimal selected based on the highest accuracy and performance, as described by Gonzalez Viejo et al. [31] (Figure 1). In this instance, the Bayesian Regularization algorithm was found to be the best algorithm, and further training was performed to develop a more accurate ANN model with no signs of under- or overfitting. The inputs were divided randomly, with 60% used for the training stage and 40% for testing, with performance tested based on the mean squared error (MSE). A total of five neurons were used following a trimming test with 3, 5, 7 and 10 neurons (data not shown). The ANN model was then used to classify the remaining wine samples (smoked treatments: STAC and STCE) to assess the effectiveness of the smoke taint amelioration treatments.

3. Results

3.1. Chemical Measurements

The results for the chemical measurements are shown in Table 2. Significant differences (p < 0.05) were found amongst the different wine treatments for all the parameters, with the STAC and STCE treatments exhibiting the highest mean values for TDS (802.50 and 832.00 ppm, respectively) and EC (1706.80 and 1769.80 µs cm−1), with the NSCE (665.70 ppm and 1415.70 µs cm−1) and STCO (670.30 ppm and 1425.50 µs cm−1) treatments exhibiting the lowest values. The NSCO treatment had the highest mean °Brix and alcohol content (6.00 Brix and 12.18%), while the STCE treatment had the lowest °Brix (5.09 Brix) and the STAC (9.64%) and STCE (9.41%) treatments had the lowest alcohol contents. Lastly, the NSCE treatment had the highest pH (3.87), while the STAC, STCE and STCO treatments had the lowest (3.48, 3.48 and 3.43, respectively).

3.2. GC-MS Analysis

Table 3 shows the mean values for the peak areas of the volatile aroma compounds and their standard deviations with their aroma descriptions. Significant differences (p < 0.05) were found between the wine samples for all the aroma compounds. Both CO treatments had the highest mean levels of aroma compounds within their (NS or ST) groups, with the NSCO treatment having the highest mean values for 1-butanol, 3-methyl- acetate, butanedioic acid, hexanoic acid, ethyl ester and phenylethyl alcohol. These aroma compounds are associated primarily with positive ‘fruit’ aromas, such as banana, pear, apple, pineapple, rose and honey aromas (Table 3). The STCO sample illustrated high levels of dodecanoic acid, ethyl ester, which is associated with sweet, waxy, soapy and floral aromas, as well as decanoic acid, ethyl ester and octanoic acid, ethyl ester, which are associated with aromas such as apple, sweet, waxy, apricot and banana. The AC and CE treatments appeared to have the lowest mean levels of aroma compounds, with the STAC and STCE treatments having the lowest values for 1-butanol, 3-methyl- acetate and hexanoic acid, ethyl ester.

3.3. Electronic Nose

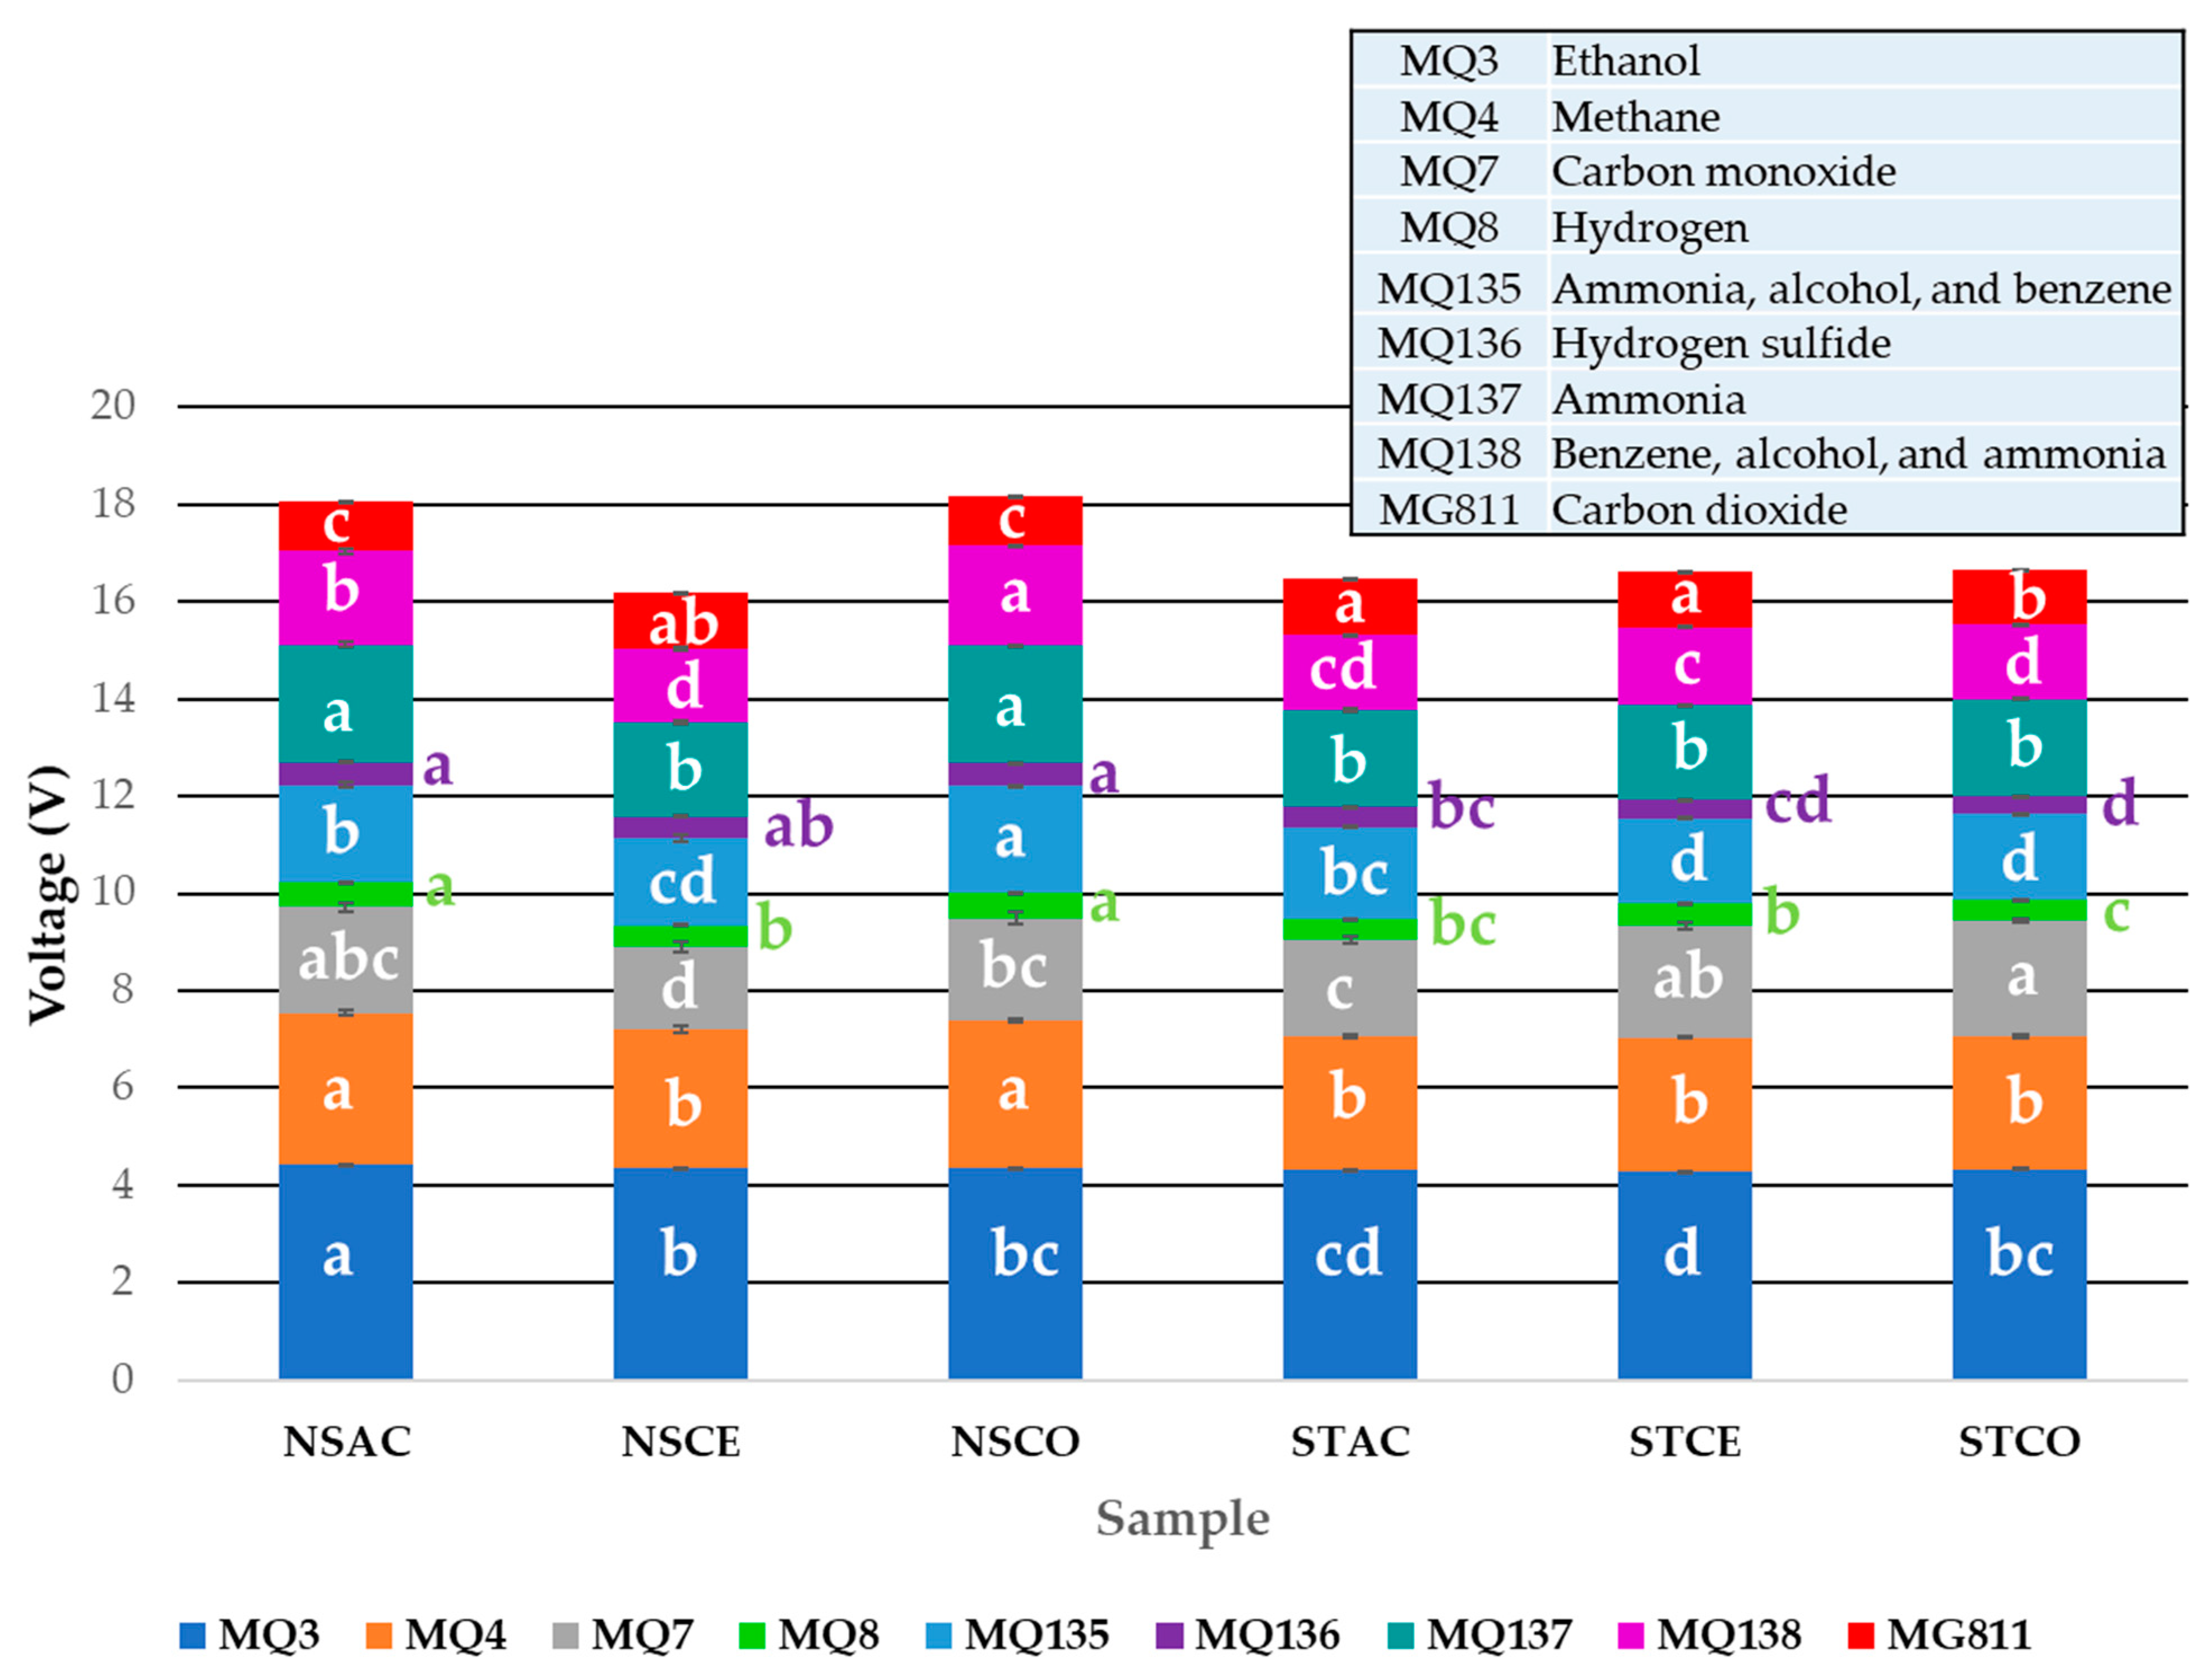
Figure 2 shows the mean values and standard errors for each gas sensor that makes up the e-nose for each sample. Again, significant differences (p < 0.05) were observed between wine samples for each of the gas sensors, indicating that the e-nose is able to differentiate the samples and, hence, smoke taint amelioration treatments. The highest readings for all wine samples were seen for ethanol gas release (sensor MQ3), with the NSAC treatment demonstrating the highest mean value (4.42 V), while STCE exhibited the lowest (4.29 V). Hydrogen sulfide gas (sensor 136) presented the lowest values for all wine samples, with the NSAC and NSCO treatments exhibiting the highest values (0.48 and 0.47, respectively), while the STCO treatment exhibited the lowest (0.39 V). For the CO2 gas readings (sensor MG811), the values were inversed, and hence, a higher voltage corresponded to a lower concentration. The STCE and STAC treatments exhibited the lowest mean CO2 readings (1.16, and 1.15 V, respectively), while the NSAC and NSCO treatments exhibited the highest (1.03 and 1.00 V, respectively).

3.4. Multivariate Data Analysis

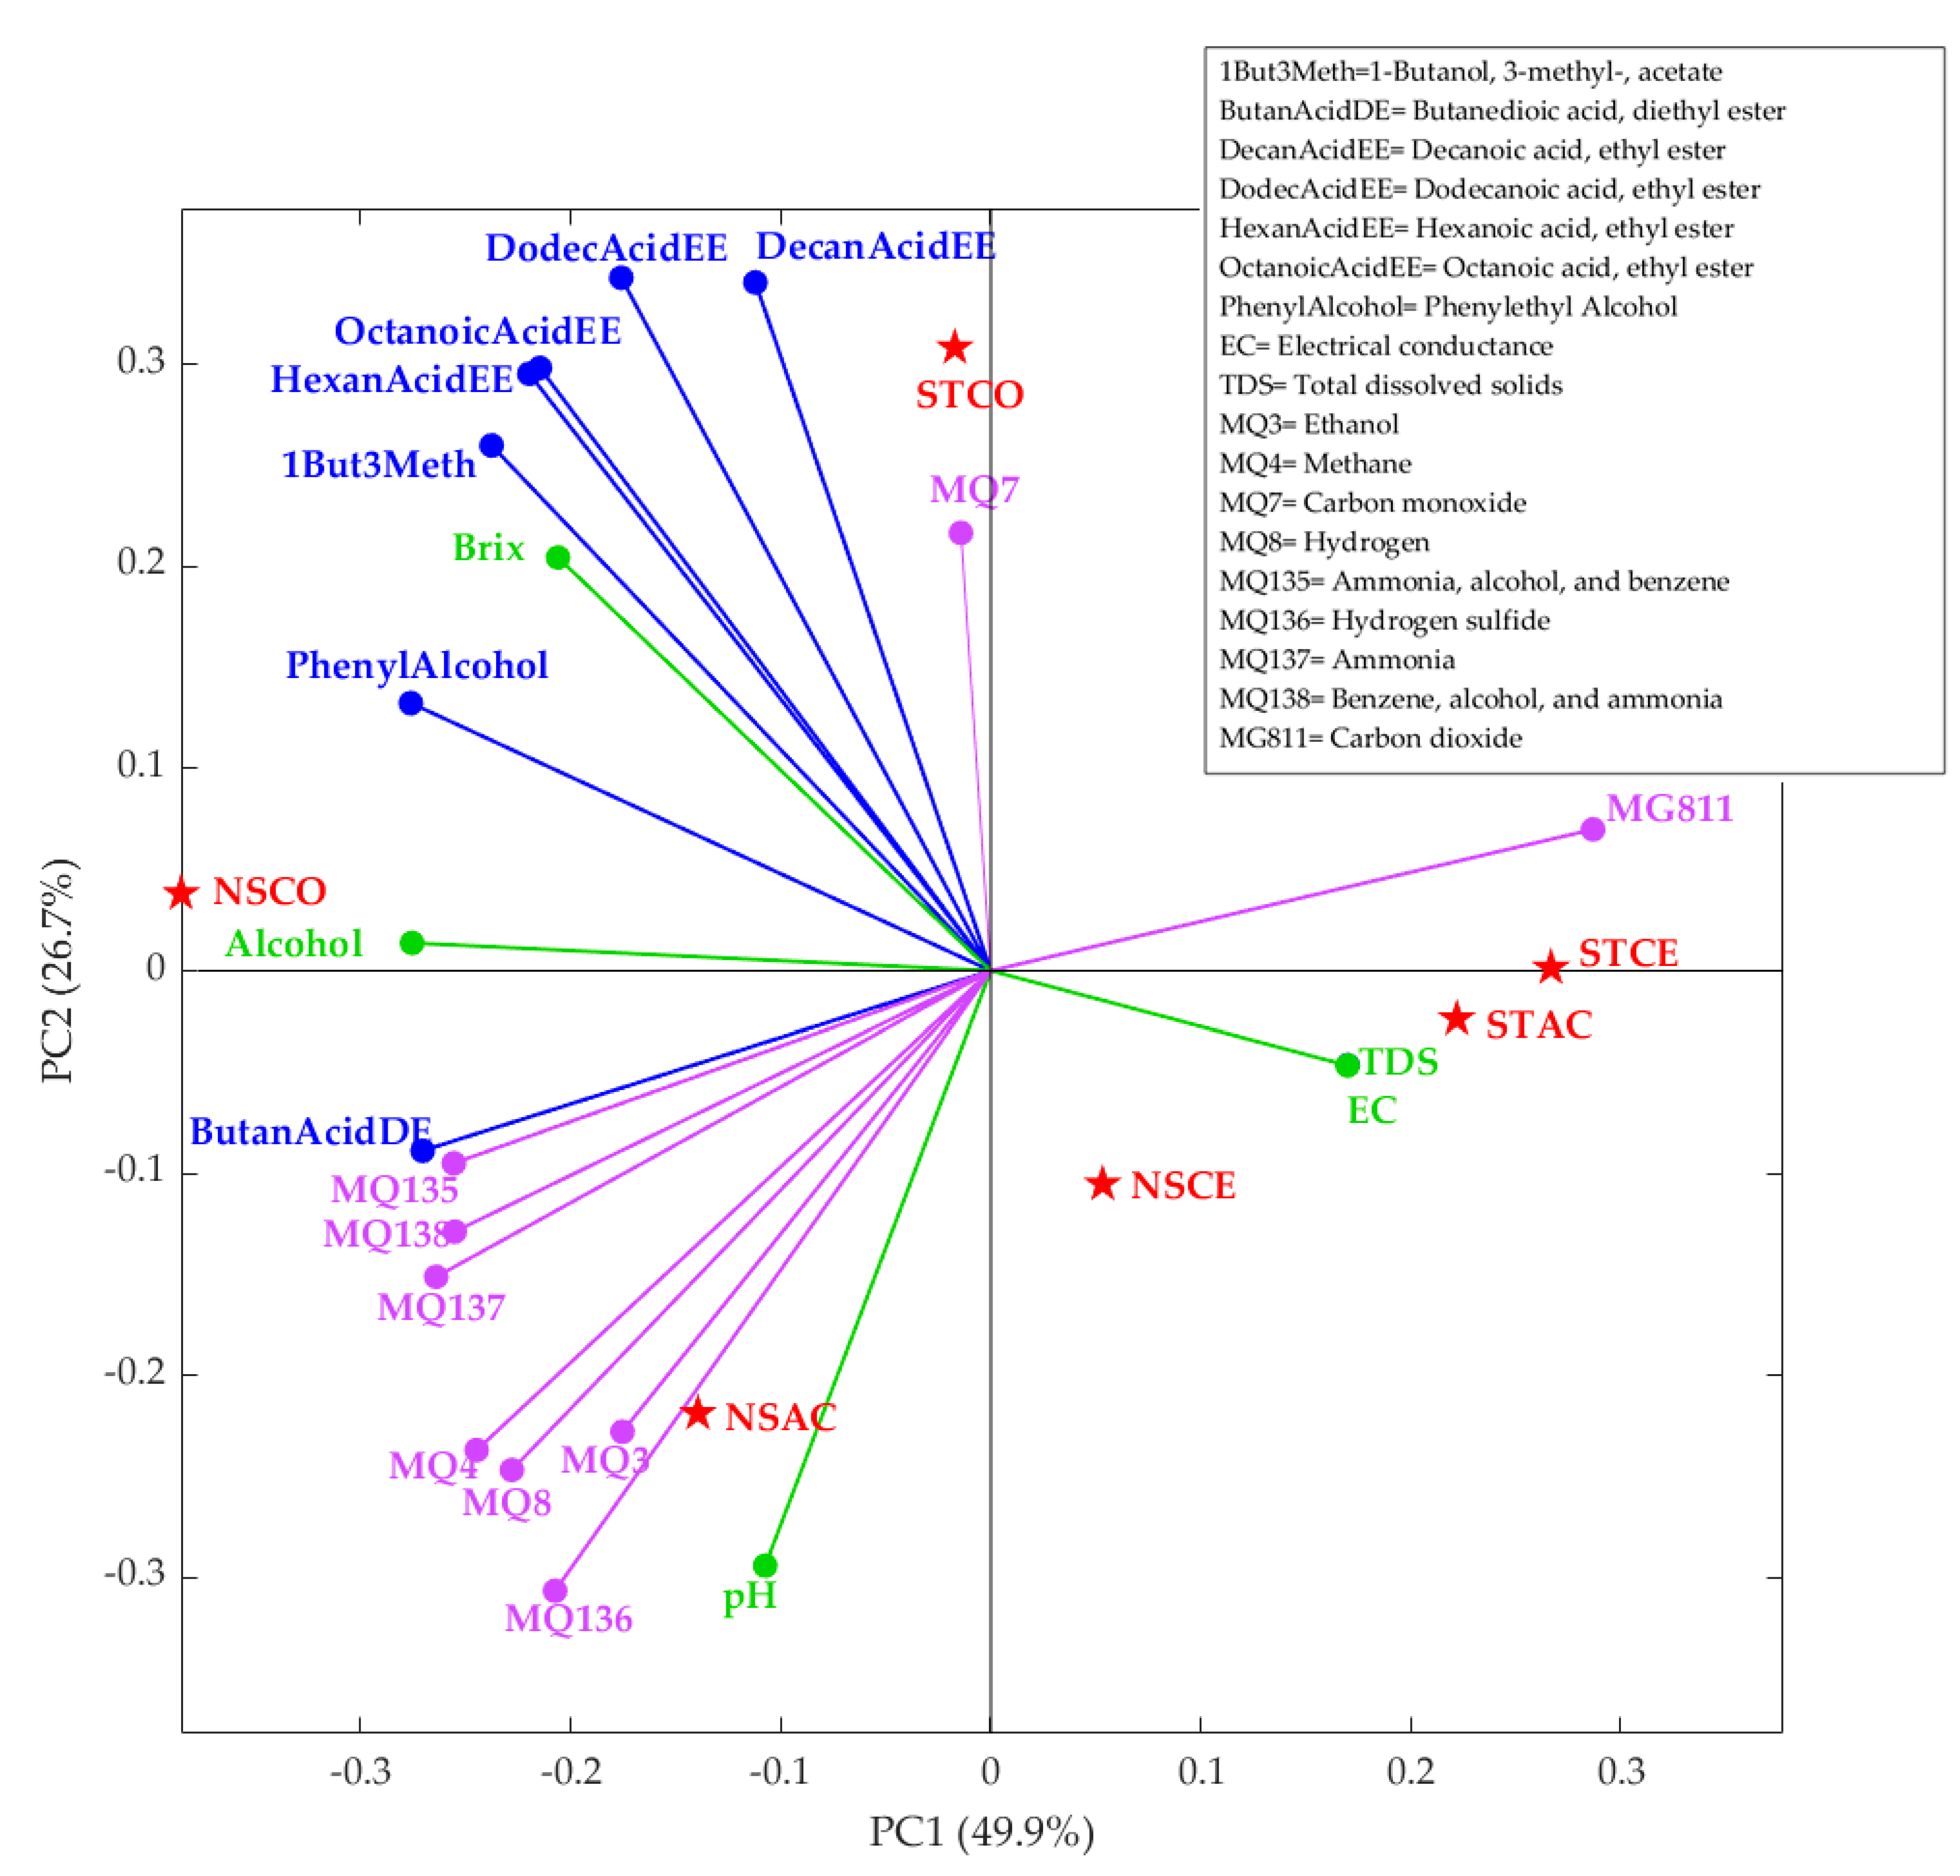
Figure 3 shows the PCA with data from the chemical measurements, volatile aromatic compounds and e-nose readings. Principal component one (PC1) accounted for 49.9% of the data variability, while principal component two (PC2) accounted for 26.7%. Therefore, the PCA accounted for a total of 76.6% of the data variability. From the factor loadings (FL), PC1 was primarily described by MG811 gas sensors (FL = 0.29), TDS (FL = 0.17) and EC (FL = 0.17) on the positive side of the axis and phenylethyl alcohol (FL = −0.28), alcohol content (FL = −0.28) and butanedioic acid, diethyl ester (FL = −0.27) on the negative side. On the other hand, PC2 was predominantly described by dodecanoic acid, ethyl ester (FL = 0.34), decanoic acid, ethyl ester (FL = 0.34) and octanoic acid, ethyl ester (FL = 0.30) on the positive side of the axis and MQ136 (FL = −0.31), pH (FL = −0.29) and MQ8 gas sensors (FL = −0.25) on the negative side. It can be observed that the smoked samples with amelioration treatments (STAC and STCE) were grouped with sample NSCE and associated with parameters such as CO2 (MG811), TDS and EC. Sample NSAC was associated with pH and sensors MQ136, MQ3, MQ8 and MQ4, while the non-smoked control sample NSCO was related with alcohol, phenylethyl alcohol and butanedioic acid, diethyl ester. On the other hand, the smoked control sample (STCO) was associated with sensor MQ7 and decanoic acid, ethyl ester.
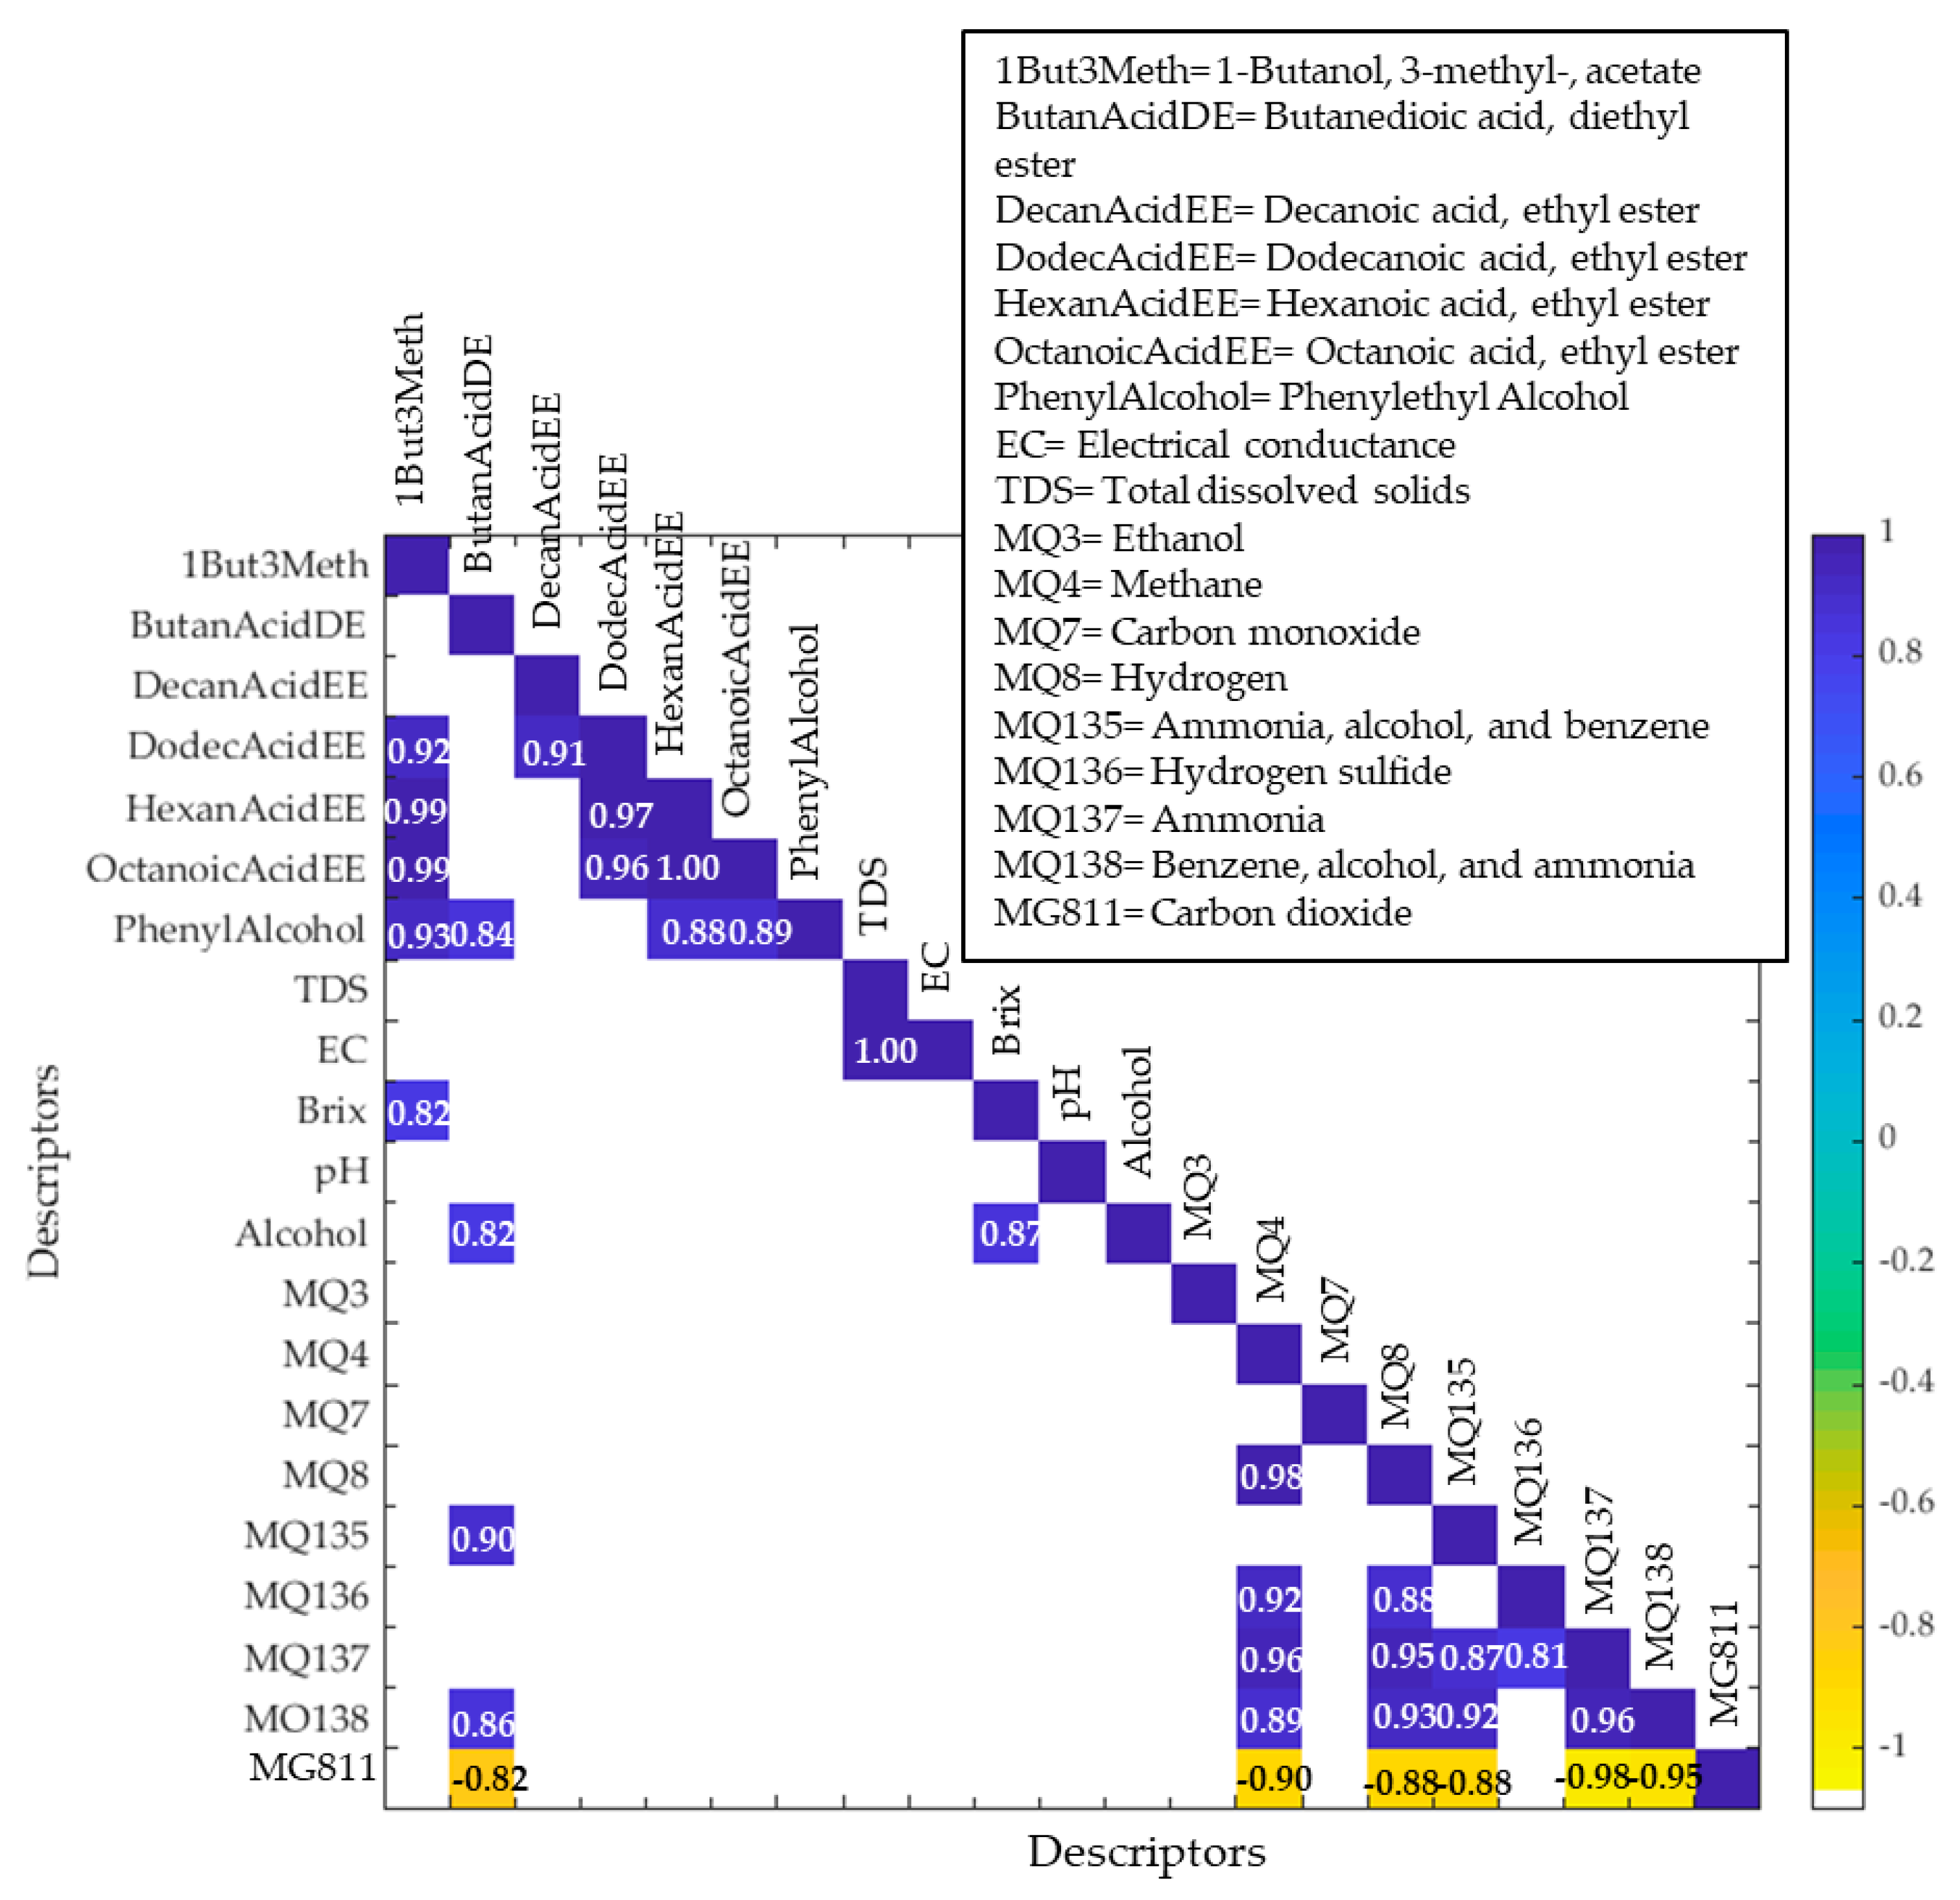
Figure 4 shows the significant correlations (p < 0.05) between the chemical measurements, volatile aroma compounds and e-nose outputs. From the matrix, positive correlations could be seen between 1-butanol, 3-methyl-, acetate and octanoic acid, ethyl ester (r = 0.9); hexanoic acid, ethyl ester (r = 0.99); phenylethyl alcohol (r = 0.93) and °Brix (r = 0.82), as well as between butanedioic acid, diethyl ester and the alcohol content (r = 0.82) and MQ135 gas sensor (r = 0.90). Negative correlations could be observed between the MG811 gas sensor and butanedioic acid, diethyl ester (r = −0.82) and MQ4 (r = −0.90), MQ8 (r = −0.88), MQ135 (r = −0.88), MQ137 (r = −0.98) and MQ138 (r = −0.95) gas sensors.

3.5. Artificial Neural Network Model

The statistical data for the machine learning model developed using the e-nose readings as inputs and the smoke taint amelioration treatments as targets are shown in Table 4. The model displayed a very high overall accuracy of 98% in classifying the e-nose readings according to the experimental treatments. There were no signs of under- or overfitting, as shown by the lower performance value for the training stage (MSE < 0.01) than that for the testing stage (MSE = 0.02).
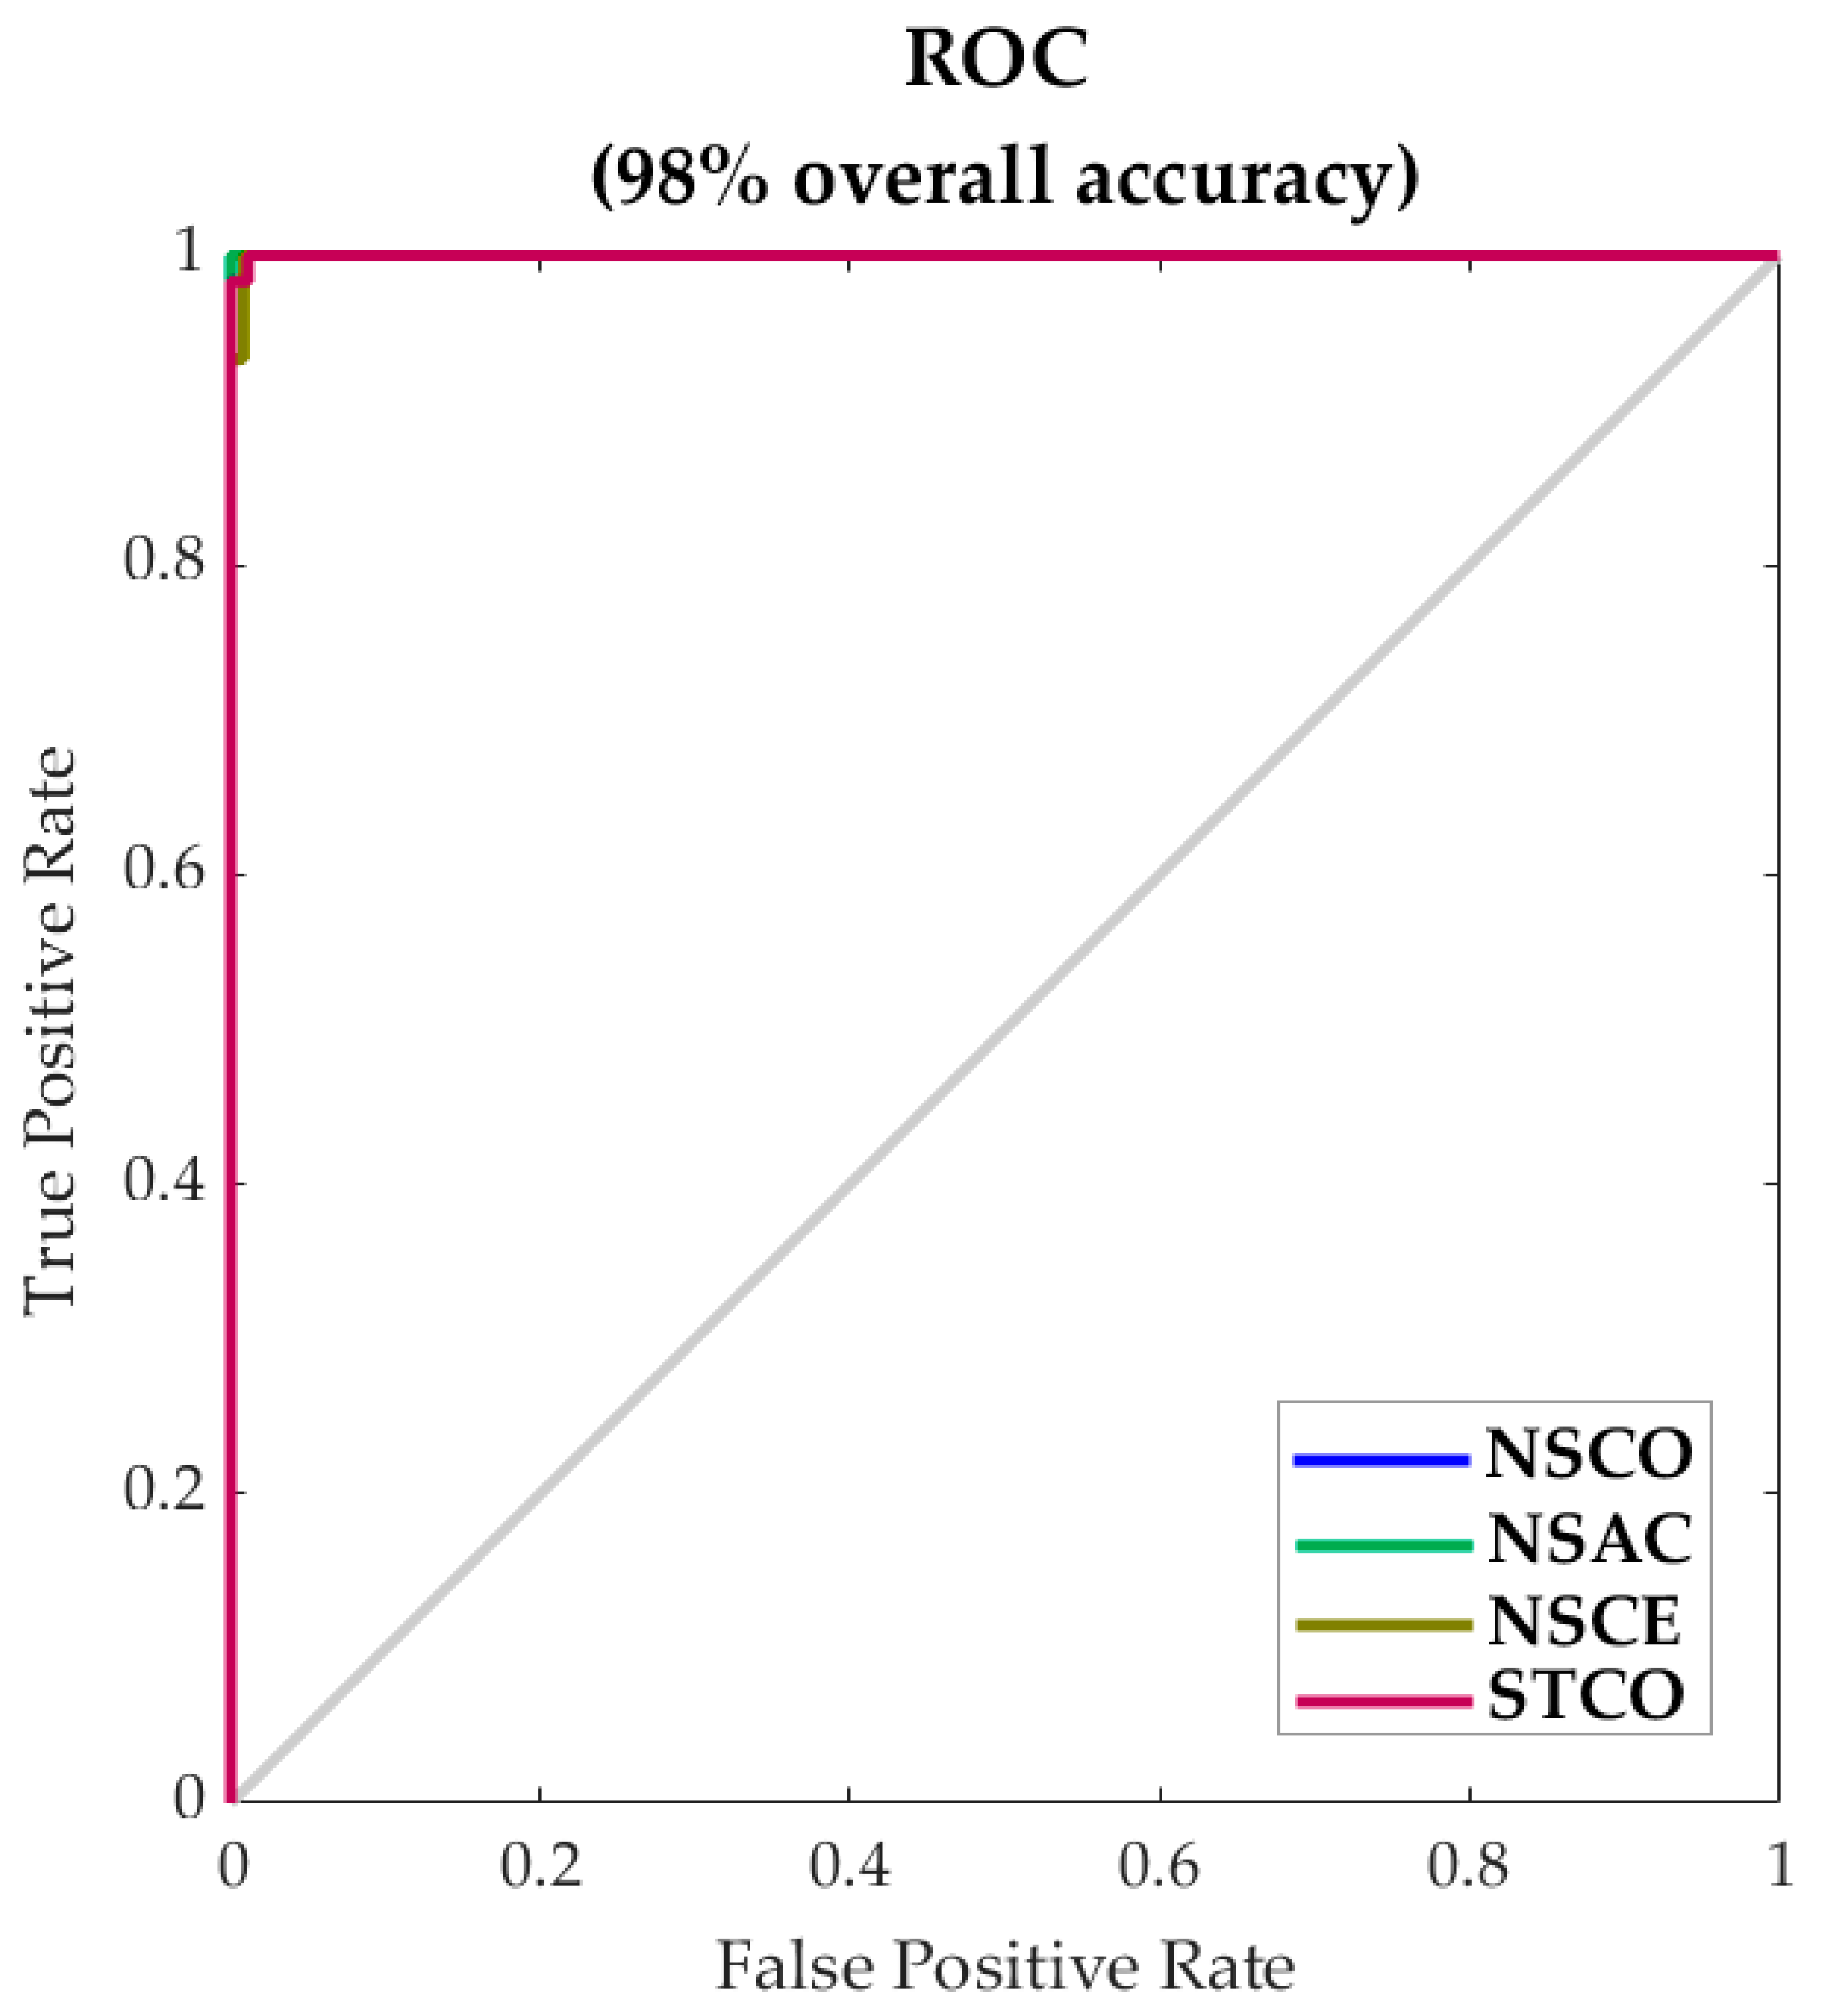
The receiver operating characteristic (ROC) curve shown in Figure 5 also showed high true-positive rates (sensitivity) and low false-positive rates (specificity) in classifying the e-nose readings according to the smoke taint amelioration treatments. The NSCO treatment had the highest sensitivity (100%), while the NSCE treatment had the lowest (93.3%).
The developed model was also used to classify the two remaining smoke taint amelioration treatments (STAC and STCE). The model showed that the amelioration treatments had 90% success, as they were classified within the non-smoked treatments (Table 5).

4. Discussion

The STAC and STCE wine samples had the highest mean values for TDS and EC, which may be a result of the bentonite treatment releasing minerals into the wine. Interestingly, the NSCO wine had the highest °Brix and alcohol contents. This is similar to the findings by Kennison et al. [3], who found that smoke exposure had an adverse effect on grape berry ripening and, hence, sugar accumulation, irrespective of the timing and duration of smoke exposure. It is, therefore, not surprising that the ST wine samples had lower °Brix and alcohol contents due to the long periods of smoke exposure associated with wildfire events that may have impacted the ripening of the grape berries. The activated carbon treatment did not appear to affect the pH of the smoke-tainted wines; however, it did appear to lower the pH of the non-smoke-tainted wines, potentially due to the adsorption of tartaric acid and malic acid [15].
As expected, the STCO and NSCO treatments exhibited higher mean values for the peak areas of the volatile aroma compounds (Table 3), and this was further highlighted by the PCA (Figure 3), which showed that these wine samples were associated with volatile aroma compounds, including phenylethyl alcohol and butanedioic acid, diethyl ester (NSCO) and decanoic acid, ethyl ester (STCO), as well as the correlation matrix illustrating the positive correlations between the aroma compounds (Figure 4). Activated carbon is a nonspecific fining agent and is, therefore, capable of removing positive aroma compounds in addition to those responsible for smoke taint [36,37,38]. However, research by Fudge et al. [15] found that a significant reduction of ‘smoke’ characters through treatment with activated carbon resulted in an increase in ‘fruit’ characters. Previous studies have found a negative correlation between the intensity of ‘smoke’ and ‘fruit’ aromas; thus, by reducing the negative ‘smoke’ characters, the positive ‘fruit’ characters may be enhanced [3,6,15]. Therefore, while treatment with activated carbon with/without the addition of a cleaving enzyme reduced the concentration of volatile aromatic compounds in smoke-tainted wines, the reduction in smoke-derived volatiles may help lead to a resurgence in the positive ‘fruit’ characters that were previously suppressed.
To date, traditional methods for assessing wine quality and the degree of smoke taint have involved the use of chromatographic techniques for the identification of aroma volatiles and trained panels [4,39,40,41]. However, there are several drawbacks to these techniques, as they can be time-consuming in terms of sample preparation, as well as training sensory experts, which is expensive, as chromatographic techniques require costly reagents and training, and maintaining trained panels can also be expensive, as well as being destructive in their forms of assessment. Furthermore, the results from sensory evaluations using human panels can be affected by physiological and psychological issues within the individuals, such as fatigue and decreased sensitivity to samples due to prolonged exposure [4,39,40,41]. Thus, the use of low-cost e-noses may offer a more cost-effective and accurate form of quality and smoke taint assessments. Previous research by Fuentes et al. [18] developed ANN models using readings from a low-cost e-nose as inputs to accurately predict the levels of volatile phenols and their glycoconjugates in grapes and wine, as well as a model predicting 12 consumer sensory responses towards the wine. The models developed in their study may offer grape growers a rapid and cost-effective technique for assessing smoke-tainted wines; however, the models have yet to be tested on wines that have undergone smoke taint amelioration techniques to assess the accuracy of the models following treatment with activated carbon.
The ANN model developed in this study showed high accuracy in classifying the e-nose readings according to the different smoke taint amelioration techniques applied. It may offer winemakers a rapid, cost-effective tool to assess the effectiveness of smoke taint amelioration by activated carbon with/without the addition of a cleaving enzyme. Furthermore, as this method is nondestructive, repeated measurements can be made to assess wine samples as they age over time. In addition to this, when the STCE enzyme e-nose readings were assessed using the model, most of the readings were classified as either NSCO or NSAC, illustrating that the enzyme treatment together with activated carbon was effective in ameliorating smoke taint. Previous research by Fudge et al. [15] found that treatment with activated carbon alone was effective in removing smoke-derived volatile phenols; however, it did not remove their glycoconjugates. Therefore, the hydrolysis of these glycoconjugates over time may result in a resurgence of smoke aromas. The work by Herderich and Krstic [42] found that the treatment of smoke-affected Pinot Noir wine with a glucosidase enzyme reduced the concentrations of six glycosides by approximately 50%. Thus, combining the use of cleaving enzymes with activated carbon may enhance smoke taint amelioration by removing a significant amount of glycoconjugates and, therefore, delay the resurgence of smoke aromas as the wine ages. Further research is required to assess the exact levels of the glycoconjugates in the final wine samples.

5. Conclusions

The use of an electronic nose coupled with machine learning modeling can offer winemakers a cost-effective and rapid technique for assessing the effectiveness of smoke taint amelioration treatment by activated carbon with/without the addition of a cleaving enzyme without requiring the use of a trained sensory panel. Related to the latter, further advantages are in the repeatability of the integrated hardware (e-nose) and software (AI), which allows the monitoring of multiple batches at the same time by integrating local analytical microprocessors (e.g., Jetson ® from NVIDIA®). Furthermore, the use of a cleaving enzyme can enhance smoke taint amelioration by removing a significant proportion of glycoconjugates, thereby delaying the resurgence of smoke aromas and maintaining the value of the wine for a longer period. The integrated system proposed could offer winemakers a near-real-time system to assess the effect of treatments on microbrewing for decision-making purposes to manage the smoke taint in wines.

Author Contributions

Conceptualization, V.S., S.F. and C.G.V.; methodology, V.S.; formal analysis, V.S. and C.G.V.; investigation, V.S. and C.G.V.; software, C.G.V. and S.F.; resources, S.F; data curation, V.S and C.G.V.; writing—original draft preparation, V.S.; writing—review and editing, C.G.V., A.P., D.D.T., V.S. and S.F.; visualization, V.S.; supervision, S.F., A.P. and D.D.T.; validation, C.G.V., V.S. and S.F.; project administration, S.F. and funding acquisition, S.F. All authors have read and agreed to the published version of the manuscript.

Funding

This research was supported through the Australian Government Research Training Program Scholarship.

Institutional Review Board Statement

Not applicable.

Informed Consent Statement

Not applicable.

Data Availability Statement

The data and intellectual property belong to The University of Melbourne; any sharing needs to be evaluated and approved by the university.

Acknowledgments

The authors greatly acknowledge Brown Brothers Winemakers and Wendy Cameron for organizing and supplying the wine samples and Enologica Vason for supplying the compounds for this research. The authors would like to acknowledge Ranjith R. Unnithan and Bryce Widdicombe from the School of Engineering, Department of Electrical and Electronic Engineering of The University of Melbourne for their collaboration in the electronic nose development.

Conflicts of Interest

The authors declare no conflict of interest.

References

  1. Pardo-Garcia, A.; Wilkinson, K.; Culbert, J.; Lloyd, N.; Alonso, G.; Salinas, M.R. Accumulation of guaiacol glycoconjugates in fruit, leaves and shoots of vitis vinifera cv. Monastrell following foliar applications of guaiacol or oak extract to grapevines. Food Chem. 2017, 217, 782–789. [Google Scholar] [CrossRef]
  2. van der Hulst, L.; Munguia, P.; Culbert, J.A.; Ford, C.M.; Burton, R.A.; Wilkinson, K.L. Accumulation of volatile phenol glycoconjugates in grapes following grapevine exposure to smoke and potential mitigation of smoke taint by foliar application of kaolin. Planta 2019, 249, 941–952. [Google Scholar] [CrossRef] [PubMed]
  3. Kennison, K.; Wilkinson, K.; Pollnitz, A.; Williams, H.; Gibberd, M. Effect of timing and duration of grapevine exposure to smoke on the composition and sensory properties of wine. Aust. J. Grape Wine Res. 2009, 15, 228–237. [Google Scholar] [CrossRef]
  4. Summerson, V.; Gonzalez Viejo, C.; Torrico, D.D.; Pang, A.; Fuentes, S. Detection of smoke-derived compounds from bushfires in cabernet-sauvignon grapes, must, and wine using near-infrared spectroscopy and machine learning algorithms. OENO One 2020, 54, 1105–1119. [Google Scholar] [CrossRef]
  5. Hayasaka, Y.; Baldock, G.; Pardon, K.; Jeffery, D.; Herderich, M. Investigation into the formation of guaiacol conjugates in berries and leaves of grapevine vitis vinifera l. Cv. Cabernet sauvignon using stable isotope tracers combined with hplc-ms and ms/ms analysis. J. Agric. Food Chem. 2010, 58, 2076–2081. [Google Scholar] [CrossRef]
  6. Ristic, R.; Osidacz, P.; Pinchbeck, K.; Hayasaka, Y.; Fudge, A.; Wilkinson, K. The effect of winemaking techniques on the intensity of smoke taint in wine. Aust. J. Grape Wine Res. 2011, 17, S29–S40. [Google Scholar] [CrossRef]
  7. Ristic, R.; van der Hulst, L.; Capone, D.; Wilkinson, K. Impact of bottle aging on smoke-tainted wines from different grape cultivars. J. Agric. Food Chem. 2017, 65, 4146–4152. [Google Scholar] [CrossRef]
  8. Kennison, K.; Gibberd, M.; Pollnitz, A.; Wilkinson, K. Smoke-derived taint in wine: The release of smoke-derived volatile phenols during fermentation of merlot juice following grapevine exposure to smoke. J. Agric. Food Chem. 2008, 56, 7379–7383. [Google Scholar] [CrossRef]
  9. Mayr, C.M.; Parker, M.; Baldock, G.A.; Black, C.A.; Pardon, K.H.; Williamson, P.O.; Herderich, M.J.; Francis, I.L. Determination of the importance of in-mouth release of volatile phenol glycoconjugates to the flavor of smoke-tainted wines. J. Agric. Food Chem. 2014, 62, 2327–2336. [Google Scholar] [CrossRef]
  10. Parker, M.; Osidacz, P.; Baldock, G.A.; Hayasaka, Y.; Black, C.A.; Pardon, K.H.; Jeffery, D.W.; Geue, J.P.; Herderich, M.J.; Francis, I.L. Contribution of several volatile phenols and their glycoconjugates to smoke-related sensory properties of red wine. J. Agric. Food Chem. 2012, 60, 2629–2637. [Google Scholar] [CrossRef]
  11. Summerson, V.; Gonzalez Viejo, C.; Pang, A.; Torrico, D.D.; Fuentes, S. Review of the effects of grapevine smoke exposure and technologies to assess smoke contamination and taint in grapes and wine. Beverages 2021, 7, 7. [Google Scholar] [CrossRef]
  12. Szeto, C.; Ristic, R.; Capone, D.; Puglisi, C.; Pagay, V.; Culbert, J.; Jiang, W.; Herderich, M.; Tuke, J.; Wilkinson, K. Uptake and glycosylation of smoke-derived volatile phenols by cabernet sauvignon grapes and their subsequent fate during winemaking. Molecules 2020, 25, 3720. [Google Scholar] [CrossRef]
  13. Favell, J.W.; Noestheden, M.; Lyons, S.-M.; Zandberg, W.F. Development and evaluation of a vineyard-based strategy to mitigate smoke-taint in wine grapes. J. Agric. Food Chem. 2019, 67. [Google Scholar] [CrossRef]
  14. Fudge, A.; Ristic, R.; Wollan, D.; Wilkinson, K. Amelioration of smoke taint in wine by reverse osmosis and solid phase adsorption. Aust. J. Grape Wine Res. 2011, 17, S41–S48. [Google Scholar] [CrossRef]
  15. Fudge, A.; Schiettecatte, M.; Ristic, R.; Hayasaka, Y.; Wilkinson, K. Amelioration of smoke taint in wine by treatment with commercial fining agents. Aust. J. Grape Wine Res. 2012, 18, 302–307. [Google Scholar] [CrossRef]
  16. Kelly, D.; Zerihun, A. The effect of phenol composition on the sensory profile of smoke affected wines. Molecules 2015, 20, 9536–9549. [Google Scholar] [CrossRef] [PubMed] [Green Version]
  17. Zhao, P.; Qian, Y.; He, F.; Li, H.; Qian, M. Comparative characterization of aroma compounds in merlot wine by lichrolut-en-based aroma extract dilution analysis and odor activity value. Chemosens. Percept. 2017, 10, 149–160. [Google Scholar] [CrossRef]
  18. Fuentes, S.; Summerson, V.; Gonzalez Viejo, C.; Tongson, E.; Lipovetzky, N.; Wilkinson, K.L.; Szeto, C.; Unnithan, R.R. Assessment of smoke contamination in grapevine berries and taint in wines due to bushfires using a low-cost e-nose and an artificial intelligence approach. Sensors 2020, 20, 5108. [Google Scholar] [CrossRef]
  19. Wilson, A.D. Diverse applications of electronic-nose technologies in agriculture and forestry. Sensors 2013, 13, 2295–2348. [Google Scholar] [CrossRef] [PubMed] [Green Version]
  20. Chen, Q.; Chen, Z.; Liu, D.; He, Z.; Wu, J. Constructing an e-nose using metal-ion-induced assembly of graphene oxide for diagnosis of lung cancer via exhaled breath. ACS Appl. Mater. Interfaces 2020, 12, 17713–17724. [Google Scholar] [CrossRef]
  21. Lekha, S.; Suchetha, M. Recent advancements and future prospects on e-nose sensors technology and machine learning approaches for non-invasive diabetes diagnosis: A review. IEEE Rev. Biomed. Eng. 2020, 14. [Google Scholar] [CrossRef]
  22. Gamboa, J.C.R.; da Silva, A.J.; de Andrade Lima, L.L.; Ferreira, T.A. Wine quality rapid detection using a compact electronic nose system: Application focused on spoilage thresholds by acetic acid. LWT 2019, 108, 377–384. [Google Scholar] [CrossRef] [Green Version]
  23. Mu, F.; Gu, Y.; Zhang, J.; Zhang, L. Milk source identification and milk quality estimation using an electronic nose and machine learning techniques. Sensors 2020, 20, 4238. [Google Scholar] [CrossRef] [PubMed]
  24. Nimsuk, N. Improvement of accuracy in beer classification using transient features for electronic nose technology. J. Food Meas. Charact. 2019, 13, 656–662. [Google Scholar] [CrossRef]
  25. Xu, J.; Liu, K.; Zhang, C. Electronic nose for volatile organic compounds analysis in rice aging. Trends Food Sci. Technol. 2021, 109. [Google Scholar] [CrossRef]
  26. Zarezadeh, M.R.; Aboonajmi, M.; Varnamkhasti, M.G.; Azarikia, F. Olive oil classification and fraud detection using e-nose and ultrasonic system. Food Anal. Methods 2021, 1–12. [Google Scholar] [CrossRef]
  27. Antolini, A.; Forniti, R.; Modesti, M.; Bellincontro, A.; Catelli, C.; Mencarelli, F. First application of ozone postharvest fumigation to remove smoke taint from grapes. Ozone Sci. Eng. 2020, 1–9. [Google Scholar] [CrossRef]
  28. Viejo, C.G.; Fuentes, S.; Godbole, A.; Widdicombe, B.; Unnithan, R.R. Development of a low-cost e-nose to assess aroma profiles: An artificial intelligence application to assess beer quality. Sens. Actuators B Chem. 2020, 308, 127688. [Google Scholar] [CrossRef]
  29. Gonzalez Viejo, C.; Tongson, E.; Fuentes, S. Integrating a low-cost electronic nose and machine learning modelling to assess coffee aroma profile and intensity. Sensors 2021, 21, 2016. [Google Scholar] [CrossRef]
  30. Gonzalez Viejo, C.; Fuentes, S.; Torrico, D.D.; Godbole, A.; Dunshea, F.R. Chemical characterization of aromas in beer and their effect on consumers liking. Food Chem. 2019, 293, 479–485. [Google Scholar] [CrossRef] [PubMed]
  31. Gonzalez Viejo, C.; Torrico, D.D.; Dunshea, F.R.; Fuentes, S. Development of artificial neural network models to assess beer acceptability based on sensory properties using a robotic pourer: A comparative model approach to achieve an artificial intelligence system. Beverages 2019, 5, 33. [Google Scholar] [CrossRef] [Green Version]
  32. Arcari, S.G.; Caliari, V.; Sganzerla, M.; Godoy, H.T. Volatile composition of merlot red wine and its contribution to the aroma: Optimization and validation of analytical method. Talanta 2017, 174, 752–766. [Google Scholar] [CrossRef]
  33. Issa-Issa, H.; Noguera-Artiaga, L.; Sendra, E.; Pérez-López, A.J.; Burló, F.; Carbonell-Barrachina, Á.A.; López-Lluch, D. Volatile composition, sensory profile, and consumers’ acceptance of fondillón. J. Food Qual. 2019, 2019. [Google Scholar] [CrossRef] [Green Version]
  34. Ayestarán, B.; Martínez-Lapuente, L.; Guadalupe, Z.; Canals, C.; Adell, E.; Vilanova, M. Effect of the winemaking process on the volatile composition and aromatic profile of tempranillo blanco wines. Food Chem. 2019, 276, 187–194. [Google Scholar] [CrossRef] [PubMed]
  35. Viejo, C.G.; Fuentes, S. Beer aroma and quality traits assessment using artificial intelligence. Fermentation 2020, 6, 56. [Google Scholar] [CrossRef]
  36. Filipe-Ribeiro, L.; Milheiro, J.; Matos, C.C.; Cosme, F.; Nunes, F.M. Reduction of 4-ethylphenol and 4-ethylguaiacol in red wine by activated carbons with different physicochemical characteristics: Impact on wine quality. Food Chem. 2017, 229, 242–251. [Google Scholar] [CrossRef]
  37. Krstic, M.; Johnson, D.; Herderich, M. Review of smoke taint in wine: Smoke-derived volatile phenols and their glycosidic metabolites in grapes and vines as biomarkers for smoke exposure and their role in the sensory perception of smoke taint. Aust. J. Grape Wine Res. 2015, 21, 537–553. [Google Scholar] [CrossRef]
  38. Mirabelli-Montan, Y.A.; Marangon, M.; Graça, A.; Mayr Marangon, C.M.; Wilkinson, K.L. Techniques for mitigating the effects of smoke taint while maintaining quality in wine production: A review. Molecules 2021, 26, 1672. [Google Scholar] [CrossRef]
  39. Han, F.; Zhang, D.; Aheto, J.H.; Feng, F.; Duan, T. Integration of a low-cost electronic nose and a voltammetric electronic tongue for red wines identification. Food Sci. Nutr. 2020, 8, 4330–4339. [Google Scholar] [CrossRef] [PubMed]
  40. Sherman, E.; Harbertson, J.F.; Greenwood, D.R.; Villas-Bôas, S.G.; Fiehn, O.; Heymann, H. Reference samples guide variable selection for correlation of wine sensory and volatile profiling data. Food Chem. 2018, 267, 344–354. [Google Scholar] [CrossRef] [PubMed]
  41. Summerson, V.; Gonzalez Viejo, C.; Szeto, C.; Wilkinson, K.L.; Torrico, D.D.; Pang, A.; Bei, R.D.; Fuentes, S. Classification of smoke contaminated cabernet sauvignon berries and leaves based on chemical fingerprinting and machine learning algorithms. Sensors 2020, 20, 5099. [Google Scholar] [CrossRef] [PubMed]
  42. Herderich, M.; Krstic, M. Mitigation of Climate Change Impacts on the National Wine Industry by Reduction in Losses from Controlled Burns and Wildfires and Improvement in Public Land Management. Available online: https://www.awri.com.au/research_and_development/2017-2025-rde-plan-projects/project-3-4-3/ (accessed on 5 June 2021).
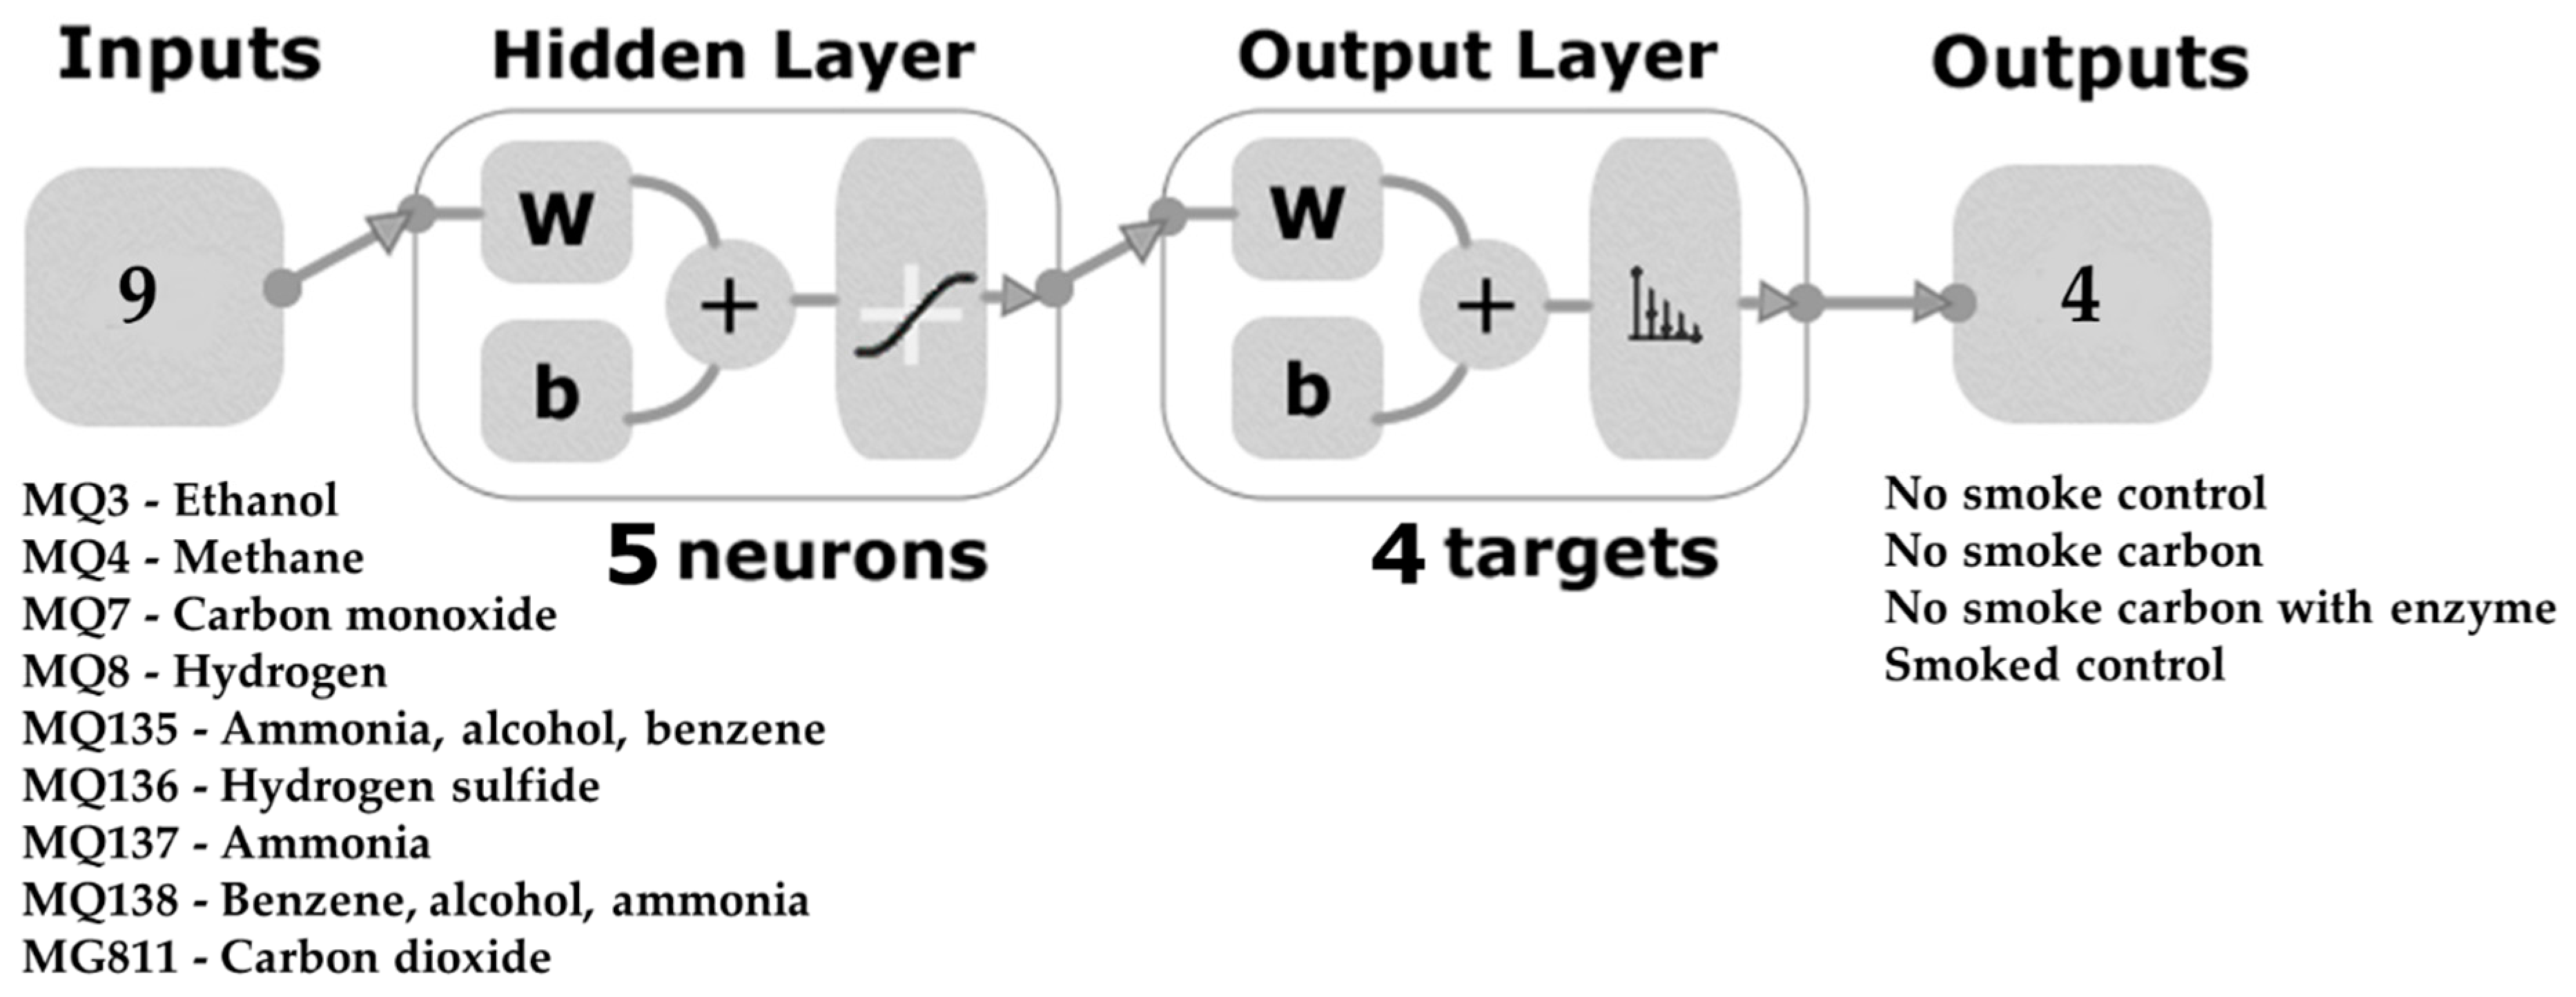
Figure 1. Two-layer feed-forward network with five hidden neurons and sigmoid function to classify wine samples according to the type of smoke taint amelioration treatment applied and smoke taint status (smoked or unsmoked). Abbreviations: w: weights; b: bias.
Fermentation 07 00119 g001
Figure 2. Stacked mean values of the electronic nose outputs showing the letters of significance from the ANOVA and Fisher’s least significant difference (LSD) post hoc test (p < 0.05; α = 0.05). Differences between samples are compared for each sensor (bar colors). Abbreviations: NSAC: non-smoke-tainted wine with activated carbon treatment, NSCE = non-smoke-tainted wine with enzyme and activated carbon treatment, NSCO = control non-smoke-tainted wine, STAC = smoke-tainted wine with activated carbon treatment, STCE = smoke-tainted wine with enzyme and activated carbon treatment and STCO = control smoke-tainted wine.
Fermentation 07 00119 g002
Figure 3. Principal component analysis showing the chemical measurements (blue), e-nose readings (purple) and volatile aromatic compounds (green). Abbreviations: NSAC = non-smoke-tainted wine with activated carbon treatment, NSCE = non-smoke-tainted wine with enzyme and activated carbon treatment, NSCO = control non-smoke-tainted wine, STAC = smoke-tainted wine with activated carbon treatment, STCE = smoke-tainted wine with enzyme and activated carbon treatment, STCO = control smoke-tainted wine and PC = principal component. Red stars in the figure depict the samples.
Fermentation 07 00119 g003
Figure 4. Matrix showing the significant (p < 0.05) correlations between the chemical measurements, volatile aroma compounds and e-nose readings. Color bar: the blue side depicts the positive correlations, while the yellow side depicts the negative correlations. Darker blue and yellow colors denote higher correlations.
Fermentation 07 00119 g004
Figure 5. Receiver operating characteristic (ROC) curve for the machine learning model developed. Abbreviations: NSAC = non-smoke-tainted wine with activated carbon treatment, NSCE = non-smoke-tainted wine with enzyme and activated carbon treatment, NSCO = control non-smoke-tainted wine and STCO = control smoke-tainted wine.
Fermentation 07 00119 g005
Table 1. Sensors integrated in the electronic nose and the gases to which they are sensitive.
Sensor *Gases
MQ3Ethanol
MQ4Methane
MQ7Carbon monoxide
MQ8Hydrogen
MQ135Ammonia, alcohol, and benzene
MQ136Hydrogen sulfide
MQ137Ammonia
MQ138Benzene, alcohol, and ammonia
MG811Carbon dioxide
* All sensors were manufactured by Henan Hanwei Electronics Co., Ltd., Zhengzhou, China.
Table 2. Results from the chemical measurements.
SampleTDS (ppm)EC (µs cm−1)°BrixpHAlcohol (%)
MeanSEMeanSEMeanSEMeanSEMeanSE
NSAC700.00 bc±24.801489.00 bc±52.705.23 c±0.033.73 b±0.0310.70 c±0.04
NSCE665.70 c±16.801415.70 c±35.605.80 b±0.003.87 a±0.0711.34 b±0.01
NSCO727.00 b±8.081546.30 b±17.406.00 a±0.003.63 b±0.0312.18 a±0.02
STAC802.50 a±1.431706.80 a±2.995.15 cd±0.033.48 c±0.039.64 d±0.10
STCE832.00 a±6.431769.80 a±13.705.09 d±0.053.48 c±0.029.41 d±0.13
STCO670.30 c±16.501425.50 c±35.205.90 ab±0.033.43 c±0.0210.76 c±0.08
Abbreviations: NSAC = non-smoke-tainted wine with activated carbon treatment, NSCE = non-smoke-tainted wine with enzyme and activated carbon treatment, NSCO = control non-smoke-tainted wine, STAC = smoke-tainted wine with activated carbon treatment, STCE = smoke-tainted wine with enzyme and activated carbon treatment, STCO = control smoke-tainted wine and SE = standard error. Means followed by different letters are significantly different based on Fisher’s least significant difference (LSD) post hoc test (α = 0.05).
Table 3. Mean values of the peak areas for the volatile aroma compounds detected from the GC-MS analysis (top) and their standard error (bottom), as well as their aroma descriptions and retention times. All values are in scientific notation 105.
Volatile Aromatic
Compound
Odor DescriptionRT (min)NSACNSCENSCOSTACSTCESTCO
1-Butanol, 3-methyl-, acetateBanana, pear, alcohol13.673.97 c4.03 c23.88 a1.81 d2.51 cd18.04b
±0.03±0.01±0.20±0.63±0.62±0.42
Butanedioic acid, diethyl esterFruity, grape, wine [32,33]19.181.71 b1.37 b4.74 a00.30 b0
±0.09±0.02±2.650±0.100
Decanoic acid, ethyl esterApple, grape, sweet, brandy, waxy [32,33,34,35]23.0275.95 b10.33 b119.21 b35.68 b1.74 b326.15 a
±35.12±2.70±119.21±18.30±0.24±68.10
Dodecanoic acid, ethyl esterfloral, waxy, soap [32,35]26.337.61 b2.01 b49.33 a8.36 b1.96 b63.87 a
±2.71±0.31±12.87±2.56±0.18±6.17
Hexanoic acid, ethyl esterSweet, fruity, wine [17,32,33,34]16.414.90 c12.21 c90.43 a7.74 d7.35 d83.60 b
±0.08±0.12±0.78±0.57±1.00±0.81
Octanoic acid, ethyl esterFruity, banana, sweet, apple, pineapple [17,34,35]19.7215.88 b9.47 b347.84 a13.08b6.35 b361.81 a
±1.87±0.36±32.08±6.11±0.89±26.41
Phenylethyl alcoholRose, honey, floral [33,35]18.933.11 c1.25 cd16.27 a0.25 d06.21b
±0.53±0.63±1.88±0.250±0.19
Abbreviations: NSAC: non-smoke-tainted wine with activated carbon treatment, NSCE = non-smoke-tainted wine with enzyme and activated carbon treatment, NSCO = control non-smoke-tainted wine, STAC = smoke-tainted wine with activated carbon treatment, STCE = smoke-tainted wine with enzyme and activated carbon treatment, STCO = control smoke-tainted wine and RT = retention time. Means followed by different letters are significantly different based on Fisher’s least significant difference (LSD) post hoc test.
Table 4. Statistical results for the artificial neural network pattern recognition model developed. Performance is based on the mean squared error (MSE).
StageNumber of SamplesAccuracy
(%)
Error
(%)
Performance
(MSE)
Training901000<0.01
Testing609550.02
Overall150982-
- Not applicable.
Table 5. Classification rates for the STCE and STAC treatments according to the machine learning model developed, with an overall success of 90%.
Amelioration Treatments
STCESTAC
Classification ratesNSCO2018
NSAC2217
NSCE31
STCO54
Abbreviations: NSAC = non-smoke-tainted wine with activated carbon treatment, NSCE = non-smoke-tainted wine with enzyme and activated carbon treatment, NSCO = control non-smoke-tainted wine, STAC = smoke-tainted wine with activated carbon treatment, STCE = smoke-tainted wine with enzyme and activated carbon treatment and STCO = control smoke-tainted wine.
Publisher’s Note: MDPI stays neutral with regard to jurisdictional claims in published maps and institutional affiliations.