The initial M
w.b. of S-1 was reduced from 39.4% to 37.7%, while S-2 was reduced from 37.5% to 36.5%, respectively. For spruce wood, the M
w.b. achieved was similar to that reported by Laurila et al. [
28], although the initial M
w.b. was higher (63%). The M
w.b. of poplar wood was initially 53.4%, which was reduced to 48.3% by the mechanical dewatering press resulting in both the highest M
w.b. before pressing and the most pronounced M
w.b. reduction (ΔM). Still, the compression efficiency must be considered low compared to other trials with the dewatering press observed in previous experiments (data not shown). Thereby, PW accumulations between 1000 and 2000 L/h were observed for wet sawdust-like particles during compression (according to observations of the plant operator) with a ΔM of up to 15%
w.b. on an industrial scale. These reduction efficiencies could not be observed in the mechanical dewatering processes carried out during this study. In case of both spruce samples, this could be due to the basic characteristics as presented in
Table 2. Freshly harvested wood can reach drastically higher M
w.b. of >40 to 55 wt% [
3,
16,
18,
45]. At the same time, particle size might affect the dewatering process with smaller particles, probably leading to an overall better compressibility. In addition, all compression experiments were executed with the same settings of the mechanical dewatering press. An optimization of machine settings such as throughput rate or pressure intensity could lead to different ΔM for different wood species, approximating the respective fiber saturation points. Thus, the mechanical dewatering might deliver better values for ΔM in practice while simultaneously producing larger amounts of PW. The PW quality might be directly affected by these variations regarding its mixing ratio of water, its content of soluble compounds and with regard to the resulting DM concentration.
For example, Liu and Haygreen [
26] pressed five different wood species in the form of wood chips and hammer milled chips with pressures ranging from 3.5 to 13.8 MPa. They found significant differences in terms of achieved drying rates by size of the particles, density of the chips and species. The M
w.b. reduction was highest within the first 2 min of the highest pressures (13.8 MPa) while pressing relatively low-density species (aspen, balsam fir, jack pine, red maple and red oak). Yoshida et al. [
27] used pressures of 10–30 MPa in a two staged roller compression apparatus, discovering significantly lower energy requirements (60–70% of the primary energy required for thermal drying alone) to dry cypress wood chips with initial M
w.b. of 61 wt% to values of 17 wt% in combined drying (first compression, followed by thermal drying). Through mechanical compression, the M
w.b. was decreased from 50–73 wt% to 46–57 wt% depending on the wood type and depending on the initial M
w.b.. Laurila et al. [
28] investigated the compression drying of energy wood in the form of sawdust in a cylindrical vessel with horizontal pressure from above (6–38 MPa). They only found a small influence of pressure time, while the absolute pressure levels had the most influence on M
w.b.. In this case, the resulting M
w.b. were 30 wt% for birch, 34 wt% for pine and 35 wt% for spruce. They highlighted the lower energy demand of the process compared to conventional thermal drying. Stahl and Bentz [
29] applied pressures of up to 10 MPa through gas inside a pressure chamber to wood planks. They were able to approximate to the fiber saturation point by repeating their process several times. Frodeson et al. [
30] recently investigated an industrial scale dewatering press in combination with a packed moving bed dryer. For a combined drying of sawdust from 52 to 12.5 wt% M
w.b., a reduction of thermal energy requirements of 50% was observed.
Thus, the achieved values for ΔM in this study might have influenced the characteristics of the resulting PW and must therefore be considered when evaluating the results as presented in the following sections.
3.1. Basic Characteristics of Wood Press Waters and Digested Sewage Sludge
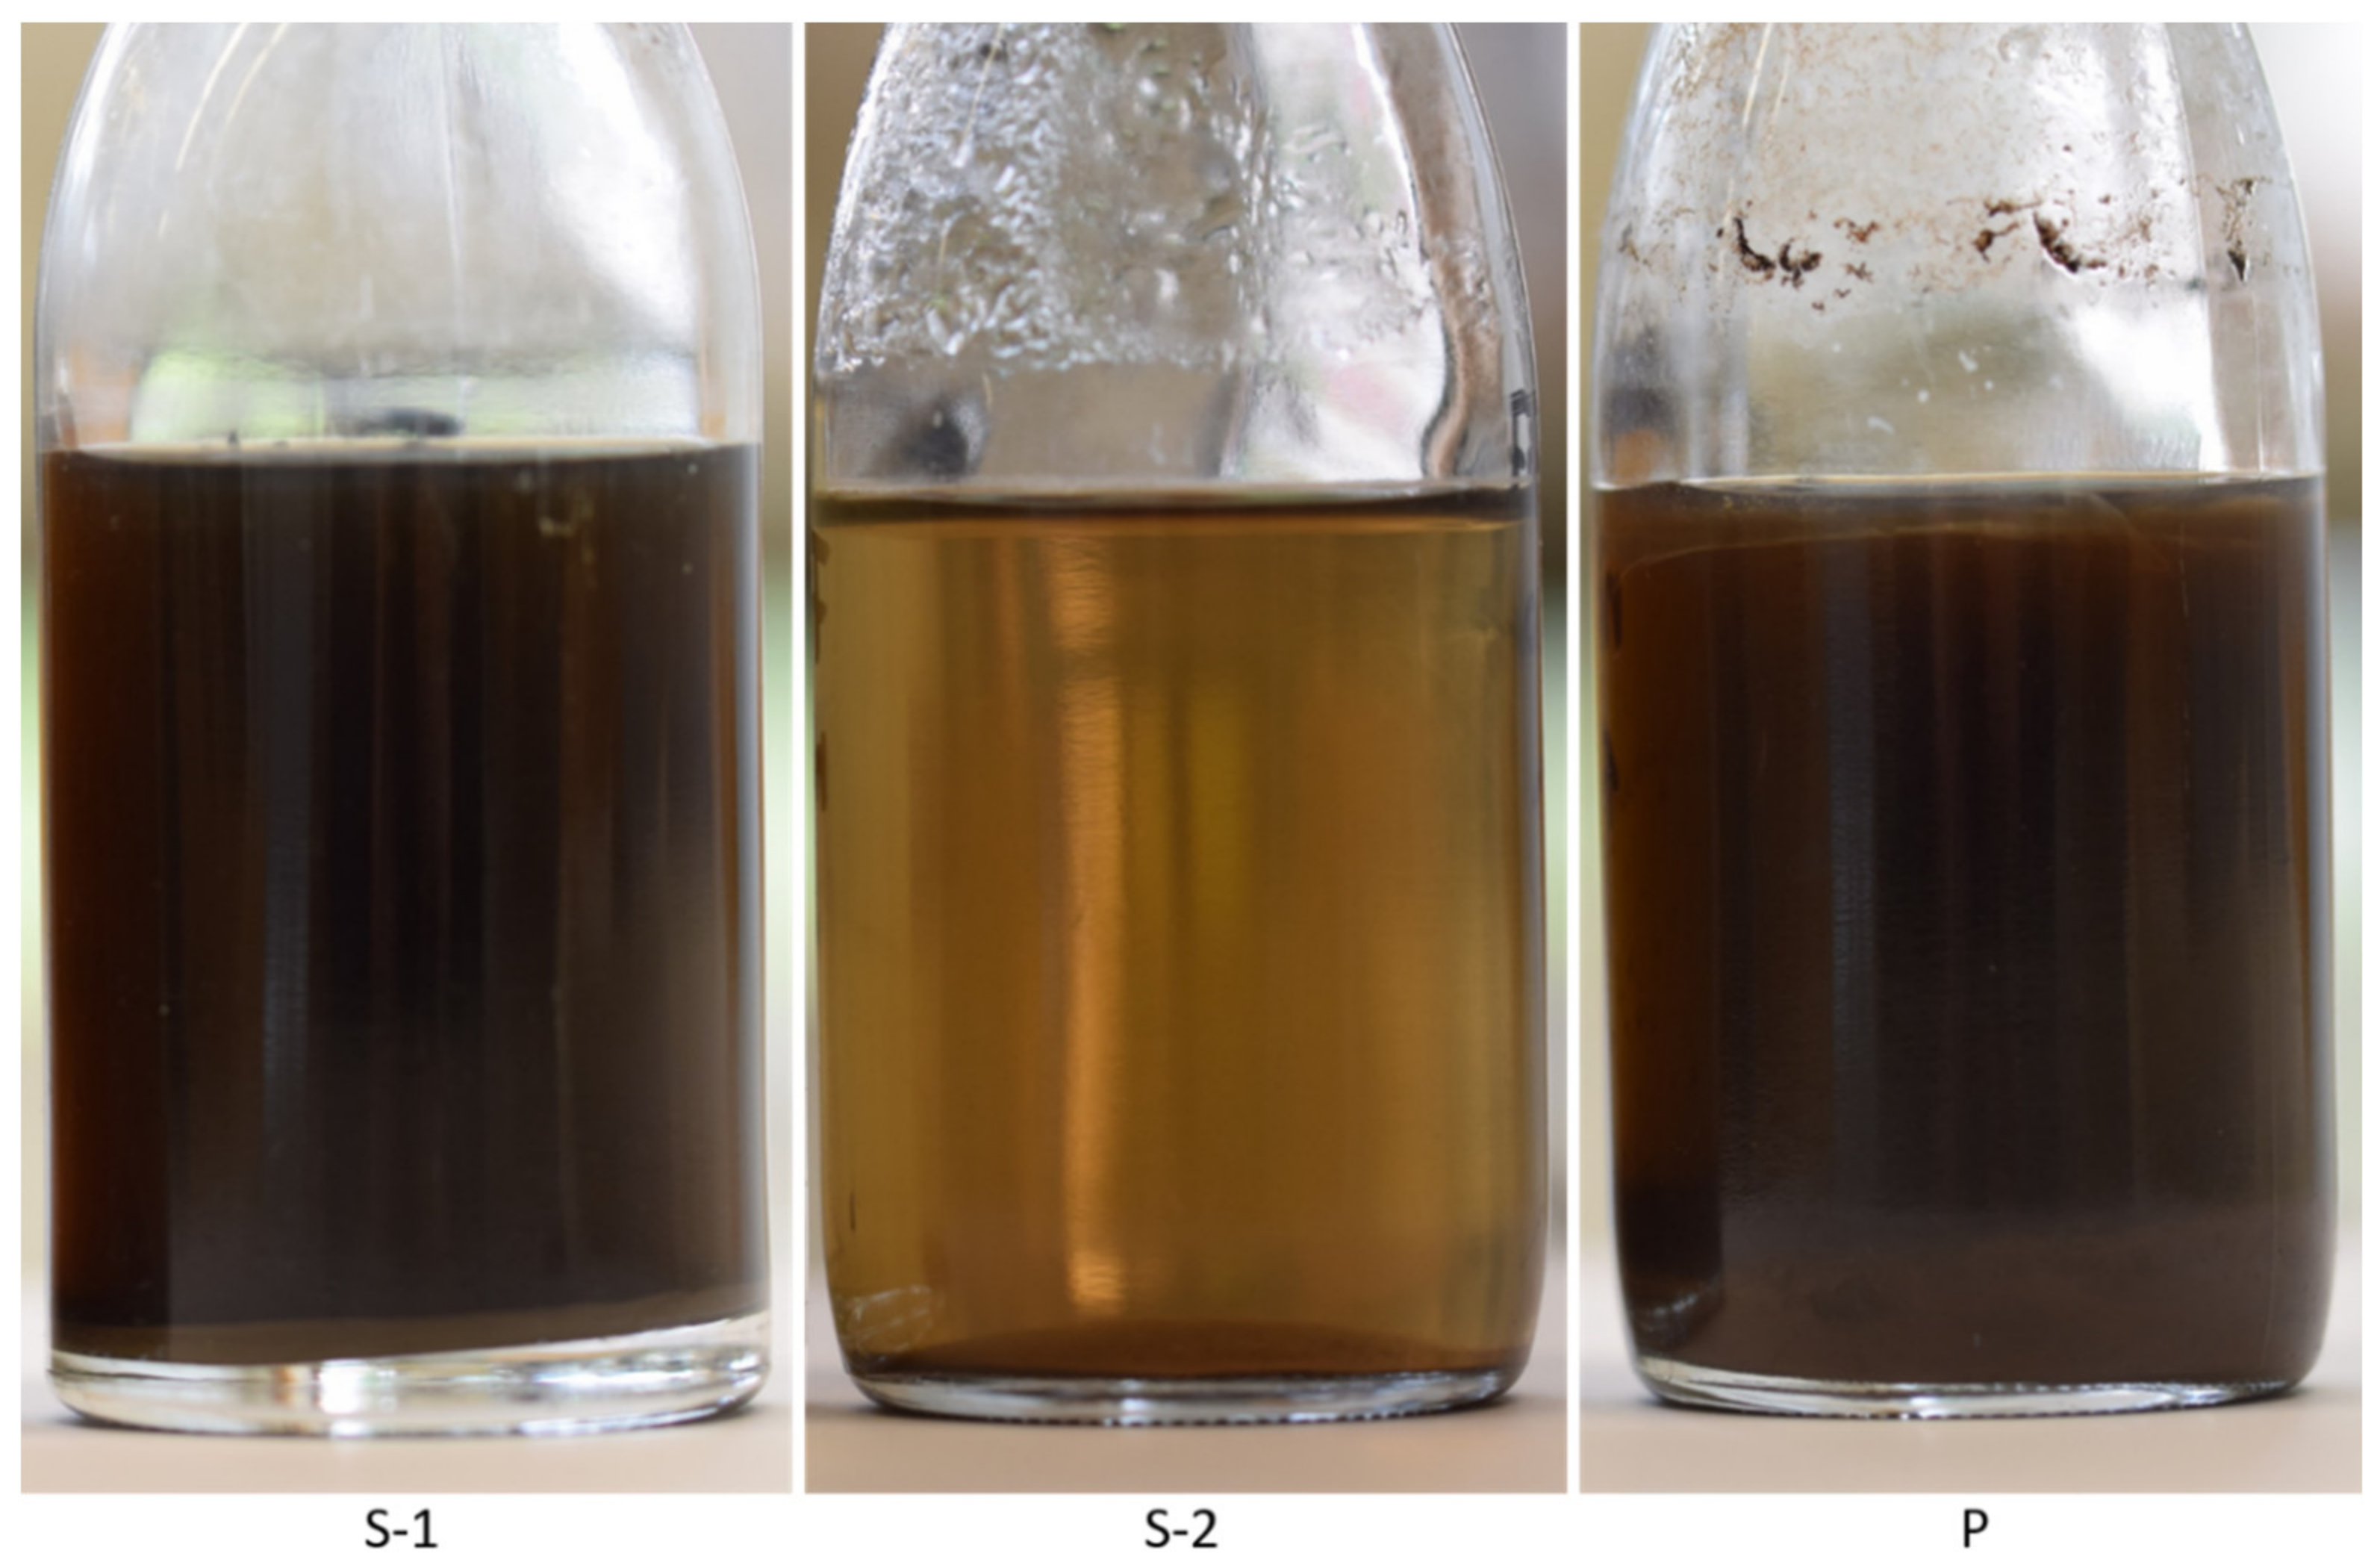
The obtained PW showed greater differences in terms of DM concentration, pH and COD (
Table 2). This is also valid between samples of the same wood species, such as S-1 and S-2, and might be directly linked to the pressing efficiency as described above. While the pressing success (ΔM) was better for S-1 compared to S-2, the DM concentration of the PW was also higher for this sample (2.3%) compared to S-2 (0.4%). The same trend was observed for P with the overall highest ΔM and the highest DM concentration (3.17 ± 0.01%
FM,
Table 2). From these observations, a dependence of the PW’s DM concentration on the ΔM and thus the original M
w.b. may be suggested. However, this must be validated with further experiments.
Frodeson et al. [
30] mention that the DM loss during pellet production due to DM in the PW can either be considered as loss of substances with a reduction of pellet yield and possibly altered pelletization behavior, or as a new and innovative feedstock, i.e., when the DM losses are used for bio-economy purposes [
30]. The results of the pressing tests in this study have shown that for wood chips, a maximum amount of only 1.62 kg
DM per ton
FM of wood chips is transferred to the pressing water (calculated with ΔM and DM concentration of P). Otherwise, if the PW should be used for bio-based process chains, the compression step may need to be optimized to increase the DM concentration in PW.
For instance, the concentration of DM in the PW has to be considered when utilized as a co-substrate in AD plants. Large amounts of PW (i.e., with a 1:1 mixture as applied in this study) may also deliver large amounts of water into the digester, which then would lead to increased heating demands while obviously delivering only a limited mass of degradable organic components. For the evaluation of PW and energy yields in AD, all reference units (FM, DM, oDM) must be considered. However, PW could also be used as a supplement with lower dosages (e.g., in a 1:10 mixture of PW and the main feedstock) to minimize the energy demand for heating.
In contrast to the DM concentration, the oDM concentrations were on similar level (approx. 88%
DM) for all three PW. Thus, the remaining mass of DM contained a variety of organic components that were pressed out of the wood while containing approx. 12%
DM of inorganic components (ash). The oDM concentration is especially relevant when utilizing substrates energetically as only the mass of oDM can be converted to biogas in AD processes. In comparison, the pure DSS as a reference substrate achieved the highest DM with the lowest oDM concentration (approx. 3.6%
FM and 62%
DM, respectively,
Table 2). Both DM and oDM concentrations of DSS were in line with literature [
44,
46,
47]. The concentration of C, H and N were not measured in this study, but the concentration of C correlated with the concentration of oDM and could thus be estimated. In other digestion experiments of the authors [
44,
46], DSS was measured with similar oDM concentrations (63.5 and 60.2%
DM) as presented in
Table 2, while C was measured with 29.7 and 30.4%
DM (with H both at 4.5%
DM as well as with N at 3.8 and 4.1%
DM). Thus, the C concentration of approx. 30%
DM can be assumed for the DSS of this study while the PW can be estimated with C concentration of approx. 45%
DM. However, the concentration of C, H and N of the PW should be measured in further research. Based on C, H and N, stoichiometric methane yields in AD can be calculated [
43].
The pH value of DSS was not measured in this study. Based on literature [
44,
47], a pH value between 6.5 and 7.5 could be expected for DSS. The results of the pH value analysis for the PW (between 4.0 and 7.7) are in accordance with results in the literature. The low pH value of spruce-based PW is already known with a similar pH value for spruce chips (pH 4.53). In addition, the ingredients of softwood typically cause lower pH values [
48]. Ciesielski et al. [
31] found a pH value of a PW from a 3:1 spruce:fir mixture of 4.52. The pH value of the feedstock is an important parameter in AD processes [
44]. Thus, depending on the amount and type of PW in the digester, pH values can be influenced towards lower (S-1, S-2) or higher (P) pH values.
The COD of PW ranged from 10,650 to 45,250 mg/L (
Table 2). Compared to the COD ranges mentioned in the literature for different industry segments (1000–100,000 mg/L), the PW of this study can be compared to industrial wastewaters from dairy or from food factories [
3]. The PW from spruce and fir used by Ciesielski et al. [
31] showed a COD of 4400, which is comparable to sample S-2, with a DM concentration of 0.28%.
The German Waste Water Ordinance sets limits for COD of water from different industries before it can be directly discharged in surface waters. According to this ordinance, for manufacturing of chipboard, fiberboard or wood fiber matting, maximum COD values of 200 mg/L (annual average) must not be exceeded. Therefore, as the COD values of all PW were severely above the legal limits, subsequent treatment of the water seems to be necessary if the PW should be disposed of [
39]. From this perspective (disposal), a suitable utilization pathway of wood-based PW is preferable.
In addition, the theoretical biogas and methane potential can be calculated based on the COD (simplified: 1 g of degraded COD can generate in maximum 350 mL of methane) [
3]. Thus, a higher level of COD might also indicate a higher energy potential.
3.2. Elemental Composition and Chemical Compounds of Wood Press Waters
For the spruce-based PW, higher absolute element concentrations were found in S-1 compared to S-2 (e.g., K with 816 mg/L vs. 222 mg/L,
Table 3). This may be due to the slightly higher bark content of the S-1 sample (determined by visual inspection) as bark contains multiple inorganic charges compared to wood (see, e.g., [
3,
49]), but this could also be explained by the slightly higher ΔM (1.7%). The latter, however, would imply a stronger leaching effect with greater water flow compared to that of the dilution effect due to the increased water flow. Similar, the poplar-based PW contained higher amounts of minor and trace elements compared to both spruce samples (e.g., K was at 1510 mg/L).
While the elemental composition of the liquid PW (
Table 3) cannot be directly compared to the elemental composition of solid wood, tendencies and correlations for the wood species spruce and poplar can be observed. The poplar-based PW was especially high in concentration of K, Ca, Mg, Na and Cu. This can partly be explained by the higher trace element concentration (K, Ca, Mg) in the raw material, as typical elemental concentrations in poplar wood are higher than those of spruce [
3]. These elements have a decisive influence on the fuel properties of wood chips and their combustion behavior [
3,
10,
50,
51,
52]. K, for example, is one of the main aerosol forming elements during combustion and strongly affects slag formation. The K concentration in the PW should theoretically lead to a decrease of the element concentration in the fuel. In the pressing process of P with the initial M
w.b. of 53% to 48%, an equivalent of more than 165 mg/kg
DM of K should have been flushed out of the wood with the water. Assuming an average K concentration of 3500 mg/kg
DM in wood chips from a short rotation coppice, this corresponds to a leaching of 4.72% of the total K amount in the wood [
3] and should therefore improve the combustion properties of the wood chips.
Dietz et al. observed contamination effects (Cr, Co, Fe, Ni, Mo) through abrasion of machine components in contact with the wood (e.g., blades constructed using heavy metal containing steels) when processing different wood chips in laboratory mills. This abrasion effect was caused by shares of mineral impurities in the sample [
45]. Compared to the S-2 and P samples, S-1 showed elevated values for the above-mentioned elements (
Table 3). Therefore, in addition to natural causes, increased mineral contamination and therefore increased abrasion in the processing steps (from comminution, conveying in the mechanical pressing) could also explain the measured concentrations (
Table 3).
In further experiments, the elemental profile of the untreated solid wood (raw state) and the treated wood (mechanically dewatered) together with the generated PW could be monitored in order to quantify the leaching effects. For spruce and poplar wood, typical elemental profiles of the solid and untreated wood can be found in literature [
3,
10,
45].
Trace elements are of importance for AD processes. They can enhance the efficiency of AD by increasing energy yields but can also become toxic, depending on the concentration in the digester. Important trace elements for AD are reportedly Fe, Co, Mn, Mo, W, Ni, Se and Zn. Trace element requirements of AD processes depend on various parameters, which is why the ranges of optimum elemental concentrations vary in the literature. For Na, K, Ca, Mg, S, Ni, Cu, Cr, Co, Pb and Zn, inhibitory levels for AD processes are defined in the literature [
44]. However, none of the mentioned elements contained in the PW seems to be critical (the most relevant could be K with an inhibitory level of 4800 mg/L). In addition to inhibitory levels, optimum ranges are defined for Ni, Co, Fe, Mn, Mo, Se and Zn [
44]. None of the mentioned elements was measured within the optimum ranges as described in the literature. However, the concentration of beneficial elements are closer to the optimum ranges than the concentration of inhibitory elements to their critical concentration. From an elemental perspective, this could suggest an overall positive impact of the PW for AD processes. In general, DSS already contains a broad variety of elements such as P, Al, Ca, Fe, K, Mg, Na, S and Si but also heavy metals that are critical with regard to legal limits [
44]. PW could thus also be used as supplement delivering nutrients for other substrates with less extensive elemental profiles.
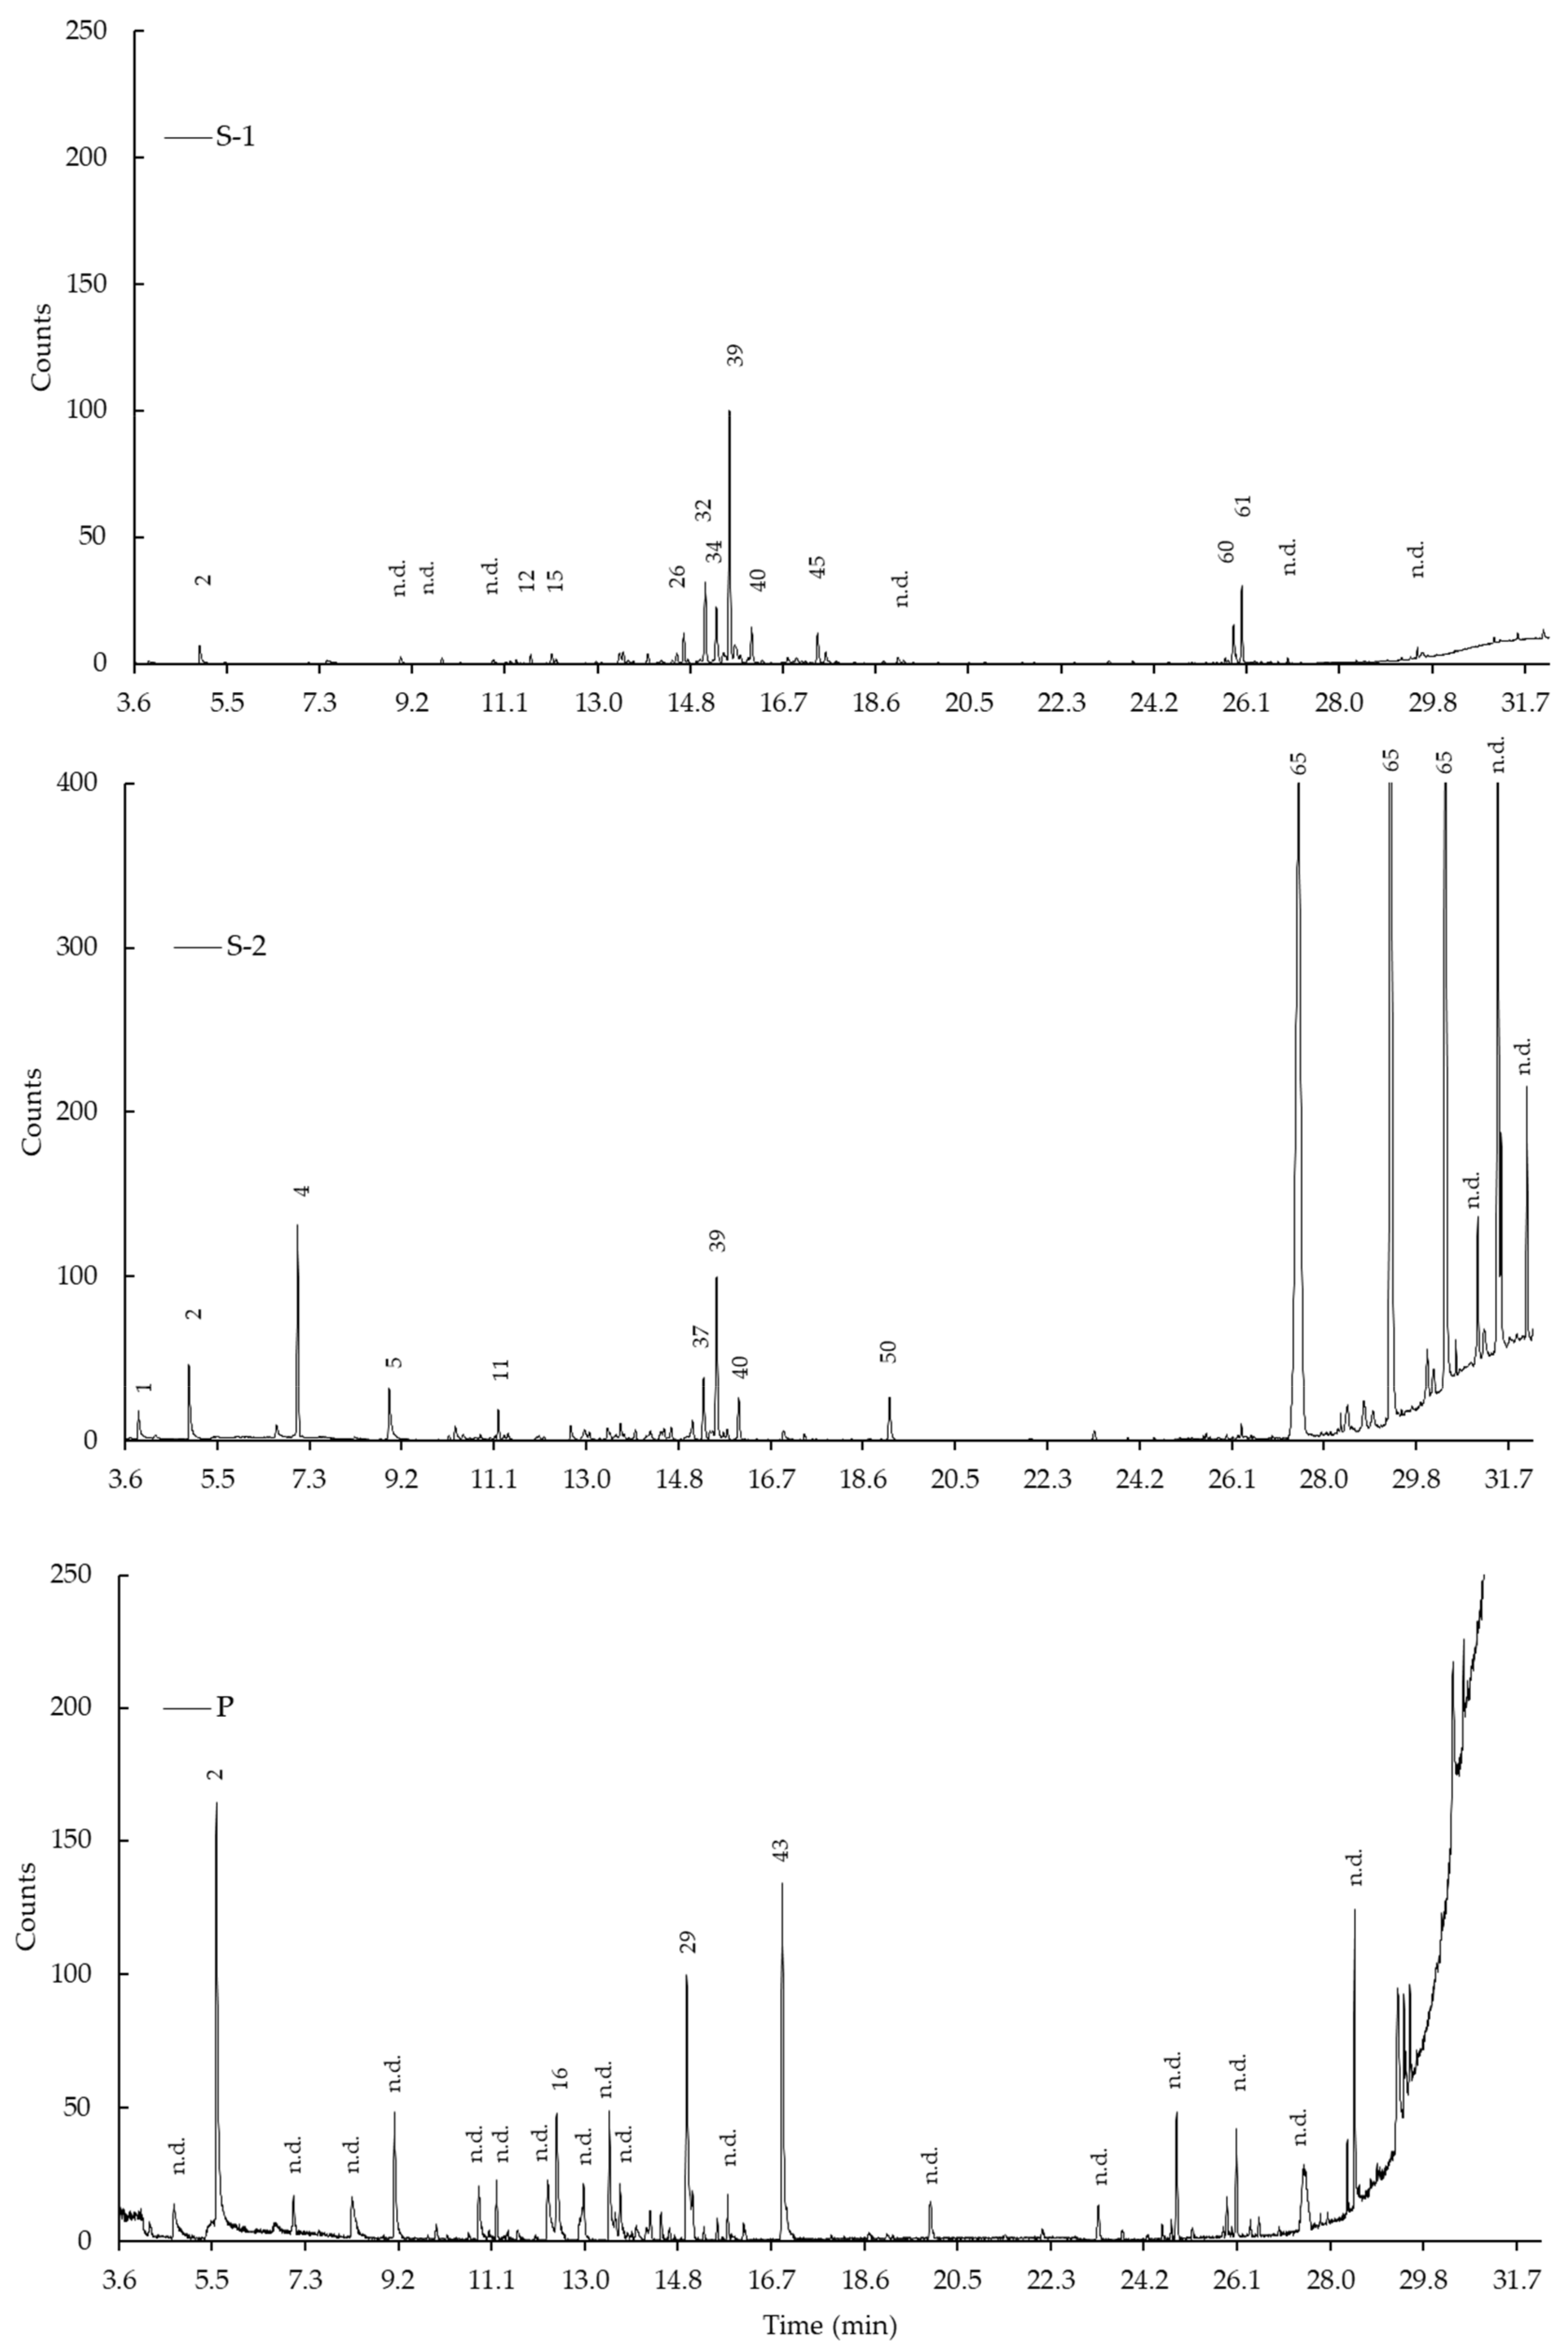
In
Figure 2, the results of the GC-MS analysis of PW are shown.
Table 4 complements
Figure 2 by presenting the associated chemical compounds as detected by the GC–MS system. In general, the largest amounts of peaks were detected for the poplar-based PW (P) followed by the spruce-based PW (S-1 and S-2). Most of the detected peaks of the P sample could not be identified (hit probability > 90%) by the GC–MS system. Thus, different chemical compounds were detected but could not be identified with certainty. Interestingly, the chromatograms of the samples S-1 and S-2 did not show similar progressions, indicating differences in chemical compounds even among samples of the same species. Only a few overlaps were found for S-1 and S-2. For instance, alpha-terpineol was detected in both samples. This substance is commonly known as an important component in the perfume and odor industry. Furthermore, alpha-terpineol inhibits the growth of tumor cells [
53,
54]. It has proven to show anti-tubercular activities, is active against multi-drug-resistant tuberculosis and extensively drug-resistant tuberculosis [
55]. The compound 3-carene (detected in S-1) is an antimicrobial monoterpene that has an antibacterial mechanism against foodborne pathogens and occurs naturally in a variety of plants [
56]. Alpha-cadinol, which was also detected in S-1, has antifungal and hepatoprotective effects and, in addition, anti-inflammatory effects are associated with it [
57,
58,
59].
In the literature, Ciesielski et al. [
31] investigated the suitability of “wood juice” from a mixture of spruce/fir and a pure Douglas fir for the direct synthesis of biopolymers by bacteria. Although they found a relatively low polyhydroxyalcanoates concentration, the approach seems worth pursuing, as substrate pretreatment is not required, and a substantial amount of 3-hydroxyvalerate indicates that the obtained co-polymers provide suitable characteristics for industrial applications. In addition, Wilke et al. [
32] showed a good suitability of PW in yeast production. Yeast strains nourished with PW showed significantly improved growth behavior in shake flask experiments compared to the use of a conventional industrial complex medium. Thus, initial approaches for material use of PW are already available.
Overall, this study focused on the energetic valorization of the PW in AD, but the additionally performed GC–MS analyses showed that several chemical compounds of interest for the chemical industry can be detected in PW. Quantitative investigations could be carried out to identify relevant material use potentials, exact amounts and extraction processes for the chemical compounds in PW. Thus, for each of the detected chemical compounds, measurements on the quantitative compound concentration should be performed followed by a discussion of the utilization potential and possible bio-economy pathways. In addition, the potential effects of the (detected) chemical compounds on AD processes could be a field of future research.
3.3. Anaerobic Digestion Experiments
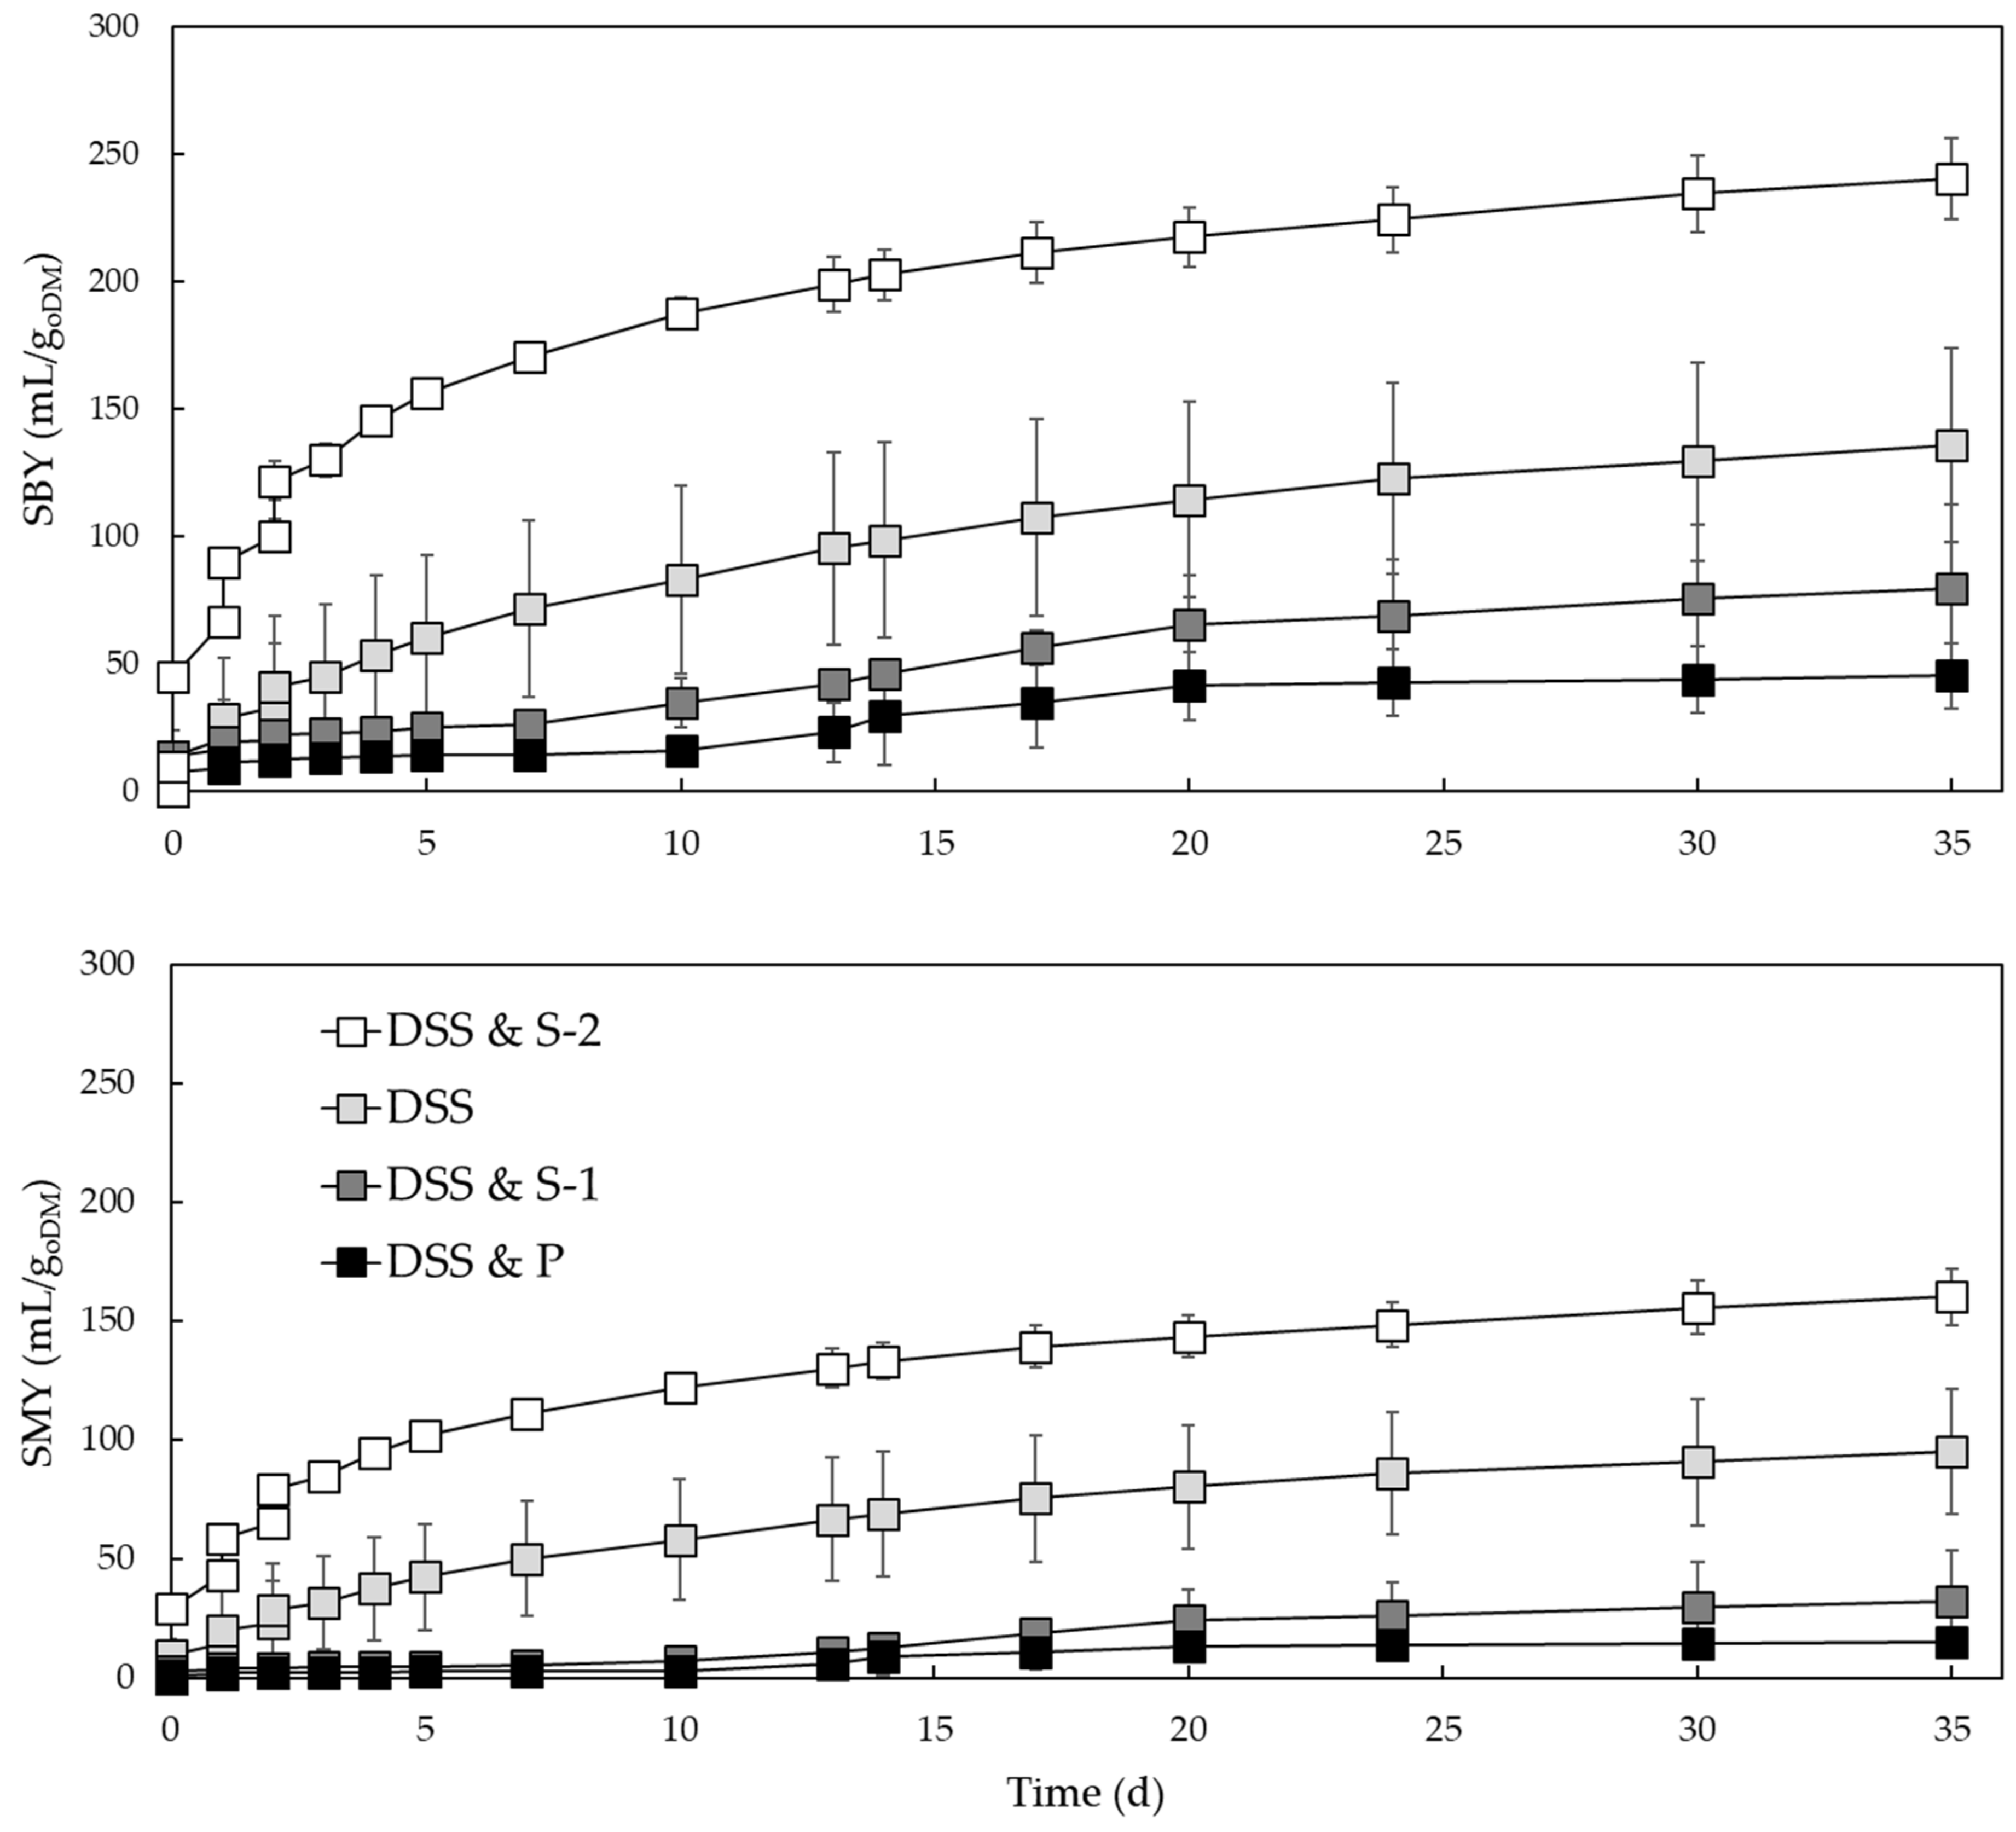
Based on the mixtures of DSS and the different PW in each digester, both SBY and SMY are presented in
Figure 3. The mixture of DSS and the PW S-2 achieved the highest SBY
PW and DSS and SMY
PW and DSS followed by the blank variant (DSS alone). From a digester perspective, which considers the yields per g
oDM of the mixtures, the combination of DSS and S-2 was the most efficient variant. The mixtures of DSS together with S-1 and P were measured with even lower SBY
PW and DSS and SMY
PW and DSS compared to the blank variant (containing only DSS). In the case of S-1 and P, the AD process was thus inhibited. Based on the results displayed in
Figure 3, the co-digestion of DSS and PW may obviously lead to positive or negative impacts on the AD process. This can be discussed based on the digester content, which is described by physico-chemical properties of the PW such as DM and oDM concentration, pH values as well as minor and trace elements. In the case of the beneficial variant S-2, the lowest DM concentration (0.39 ± 0.01%
FM,
Table 2) was measured, while oDM concentrations of all PW were equally between 87 and 89%
DM. The high pH value of the poplar-based PW (approx. 8) could have also inhibited the AD process (especially due to the almost 1:1 mixture). For further explanations of the results in
Figure 3 and for a detailed view of the content in each digester,
Table 5 delivers absolute masses for DM and oDM as well as oDM ratios and absolute biogas and methane yields.
The absolute masses of DM and oDM delivered by the DSS were identical for all variants based on 2000 mL for the blank variants and based on 1000 mL for the mixtures with the PW. However, the different DM concentration of the PW (
Table 2) strongly influenced the absolute masses of DM (ranging from 3 to 30 g) and oDM (ranging from 3 to 27 g) that were present in each digester. Consequently, this led to varying oDM
Feedstock to oDM
DSS ratios between 0.1 and 1.2. The digesters with the lowest oDM ratios (S-2 with ratios of 0.1–0.2) delivered the best results in terms of SBY
PW and DSS and SMY
PW and DSS. When comparing the absolute methane yields of DSS alone (4226 ± 1155 mL) with those of the DSS and S-2 mixture (4054 ± 297 mL), similar results were achieved. However, the drastically lower mass of oDM in the digester of the mixtures (25 g vs. 45 g for DSS alone) must be considered. Thus, the mixture of DSS and S-2 delivered promising results that suggest (a) high substrate specific gas yields of the PW, and (b) an increased efficiency in utilizing the mass of oDM provided by the DSS.
In general, an increased oDM ratio of up to 0.9 and 1.2 (S-1 and P), drastically decreased the gas yields, which is in line with the ranking as presented in
Figure 3. In accordance with VDI 4630 [
43], the oDM ratio should remain below 0.5 to ensure a stable and efficient AD process. Therefore, the main reason for the poor performance of S-1 and P, with regard to both absolute and specific gas yields (
Table 5 and
Figure 3), could have been the strongly elevated oDM ratio.
In addition to the results for the mixtures,
Table 6 presents the results for SBY
DSS, SBY
PW, SMY
PW and SMY
DSS. In Germany, the average SBY from sewage sludge is 520 mL/g
oDM [
3,
44]. Thus, the residual biogas potential SBY
DSS as measured in this study with approx. 136 ± 38 mL/g
oDM (25% of the average sewage sludge SBY) indicates that the inherent energy content of DSS could be exploited to a greater extend. Szaja et al. [
47] used sewage sludge for co-digestion experiments and measured SMY between 230 and 270 mL/g
oDM for sewage sludge alone, which strengthens the statements above.
As explained, only the PW S-2 was able to deliver considerable gas yields above those of the blank variants. The SBY
PW and SMY
PW from S-2 alone were measured with almost 1000 mL/g
oDM and 630 mL/g
oDM, respectively. However, for the evaluation of the PW, the concentration of oDM and DM (
Table 2) in the fresh state are of importance. Thus, a SBY
PW and SMY
PW of approx. 3 mL/g
FM and 2 mL/g
FM, respectively, was achieved.
After day 35 of the AD experiments, all remaining digestates of each variant were analyzed regarding DM and oDM concentration. The DSS (blank) variant was measured with concentration of 1.85 ± 0.06%FM (DM) and 53.92 ± 0.37%DM (oDM). The mixtures of DSS and PW were analyzed with DM concentrations of 1.33 ± 0.19%FM (S-1), 0.97 ± 0.41%FM (S-2) and 2.14 ± 0.21%FM (P), while oDM concentrations were 65.78 ± 1.39%DM (S-1), 52.66 ± 0.15%DM (S-2) and 60.45 ± 0.77%DM (P).


 ,
, 


