
Agarase, Amylase and Xylanase from Halomonas meridiana: A Study on Optimization of Coproduction for Biomass Saccharification

Abstract
:1. Introduction
2. Materials and Methods
2.1. Sample Collection and Bacterial Isolation
2.2. Qualitative Assay
2.3. Biochemical Characterization and Molecular Identification of the Bacterial Isolate
2.4. Co-Production
2.5. Quantitative Assays
2.6. Optimization
2.6.1. Classical Optimization
2.6.2. Statistical Optimization
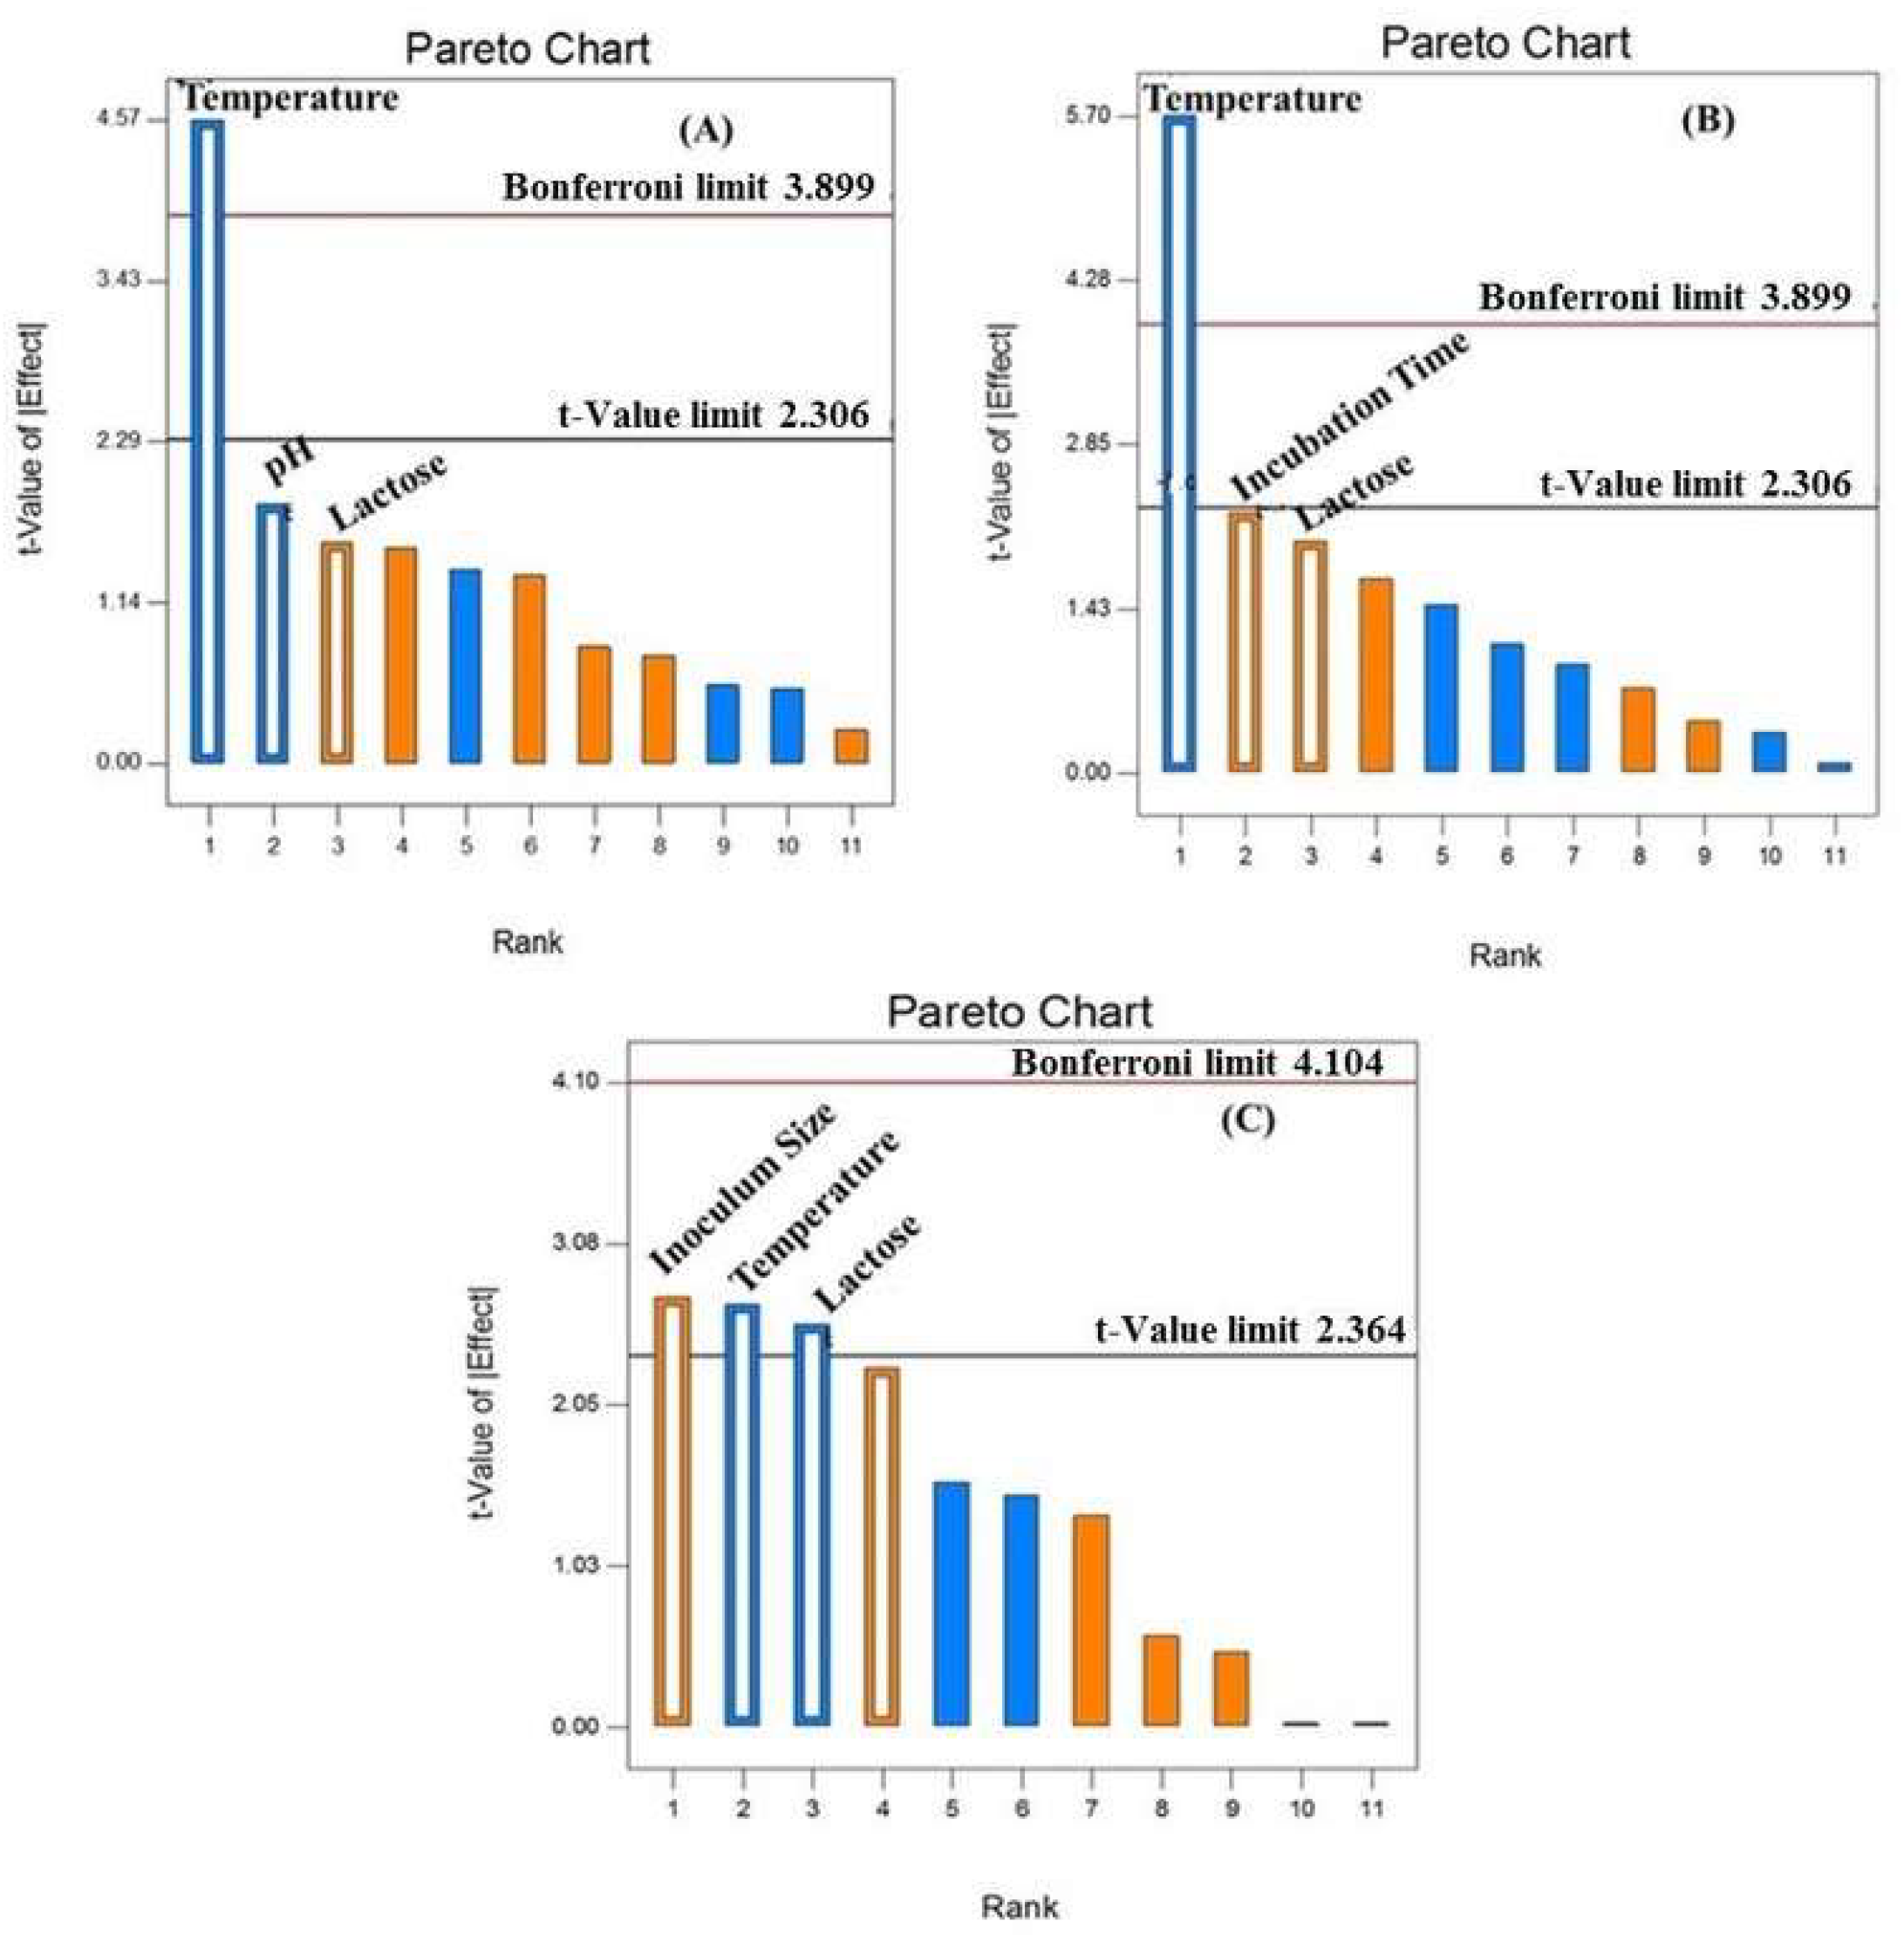
Plackett-Burman Design
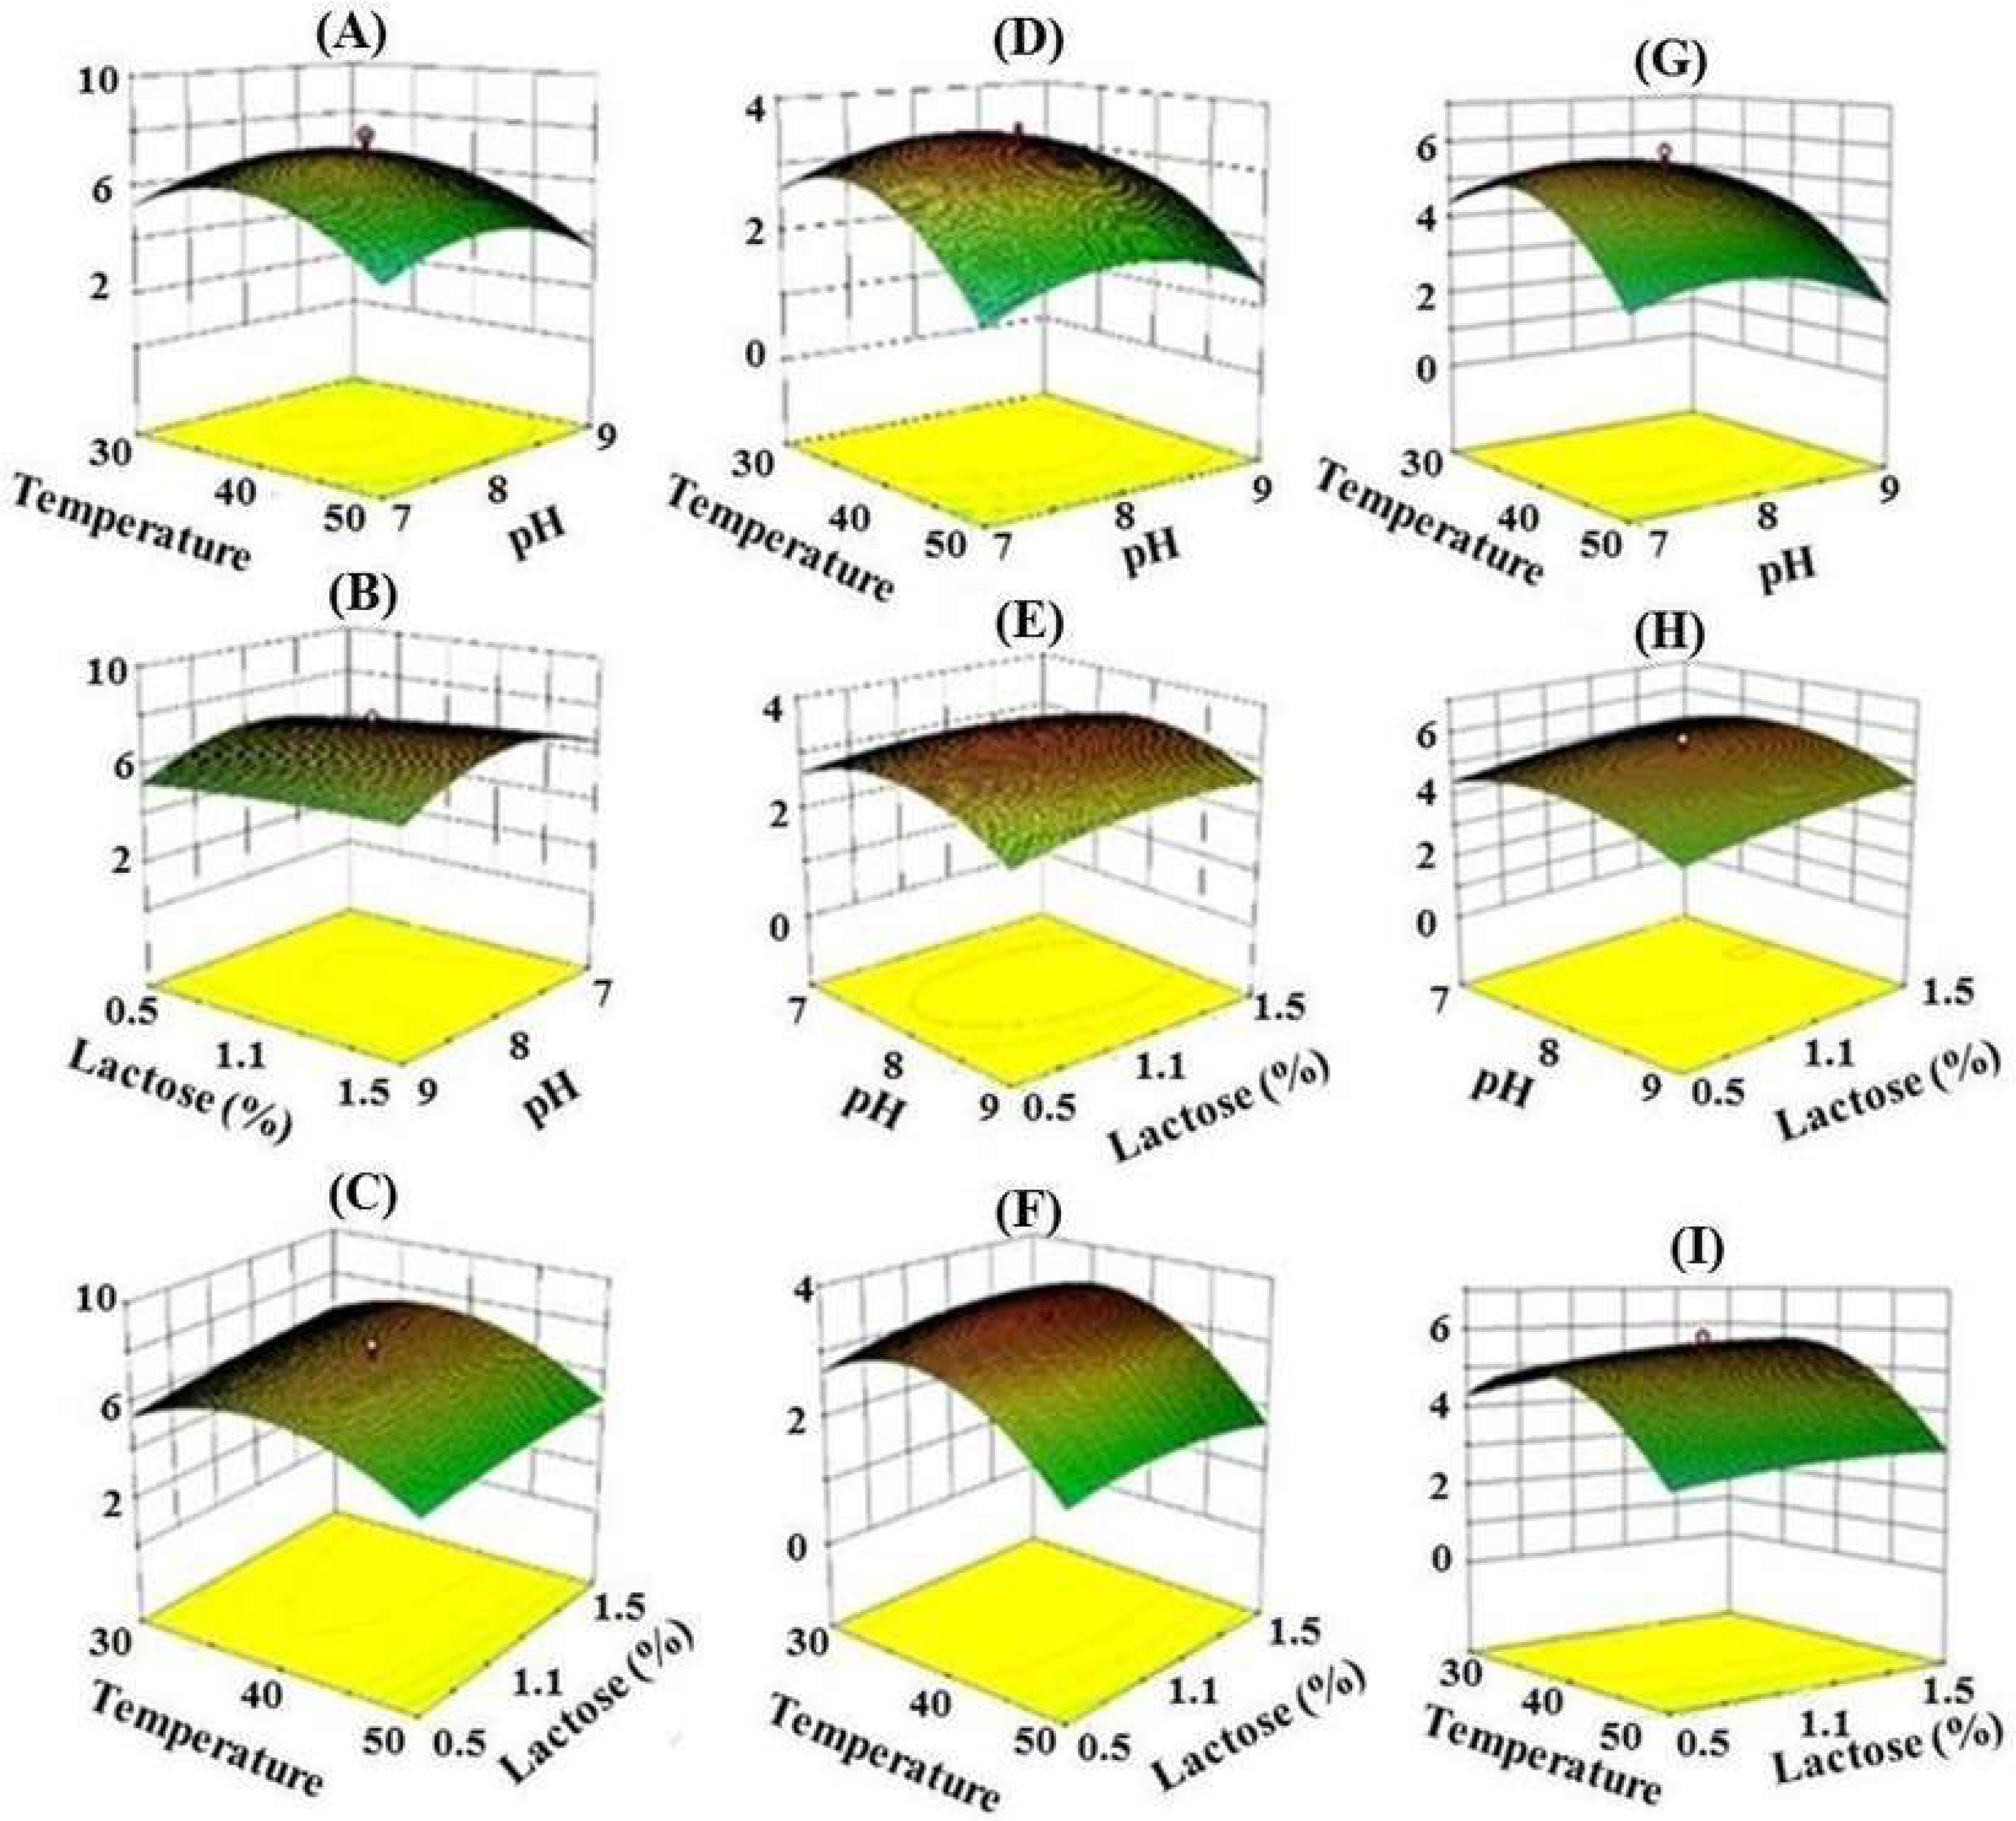
Response Surface Methodology
- Y: Predicted Response
- K: Number of factors
- βo: Model Constant
- βi: Linear Coefficient
- βii: Quadratic Coefficient
- βij: Interaction Coefficient
- Xi and Xj: Input variables that influence the response
2.7. Application Study
2.7.1. Substrate Pretreatment
2.7.2. Saccharification
3. Results
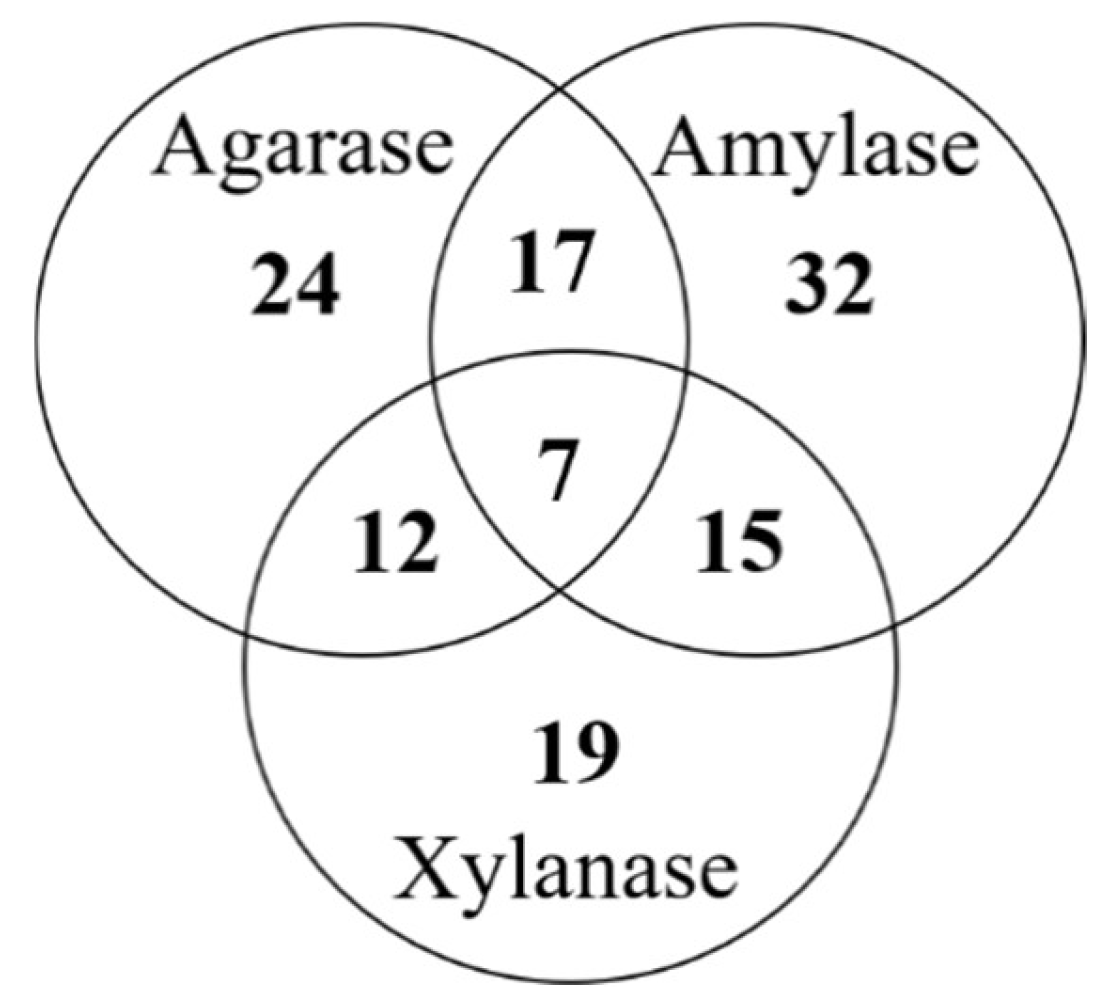
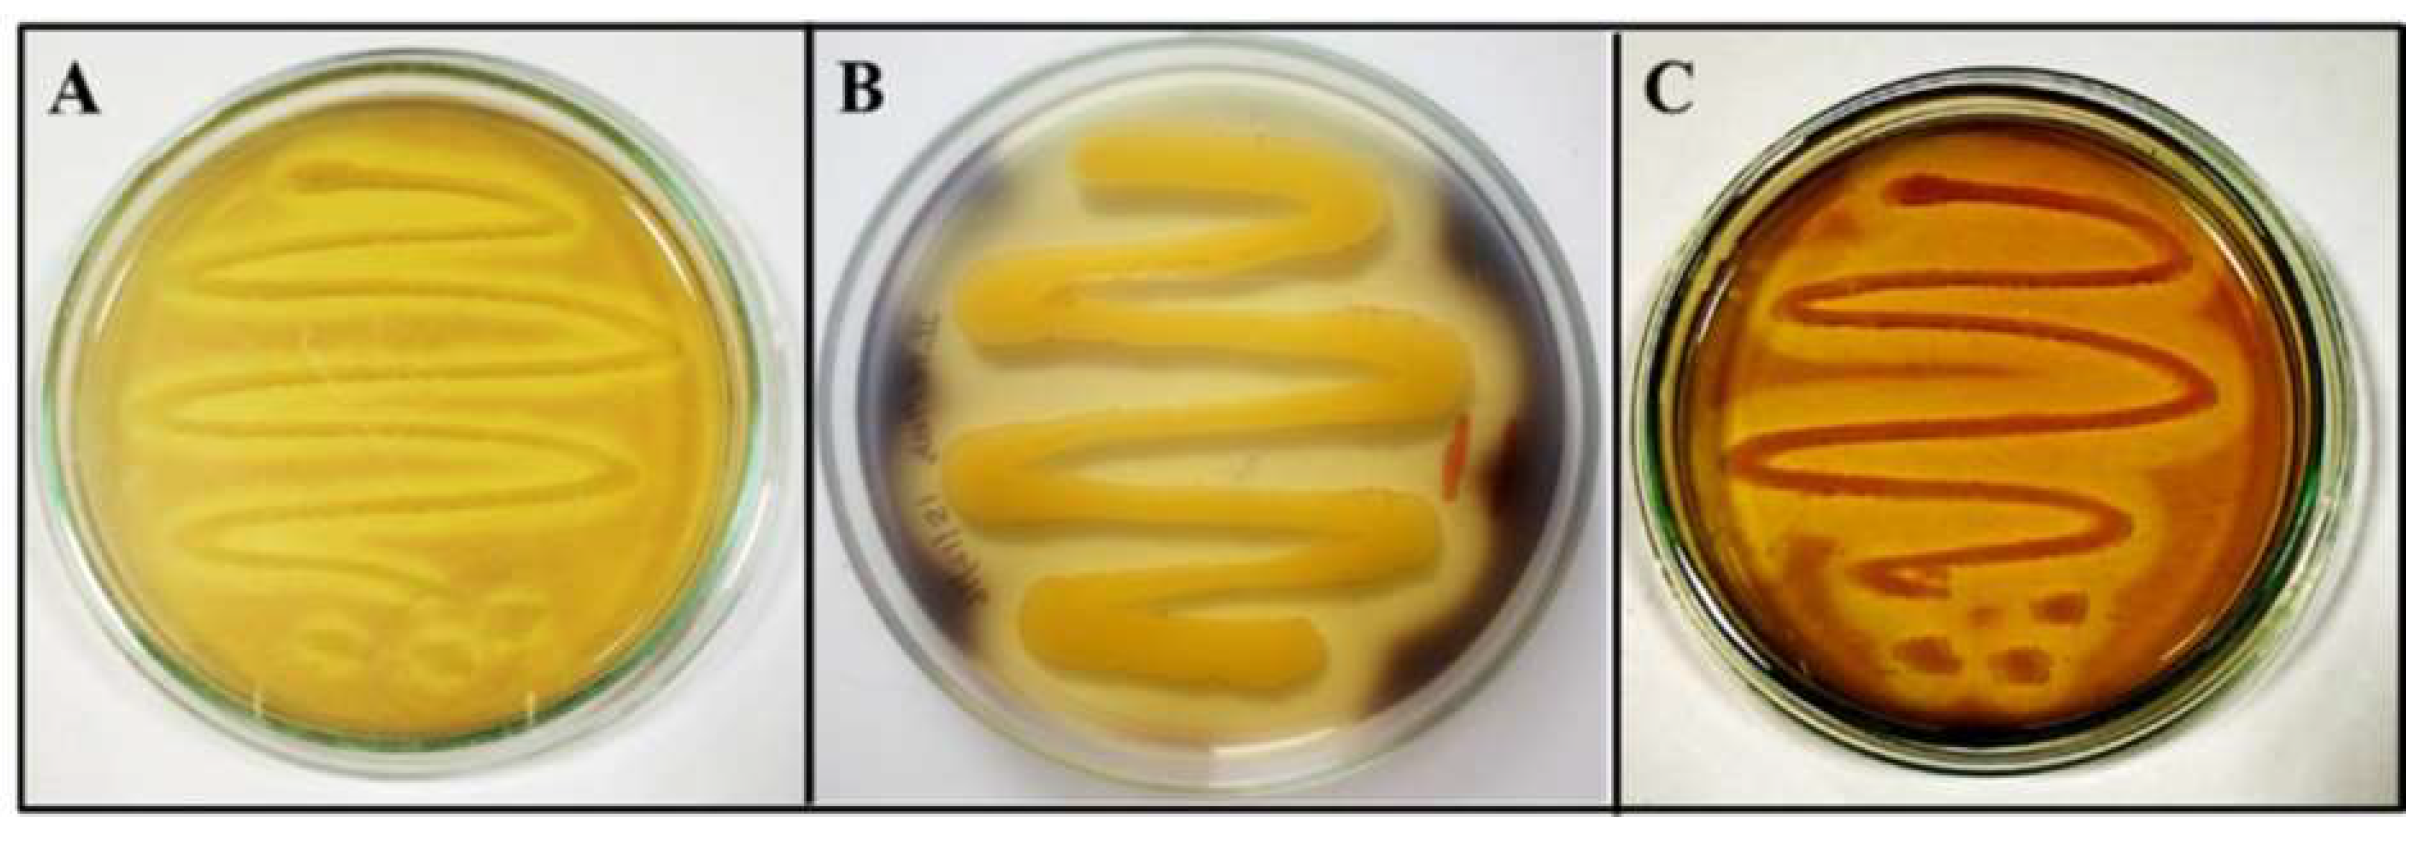
3.1. Qualitative Assay
3.2. Biochemical Characterization and Identification of the Bacterial Isolate
3.3. Co-Production
3.4. Optimization
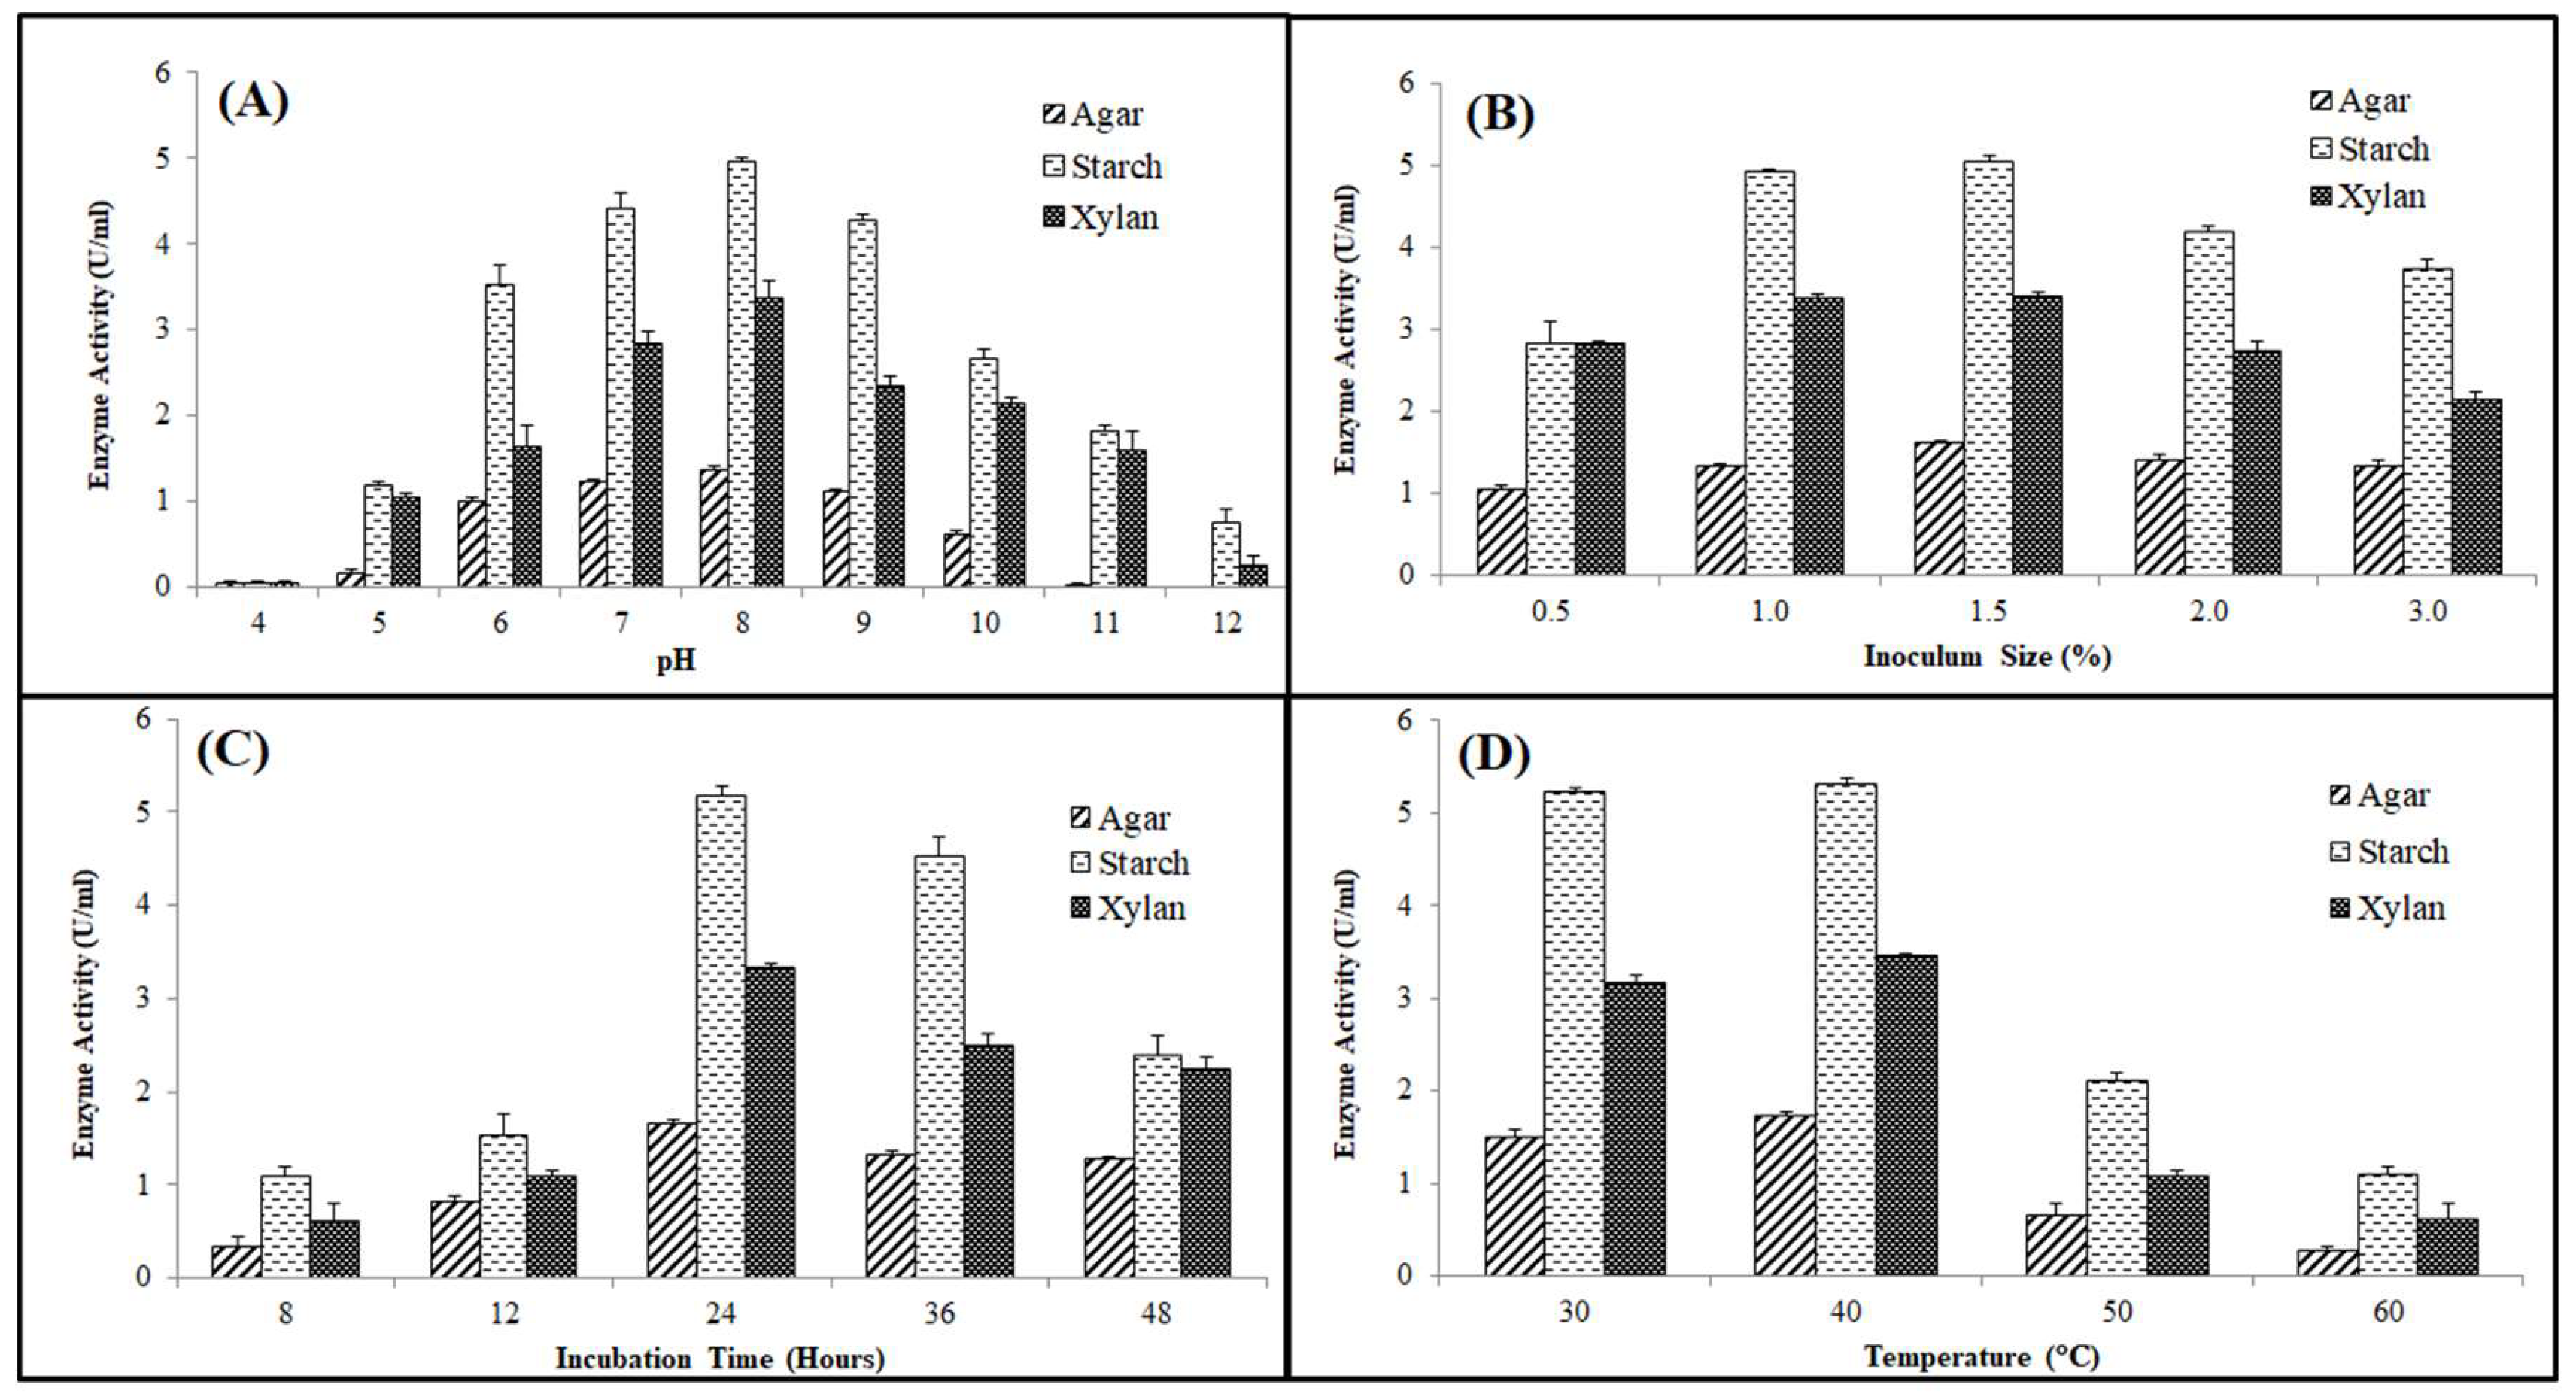
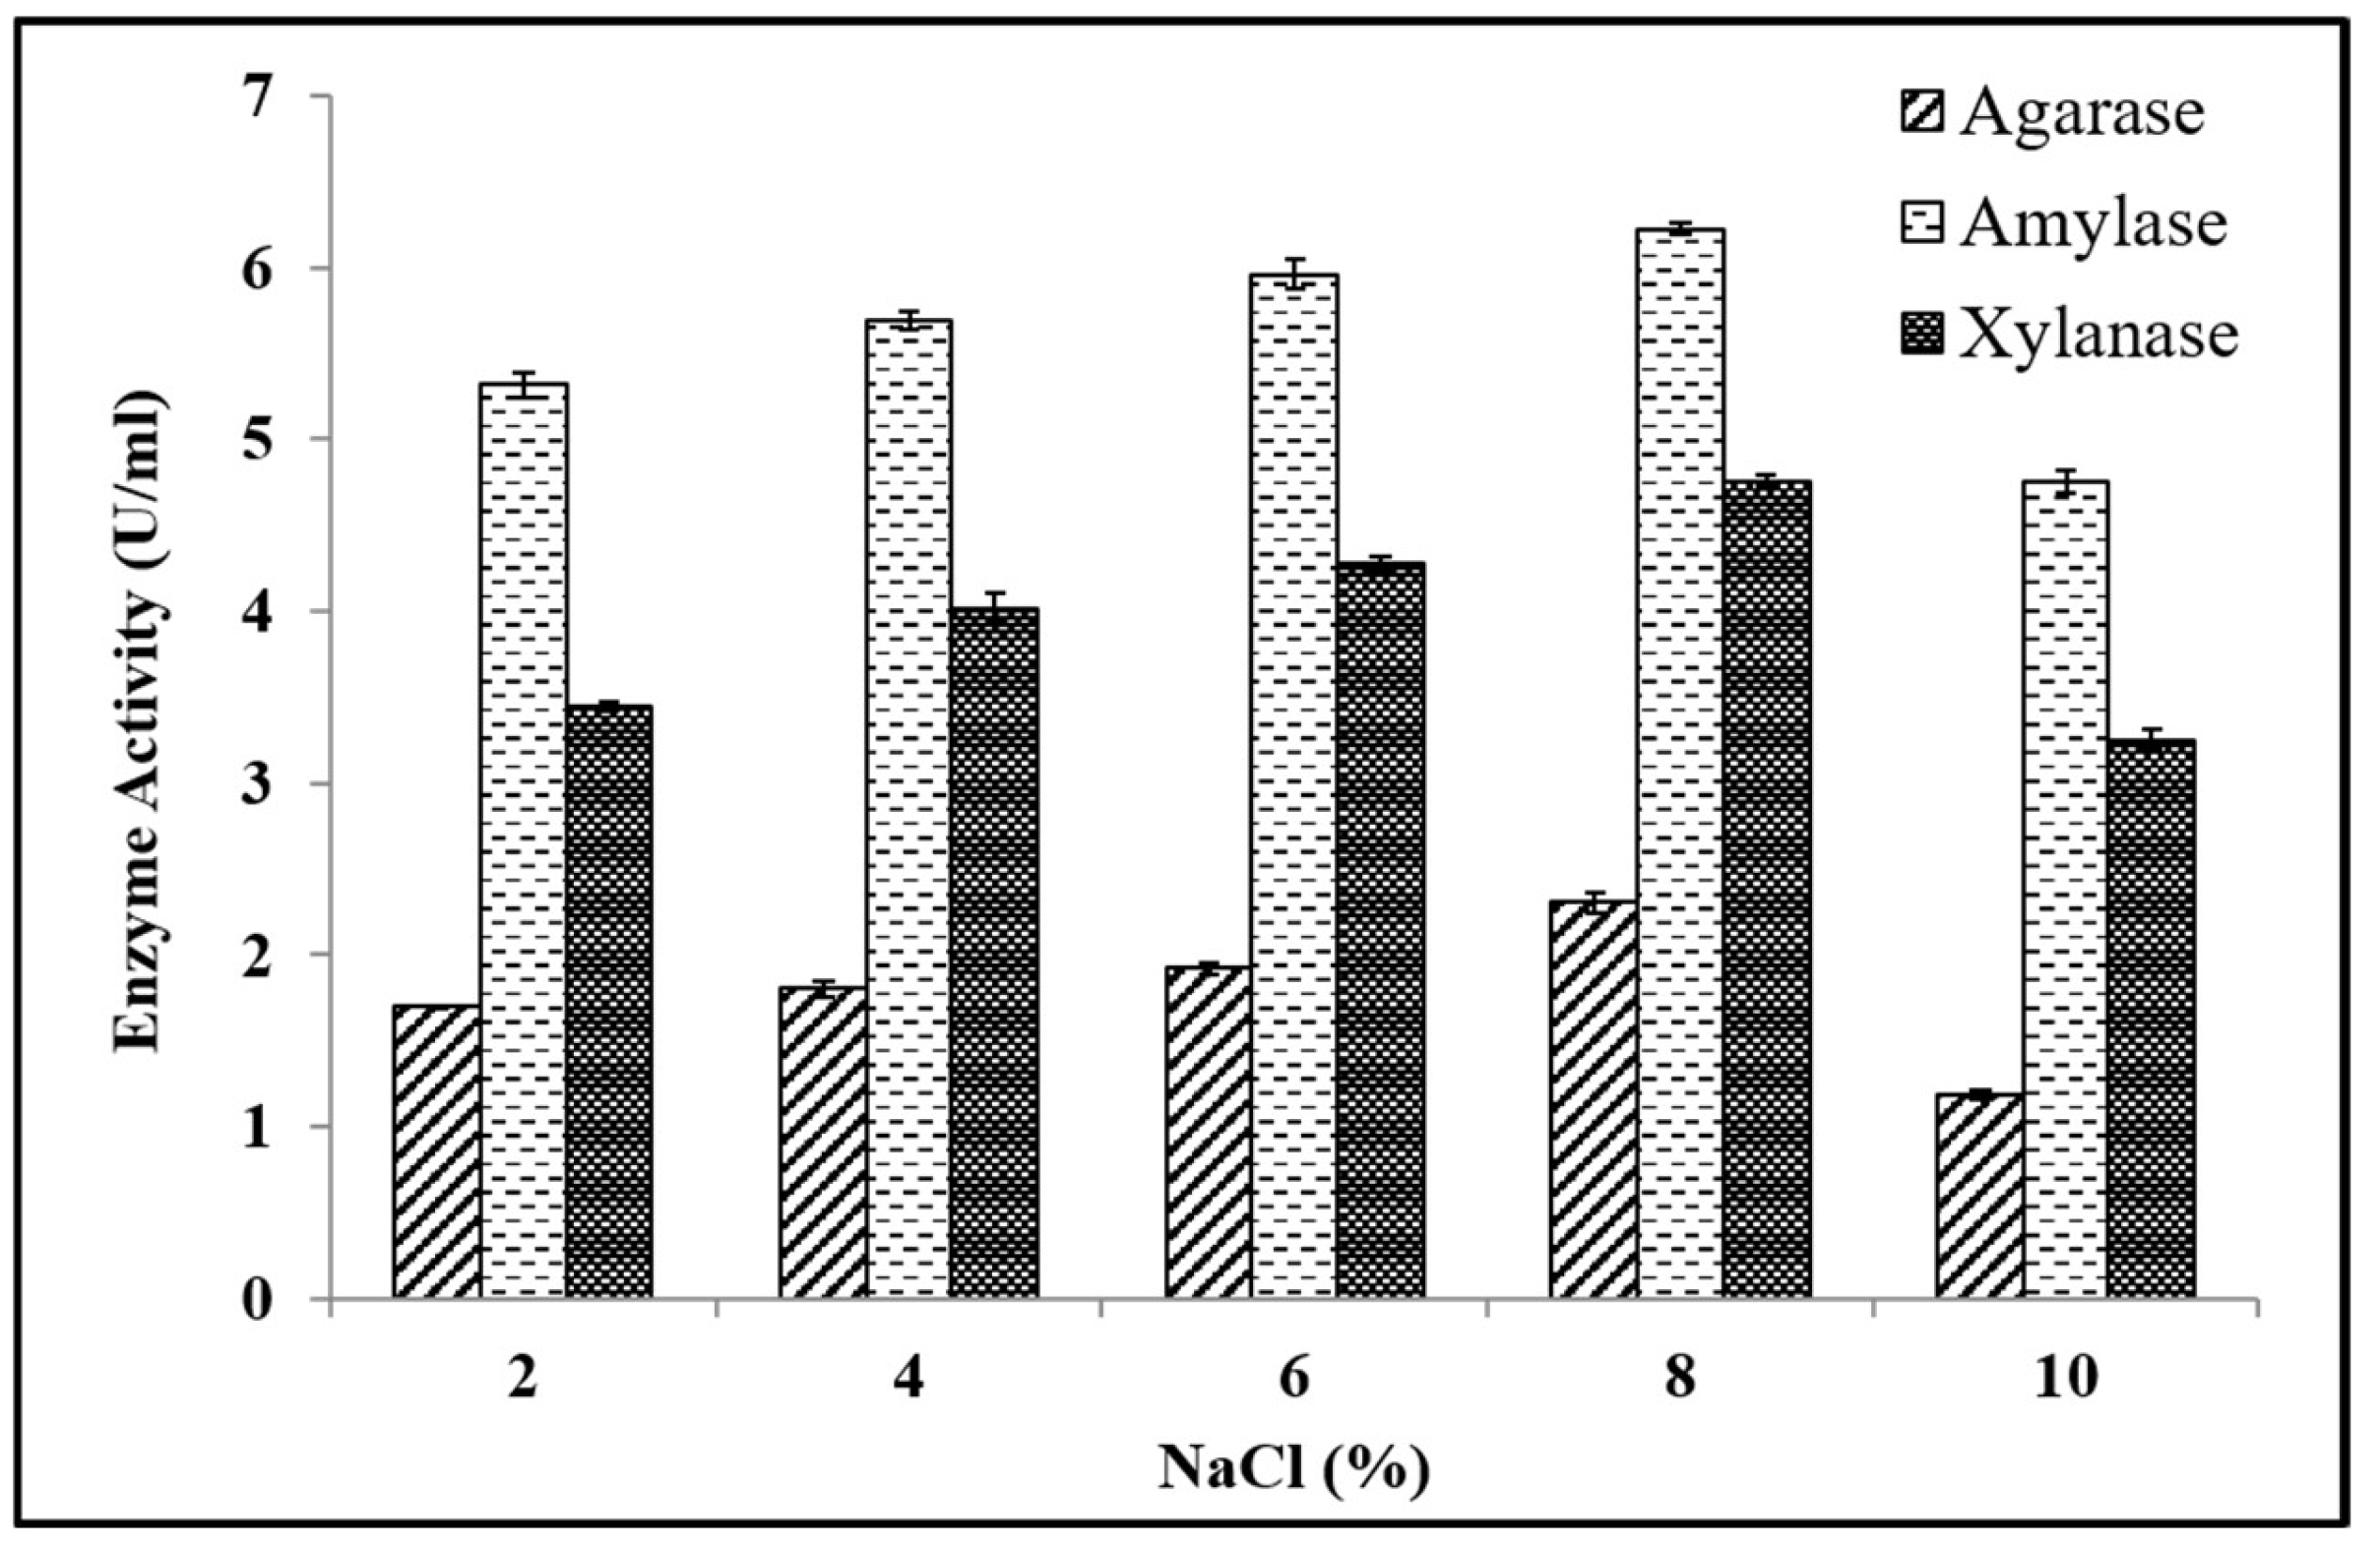
3.4.1. Classical Optimization
Effect of Key Cultural Parameters on Enzyme Production
Effect of Media Components on Enzyme Production
3.4.2. Statistical Optimization
Plackett-Burman Design Evaluation of Significant Production Media Variable
Response Surface Methodology
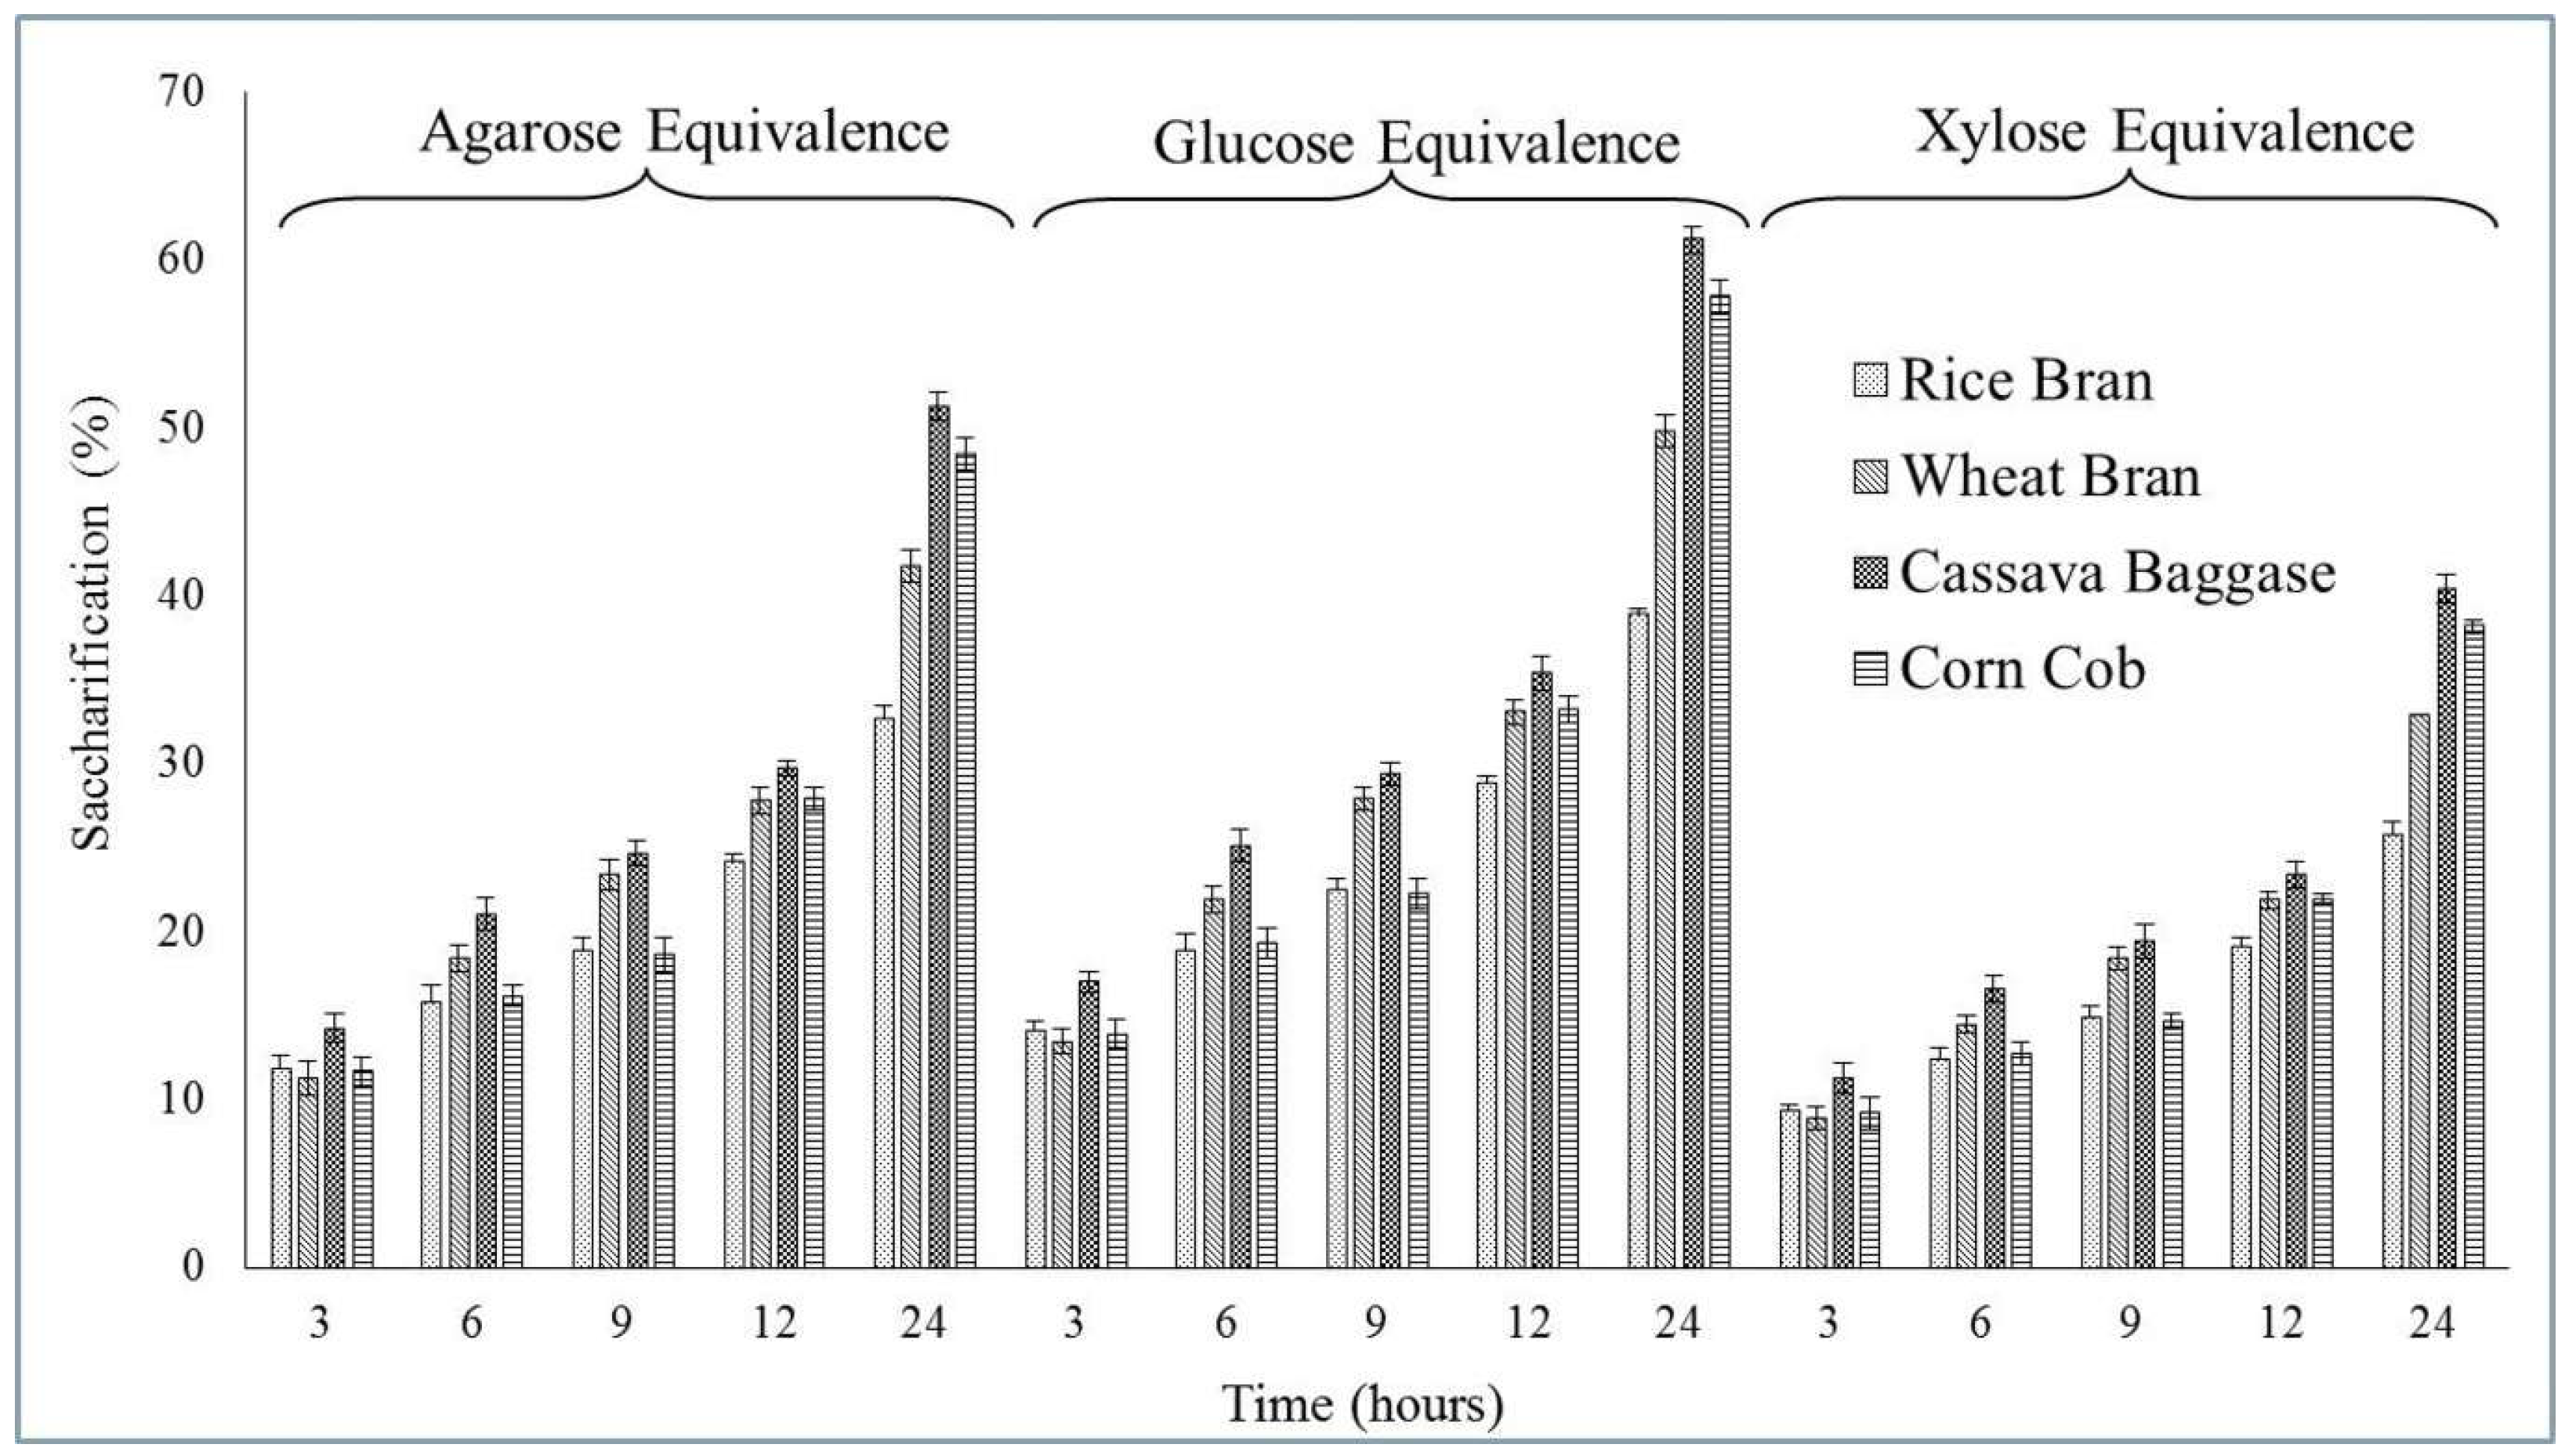
3.5. Application Study
4. Conclusions
Supplementary Materials
Author Contributions
Funding
Institutional Review Board Statement
Informed Consent Statement
Data Availability Statement
Acknowledgments
Conflicts of Interest
References
- Chugh, P.; Soni, R.; Soni, S.K. Deoiled rice bran: A substrate for coproduction of a consortium of hydrolytic enzymes by Aspergillus niger P-19. Waste Biomass Valor. 2016, 7, 513–525. [Google Scholar] [CrossRef]
- Wang, W.; Wang, J.; Yan, R.; Zeng, R.; Zuo, Y.; Wang, D.; Qu, W. Expression and Characterization of a Novel Cold-Adapted and Stable β-Agarase Gene agaW1540 from the Deep-Sea Bacterium Shewanella sp. WPAGA9. Mar. Drugs 2021, 19, 431. [Google Scholar] [CrossRef] [PubMed]
- Lee, Y.; Jo, E.; Lee, Y.J.; Eom, T.Y.; Gang, Y.; Kang, Y.H.; Marasinghe, S.D.; Hettiarachchi, S.A.; Kang, D.H.; Oh, C. A Novel Agarase, Gaa16B, Isolated from the Marine Bacterium Gilvimarinus agarilyticus JEA5, and the Moisturizing Effect of Its Partial Hydrolysis Products. Mar. Drugs 2021, 20, 2. [Google Scholar] [CrossRef] [PubMed]
- Bamigboye, C.O.; Okonji, R.E.; Oluremi, I.O.; James, V. Stain removing, juice-clarifying, and starch-liquefying potentials of amylase from Pleurotus tuberregium in submerged fermentation system. J. Genet. Eng. Biotechnol. 2022, 20, 1–10. [Google Scholar] [CrossRef] [PubMed]
- Hammami, A.; Fakhfakh, N.; Abdelhedi, O.; Nasri, M.; Bayoudh, A. Proteolytic and amylolytic enzymes from a newly isolated Bacillus mojavensis SA: Characterization and applications as laundry detergent additive and in leather processing. Int. J. Biol. Macromol. 2018, 108, 56–68. [Google Scholar] [CrossRef]
- Myburgh, M.W.; Rose, S.H.; Viljoen-Bloom, M. Evaluating and engineering Saccharomyces cerevisiae promoters for increased amylase expression and bioethanol production from raw starch. FEMS Yeast Res. 2020, 20, foaa047. [Google Scholar] [CrossRef]
- Tiarsa, E.R.; Yandri, Y.; Suhartati, T.; Satria, H.; Irawan, B.; Hadi, S. The Stability Improvement of Aspergillus fumigatus α-Amylase by Immobilization onto Chitin-Bentonite Hybrid. Biochem. Res. Int. 2022, 2022, 5692438. [Google Scholar] [CrossRef]
- Kiribayeva, A.; Mukanov, B.; Silayev, D.; Akishev, Z.; Ramankulov, Y.; Khassenov, B. Cloning, expression, and characterization of a recombinant xylanase from Bacillus sonorensis T6. PLoS ONE 2022, 17, e0265647. [Google Scholar] [CrossRef]
- Gopinath, S.C.; Anbu, P.; Arshad, M.M.; Lakshmipriya, T.; Voon, C.H.; Hashim, U.; Chinni, S.V. Biotechnological processes in microbial amylase production. BioMed. Res. Int. 2017, 2017, 1272193. [Google Scholar] [CrossRef]
- Fu, X.T.; Kim, S.M. Agarase: Review of major sources, categories, purification method, enzyme characteristics and applications. Mar. Drugs 2010, 8, 200–218. [Google Scholar] [CrossRef] [Green Version]
- Bhardwaj, N.; Kumar, B.; Agarwal, K.; Chaturvedi, V.; Verma, P. Purification and characterization of a thermo-acid/alkali stable xylanases from Aspergillus oryzae LC1 and its application in Xylo-oligosaccharides production from lignocellulosic agricultural wastes. Int. J. Biol. Macromol. 2019, 122, 1191–1202. [Google Scholar] [CrossRef]
- Selim, S. Molecular characterization of thermostable xylanase producing Thermoactinomyces vulgaris HSB4. J. Pure Appl. Microbiol. 2016, 10, 1965–1969. [Google Scholar]
- Bhardwaj, N.; Kumar, B.; Verma, P. A detailed overview of xylanases: An emerging biomolecule for current and future prospective. Bioresour. Bioprocess 2019, 6, 40. [Google Scholar] [CrossRef]
- Philip, N.V.; Koteshwara, A.; Kiran, G.A.; Raja, S.; Subrahmanyam, V.M.; Chandrashekar, H.R. Statistical optimization for coproduction of chitinase and beta 1, 4-endoglucanase by chitinolytic Paenibacillus elgii PB1 having antifungal activity. Appl. Biochem. Biotechnol. 2020, 191, 135–150. [Google Scholar] [CrossRef]
- Tuysuz, E.; Gonul-Baltaci, N.; Omeroglu, M.A.; Adiguzel, A.; Taskin, M.; Ozkan, H. Coproduction of amylase and protease by locally isolated thermophilic bacterium Anoxybacillus rupiensis T2 in sterile and non-sterile media using waste potato peels as substrate. Waste Biomass Valor. 2020, 11, 6793–6802. [Google Scholar] [CrossRef]
- Jing, D.; Wang, J. Controlling the simultaneous production of laccase and lignin peroxidase from Streptomyces cinnamomensis by medium formulation. Biotechnol. Biofuels 2012, 5, 1–7. [Google Scholar] [CrossRef]
- Singh, R.; Kapoor, V.; Kumar, V. Utilization of agro-industrial wastes for the simultaneous production of amylase and xylanase by thermophilic actinomycetes. Braz. J. Microbiol. 2012, 43, 1545–1552. [Google Scholar] [CrossRef]
- Ali, S.M.; Omar, S.H.; Soliman, N.A. Coproduction of cellulase and xylanase enzymes by thermophilic Bacillus subtilis 276NS. Int. J. Biotechnol. Wellness 2013, 2, 65–74. [Google Scholar]
- Niyonzima, F.N.; More, S.S. Concomitant production of detergent compatible enzymes by Bacillus flexus XJU-1. Braz. J. Microbiol. 2014, 45, 903–910. [Google Scholar] [CrossRef]
- Limkar, M.B.; Pawar, S.V.; Rathod, V.K. Statistical optimization of xylanase and alkaline protease coproduction by Bacillus sp. using Box-Behnken Design under submerged fermentation using wheat bran as a substrate. Biocatal. Agric. Biotechnol. 2019, 17, 455–464. [Google Scholar] [CrossRef]
- Raza, A.; Bashir, S.; Tabassum, R. Statistical based experimental optimization for coproduction of endoglucanase and xylanase from Bacillus sonorensis BD92 with their application in biomass saccharification. Folia Microbiol. 2019, 64, 295–305. [Google Scholar] [CrossRef]
- Yadav, A.; Ali, A.A.M.; Ingawale, M.; Raychaudhuri, S.; Gantayet, L.M.; Pandit, A. Enhanced coproduction of pectinase, cellulase and xylanase enzymes from Bacillus subtilis ABDR01 upon ultrasonic irradiation. Process Biochem. 2020, 92, 197–201. [Google Scholar] [CrossRef]
- Shah, F.; Mishra, S. In vitro optimization for enhanced cellulose degrading enzyme from Bacillus licheniformis KY962963 associated with a microalgae Chlorococcum sp. using OVAT and statistical modeling. SN Appl. Sci. 2020, 2, 1923. [Google Scholar] [CrossRef]
- Singh, R.S.; Chauhan, K.; Kaur, K.; Pandey, A. Statistical optimization of solid-state fermentation for the production of fungal inulinase from apple pomace. Bioresour. Technol. Rep. 2020, 9, 100364. [Google Scholar] [CrossRef]
- Dahmen, N.; Lewandowski, I.; Zibek, S.; Weidtmann, A. Integrated lignocellulosic value chains in a growing bioeconomy: Status quo and perspectives. Gcb Bioenergy 2019, 11, 107–117. [Google Scholar] [CrossRef]
- Fatma, S.; Hameed, A.; Noman, M.; Ahmed, T.; Shahid, M.; Tariq, M.; Sohail, I.; Tabassum, R. Lignocellulosic biomass: A sustainable bioenergy source for the future. Protein Pept. Lett. 2018, 25, 148–163. [Google Scholar] [CrossRef]
- Shafiei, M.; Kumar, R.; Karimi, K. Pretreatment of lignocellulosic biomass. In Lignocellulose-Based Bioproducts; Springer: Cham, Switzerland, 2015; pp. 85–154. [Google Scholar]
- Mohamed, H.; Shah, A.M.; Song, Y. Conversion of Agro-industrial Wastes into Value-Added Products. In Conversion of Renewable Biomass into Bioproducts; American Chemical Society: Washington, DC, USA, 2021; pp. 197–217. [Google Scholar]
- Cortes-Tolalpa, L.; Norder, J.; van Elsas, J.D.; Falcao Salles, J. Halotolerant microbial consortia able to degrade highly recalcitrant plant biomass substrate. Appl. Microbiol. Biotechnol. 2018, 102, 29132927. [Google Scholar] [CrossRef]
- Susilowati, R.; Sabdono, A.; Widowati, I. Isolation and characterization of bacteria associated with brown algae Sargassum spp. from Panjang Island and their antibacterial activities. Procedia Environ. Sci. 2015, 23, 240–246. [Google Scholar] [CrossRef]
- Vaidya, S.; Rathore, P. Isolation, screening and characterization of amylase producing bacteria from soil of potato dump sites from different regions of Madhya Pradesh. In ACS Symposium Series; American Chemical Society: Washington, DC, USA, 2015. [Google Scholar]
- Zeng, C.; Zhang, L.; Miao, S.; Zhang, Y.; Zeng, S.; Zheng, B. Preliminary characterization of a novel β-agarase from Thalassospira profundimonas. Springerplus 2016, 5, 1–8. [Google Scholar] [CrossRef] [PubMed]
- Burlacu, A.; Cornea, C.P.; Israel-Roming, F. Screening of xylanase producing microorganisms. Res. J. Agric. Sci. 2016, 48, 8–15. [Google Scholar]
- Postgate, J.R.; Buchanan, R.E.; Gibbons, N.E. Bergey’s Manual of Determinative Bacteriology, 8th ed.; Williams and Wilkins Co.: Baltimore, MD, USA, 1974. [Google Scholar]
- Cline, S.W.; Schalkwyk, L.C.; Doolittle, W.F. Transformation of the archaebacterium Halobacterium volcanii with genomic DNA. J. Bact. 1989, 171, 4987–4991. [Google Scholar] [CrossRef]
- Bandal, J.N.; Tile, V.A.; Sayyed, R.Z.; Jadhav, H.P.; Azelee, N.I.; Danish, S.; Datta, R. Statistical Based Bioprocess Design for Improved Production of Amylase from Halophilic Bacillus sp. H7 Isolated from Marine Water. Molecules 2021, 26, 2833. [Google Scholar] [CrossRef]
- Palavesam, A. Investigation on lignocellulosic saccharification and characterization of haloalkaline solvent tolerant endo-1, 4 β-d-xylanase from Halomonas meridiana APCMST-KS4. Biocatal. Agric. Biotechnol. 2015, 4, 761–766. [Google Scholar] [CrossRef]
- Ferraz, J.L.D.A.A.; Souza, L.O.; Soares, G.A.; Coutinho, J.P.; de Oliveira, J.R.; Aguiar-Oliveira, E.; Franco, M. Enzymatic saccharification of lignocellulosic residues using cellulolytic enzyme extract produced by Penicillium roqueforti ATCC 10110 cultivated on residue of yellow mombin fruit. Bioresour. Technol. 2018, 248, 214–220. [Google Scholar] [CrossRef]
- Tsuji, A.; Takei, Y.; Nishimura, T.; Azuma, Y. Identification of New Halomonas Strains from Food-related Environments. Microbes Environ. 2022, 37, ME21052. [Google Scholar] [CrossRef]
- Thi Nguyen, H.Y.; Tran, G.B. Optimization of fermentation conditions and media for production of glucose isomerase from Bacillus megaterium using response surface methodology. Scientifica 2018, 2018, 6842843. [Google Scholar] [CrossRef]
- Su, Q.; Jin, T.; Yu, Y.; Yang, M.; Mou, H.; Li, L. Extracellular expression of a novel β-agarase from Microbulbifer sp. Q7, isolated from the gut of sea cucumber. AMB Express 2017, 7, 1–9. [Google Scholar] [CrossRef]
- Al-Johani, N.B.; Al-Seeni, M.N.; Ahmed, Y.M. Optimization of alkaline α-amylase production by thermophilic Bacillus subtilis. Afr. J. Tradit. Complement. Altern. Med. 2017, 14, 288–301. [Google Scholar] [CrossRef]
- Sanjivkumar, M.; Brindhashini, A.; Deivakumari, M.; Palavesam, A.; Immanuel, G. Investigation on saccharification and bioethanol production from pretreated agro-residues using a mangrove associated actinobacterium Streptomyces variabilis (MAB3). Waste Biomass Valor. 2018, 9, 969–984. [Google Scholar] [CrossRef]
- Ramanjaneyulu, G.; Rajasekhar Reddy, B. Optimization of xylanase production through response surface methodology by Fusarium sp. BVKT R2 isolated from forest soil and its application in saccharification. Front. Microbiol. 2016, 7, 1450. [Google Scholar] [CrossRef]
- Malhotra, G.; Chapadgaonkar, S.S. Taguchi optimization and scale up of xylanase from Bacillus licheniformis isolated from hot water geyser. J. Genet. Eng. Biotechnol. 2020, 18, 1–9. [Google Scholar] [CrossRef] [PubMed]
- Ghelich, R.; Jahannama, M.R.; Abdizadeh, H.; Torknik, F.S.; Vaezi, M.R. Central composite design (CCD)-Response surface methodology (RSM) of effective electrospinning parameters on PVP-B-Hf hybrid nanofibrous composites for synthesis of HfB2-based composite nanofibers. Compos. Part B Eng. 2019, 166, 527–541. [Google Scholar] [CrossRef]
- Saravanan, D.; Sureshkumar, V.; Radhakrishnan, M. Isolation and optimization of agarase producing bacteria from marine sediments. Int. J. ChemTech Res. 2015, 8, 1701–1705. [Google Scholar]
- Marimuthu, M.; Sorimuthu, A.; Muruganantham, S. Production and optimization of xylanase enzyme from Bacillus subtilis using agricultural wastes by solid state fermentation. Int. J. Pharm. Investig. 2019, 9, 169–173. [Google Scholar] [CrossRef] [Green Version]
- Shukla, R.J.; Singh, S.P. Production optimization, purification and characterization of α-amylase from thermophilic Bacillus licheniformis TSI-14. Starch-Stärke 2015, 67, 629–639. [Google Scholar] [CrossRef]
- Pandey, S.; Rekha, J.; Chaudhary, H.S. Xylanase: Recent update on commercial production and optimization of factors affecting its yield: A review. Asian J. Microbiol. Biotechnol. Environ. Sci. 2015, 17, 241–247. [Google Scholar]
- Amin, F.R.; Khalid, H.; Zhang, H.; Zhang, R.; Liu, G.; Chen, C. Pretreatment methods of lignocellulosic biomass for anaerobic digestion. AMB Express 2017, 7, 1–12. [Google Scholar] [CrossRef]
- Farias, F.O.; Jasko, A.C.; Colman, T.A.D.; Pinheiro, L.A.; Schnitzler, E.; Barana, A.C.; Demiate, I.M. Characterisation of cassava bagasse and composites prepared by blending with low-density polyethylene. Braz. Arch. Biol. Technol. 2014, 57, 821–830. [Google Scholar] [CrossRef]
- Ali, Z.; Hussain, M.; Arshad, M. Saccharification of corn cobs an agro-industrial waste by sulphuric acid for the production of monomeric sugars. Int. J. Biosci. 2014, 5, 204–213. [Google Scholar]
- Cui, S.W.; Wu, Y.; Ding, H. The range of dietary fibre ingredients and a comparison of their technical functionality. In Fibre-Rich and Wholegrain Foods: Improving Quality; Woodhead Publishing Ltd.: Cambridge, UK, 2013; pp. 96–119. [Google Scholar]
- De Figueiredo, F.C.; Carvalho, A.F.A.; Brienzo, M.; Campioni, T.S.; de Oliva-Neto, P. Chemical input reduction in the arabinoxylan and lignocellulose alkaline extraction and xylooligosaccharides production. Bioresour. Technol. 2017, 228, 164–170. [Google Scholar] [CrossRef]
- Zhang, Z.; Shah, A.M.; Mohamed, H.; Zhang, Y.; Tsiklauri, N.; Song, Y. Genomic Studies of White-Rot Fungus Cerrena unicolor SP02 Provide Insights into Food Safety Value-Added Utilization of Non-Food Lignocellulosic Biomass. J. Fungi 2021, 7, 835. [Google Scholar] [CrossRef]


| Symbol | Experimental Variables | Unit | Levels | ||||
|---|---|---|---|---|---|---|---|
| −α | −1 | 0 | +1 | +α | |||
| A | Temperature | °C | 23.18 | 30 | 40 | 50 | 56.82 |
| B | pH | - | 6.32 | 7 | 8 | 9 | 9.68 |
| C | Lactose Concentration | % | 0.16 | 0.5 | 1 | 1.5 | 1.84 |
| Characteristic | Observation |
|---|---|
| Morphology | Long Rod |
| Pigmentation | White |
| Gram Staining | Gram Negative |
| Motility | Motile |
| Catalase | Positive |
| Oxidase | Positive |
| Urease | Positive |
| Starch Hydrolysis | Positive |
| Casein Hydrolysis | Negative |
| Tween 20 hydrolysis | Positive |
| Tween 80 hydrolysis | Positive |
| Methyl Red | Negative |
| Vogues-Proskauer | Positive |
| Indole | Negative |
| Carbohydrate Fermentation | Positive |
| Hydrogen Sulfide production | Positive |
| Glucose Fermentation | Positive |
| Lactose Fermentation | Positive |
| Sucrose Fermentation | Positive |
| Agarase | Amylase | Xylanase | ||||
|---|---|---|---|---|---|---|
| Source | F Value | p Value Prob > F | F Value | p Value Prob > F | F Value | p Value Prob > F |
| Model | 45.27 | <0.0001 | 15.47 | <0.0001 | 9.94 | 0.0006 |
| A-Temperature | 7.83 | 0.0312 | 9.4 | 0.0107 | 21.63 | 0.0009 |
| B-pH | 1.85 | 0.2223 | 1.86 | 0.2003 | 2.05 | 0.183 |
| C-Lactose | 0.013 | 0.9134 | 2.98 | 0.1122 | 2.01 | 0.187 |
| AB | 1.08 | 0.3385 | 0.37 | 0.5559 | 0.006 | 0.9371 |
| AC | 1.9 | 0.2167 | 0.33 | 0.5745 | 0.13 | 0.7286 |
| BC | 1.8 | 0.228 | 0.22 | 0.6518 | 0.008 | 0.9297 |
| A square | 301.83 | <0.0001 | 75.61 | <0.0001 | 53.39 | < 0.0001 |
| B square | 148.97 | <0.0001 | 42.33 | <0.0001 | 15.29 | 0.0029 |
| C square | 17.06 | 0.0061 | - | - | 0.85 | 0.3791 |
| Runs | Temperature | pH | Lactose Conc. | Agarase Activity (U/mL) | Amylase Activity (U/mL) | Xylanase Activity (U/mL) | ||||||
|---|---|---|---|---|---|---|---|---|---|---|---|---|
| Actual | Code | Actual | Code | Actual | Code | Observed | Predicted | Observed | Predicted | Observed | Predicted | |
| 1 | 30 | −1 | 7 | −1 | 1.5 | +1 | 2.77 | 2.82 | 5.21 | 5.52 | 4.13 | 4.24 |
| 2 | 40 | 0 | 9.682 | +α | 1 | 0 | 1.42 | 1.4 | 3.63 | 3.55 | 3.12 | 3.04 |
| 3 | 50 | +1 | 9 | 1 | 0.5 | −1 | 0.92 | 1 | 3.01 | 3 | 1.18 | 1.09 |
| 4 | 30 | −1 | 9 | 1 | 0.5 | −1 | 2.05 | 2 | 3.75 | 3.7 | 3.06 | 3.24 |
| 5 | 30 | −1 | 7 | −1 | 0.5 | −1 | 2.64 | 2.58 | 4.22 | 4 | 3.65 | 3.82 |
| 6 | 30 | −1 | 9 | 1 | 1.5 | +1 | 2.89 | 2.81 | 4.05 | 4.17 | 3.84 | 3.91 |
| 7 | 40 | 0 | 6.318 | −α | 1 | 0 | 1.78 | 1.77 | 4.66 | 4.51 | 4.51 | 4.48 |
| 8 | 40 | 0 | 8 | 0 | 0.159 | −α | 2.74 | 2.66 | 6.33 | 6.42 | 4.84 | 4.92 |
| 9 | 40 | 0 | 8 | 0 | 1 | 0 | 3.46 | 3.36 | 7.19 | 7.54 | 5.66 | 5.57 |
| 10 | 40 | 0 | 8 | 0 | 1 | 0 | 3.62 | 3.36 | 7.62 | 7.54 | 5.37 | 5.57 |
| 11 | 40 | 0 | 8 | 0 | 1.841 | +α | 2.71 | 2.56 | 8.32 | 8.64 | 6.1 | 9 |
| 12 | 50 | +1 | 7 | −1 | 0.5 | −1 | 0.88 | 1 | 3.05 | 2.94 | 1.48 | 1.39 |
| 13 | 50 | +1 | 9 | 1 | 1.5 | +1 | 1.04 | 1 | 2.91 | 2.84 | 1.38 | 1.33 |
| 14 | 50 | +1 | 7 | −1 | 1.5 | +1 | 1 | 1 | 3.23 | 3 | 1.79 | 1.75 |
| 15 | 40 | 0 | 8 | 0 | 1 | 0 | 3.47 | 3.36 | 7.39 | 7.54 | 5.39 | 5.57 |
| 16 | 23.182 | −α | 8 | 0 | 1 | 0 | 1.25 | 1.17 | 3.94 | 3.52 | 3.1 | 2.88 |
| 17 | 40 | 0 | 8 | 0 | 1 | 0 | 3.18 | 3.36 | 7.73 | 7.54 | 5.81 | 5.57 |
| 18 | 40 | 0 | 8 | 0 | 1 | 0 | 3.33 | 3.36 | 7.29 | 7.54 | 5.51 | 5.57 |
| 19 | 56.818 | +α | 8 | 0 | 1 | 0 | 0.51 | 0.45 | 1.95 | 1.77 | 0.77 | 1.1 |
| 20 | 40 | 0 | 8 | 0 | 1 | 0 | 3.54 | 3.36 | 7.27 | 7.54 | 5.3 | 5.57 |
Publisher’s Note: MDPI stays neutral with regard to jurisdictional claims in published maps and institutional affiliations. |
© 2022 by the authors. Licensee MDPI, Basel, Switzerland. This article is an open access article distributed under the terms and conditions of the Creative Commons Attribution (CC BY) license (https://creativecommons.org/licenses/by/4.0/).
Share and Cite
Veerakumar, S.; Manian, R. Agarase, Amylase and Xylanase from Halomonas meridiana: A Study on Optimization of Coproduction for Biomass Saccharification. Fermentation 2022, 8, 479. https://doi.org/10.3390/fermentation8100479
Veerakumar S, Manian R. Agarase, Amylase and Xylanase from Halomonas meridiana: A Study on Optimization of Coproduction for Biomass Saccharification. Fermentation. 2022; 8(10):479. https://doi.org/10.3390/fermentation8100479
Chicago/Turabian StyleVeerakumar, Sneeha, and Rameshpathy Manian. 2022. "Agarase, Amylase and Xylanase from Halomonas meridiana: A Study on Optimization of Coproduction for Biomass Saccharification" Fermentation 8, no. 10: 479. https://doi.org/10.3390/fermentation8100479