Article

Effect of Fermentation Parameters on the Anthocyanin Content, Sensory Properties, and Physicochemical Parameters of Potato Blueberry Yogurt

1
Key Laboratory of Agricultural and Animal Products Store & Processing of Guizhou Province, Guizhou University, Guiyang 550025, China
2
College of Liquor and Food Engineering, Guizhou University, Guiyang 550025, China
3
School of Chemistry and Chemical Engineering, Guizhou University, Guiyang 550025, China
4
Guizhou Nanfang Dairy Co., Ltd., Guiyang 551499, China
*
Authors to whom correspondence should be addressed.
Fermentation 2022, 8(10), 489; https://doi.org/10.3390/fermentation8100489
Submission received: 26 July 2022 / Revised: 24 September 2022 / Accepted: 24 September 2022 / Published: 27 September 2022
(This article belongs to the Section Fermentation for Food and Beverages)

Abstract

:
Fruit yogurt with a variety of nutrients and fruit flavors is becoming increasingly popular among consumers. This study was conducted to achieve the optimum fermentation process parameters in preparing potato blueberry yogurt with high nutritional value and good flavor and taste by using one factor at a time experiment and response surface methodology. The optimum fermentation process was as follows: 33% potato saccharification solution, 22% blueberry juice, 38 °C fermentation temperature, 3.7% sucrose, 14% skimmed milk powder, 4% concentration of inoculum probiotics including Bifidobacterium animalis subsp. lactis BZ11, Lactobacillus plantarum LB12, and Streptococcus thermophilus Q-1 with their inoculum ratio of 1:1:2 and 12.5 h fermentation time. Potato saccharification solution, blueberry juice, fermentation temperature, and sucrose significantly affected the sensory value and quality of yogurt. Under this fermentation process, the sensory score of yogurt was 89.78. The prepared potato blueberry yogurt was rich in anthocyanins (9.41 mg/100 g), had a potential probiotic viable count of 9.31 log CFU/mL and pleasing color, and overcame the bitterness of potatoes. Electronic tongue analysis also shows that the potato blueberry yogurt had good sensory characteristics, such as high saltiness, umami, and aftertaste-A; low sourness, bitterness, and astringency; and moderate aftertaste-B and richness. This study laid the foundation for producing potato blueberry yogurt with good sensory value and high anthocyanin content.

1. Introduction

Yogurt is a dairy product made by fermentation of pasteurized milk by lactic acid bacteria. Yogurt has caught consumers’ attention because of its great nutritional value [1]. Considerable research has been undertaken to improve the flavor and nutritional value of yogurt. Some studies have shown that adding vegetables and fruits to yogurt improves its physicochemical and sensory properties [2,3]. Kowaleski et al. [4] produced probiotic yogurt formulations by adding strawberries and chia seeds and found that the nutritional value and the sensory of this yogurt were greatly improved. Fruit and vegetable juices and pulps are excellent career food substrates for probiotic bacteria [5]. Among such vegetables and fruits, the potato is one of the most crucial tuber crops containing many essential vitamins and minerals, especially vitamins C and B6, as well as the minerals potassium, magnesium, and iron [6]. Potatoes also have low-fat content and high starch. Excessive sugar intake can cause obesity, hypertension, and other diseases [7]. Consumers’ health awareness is increasing, so the demand for low-fat and low-sugar foods, including yogurt, is also rising. Sucrose is one of the important factors affecting the taste and texture of yogurt [8,9], and sugar can be obtained by saccharifying potato with α-amylase and glycosylase. Given that potatoes are rich in starch and various nutrients and low-fat content, adding potato saccharification liquid can make yogurt healthier and more nutritious.
Moreover, the use of fresh potatoes can reduce processing costs. Nevertheless, fresh potato saccharification solution or its saccharified liquid has a bitter taste, which may be masked by fruits such as blueberries. Adding blueberries to potato yogurt can mask potato bitterness, bring good fruit flavor, increase yogurt’s nutritional value, and contribute to the deep processing of blueberries. According to Miller et al. [10], blueberries are rich in bioactive substances, such as anthocyanins, chlorogenic acid, and polyphenols. Among these phytochemicals, anthocyanin has the greatest influence on human health, including antioxidant, cardiovascular disease prevention, anticancer, eye disease prevention, obesity control, and antidiabetic activities [11,12]. Anthocyanins are also a natural pigment responsible for the blue or red of blueberries, strawberries, grapes, etc. [13]. Blueberry anthocyanin inhibits pathogen synthesis by disrupting the cell-membrane structure and reducing the tricarboxylic acid cycle [14]. Yang et al. [15] extracted anthocyanins and polyphenols from blueberries, and the results showed that the extract has good antitumor and antioxidant activities. Many studies have shown that adding anthocyanins to yogurt can increase antioxidant activity [16,17]. Bacterial strain is essential to yogurt’s sensory value [18,19]. With the increasing market demand and consumers, more probiotics are being used as a starter for yogurt fermentation. In the present study, the excellent characteristic strains Bifidobacterium animalis subsp. lactis BZ11 and Lactobacillus plantarum LB12 and the commercial strain S. thermophilus Q-1 were used for co-fermentation to prepare a new nutritious, healthy yogurt with fruit flavor through Plackett–Burman (PB) design and Box–Behnken design (BBD).

2. Materials and Methods

2.1. Material

Skimmed milk powder, fresh potatoes, and blueberries were obtained from the local supermarket (Guiyang, China). Three potential probiotics were used. Lactobacillus plantarum LB12 was isolated from soursop, B. animalis subsp. lactis BZ11, which our laboratory screened, was kept in the China General Microbiological Culture Collection Management Center (No. 10224), and S. thermophilus Q-1 was obtained from Guiyang Nanfang Dairy Co., Ltd., Guiyang, China. All other chemicals were analytical grade and purchased from Sinopharm Chemical Reagent Co., Ltd., (Shanghai, China).

2.2. Pretreatment of Potato and Blueberry

Potatoes were soaked in a fivefold proportion of water for 30 min after peeling and dicing. After discarding the soaking water, the potatoes were cooked and ground with water at a low speed for 3 min using a blender at a ratio of 1:2 (w/v). Used in place of some sugar, the potato saccharification solution was liquefied with 2% high-temperature α-amylase and 0.8% glycosylase in a water bath at 90 °C and 60 °C for 1 and 3 h, respectively. Then, the potato saccharification solution was obtained. Blueberries were picked, cleaned, and boiled in a twofold proportion of water at 95 °C for 10 min to blunt enzyme. After cooling and pulping, blueberry juice was obtained.

2.3. Production of Potato Blueberry Yogurt

The materials for yogurt contained a certain proportion of potato saccharification solution, water, sucrose, and skimmed milk powder. The mixed materials were homogenized and sterilized at 90 °C for 10 min. Blueberry juice was heated at 90 °C for 10 min and cooled to room temperature. After adding blueberry juice to the mixed materials and a resuspended bacterial starter (5 × 10⁸ CFU/mL), the sample was fermented at 37 °C for a specific time and post-cooked at 4 °C for 24 h to obtain potato blueberry yogurt.

2.4. Microbiological Analysis of Yogurt Samples

The microorganism count in yogurt was determined using the method previously described by Bosnea et al. [20] with some modifications. In a typical procedure, 10 g of the yogurt sample was mixed with 90 mL of sterile water to obtain a one-tenth dilution. The other dilutions were prepared from the initial dilution. The dilutions of BZ11 and LB12 were cultured on modified deMan Rogosa and Sharpe (MRS) agar medium (Shanghai Bio-way Technology Co., Ltd., Shanghai, China) and MRS agar medium, respectively, whereas Q-1 was cultured on MacConkey (MC) agar medium (Shanghai Bio-way Technology Co., Ltd., Shanghai, China) to obtain microbial counts. The plates of BZ11, LB12, and Q-1 were incubated under anaerobic conditions for 48, 24, and 48 h at 37 °C, respectively.

2.5. Anthocyanin Content Analysis

Yogurt samples were placed in a clean beaker and extracted with hydrochloric acid–methanol (2:98) at a ratio of 1:10 (g/v) for 30 min at 37 °C and then centrifuged at 3960× g for 5 min. The pH differential method was used to determine the total anthocyanins content in yogurt [21,22]. About 1 mL of each sample was diluted to 10 mL using pH 1.0 (potassium chloride buffer) and pH 4.5 (sodium acetate buffer) solutions and incubated for 30 min at room temperature. Afterward, the absorbance values at 510 nm (OD510) and 700 nm (OD700) were measured with a microplate reader (Shanghai Sparkle Biotechnology Co., Ltd., Shanghai, China). The content of total anthocyanins was calculated according to the following formula:
Total   anthocyanin   content   ( mg / 100   g ) = ( Δ A × Mw × DF ) / ( ε × l )
where ΔA = (A510 − A700) pH 1.0 − (A510 − A700) pH 4.5; Mw is the molecular weight of cyanidin-3-O-glucoside equal to 449.2; DF is the dilution rate; ε is the molar absorptivity equal to 26,900 L·mol−1·cm−1; and l is the path length (1 cm in the experiment).

2.6. Soluble Solid Content, pH Determination, and Color Analysis

The soluble solids of the samples were detected using a Brix meter (PAL-101, Shenzhen, China). Before use, calibration with deionized water was performed. The pH of the yogurt samples was measured using a pH meter (Shanghai Yidian Scientific Instruments Co., Ltd., Shanghai, China). The color of samples was expressed as L* (lightness), a* (redness), and b* (yellowness) color space using a colorimeter. After weighing 30 g of the sample, it was placed in a 60 mm plastic petri dish. After calibration, measurements were conducted on three different spots of each sample (calibration value = 0).

2.7. Determination of Reducing Sugars

Assays for reducing sugars were performed using 3,5-dinitrosalicylic acid (DNS). One mL of yogurt dilution and 3 mL DNS solution (1% w/v 3,5-dinitrosalicylic acid, 30% w/v potassium sodium tartrate, 1.6% w/v NaOH) were added to a 25 mL stoppered glass test tube. Then, the tubes were placed in a water bath at 100 °C for 5 min. After cooling to room temperature, an addition of 6 mL of distilled water was mixed well and the absorbance at 520 nm was measured (UV-Vis Spectrophotometer TU-1810PC Beijing Pullout General Instrument Co., Ltd., Beijing, China), using glucose as a standard for quantification.

2.8. Sensory Evaluation

The sensory properties of potato blueberry yogurt were evaluated by Baba et al. [23] with slight modifications. The sensory attributes of yogurt samples (color, flavor, tissue state, mouthfeel, and overall acceptance) were evaluated by 20 teachers and graduates (10 men and 10 women aged between 18 and 45) who applied the five-point hedonic method. The sensory description is shown in Table S1 (Supplementary Materials). About 30 mL of yogurt was placed in plastic cups numbered randomly disordered. After each evaluation of a yogurt, evaluators were asked to clean their mouths with mineral water. The highest score (5) indicated that the sample received an excellent sensory value, and the lowest score (1) showed a low sensory value. Finally, each characteristic sensory rating was multiplied by a factor of 4 to obtain an index score with a total score of 100. A higher index score corresponded with a better yogurt taste.

2.9. One Factor at a Time (OFAT) Experiment

The initial yogurt fermentation process was as follows: 20% potato saccharification solution, 30% blueberry juice, 2.5% sucrose, 13.5% skimmed milk powder, 13 h fermentation time, 4% inoculum concentration, 1:1:2 of BZ11–LB12–Q-1 inoculum viable count proportion, and 37 °C fermentation temperature. Different addition amounts of potato saccharification solution (20%, 25%, 30%, 35%, and 40%), blueberry juice (20%, 25%, 30%, 35%, and 40%), sucrose (1.5%, 2.5%, 3.5%, 4.5%, and 5.5%), skimmed milk powder (8%, 10%, 12%, 14%, and 16%), fermentation time (12, 12.5, 13, 13.5, and 14 h), inoculum concentration (1%, 2%, 3%, 4%, and 5%), LB12–BZ11–Q-1 inoculum proportion (1:1:1, 1:2:2, 2:1:1, 2:2:1, and 1:1:2), and fermentation time (31 °C, 34 °C, 37 °C, 40 °C, and 43 °C) were selected successively for optimization.

2.10. Electronic Tongue Analysis

The Insent SA402B electronic tongue analysis system (Beijing Ying Sheng Heng Tai Technology Co., Ltd., Beijing, China) was used to collect the taste information of the yogurt. Test and reference sensors were activated for 24 h before sample testing [24]. The yogurt samples were diluted with equal deionized water, and the supernatant was placed in an airtight glass apparatus after centrifugation (7104× g, 5 min) [25]. For sample testing, approximately 25 mL of the diluted solution was added to the corresponding test measuring cup for taste value determination.

2.11. PB Design

PB design was used to evaluate the relative importance of various parameters by using the minimum experiments. A set of 12 experiments were conducted to assess the effects of the eight variables: potato saccharification solution (X1), blueberry juice (X2), fermentation temperature (X4), skimmed milk powder (X5), sucrose (X7), inoculum concentration (X8), fermentation time (X10), and inoculum ratio (X11). Eight independent variables, four dummy variables (X3, X6, X9, and X11), and two levels were set for each variable, high and low, coded by (+1) and (−1), respectively (Table 1).

2.12. BBD

On the basis of the PB design results, potato saccharification solution, blueberry juice, fermentation temperature, and sucrose were the most critical factors. Accordingly, BBD was applied to obtain the optimum fermentation process. Each parameter is listed in Table 2.

2.13. Statistical Analysis

The PB design, BBD design, data analysis, model establishment, one-way ANOVA, and correlation analysis were performed using the statistical software Design-Expert 8.0.6 (Stat-Ease, Inc., Minneapolis, MN, USA) and SPSS 26.0 (SPSS Inc., Chicago, IL, USA). Origin 2021 software (OriginLab, Northampton, MA, USA) was applied to draw the graph. Data were obtained from triplicate trials and are expressed as the average value ± standard deviation (SD). A significance level of 0.05 was used for statistical analysis according to Tukey’s multiple range tests.

3. Results

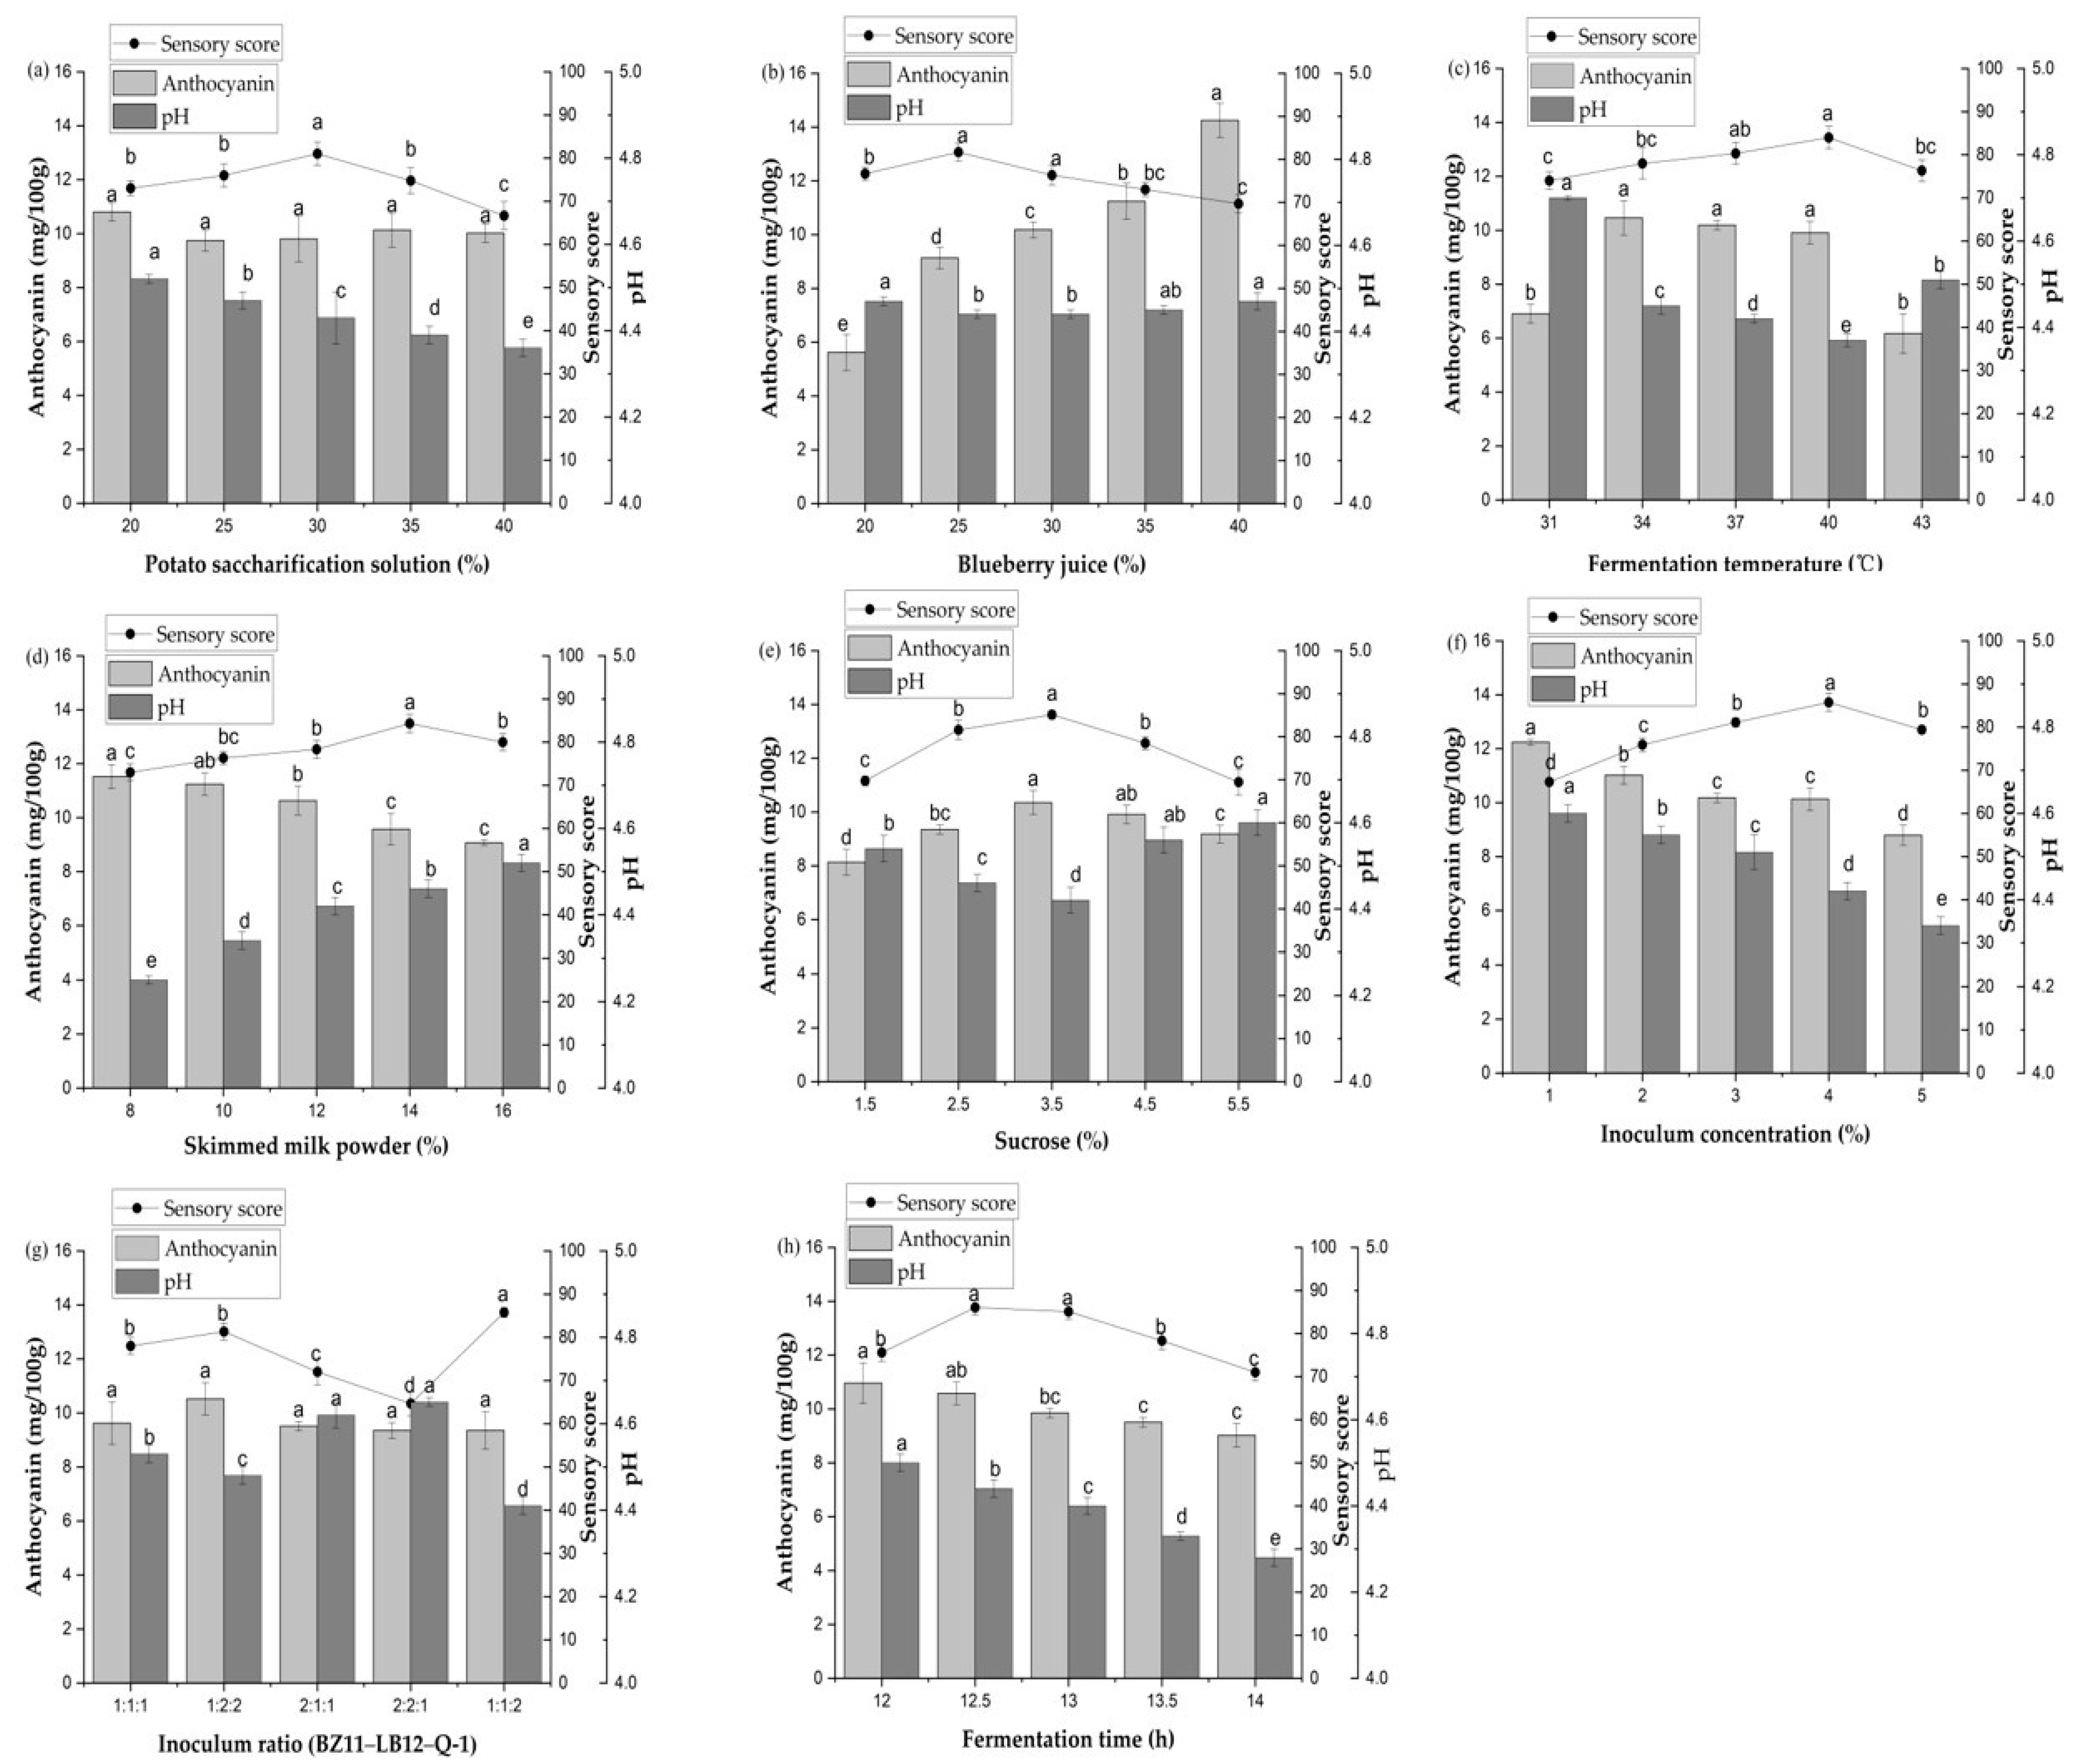
3.1. Effect of Potato Saccharification Solution on Potato Blueberry Yogurt

Figure 1a shows the effect of potato saccharification solution on potato blueberry yogurt. With increased potato saccharification solution addition, the pH of yogurt gradually decreased from 4.52 to 4.36 (p < 0.05). However, it had no significant effect on anthocyanin content (p > 0.05) because the anthocyanin in yogurt primarily originated from blueberries. When the addition amount was more than 30% or less than 25%, the sensory score decreased. In addition, when the addition amount was 30%, the number of viable bacteria was relatively high (Figure 2a). Thus, the optimum addition proportion of the potato saccharification solution was 30%.

3.2. Effect of Blueberry Juice on Potato Blueberry Yogurt

The effect of blueberry juice addition on potato blueberry yogurt is shown in Figure 1b. The sensory score initially increased and then decreased with grown blueberry juice. When the addition ratio of blueberry juice was 25%, the sensory score was the highest. The anthocyanin content increased significantly with the addition of blueberry juice (p < 0.05). The concentration of blueberry juice did not affect pH (p > 0.05). With an increased concentration of blueberry juice, pH initially decreased and then increased. That may be due to the inhibition of microorganism growth by the phenolic acids and other substances contained in blueberries. The higher concentration led to decreased microbial acid production. When the addition was 20–30%, the total viable count, Q-1, and BZ11 increased, while LB12 reached the minimum viable count at 25%, rising in the range of 25–40% (Figure 2b). Thus, 25% blueberry juice was selected.

3.3. Effect of Fermentation Temperature on Potato Blueberry Yogurt

As shown in Figure 1c, fermentation temperature had a significant effect on the pH of yogurt (p < 0.05). Between 31 °C and 40 °C, pH decreased with increased temperature, but greater than 40 °C, pH showed an upward trend. The sensory score had been rising from 37–40 °C. When fermented at 40 °C, yogurt samples had the highest sensory score. With increased fermentation temperature, anthocyanin content initially increased and then decreased. However, at 34–40 °C, anthocyanin content did not change significantly (p > 0.05). Fermentation temperature directly affects the growth of bacteria. The number of total bacteria increased first and then decreased with the increase in temperature (Figure 2c). At 43 °C, a large amount of whey precipitated, the growth of bacteria was inhibited, and the acid-producing speed slowed down, affecting the yogurt’s taste. According to the above results, 40 °C was more suitable for fermentation.

3.4. Effect of Skimmed Milk Powder on Potato Blueberry Yogurt

Figure 1d shows that skimmed milk powder concentration influenced yogurt’s sensory value, pH, and anthocyanin content. At 14%, yogurt had the most fragrance and highest sensory score (p < 0.05). With an increased concentration of skimmed milk powder, the pH of yogurt increased (p < 0.05). Conversely, anthocyanin content decreased slowly, and when it was 8–12%, anthocyanin concentration was significantly higher than when it was 14–16% (p < 0.05). Additionally, when the skimmed milk powder was 14%, the total viable counts were the highest (Figure 2d). According to the above analysis, 14% skimmed milk powder concentration was selected for addition to the yogurt.

3.5. Effect of Sucrose on Potato Blueberry Yogurt

Figure 1e shows the sucrose on potato blueberry yogurt. The pH of yogurt initially decreased and then increased with increased sucrose. The anthocyanin content and sensory score increased initially and then reduced with the increase of sucrose concentration. When the addition amount was 3.5%, the anthocyanin content and sensory score were the highest. As the sucrose concentration approached 4.5%, anthocyanin and sensory scores decreased significantly (p < 0.05). The total number of viable bacteria decreased first and then increased when the sucrose was 1.5–4.5%. The number continued to decline (Figure 2e). Therefore, a 3.5% sucrose concentration was selected.

3.6. Effect of Inoculum Concentration on Potato Blueberry Yogurt

Figure 1f reveals the influence of inoculum concentration on potato blueberry yogurt. The anthocyanin content and pH decreased with the increase in inoculation size (p < 0.05). On the contrary, the sensory score increased between 1% and 4%. As the inoculation concentration approached 4%, the sensory score decreased. When the inoculation amount was 1%, the content of anthocyanin was the highest, reaching 12.24 mg/100 g, and the score was the lowest, which was 67.30. Inoculation volumes of approximately 3–5% led to a slight increase in total living bacteria (Figure 2f). Inoculum concentration 4% was selected.

3.7. Effect of Inoculum Ratio on Potato Blueberry Yogurt

Figure 1g depicts the effect of the inoculum ratio on potato blueberry yogurt. The proportion of strains greatly influenced the sensory value and acid-production rate of yogurt products. Yogurt had a high sensory score when the inoculum ratio was 1:2:2 or 1:1:2. However, the influence of strain ratio on anthocyanin content was not significant (p > 0.05). This indicates that the strain’s effect on anthocyanin was not only related to a specific fermentation strain but also the result of the joint action of several strains. Accordingly, 1:1:2 was deemed the suitable inoculum ratio for yogurt.

3.8. Effect of Fermentation Time on Potato Blueberry Yogurt

Figure 1h shows that the fermentation time had a specific influence on anthocyanin content. When the fermentation time was 12–12.5 h, anthocyanin content was significantly higher than yogurt fermented for 13.5–14 h. Moreover, with prolonged fermentation time, pH decreased (p < 0.05), but sensory score initially increased then decreased because fermentation time significantly affected the yogurt’s curd state and quality. With the extension of the fermentation period, whey will precipitate, and the acidity will be too high, affecting the senses and inhibiting bacteria growth (Figure 2h). Thus, the fermentation time of 12.5 h was selected.

3.9. Plackett–Burman Design

According to the analysis of one factor at a time experiment, PB design was used to determine the critical variables affecting yogurt. The design matrix of twelve runs with eight variables, along with the corresponding responses for sensory score and anthocyanin content, are shown in Table 3. A first-order polynomial equation was fitted to the data obtained from the PB design experiments:
Y 0 = + 71.64 + 2.85 X 1 2.80 X 2 + 2.47 X 4 1.46 X 5 + 2.11 X 7 1.15 X 8 + 0.88 X 10 0.62 X 11
Y 1 = + 9.06 0.073 X 1 + 2.49 X 2 + 0.000 X 4 0.37 X 5 + 0.39 X 7 + 0.74 X 8 + 0.82 X 10 + 0.11 X 11
where Y0 and Y1 are the sensory scores and anthocyanin content, respectively; and X1, X2, X4, X5, X7, X8, X10, and X11 are potato saccharification solution, blueberry juice, fermentation temperature, skimmed milk powder, sucrose, inoculum concentration, fermentation time, and inoculum ratio, respectively.
The analysis of variance response values with sensory and anthocyanin content is shown in Table 4. The p-values of the two ANOVA models are less than 0.05, indicating that the models were significant. Potato saccharification solution (X1) and blueberry juice (X2) had an extremely significant (p < 0.01) effect on the sensory score of yogurt; fermentation temperature (X4) and sucrose (X7) showed a significant (p < 0.05) influence on the sensory value of potato blueberry yogurt. The following is the sequence in which factors affect sensory score: potato saccharification solution > blueberry juice > fermentation temperature > sucrose. Furthermore, for anthocyanin content, only the content of blueberry juice (X2) significantly affected the anthocyanin content, and the effect of blueberry juice on anthocyanin was investigated in the OFAT experiment. Thus, we tested only the sensory score in the response surface experiment with X1, X2, X4, and X7 as crucial factors for further optimization.

3.10. Response Surface Analysis by Box–Behnken Design

Sensory is the most important index for evaluating the yogurt fermentation process. Response surface methodology (RSM), which can be used to analyze the interaction between several variables more intuitively and find the optimal combination of test parameters, has been widely applied for optimization in food processing [26]. On the basis of the results of the one factor at a time experiment and PB design, RSM was adopted to further optimize the yogurt formula of the four individual factors of potato saccharification solution (A), blueberry juice (B), fermentation temperature (C), and sucrose (D) at three levels. A total of 29 experiments for RSM were performed to analyze the interactions between the factors and determine the optimum combination. The experimental RSM and the corresponding results are presented in Table 5. The regression model for sensory value was established using the second-order polynomial equation:
Y = + 88.52 + 1.29 A 1.92 B 1.82 C + 0.85 D 1.80 AC 1.08 AD + 0.25 BC 1.82 BD 0.55 CD 1.96 A 2 2.39 B 2 2.43 C 2 3.03 D 2
where Y is the sensory score, and A, B, C, and D are potato saccharification solution, blueberry juice, fermentation temperature, and sucrose, respectively.
The ANOVA of the regression model is listed in Table 6. This model had p < 0.0001, and its lack of fit was insignificant, indicating its statistical significance. The sensory score was R2 = 91.47, proving that the error between the actual and predicted value was small, showing model reliability. The model terms A, B, C, D, A2, B2, C2, D2, AC, and BD were found to be significant ones (p < 0.05), revealing that potato saccharification solution, blueberry juice, fermentation temperature, sucrose, and the interactions of potato saccharification solution with fermentation and blueberry juice with sucrose were significant. The interactions between AC (potato saccharification solution and temperature) and BD (blueberry juice and sucrose) were significant on the sensory value because the microorganisms metabolized the carbohydrates in the potato saccharification solution, thereby increasing the production of acids and affecting the senses with the increased fermentation temperature. Moreover, a higher content of blueberry juice resulted in increased yogurt sourness, whereas the sweetness brought by sucrose masked sourness to a certain degree.
The contour can reflect the intensity of interaction among various factors. Through RSM, the interaction of related variables was studied. We found that all factors had different degrees of interaction, among which only AC and BD had significant interaction (Figure 3), consistent with the results of variance analysis.

3.11. Determination and Validation of Yogurt Process

Finally, taking the sensory score as the response value, the optimum fermentation parameters were 32.78% potato saccharification solution content, 22.42% blueberry juice content, 38.10 °C fermentation temperature, and 3.74% sucrose. Under these conditions, the predicted sensory value was 88.52. For the convenience of production, the optimum technology was corrected as follows: 33% potato saccharification solution, 22% blueberry juice content, 38 °C fermentation temperature, and 3.7% sucrose. After six parallel experiments, the actual sensory score was 89.78 ± 1.6, and no significant difference existed compared with the predicted value. That proved that the yogurt-processing parameters obtained by RSM were reliable. Thus, a new potato blueberry yogurt with good sensory was produced.

3.12. Physicochemical Changes of Potato Blueberry Yogurt during Fermentation

Potato blueberry yogurt fermentation was performed under optimum conditions. The physical and chemical changes of yogurt during fermentation are shown in Table 7. As lactic acid accumulated through the metabolism of lactobacillus [27], pH decreased throughout the entire fermentation process, and the initial pH was 6.33. After fermentation for 4 h, yogurt pH began to decrease significantly. When fermentation finished, it was 4.47. The viable counts of BZ11, LB12, and Q-1 significantly increased (p < 0.05) when the fermentation time was between 4–8 h, which may be related to amino acids and vitamins in raw materials of yogurt which can provide more nutrients for the growth of strains [28] and exceeded the minimum probiotic group (106 CFU/mL) [29]. With prolonged fermentation time, anthocyanin content decreased slowly. After fermentation for 6 h, anthocyanin content decreased significantly. At the end of fermentation, anthocyanin concentration was 9.41 mg/100 g, which may be related to the degradation of anthocyanin by microorganisms. Soluble solids refer to substances that can dissolve in water. Yogurt contains sugar, protein, and various additives. The soluble solids during fermentation ranged from 19.56 ± 0.35% to 16.13 ± 0.31% (p < 0.05).
Color is an essential feature of food and the first sensory attribute of consumers to food, inevitably affecting consumer preference [30]. The L* of yogurt samples was 35.47 when fermented for 0 h, and it increased after 12.5 h (p < 0.05). The value of a* indicates redness, and the value of a* increased from 3.33 to 11.90 after fermentation for 12.5 h (p < 0.05). The color of potato blueberry yogurt obtained by fermentation of BZ11, LB12, and Q-1 (L* = 47.10, a* = 11.9, b* = −6.03) was similar to the color of commercial blueberry yogurt (L* = 65, a* = 10, b* = −3.5). Blueberry is a blue-purple fruit, and its color is undoubtedly related to the color of yogurt. The acidity change of yogurt detected during fermentation may explain the change in the value of a* because the acid may lead to changes in tissue structure then anthocyanins in blueberries permeate into yogurt [31]. Fermentation had no effect on b* (yellowness) (p > 0.05). At fermentation of 0 h, reducing sugar content was relatively high because the potato saccharification solution contained high reducing sugar (62.38 mg/mL). After fermentation, the reducing sugar content decreased as bacteria increased.

3.13. Correlation Analysis

Correlation can reveal the interaction between variables. Table 8 shows that viable counts significantly negatively correlated with anthocyanins, pH, soluble solids, and reducing sugar. Conversely, its correlation with the b* value was only −0.314, and it had a significant positive correlation with other factors.

3.14. Taste Attributes of Potato Blueberry Yogurt

The electronic tongue converts electrical signals into taste signals to distinguish yogurt taste with a low sensory threshold, avoiding the subjectivity of sensory evaluation [32]. In this article, an electronic tongue analysis of potato blueberry yogurt’s final product with optimized fermentation conditions was performed. Figure 4 shows the response values for eight different taste attributes (sourness, bitterness, astringency, aftertaste-B, aftertaste-A, umami, richness, and saltiness). The electronic tongue sensory score indicates that the prepared potato and blueberry yogurt has high saltiness, umami, and aftertaste-A; low sourness, bitterness, and astringency; and moderate aftertaste-B and richness.

4. Discussion

Potato saccharification solution can increase the sugar and solid content of yogurt and reduce the addition of sucrose. Microorganisms can use sugar as a nutrient, thereby increasing the number of microorganisms metabolizing lactose to lactic acid and resulting in reduced pH (Figure 2a) [33]. Thus, adjusting the content of potato saccharification solution can yield a product with better flavor and quality. When the potato saccharification solution was lower than 30%, the potato flavor of the yogurt was light. Conversely, when it was higher than 30%, the yogurt had a slightly rough and unpleasant astringency.
When the addition ratio of blueberry juice was 25%, yogurt was naturally purple-red with a rich blueberry fragrance and no peculiar smell and had the highest sensory score. Blueberries are rich in anthocyanins. Theoretically, a higher content of blueberry juice corresponded with higher anthocyanin content. However, adding blueberry juice and anthocyanin content was not a simple linear positive correlation and was instead related to the influence of microorganisms on anthocyanins during fermentation [34]. With an increased concentration of blueberry juice, pH initially decreased and then increased (Figure 1b). That may be due to the inhibition of microorganism growth by the phenolic acids and other substances contained in blueberries. The higher concentration led to decreased microbial acid production. When the amount of blueberry juice added was 40%, the total number of live bacteria was higher, but the taste of yogurt was sour, probably due to the addition of more blueberry juice (Figure 2b).
Fermentation temperature is one of the critical factors affecting the quality and sense of yogurt. With the increase of fermentation temperature, pH first increased and then decreased (Figure 1c). This phenomenon may be due to high or low temperatures unfavorable for the growth and metabolism of the selected strain, which affected its acid production (Figure 2c). With increased temperature within a specific range, the permeability of blueberry epidermal tissue increased microbial activity, which made the epidermal tissue easier to decompose, thereby promoting anthocyanin release. However, excessive temperature led to the decomposition of anthocyanin [35]. When fermented at 40 °C, yogurt samples had a thick texture, strong milk flavor, good sensory properties, and higher viable bacteria count (p < 0.05). This result may be due to the suitability of yogurt for the growth of lactic acid bacteria and bifidobacteria below 40 °C and the growth of S. thermophilus at 40–43 °C [36]. The yogurt sensory value was the result of the joint action of fermented strains, so it was affected by temperature.
The concentration of casein in milk directly affected the acidity, curd state, and flavor of yogurt. As the skimmed milk powder increased, pH increased, and anthocyanin content decreased (Figure 1d). That may be due to the high concentration of substrate, which inhibited the metabolism of bacteria from producing acid. Some studies have also shown that adding milk can significantly reduce anthocyanin content in samples [37].
Sucrose can be used as the carbon source of a microorganism after decomposition, which can promote lactic acid bacteria to produce acid. However, at high concentrations, the osmotic pressure of the system was high, thereby inhibiting the growth and metabolism of lactic acid bacteria and resulting in decreased acidity and increased pH. In addition to providing the required sweetness in a dairy product, sucrose’ s bulking properties contribute to the product’s total solids, giving texture, body, viscosity, and moisture retention [38]. From the organizational state of yogurt, yogurt fermented with different sucrose contents is consistent. However, low sucrose content leads to insufficient sweetness, whereas high sucrose content leads to too much sweetness and health issues. Notably, low-sugar yogurt products are favored by consumers. Only when the sucrose content was 3.5% did the sweetness and acidity of yogurt become moderate, and the taste was fragrant. The anthocyanin content in adding 1.5% sucrose group was significantly lower than that of the other groups (Figure 1e) (p < 0.05), which may be due to the protective effect of sucrose on anthocyanin stability [39]. However, the anthocyanin content in 3.5% sucrose was significantly higher than in 5.5% sucrose. When the sucrose content was higher, the microbial activity was more robust, which decomposed anthocyanins.
Figure 1f shows the inoculum concentration was less than 4% (v/v). Yogurt produced less acid and was sweeter. Its curd state was also unsatisfactory and its sensory score was low. When the inoculum concentration was more than 4% (v/v), acid production was excessive, acidity significantly increased, the curd was unreasonable, the whey precipitated, and the sensory score decreased (p > 0.05). Furthermore, the large inoculum size caused a significant decrease in yogurt pH (p < 0.05), and acidity increased. Generally, yogurt pH decreased, and acidity increased simultaneously because the starter produced lactic acid during fermentation. Inoculum level can alter the acidification rate [40], i.e., with increased inoculation amount, the acid-producing speed of the starter increases, so yogurt pH significantly decreases. Similar results have been observed in previous studies [41,42]. With increased inoculum concentration, anthocyanin content decreased, which further proved that the selected fermentation strains could degrade anthocyanin during fermentation.
When the proportion of Q-1 was appropriately increased, products with better flavor could be obtained, the sensory score increased, and the acid production was faster (Figure 1g). The acid-producing rate of different strains varied, and interaction occurred among different strains [43]. Thus, the fermentation process can be better controlled by selecting the appropriate proportion of strains.
Fermentation time also changed when different ingredients were added to the yogurt. A previous study showed that incubation at 43 °C for 8 h is the optimum for wheat dextrin yogurt [44]. The optimum state was achieved with a prolonged time when fermented for 12.5–13 h. Although no significant difference existed between the fermentation time of 12.5 and 13 h in terms of sensory value and anthocyanin content, the final fermentation time of 12.5 h was the optimum for saving time and cost. The anthocyanin content decreased with the extension of fermentation time (Figure 1h). That was due to the microbial decomposition of more anthocyanin with a longer fermentation time. When fermentation exceeded 13 h, the acidity of the yogurt was too high, which had an inhibiting effect on the growth of bacteria.
The PB test (Table 3 and Table 4) and response surface test (Table 5 and Table 6) determined that potato saccharification solution, blueberry juice, sucrose, and fermentation temperature were significant parameters affecting potato blueberry yogurt fermentation. Through the study’s findings, the optimal fermentation conditions for achieving the best yogurt were as follows: 33% potato saccharification solution, 22% blueberry juice content, 38 °C fermentation temperature, and 3.7% sucrose. These optimal conditions resulted in an overwhelming sensory score (89.78 ± 1.6), with pleasing color, and nutrition.
The potato saccharification solution has bitterness, but the potato blueberry yogurt obtained had no bitterness through appropriate raw material combination and fermentation. Yogurt improves potatoes’ edible value, mainly due to nutritional complementarity, synergistic effect, and microbial transformation.
Correlation analysis (Table 8) shows that BZ11, LB12, and Q-1 have synergistic effects on the increase of L* and a* values and the decrease of pH, anthocyanin, and reducing sugar, but they do not influence b*. That may be due to the increased number of microorganisms with prolonged fermentation time. The microorganisms degraded the anthocyanins and consumed some soluble solids to produce acid, affecting the soluble solids content, pH, and L*. Additionally, anthocyanins in raw materials exhibited different colors at different pH values and red under acidic conditions, leading to longer fermentation time, larger a*, and redder yogurt. The b* values started to decline, and the a* and L* values increased (Table 7). Moreover, these changes coincide with the evolution of the pH, which indicates that the color also depends on the pH. Anthocyanins have many physiological functions such as antioxidant, cardiovascular disease prevention, anticancer, eye disease prevention, obesity control, and antidiabetic activities; the anthocyanins content in this new potato and blueberry yogurt reached 9.41 mg/100 g, greatly enhancing its nutritional value.
The electronic tongue is a group of non-specific chemical sensors with partial sensitivity to different constituents, which can provide the food’s digital taste “fingerprint” [45]. The electronic tongue analysis indicates the sensory properties of potato and blueberry yogurt (Figure 4). The bitterness and astringency were low, suggesting adding blueberry juice can indeed reduce the bitterness and astringency of potatoes, which was consistent with the previous sensory evaluation results. It is also interesting that although the pH of yogurt is low (about 4.47), the sourness of yogurt is very soft, resulting in the low sourness. High saltiness, but not salty in the mouth, suggests that adding blueberry juice and potatoes introduces a lot of salt that is not sodium chloride and enhances the nutritional value. Xu et al. [46] analyzed the sensory properties of soy protein yogurt using an Insent SA402B electronic tongue. This yogurt also showed sensory properties such as high saltiness, low sourness, bitterness, and astringency, and moderate richness. Adding blueberry juice and potato saccharification solution can greatly improve the taste and nutrition of yogurt.

5. Conclusions

Blueberry and potato were successfully applied to yogurt processing as novel and attractive food additives. The fermentation parameters for developing potato blueberry yogurt were optimized by one factor at a time experiment, PB design, and RSM. Results showed that potato and blueberry juice incorporated into yogurt significantly improved its anthocyanin concentration, probiotics concentration, textural, color properties, and sensory characteristics. Electronic tongue analysis also showed that the prepared potato blueberry yogurt had good sensory properties. These improved aspects are undoubtedly the most attractive to consumers. Moreover, the prepared yogurt improves the edible value of potatoes. This study helped develop a high-quality potato-blueberry yogurt, which can help further the processing of potato–blueberry foods.

Supplementary Materials

The following supporting information can be downloaded at: https://www.mdpi.com/article/10.3390/fermentation8100489/s1, Table S1: Scoring scale of sensory evaluation criteria.

Author Contributions

Conceptualization, M.L.; data curation, Z.H., H.T., C.Y., L.L., X.Z. and G.R.; formal analysis, Z.H., C.L. and H.T.; investigation, L.L. and G.R.; methodology, C.L., C.Y. and X.Z.; writing—original draft, M.L.; writing—review & editing, L.H. All authors have read and agreed to the published version of the manuscript.

Funding

This work was financially supported by the High-level innovative talents training project of Guizhou Province (QKHPTRC-GCC [2022]026-1), the Key Agricultural Project of Guizhou Province (QKHZC-[2021] YB184, QKHZC-[2021] YB 278, QKHZC-[2021] YB 142, QKHZC-[2019]2382, and QKHZC-[2016]2580), Natural Science Foundation of China (31870002 and 31660010), and Qiankehe talents project ([2018]5781 and [2017]5788-11).

Institutional Review Board Statement

Not applicable.

Informed Consent Statement

Not applicable.

Data Availability Statement

Data is contained in the main article and Supplementary Materials.

Conflicts of Interest

The authors declare no conflict of interest.

References

  1. Savaiano, D.A.; Hutkins, R.W. Yogurt, cultured fermented milk, and health: A systematic review. Nutr. Rev. 2021, 79, 599–614. [Google Scholar] [CrossRef]
  2. Yildiz, E.; Ozcan, T. Functional and textural properties of vegetable-fibre enriched yoghurt. Int. J. Dairy Technol. 2018, 72, 199–207. [Google Scholar] [CrossRef]
  3. Kiros, E.; Seifu, E.; Bultosa, G.; Solomon, W.K. Effect of carrot juice and stabilizer on the physicochemical and microbiological properties of yoghurt. LWT-Food Sci. Technol. 2016, 69, 191–196. [Google Scholar] [CrossRef]
  4. Kowaleski, J.; Quast, L.B.; Steffens, J.; Lovato, F.; dos Santos, L.R.; da Silva, S.Z.; de Souza, D.M.; Felicetti, M.A. Functional yogurt with strawberries and chia seeds. Food Biosci. 2020, 37, 100726. [Google Scholar] [CrossRef]
  5. Zhu, W.; Lyu, F.; Naumovski, N.; Ajlouni, S.; Ranadheera, C.S. Functional efficacy of probiotic Lactobacillus sanfranciscensis in apple, orange and tomato juices with special reference to storage stability and in vitro gastrointestinal survival. Beverages 2020, 6, 13. [Google Scholar] [CrossRef]
  6. Beals, K.A. Potatoes, nutrition and health. Am. J. Potato Res. 2018, 96, 102–110. [Google Scholar] [CrossRef]
  7. Shetty, A. Significance of sugar intake in young adults: A review. Int. J. Adolesc. Med. Health 2021, 33, 375–378. [Google Scholar] [CrossRef] [PubMed]
  8. Torrico, D.D.; Tam, J.; Fuentes, S.; Viejo, C.G.; Dunshea, F.R. Consumer rejection threshold, acceptability rates, physicochemical properties, and shelf-life of strawberry-flavored yogurts with reductions of sugar. J. Sci. Food Agric. 2020, 100, 3024–3035. [Google Scholar] [CrossRef]
  9. Gomes, E.R.; Carneiro, L.C.M.; Stephani, R.; Carvalho, A.F.d.; Renhe, I.R.T.; Wolfschoon-Pombo, A.F.; Perrone, Í.T. Effect of sugar reduction and addition of corn fibre and polydextrose on pore size and syneresis of yoghurt. Int. Dairy J. 2022, 129, 105298. [Google Scholar] [CrossRef]
  10. Miller, K.; Feucht, W.; Schmid, M. Bioactive compounds of strawberry and blueberry and their potential health effects based on human intervention studies: A brief overview. Nutrients 2019, 11, 1510. [Google Scholar] [CrossRef] [Green Version]
  11. Wang, L.; Wang, L.; Wang, X.; Lu, B.; Zhang, J. Preparation of blueberry anthocyanin liposomes and changes of vesicle properties, physicochemical properties, in vitro release, and antioxidant activity before and after chitosan modification. Food Sci. Nutr. 2022, 10, 75–87. [Google Scholar] [CrossRef] [PubMed]
  12. Amini, A.M.; Muzs, K.; Spencer, J.P.; Yaqoob, P. Pelargonidin-3-O-glucoside and its metabolites have modest anti-inflammatory effects in human whole blood cultures. Nutr. Res. 2017, 46, 88–95. [Google Scholar] [CrossRef]
  13. Alappat, B.; Alappat, J. Anthocyanin pigments: Beyond aesthetics. Molecules 2020, 25, 5500. [Google Scholar] [CrossRef]
  14. Sun, X.-h.; Zhou, T.-T.; Wei, C.-H.; Lan, W.-Q.; Zhao, Y.; Pan, Y.-J.; Wu, V.C.H. Antibacterial effect and mechanism of anthocyanin rich Chinese wild blueberry extract on various foodborne pathogens. Food Control 2018, 94, 155–161. [Google Scholar] [CrossRef]
  15. Yang, S.; Wang, C.; Li, X.; Wu, C.; Liu, C.; Xue, Z.; Kou, X. Investigation on the biological activity of anthocyanins and polyphenols in blueberry. J. Food Sci. 2021, 86, 614–627. [Google Scholar] [CrossRef]
  16. Anuyahong, T.; Chusak, C.; Adisakwattana, S. Incorporation of anthocyanin-rich riceberry rice in yogurts: Effect on physicochemical properties, antioxidant activity and in vitro gastrointestinal digestion. LWT-Food Sci. Technol. 2020, 129, 109571. [Google Scholar] [CrossRef]
  17. Jaster, H.; Arend, G.D.; Rezzadori, K.; Chaves, V.C.; Reginatto, F.H.; Petrus, J.C.C. Enhancement of antioxidant activity and physicochemical properties of yogurt enriched with concentrated strawberry pulp obtained by block freeze concentration. Food Res. Int. 2018, 104, 119–125. [Google Scholar] [CrossRef]
  18. Horiuchi, H.; Inoue, N.; Liu, E.; Fukui, M.; Sasaki, Y.; Sasaki, T. A method for manufacturing superior set yogurt under reduced oxygen conditions. J. Dairy Sci. 2009, 92, 4112–4121. [Google Scholar] [CrossRef] [PubMed]
  19. Aryana, K.J.; Olson, D.W. A 100-year review: Yogurt and other cultured dairy products. J. Dairy Sci. 2017, 100, 9987–10013. [Google Scholar] [CrossRef] [PubMed]
  20. Bosnea, L.A.; Kopsahelis, N.; Kokkali, V.; Terpou, A.; Kanellaki, M. Production of a novel probiotic yogurt by incorporation of L. casei enriched fresh apple pieces, dried raisins and wheat grains. Food Bioprod. Process. 2017, 102, 62–71. [Google Scholar] [CrossRef]
  21. Lang, Y.; Li, B.; Gong, E.; Shu, C.; Si, X.; Gao, N.; Zhang, W.; Cui, H.; Meng, X. Effects of α-casein and β-casein on the stability, antioxidant activity and bioaccessibility of blueberry anthocyanins with an in vitro simulated digestion. Food Chem. 2021, 334, 127526. [Google Scholar] [CrossRef] [PubMed]
  22. Dorris, M.R.; Voss, D.M.; Bollom, M.A.; Krawiec-Thayer, M.P.; Bolling, B.W. Browning index of anthocyanin-rich fruit juice depends on pH and anthocyanin loss more than the gain of soluble polymeric pigments. J. Food Sci. 2018, 83, 911–921. [Google Scholar] [CrossRef]
  23. Baba, W.N.; Jan, K.; Punoo, H.A.; Wani, T.A.; Dar, M.M.; Masoodi, F.A. Techno-functional properties of yoghurts fortified with walnut and flaxseed oil emulsions in guar gum. LWT-Food Sci. Technol. 2018, 92, 242–249. [Google Scholar] [CrossRef]
  24. Liu, J.; Zuo, M.; Low, S.S.; Xu, N.; Chen, Z.; Lv, C.; Cui, Y.; Shi, Y.; Men, H. Fuzzy evaluation output of taste information for liquor using electronic tongue based on cloud model. Sensors 2020, 20, 686. [Google Scholar] [CrossRef]
  25. Ye, Y.; Li, P.; Zhou, J.; He, J.; Cai, J. The improvement of sensory and bioactive properties of yogurt with the introduction of tartary buckwheat. Foods 2022, 11, 1774. [Google Scholar] [CrossRef] [PubMed]
  26. Wang, C.; Yin, H.; Zhao, Y.; Zheng, Y.; Xu, X.; Yue, J. Optimization of high hydrostatic pressure treatments on soybean protein isolate to improve its functionality and evaluation of its application in yogurt. Foods 2021, 10, 667. [Google Scholar] [CrossRef]
  27. de Campo, C.; Assis, R.Q.; da Silva, M.M.; Costa, T.M.H.; Paese, K.; Guterres, S.S.; de Oliveira Rios, A.; Flores, S.H. Incorporation of zeaxanthin nanoparticles in yogurt: Influence on physicochemical properties, carotenoid stability and sensory analysis. Food Chem. 2019, 301, 125230. [Google Scholar] [CrossRef]
  28. Huang, Z.; Huang, L.; Xing, G.; Xu, X.; Tu, C.; Dong, M. Effect of co-fermentation with lactic acid bacteria and K. marxianus on physicochemical and sensory properties of goat milk. Foods 2020, 9, 299. [Google Scholar] [CrossRef]
  29. Erkaya-Kotan, T. In vitro angiotensin converting enzyme (ACE)-inhibitory and antioxidant activity of probiotic yogurt incorporated with orange fibre during storage. J. Food Sci. Technol. 2020, 57, 2343–2353. [Google Scholar] [CrossRef]
  30. Dimitrellou, D.; Solomakou, N.; Kokkinomagoulos, E.; Kandylis, P. Yogurts supplemented with juices from grapes and berries. Foods 2020, 9, 1158. [Google Scholar] [CrossRef]
  31. Estrada, J.D.; Boeneke, C.; Bechtel, P.; Sathivel, S. Developing a strawberry yogurt fortified with marine fish oil. J. Dairy Sci. 2011, 94, 5760–5769. [Google Scholar] [CrossRef] [PubMed]
  32. Zhang, L.; Hu, Y.; Wang, Y.; Kong, B.; Chen, Q. Evaluation of the flavour properties of cooked chicken drumsticks as affected by sugar smoking times using an electronic nose, electronic tongue, and HS-SPME/GC-MS. LWT 2021, 140, 110764. [Google Scholar] [CrossRef]
  33. Ahmad, I.; Xiong, Z.; Hanguo, X.; Khalid, N.; Rasul Suleria, H.A. Effect of enzymatically hydrolyzed potato powder on quality characteristics of stirred yogurt during cold storage. J. Food Process. Preserv. 2021, 45, e15690. [Google Scholar] [CrossRef]
  34. Ścibisz, I.; Ziarno, M.; Mitek, M.; Zaręba, D. Effect of probiotic cultures on the stability of anthocyanins in blueberry yoghurts. LWT-Food Sci. Technol. 2012, 49, 208–212. [Google Scholar] [CrossRef]
  35. Liu, Y.; Liu, Y.; Tao, C.; Liu, M.; Pan, Y.; Lv, Z. Effect of temperature and pH on stability of anthocyanin obtained from blueberry. J. Food Meas. Charact. 2018, 12, 1744–1753. [Google Scholar] [CrossRef]
  36. Tarrah, A.; Noal, V.; Treu, L.; Giaretta, S.; da Silva Duarte, V.; Corich, V.; Giacomini, A. Short communication: Comparison of growth kinetics at different temperatures of Streptococcus macedonicus and Streptococcus thermophilus strains of dairy origin. J. Dairy Sci. 2018, 101, 7812–7816. [Google Scholar] [CrossRef]
  37. Cebeci, F.; Sahin-Yesilcubuk, N. The matrix effect of blueberry, oat meal and milk on polyphenols, antioxidant activity and potential bioavailability. Int. J. Food Sci. Nutr. 2014, 65, 69–78. [Google Scholar] [CrossRef]
  38. Torrico, D.D.; Tam, J.; Fuentes, S.; Viejo, C.G.; Dunshea, F.R. D-tagatose as a sucrose substitute and its effect on the physico-chemical properties and acceptability of strawberry-flavored yogurt. Foods 2019, 8, 256. [Google Scholar] [CrossRef]
  39. Watanabe, Y.; Yoshimoto, K.; Okada, Y.; Nomura, M. Effect of impregnation using sucrose solution on stability of anthocyanin in strawberry jam. LWT-Food Sci. Technol. 2011, 44, 891–895. [Google Scholar] [CrossRef]
  40. Bitaraf, M.S.; Khodaiyan, F.; Mohammadifar, M.A.; Mousavi, S.M. Application of response surface methodology to improve fermentation time and rheological properties of probiotic yogurt containing Lactobacillus reuteri. Food Bioprocess Technol. 2010, 5, 1394–1401. [Google Scholar] [CrossRef]
  41. Qiu, L.; Zhang, M.; Mujumdar, A.S.; Chang, L. Effect of edible rose (Rosa rugosa cv. Plena) flower extract addition on the physicochemical, rheological, functional and sensory properties of set-type yogurt. Food Biosci. 2021, 43, 101249. [Google Scholar] [CrossRef]
  42. Wang, X.; Kristo, E.; LaPointe, G. Adding apple pomace as a functional ingredient in stirred-type yogurt and yogurt drinks. Food Hydrocoll. 2020, 100, 105453. [Google Scholar] [CrossRef]
  43. Atwaa, E.S.H.; Shahein, M.R.; El-Sattar, E.S.A.; Hijazy, H.H.A.; Albrakati, A.; Elmahallawy, E.K. Bioactivity, physicochemical and sensory properties of probiotic yoghurt made from whole milk powder reconstituted in aqueous fennel extract. Fermentation 2022, 8, 52. [Google Scholar] [CrossRef]
  44. Peerkhan, N.; Nair, S. Optimization of wheat dextrin yogurt formulation using response surface methodology. J. Food Sci. Technol. 2021, 58, 1740–1749. [Google Scholar] [CrossRef]
  45. Tudor Kalit, M. Application of electronic nose and electronic tongue in the dairy industry. Mljekarstvo 2014, 64, 228–244. [Google Scholar] [CrossRef]
  46. Xu, X.; Cui, H.; Xu, J.; Yuan, Z.; Liu, X.; Fan, X.; Li, J.; Zhu, D.; Liu, H. Effects of different probiotic fermentations on the quality, soy isoflavone and equol content of soy protein yogurt made from soy whey and soy embryo powder. LWT 2022, 157, 113096. [Google Scholar] [CrossRef]
Figure 1. Effect of potato saccharification solution (a), blueberry juice (b), fermentation temperature (c), skimmed milk powder (d), sucrose (e), inoculum concentration (f), inoculum ratio (g), and fermentation time (h) on the sensory value, pH, and anthocyanin of potato blueberry yogurt. Different letters above each bar mean significant differences.
Fermentation 08 00489 g001
Figure 2. Effect of potato saccharification solution (a), blueberry juice (b), fermentation temperature (c), skimmed milk powder (d), sucrose (e), inoculum concentration (f), inoculum ratio (g), and fermentation time (h) on the BZ11, LB12, Q-1, and total viable counts of potato blueberry yogurt.
Fermentation 08 00489 g002
Figure 3. The 3D response surface for the results of the sensory score.
Fermentation 08 00489 g003
Figure 4. Spider plot for electronic tongue sensory score of potato blueberry yogurt.
Fermentation 08 00489 g004
Table 1. PB design factors and levels.
VariablesUnitsLevels
−11
X1—potato saccharification solution%2535
X2—blueberry juice%2030
X4—fermentation temperature°C3743
X5—skimmed milk powder%1216
X7—sucrose%2.54.5
X8—inoculum concentration%35
X10—fermentation timeh1213
X11—inoculum ratio (BZ11-LB12-Q-1) 1:1:11:2:2
X3, X6, X9, X12 −11
Table 2. BBD design factors and horizontal coding.
VariablesLevels
−101
Potato saccharification solution (%)253035
Blueberry juice (%)202530
Fermentation temperature (°C)374043
Sucrose (%)2.53.54.5
Table 3. PB test results of the sensory and anthocyanin.
RunX1X2X3X4X5X6X7X8X9X10X11Sensory ScoreAnthocyanin Content
(mg/100 g)
1−1−1−11−111−111178.96 ± 0.787.57 ± 0.24
2111−1−1−11−111−174.67 ± 0.8112.25 ± 025
311−1111−1−1−11−174.00 ± 1.6310.63 ± 0.13
4−1−1−1−1−1−1−1−1−1−1−170.69 ± 0.494.17 ± 0.18
51−1−1−11−111−11175.92 ± 1.347.40 ± 0.24
61−111−1111−1−1−181.42 ± 1.507.85 ± 0.21
7−11−111−1111−1−168.17 ± 1.0210.68 ± 0.32
8−1−11−111−1111−164.57 ± 1.128.13 ± 0.11
9−1111−1−1−11−11167.00 ± 0.8213.30 ± 0.14
1011−1−1−11−111−1165.83 ± 0.8711.46 ± 0.18
11−111−1111−1−1−1163.33 ± 0.7010.96 ± 0.11
121−1111−1−1−11−1175.07 ± 0.654.34 ± 0.15
Table 4. ANOVA of the Plackett–Burman design.
SourceSum of SquaresdfMean SquareF Valuep Value
SensoryModel373.51846.6917.890.0186 **
X197.41197.4137.330.0088 **
X294.25194.2536.120.0092 **
X473.06173.06280.0132 *
X525.55125.559.790.0521
X753.38153.3820.460.0202 *
X815.89115.896.090.0902
X109.3819.383.60.1542
X114.5814.581.750.2773
Residual7.8332.61
Cor total381.3311
AnthocyaninModel92.43811.559.430.0458 *
X10.06510.0650.0530.8332
X274.1174.160.470.0044 **
X401000
X51.6611.661.350.3289
X71.8311.831.490.3095
X86.616.65.390.103
X108.0418.046.560.0831
X110.1510.150.120.7534
Residual3.6831.23
Cor total96.1111
Note: ** indicates p < 0.01, * indicates p < 0.05.
Table 5. Response surface experimental design results.
RunPotato Saccharification Solution (%)Blueberry Juice (%)Temperature (°C)Sucrose (%)Sensory Score
1000086.5 ± 1.47
2010181.9 ± 1.41
3001180.6 ± 0.81
4000089.2 ± 0.82
5−110080.6 ± 1.25
600−1−183.8 ± 2.18
700−1185.0 ± 0.98
8101083.0 ± 0.94
9001−181.6 ± 1.24
101−10087.1 ± 1.82
11000090.5 ± 0.82
12−101083.2 ± 1.18
1301−1083.5 ± 0.82
140−1−1088.4 ± 1.89
15000086.9 ± 1.23
160−10−181.9 ± 2.05
17−100−180.6 ± 2.94
1810−1089.5 ± 1.25
190−10188.4 ± 1.25
20011079.3 ± 1.67
21100−184.5 ± 2.49
22−100184.5 ± 2.05
230−11083.2 ± 2.16
24000089.5 ± 1.63
25−1−10084.5 ± 2.16
26100184.1 ± 1.86
27110083.2 ± 2.94
28−10−1082.5 ± 2.88
29010−181.9 ± 2.36
Table 6. ANOVA of response surface.
SourceSum of SquaresdfMean SquareF Valuep Value
Model246.451417.610.64<0.0001 **
A-potato saccharification solution20.05120.0512.110.0037 **
B-blueberry juice44.43144.4326.840.0001 **
C-temperature39.64139.6423.950.0002 **
D-sucrose8.6918.695.250.038 *
AB01001
AC131137.850.0141 *
AD4.6214.622.790.1169
BC0.2510.250.150.7034
BD10.53110.536.360.0244 *
CD1.2111.210.730.4069
A225.01125.0115.110.0016 **
B237.01137.0122.360.0003 **
C238.18138.1823.070.0003 **
D259.4159.435.89<0.0001 **
Residual23.17141.66
Lack of fit11.12101.110.370.9082
Pure error12.0543.01
Cor total269.6228
Note: ** indicates p < 0.01, * indicates p < 0.05.
Table 7. Physical and chemical changes during fermentation.
Time (h)Anthocyanin (mg/100 g)pHSoluble Solids (%)L*a*b*Total Viable Counts
log CFU/mL
Q-1 Viable Counts
log CFU/mL
LB12 Viable Counts log CFU/mLBZ11 Viable Counts
log CFU/mL
Reducing Sugar (mg/mL)
011.69 ± 0.33 a6.33 ± 0.03 a19.56 ± 0.35 a35.47 ± 0.21 f3.33 ± 0.21 d−5.73 ± 0.40 a7.04 ± 0.04 g6.88 ± 0.03 g6.31 ± 0.01 e6.10 ± 0.17 f63.69 ± 0.13 a
211.52 ± 0.59 a6.32 ± 0.02 a19.23 ± 0.35 ab36.57 ± 0.35 e3.50 ± 0.36 d−5.73 ± 0.66 a7.14 ± 0.03 f6.99 ± 0.09 f6.36 ± 0.03 e6.10 ± 0.17 f60.18 ± 0.25 b
411.13 ± 0.32 ab6.19 ± 0.01 b18.93 ± 0.15 b37.37 ± 0.63 d3.53 ± 0.40 d−6.43 ± 0.75 a7.25 ± 0.07 e7.11 ± 0.07 e6.42 ± 0.10 e6.36 ± 0.10 e58.22 ± 0.31 c
610.74 ± 0.35 bc6.07 ± 0.02 c18.50 ± 0.10 c39.97 ± 0.64 c3.80 ± 0.26 d−5.90 ± 0.10 a7.59 ± 0.02 d7.27 ± 0.05 d7.04 ± 0.04 d6.97 ± 0.06 d53.61 ± 0.36 f
810.19 ± 0.17 cd5.66 ± 0.03 d17.90 ± 0.10 d40.47 ± 0.25 c5.47 ± 0.29 c−6.23 ± 0.15 a8.12 ± 0.02 c7.57 ± 0.03 c7.72 ± 0.01 c7.64 ± 0.07 c56.34 ± 0.18 d
109.85 ± 0.60 de5.02 ± 0.07 e17.06 ± 0.12 e43.33 ± 0.06 b9.10 ± 0.26 b−6.20 ± 0.26 a8.56 ± 0.01 b7.76 ± 0.03 b8.18 ± 0.02 b8.18 ± 0.03 b55.29 ± 0.27 e
12.59.41 ± 0.10 e4.47 ± 0.03 f16.13 ± 0.31 f47.10 ± 0.52 a11.90 ± 0.10 a−6.03 ± 0.40 a9.31 ± 0.03 a7.95 ± 0.05 a8.79 ± 0.08 a8.71 ± 0.03 a50.56 ± 0.22 g
Note: a–g means within the same column without a common superscript are significantly different (p < 0.05).
Table 8. Correlation analysis of physical and chemical changes during fermentation.
BZ11 Viable CountsLB12 Viable CountsQ-1 Viable CountsTotal Viable CountsAnthocyaninpHSoluble SolidsL*a*b*Reducing Sugar
BZ11 viable counts1
LB12 viable counts0.997 **1
Q-1 viable counts0.994 **0.991 **1
Total viable counts0.988 **0.993 **0.983 **1
Anthocyanin−0.992 **−0.985 **−0.997 **−0.976 **1
pH−0.969 **−0.975 **−0.962 **−0.990 **0.950 **1
Soluble solids−0.987 **−0.987 **−0.988 **−0.996 **0.983 **0.987 **1
L*0.975 **0.975 **0.972 **0.987 **−0.972 **−0.973 **−0.993 **1
a*0.934 **0.946 **0.925 **0.970 **−0.907 **−0.993 **−0.965 **0.951 **1
b*−0.364−0.317−0.426−0.3140.4500.3050.362−0.305−0.2361
Reducing sugar−0.840 *−0.824 *−0.853 *−0.833 *0.877 **0.781 *0.861 *−0.900 *−0.7330.3541
Note: ** indicates p < 0.01, * indicates p < 0.05.
Publisher’s Note: MDPI stays neutral with regard to jurisdictional claims in published maps and institutional affiliations.

