Article

Acetate Secretion Induces Bacteriocin Synthesis and Activates the Transcriptional Regulators rgg and rpoD

1
Engineering Research Center of Agricultural Microbiology Technology, Ministry of Education, Heilongjiang University, Harbin 150500, China
2
Key Laboratory of Microbiology, College of Heilongjiang Province, School of Life Sciences, Heilongjiang University, Harbin 150080, China
*
Authors to whom correspondence should be addressed.
Fermentation 2022, 8(10), 524; https://doi.org/10.3390/fermentation8100524
Submission received: 11 September 2022 / Revised: 5 October 2022 / Accepted: 6 October 2022 / Published: 8 October 2022
(This article belongs to the Section Microbial Metabolism, Physiology & Genetics)

Abstract

:
Bacteriocins from lactic acid bacteria are natural preservatives that inhibit foodborne pathogenic microorganisms. Co-culture is a form of population competition to induce bacteriocin production. In this study, we aimed to investigate the regulatory response of Lactaseibacillus paracasei HD1.7 to population competition and examine acetic stress during bacteriocin production. The cell-free supernatant of Bacillus subtilis positively and negatively regulated L. paracasei HD1.7 bacteriocin production, which depended on the growth period of B. subtilis ATCC 11774 and the addition ratio of the cell-free supernatant. We found that L. paracasei HD1.7 sensed B. subtilis ATCC 11774 through the cell-free supernatant, and then, acetic acid was secreted to promote bacteriocin production. There was a close connection between acetic acid metabolism and the bacteriocin regulatory system. In addition, transcriptomic analysis revealed that the functions of the transcriptional regulators rgg and rpoD in the bacteriocin regulatory system were enhanced with increasing acetic acid stress concentration. Collectively, the results of this study increase our current understanding of L. paracasei HD1.7 bacteriocin production and provide insights into high bacteriocin production by co-culture or acetic acid induction.

1. Introduction

With the frequent use of antibiotics, drug resistance has become a major threat, and there is an urgent need to address this problem. Bacteriocins produced by lactic acid bacteria can be used as natural food preservatives, which could alleviate current problems associated with overuse of antibiotics and emerging drug-resistant microorganisms [1]. In recent years, vegetable by-product lactofermentation has become a new source of antimicrobial compounds [2]. L. paracasei HD1.7, a lactic acid bacterium, was isolated from Chinese sauerkraut juice in previous work and can produce bacteriocins [3]. Bacteriocins can be used to kill and prevent the invasion of foreign microorganisms [4]. Therefore, promoting the development and application of new antimicrobial agents has become a hot spot in food science research.
The natural production of bacteriocins in nature is generally considered to be the result of producers’ domination of the environment and producers’ competition for limited resources [5,6]. Bacteriocin production relies on inferences regarding the presence of competitors and the density and fitness of the producers [7]. The “competition sensing hypothesis”, which is particularly relevant to bacteriocin production, posits that bacteria have evolved the ability to sense and respond to competition [8]. Activation of bacteriocin-regulated pathways is often regulated by stress responses triggered by competition-related stressors such as nutrient stress and cellular damage [9]. Co-culture is a form of population competition to induce bacteriocin production [1,10,11]. Producers of bacteriocins kill neighbouring sensitive cells, thereby increasing available resources nearby and freeing up space and resources in the process [12]. A variety of environmental factors affect the expression of bacteriocins, including cell density, nutrient conditions and acetic acid [12]. The production cost of bacteriocins is high, and producers only produce bacteriocins when they are compelled to do so [9,13]. To detect competitors, bacteria mostly depend on generic competition cues informing them of damage to themselves or their siblings, lack of nutrients, or competitive environments [7]. One way to achieve this is for cells to be able to detect ‘alarm’ cues released by attacked siblings [7]. The purpose of acetic acid secretion is to allow bacteria to grow faster to higher cell densities [14], and acetic acid may be a factor for environmental monitoring [15]. Moreover, acetic acid activates lactobacillus bacteriocins for synthesis by controlling quorum sensing [16]. Therefore, it is necessary to elucidate the link between acetate secretion, environmental competition and bacteriocin production.
In a previous review, bacteriocin production was regulated by two systems (Figure S1) [17]. The preregulation system is composed of comCDE; the postregulation system is composed of comRS (comR is also called rgg) and comX (comX is a sigma factor, called sigX or rpoD). The sigma 70 is the sigma factor primarily responsible for the acetyl-CoA synthetase transcription that cells induce during the mid-exponential phase, and sigma S partially inhibits that transcription as cells enter the stationary phase [18]. The sigma factor regulates acetic acid production and alters H+ concentration. H+ can enhance the autophosphorylation of membrane protein ComD, and the sigma factor protein becomes stable and mature after H+ binds to histidine on the sigma factor protein [19]. H+ affects not only bacteriocin production, but also bacteriocin activity [20]. However, the activity of bacteriocin has a wider pH range [17]. The sigma factor rpoD or σ70 in Escherichia coli is responsible for transcribing genes for the basic machinery of cell growth and replication [21]. All organisms depend upon their ability to respond appropriately to changes in their environments and/or temporary disappearance of nutrients [21]. In addition, rgg has the ability to regulate biofilm formation [22]. However, the response of rgg and sigma factors to acetate stress is less studied.
In a previous study, L. paracasei HD1.7 was co-cultured with Bacillus, and it was found that three Bacillus species promoted the production of bacteriocin [23]. The current study was a continuation of that previous study. This study aimed to analyse the effects of Bacillus subtilis on the bacteriocin regulatory system; examine its induction mechanism; identify acetic acid as a population-competing secretion; and determine its effect on bacterial growth. Finally, the transcriptional regulators rgg and rpoD were shown to regulate intracellular growth metabolism in response to acetic acid stress by transcriptomic techniques.

2. Materials and Methods

2.1. Strains and Cultivation

Lactaseibacillus paracasei HD1.7 (CCTCCM 205015) [24], isolated from sauerkraut, a traditional Chinese pickle, was used to study the relationship with B. subtilis (ATCC 11774) during co-culture. L. paracasei HD1.7 acted as a bacteriocin producer; B. subtilis ATCC 11774 acted as a competitor to induce bacteriocin production. L. paracasei HD1.7 was grown in a slightly modified MRS (Aoboxing, Beijing, China) liquid medium at 37 °C. The ratio of beef paste and yeast extract was 1% and 0.5%, respectively. L. paracasei HD1.7 was acetic-acid-stressed in sterile modified MRS. B. subtilis ATCC 11774 was grown in beef extract peptone (BP) medium (Aoboxing) (0.3% beef extract, 1% peptone, 0.5% NaCl; pH 7.0; w/v) at 37 °C. The reagents required for the above media were purchased from Beijing Auboxing Biotechnology, China. When the cell-free supernatant (CFS) of B. subtilis ATCC 11774 induces L. paracasei HD1.7 to produce bacteriocins, B. subtilis ATCC 11774 and L. paracasei HD1.7 were separately cultured using Co-Culture medium (1% yeast extract, 2% glucose, 0.25% KH2PO4, 0.02% MgSO4, 0.1% 1 M Ca (NO3)2, 0.1% 0.1 M MnCl2, 0.1% 1 mM FeSO4 1 mL; pH 6.5; w/v) and incubated at 37 °C (160 rpm) for 60 h. The reagents required for the above media were purchased from Beijing Auboxing Biotechnology, China. L. paracasei HD1.7 cultured in MRS medium produced acetic acid; cultured in Co-Culture medium did not produce acetic acid. Moreover, the concentration of bacteriocin produced by L. paracasei HD1.7 was also inconsistent in these two media.

2.2. Establishment of the Co-Culture System

To analyse the effect of the secretion of B. subtilis ATCC 11774 on L. paracasei HD1.7, the cell-free supernatant of B. subtilis ATCC 11774 was obtained at different times in this study (excluding the effect of the continuous growth of B. subtilis ATCC 11774). The CFS of B. subtilis ATCC 11774 was obtained following centrifugation (Beckman, American) at 10,625× g for 10 min at 4 °C. The CFS was further filtered with an air pump (0.22 μm bacterial filter).
B. subtilis ATCC 11774 was cultured for 8 h (CFS-B8), 12 h (CFS-B12), 24 h (CFS-B24), 36 h (CFS-B36), 48 h (CFS-B48) and 60 h (CFS-B60), and then, the CFS of B. subtilis ATCC 11774 was further obtained at different times. L. paracasei HD1.7 was cultured for 12 h. Then, the CFS of B. subtilis ATCC 11774 at different times and the L. paracasei HD1.7 for 12 h were mixed in a ratio of 1:1, the final volume was 200 mL, and the shake flask fermentation was continued. The bacteriocin content was measured according to a previous method [23]. Cell-free supernatant of L. paracasei HD1.7 was obtained following centrifugation (Beckman, America) at 1500× g for 15 min at 4 °C. The CFS was further filtered with an air pump (0.22 μm bacterial filter). The antimicrobial activity of the bacteriocin was assessed by an agar-well diffusion method [23]. Cell-free supernatant (CFS) of L. paracasei HD1.7 was obtained following centrifugation (Beckman, American) at 12,000 rpm for 10 min at 4 °C. CFS was further filtered with an air pump (0.22 μm bacterial filter). The concentration of B. subtilis was 107 CFU/mL. Antimicrobial activity was determined by measuring the diameter of the zone of inhibition around each well. B. subtilis was used as an indicator, and the agar diffusion test was used to determine the antibacterial activity of bacteriocin. The standard curve was described by the equation y = 0.0901 x + 0.8286 (where x is the difference in the diameters of the bacteriostatic area and the Oxford cup and y is the valence pair of bacteriocin). The bacteriocin content was used to determine the type of CFS (time point), and the CFSs were then co-cultured with L. paracasei HD1.7 in different proportions. The volume ratios of L. paracasei HD1.7 and CFS were 1:3, 1:2, 1:1, 2:1 and 3:1, respectively. Water instead of CFS was used as the control group. Culturing continued for 60 h, and sampling was performed every 12 h. The pH value of the bacterial solution and the absorbance value at OD600nm were measured according to conventional methods. The secretions (lactic acid, acetic acid) and bacteriocin content of L. paracasei HD1.7 were measured [17,23]. The supernatant obtained following centrifugation of culture sample was analysed for glucose, lactic acid and acetic acid via HPLC with a Waters 2410 refractive-index detector and an Aminex HPX-87 H column (Bio Rad Corp., Hercules, CA, USA) at 50 °C [23]. The acetic acid stress concentration was determined according to the above acetic acid concentration.

2.3. Acetic Acid Stress Experiment

L. paracasei HD1.7 was cultured for 12 h, and 1.90 mL/L (2 g/L), 5.70 mL/L (6 g/L) and 9.50 mL/L (10 g/L) acetic acid were added. Culturing continued for 60 h, and sampling was performed every 12 h. The experimental groups were abbreviated as Ace2, Ace6 and Ace10. The secretions (lactic acid, acetic acid) and bacteriocin content of L. paracasei HD1.7 were measured. Samples (Ace2, Ace6 and Ace10) cultured for 24 h were subjected to transcriptome sequencing analysis. Three replicates were performed for each sample.

2.4. RNA Extraction and qRT-PCR to Detect Gene Expression

The expression of L. paracasei HD1.7 preregulation system genes (comC, comD and comE), postregulation system genes (rgg, sigma 24, sigma 54, sigma 70–1, sigma 70–2 and rpoD), and bacteriocin gene was determined. The specific methods were as follows.
The RNA prep pure bacterial total RNA extraction kit (Tiangen Biotech Co., Ltd., Beijing, China) was used to extract liquid bacterial RNA, and a Nanodrop 2000 spectrophotometer (Thermo Scientific Co., Ltd., Waltham, MA, USA) at 260/280 nm was employed to determine the purity and concentration of the RNA sample. Reverse transcription was synthesized using a BioRT cDNA First-Strand Synthesis Kit (TransGen Biotech Co., Ltd., Beijing, China). The cDNA was used as a template in each group. SYBR Solution/RealMaster Mix (Vazyme Biotech Co., Ltd., Nanjing, China) and deionized water were added to a 7500 Real-Time PCR System (Applied Biosystems, Inc., Waltham, MA, USA) to amplify the genes.
Real-time quantitative PCR was used to detect gene expression, with 16 S rRNA as the internal reference gene for calibration and standardization. The primers designed for PCR amplification were 16 S rRNA-up, 5′-AGAAGAAGCACCGGCTAACTC-3′ and 16 S rRNA-down, 5′-CTCTACGCATTTCACCGCTAC-3′ [23]. The CT value was analysed for each sample by the relative quantitative 2△△CT method, with normalization to the value for the reference gene 16 S rRNA. Primer design sequences are shown in Table S1.

2.5. Library Construction and Sequencing

After total RNA was extracted, eukaryotic mRNA was enriched by oligo (dT) beads in Ace2, Ace6 and Ace10, while prokaryotic mRNA was enriched by removing the rRNA with a Ribo-ZeroTM Magnetic Kit (Epicentre, Madison, WI, USA). Then, the enriched mRNA was fragmented into short fragments using fragmentation buffer and reverse transcribed into cDNA with random primers. Second-strand cDNA was synthesized by DNA polymerase I, RNase H, dNTPs and buffer. Then, the cDNA fragments were purified with a QiaQuick PCR extraction kit, end repaired, poly (A) added, and ligated to Illumina sequencing adapters. The ligation products were size selected by agarose gel electrophoresis, PCR amplified, and sequenced using Illumina HiSeqTM 2500 by Gene Denovo Biotechnology Co. (Guangzhou, China).
After calculating the expression level of each gene, EdgeR was applied to analyse the differential expression. During the analysis, a threshold value of p ≤ 0.05 and an absolute value of log2FC (fold change) ≥ 1.5 were used to judge the significance of the differences in gene expression. The differential genes (DEGs) were then used for KEGG (Kyoto Encyclopedia of Genes and Genomes) enrichment analysis. The sequencing data were deposited in Sequence Read Archive (SRA) at NCBI under accession number PRJNA749155.

2.6. Statistical Analysis

All data were analysed with Origin 2020 b (OriginLab Corp., Northampton, MA, USA). Each sample was repeated 3 times. Scatterplots and heatmaps were generated on the Tutools platform (https://www.cloudtutu.com, accessed on 25 December 2021), a free online data analysis website. Co-occurrence network analysis was performed by SPSS (version 23.0) and Gephi (0.92) to analyse the potential regulatory functions of the transcriptional regulators rpoD and rgg. Structural equation modelling (SEM) was conducted with IBM SPSS AMOS (version 23.0) to verify whether acetic acid affects bacteriocin production by activating the bacteriocin regulatory system. The effects of bacteriocin regulation system, OD600nm value, pH value, acetic acid concentration and lactic acid concentration on the production of bacteriocin were comprehensively analysed.

3. Results

3.1. CFS-B Regulates Bacteriocin Production

CFS-B regulates bacteriocin production by L. paracasei HD1.7. When the inoculation ratio of CFS-B was 1:1, CFS-B12 promoted the production of bacteriocins the highest; other CFS-Bs (CFS-B24, CFS-B36 and CFS-B48) affected bacteriocin production to varying degrees (Figure S2a). Obviously, there is something produced by B. subtilis ATCC 11774 in CFS-B12 in higher concentrations than other CFS-Bs. CFS-B60 treatment decreased the CFU of L. paracasei HD1.7, but other CFS-B treatments did not affect the CFU of L. paracasei HD1.7 (Figure S2b). Therefore, CFS-B12 and CFS-B60 were selected for further experiments.
The inoculation ratio of CFS-B also affected bacteriocin production. CFS-B12 promoted bacteriocin production under five different ratios (Figure 1a). CFS-B12 with a ratio of 1:3 induced the most bacteriocin production, while other ratios (1:2, 1:1, 2:1 and 3:1) of CFS-B12 induced a gradual decrease in bacteriocin production. It was initially shown that the promotion of bacteriocin production by CFS-B12 was positively dependent on the concentration of the inducer. In CFS-B60 treatment, the effects of five ratios of CFS-B60 on bacteriocin production were inhibition (1:3 and 1:2), no effect (1:1) and promotion (2:1 and 3:1) (Figure 1b). It was shown that in CFS-B60, there is a positive and negative feedback regulation of bacteriocin production.

3.2. Acetic Acid as a Predictor of High Bacteriocin Production

In the CFS-B12 (1:3) and CFS-B60 (3:1) treatments, the bacteriocin concentration reached a maximum at 48 h (Figure 1a,b). Interestingly, the control group did not produce acetic acid from 36 h to 48 h, while the experimental group did produce acetic acid (in CFS-B12: 2.57 ± 0.25 g/L, in CFS-B60: 2.83 ± 0.50 g/L); almost no acetic acid was produced at other time points (Figure 1c,d). Additionally, CFS-B12 and CFS-B60 did not contain acetic acid, indicating that acetic acid was produced by L. paracasei HD1.7 (Table S2). Furthermore, L. paracasei HD1.7 growth was not arrested (Table S3).
In the acetic acid treatment, acetic acid rapidly increased the production of bacteriocin as the acetic acid concentration increased (Figure 1e). Furthermore, the highest concentrations of bacteriocins were consistent in the 6 g/L and 10 g/L acetic acid treatments. In addition, the concentration of extracellular acetic acid was significantly positively correlated with the concentration of bacteriocin (Figure 1f). Bacteriocin production was increased in acetic acid, lactic acid and HCl treatments, but there was no significant difference in bacteriocin concentrations in sodium acetate, sodium lactate and NaCl treatments (Figure S3). The results indicated that H+ was the main factor in the induced production of bacteriocins. Acetic acid induced bacterial production by decreasing pH, whereas when CFS-B was added, pH increased at 12 h (Figure S4). Thus, CFS-B induces L. paracasei HD1.7 to secrete acetic acid, which provides H+ to enhance bacteriocin production.

3.3. CFS-B and Acetic Acid Activate the Bacteriocin Regulatory System

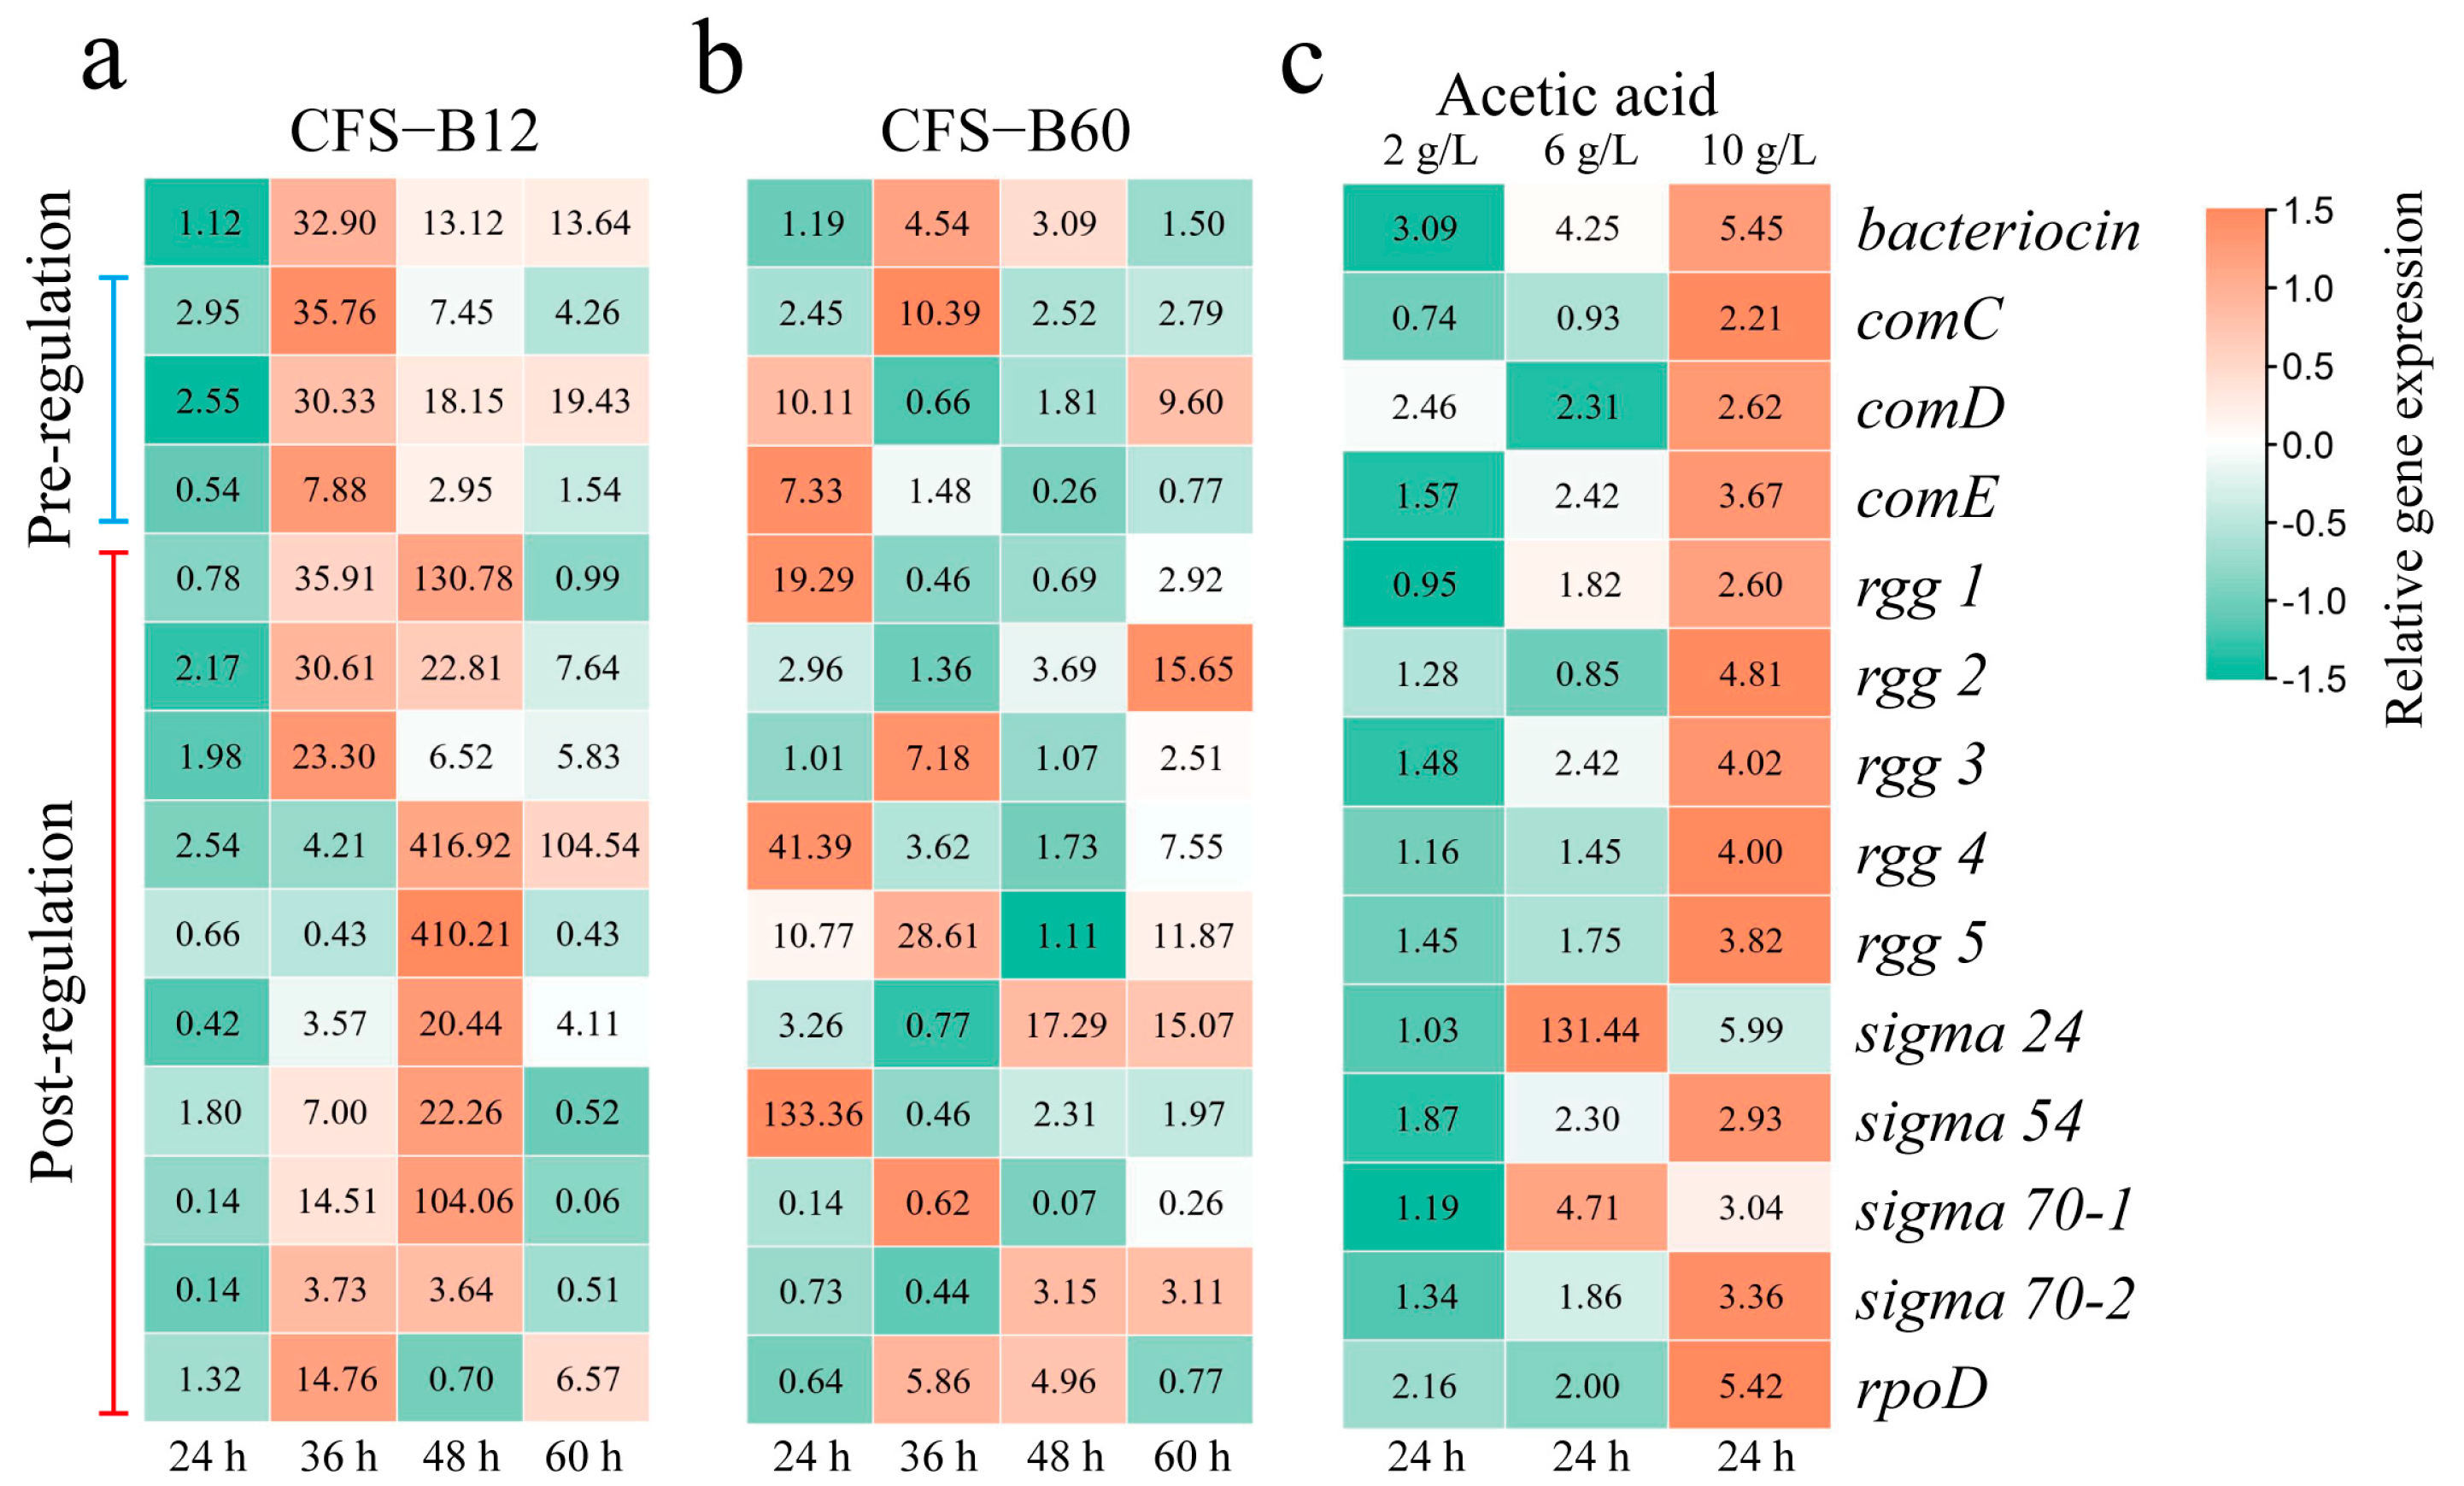
In CFS-B12 treatment, the bacteriocin regulatory system was upregulated (Figure 2a). The gene expression level of the bacteriocin preregulation system reached a maximum at 36 h, while the gene expression level of the bacteriocin postregulation system reached a maximum at 48 h. Bacteriocin production can be divided into two periods: 0 h–36 h (previous period) and 36 h–48 h (later period) (Figure 1a). It can be concluded that from 0 h to 36 h, the bacteriocin preregulation system plays a major role; from 36 h to 48 h, the bacteriocin postregulation system plays a major role. Moreover, the rate of bacteriocin production was faster during the 36–48 h period (Figure 1a). This shows that the bacteriocin postregulation system is more efficient and faster in regulating the production of bacteriocin. In addition, from 36 h to 48 h, the control group produced almost no bacteriocin, while the experimental group produced a large amount of bacteriocin (the concentration of bacteriocin increased by 99.13%) (Figure 1a). This finding indicates that CFS-B12 induces bacteriocin production by upregulating the bacteriocin postregulation system. In the CFS-B60 treatment, the results were consistent with those in the CFS-B12 treatment (Figure 2b). However, CFS-B60 accelerated the gene expression of the bacteriocin regulatory system. Compared with the CFS-B12 treatment group, the gene expression levels of the bacteriocin regulatory system in the CFS-B60 experimental group reached the maximum value earlier (Figure 2b). This result shows that the concentration of the bacteriocin inducer is higher in CFS-B60.
In acetic acid treatment, the bacteriocin regulatory system was upregulated as the acetic acid concentration increased (Figure 2c). A low concentration of acetic acid was more conducive to upregulating the bacteriocin preregulation system, while a high concentration of acetic acid was more conducive to upregulating the bacteriocin postregulation system. This may be the reason for the fastest production of bacteriocin in the Ace10 group (Figure 1e). Moreover, the results for 6 g/L acetic acid showed that the upregulation of sigma 24 and 70–1 was higher than that for 10 g/L acetic acid.

3.4. Co-Occurrence Network Analysis of Bacteriocin Regulatory System Genes and Differentially Expressed Genes

Complex but regular changes occurred in L. paracasei HD1.7 cells under acetic acid stress. As the acetic acid concentration increased, the number of differentially expressed genes also increased. The numbers of differentially expressed genes in Ace2, Ace6 and Ace10 were 96, 275 and 318, respectively (Figure 3a). Moreover, these differentially expressed genes were mainly distributed at gene expression levels below 200 (Figure 3b). This indicated that genes with low expression levels in L. paracasei HD1.7 were differentially expressed under acetic acid stress.
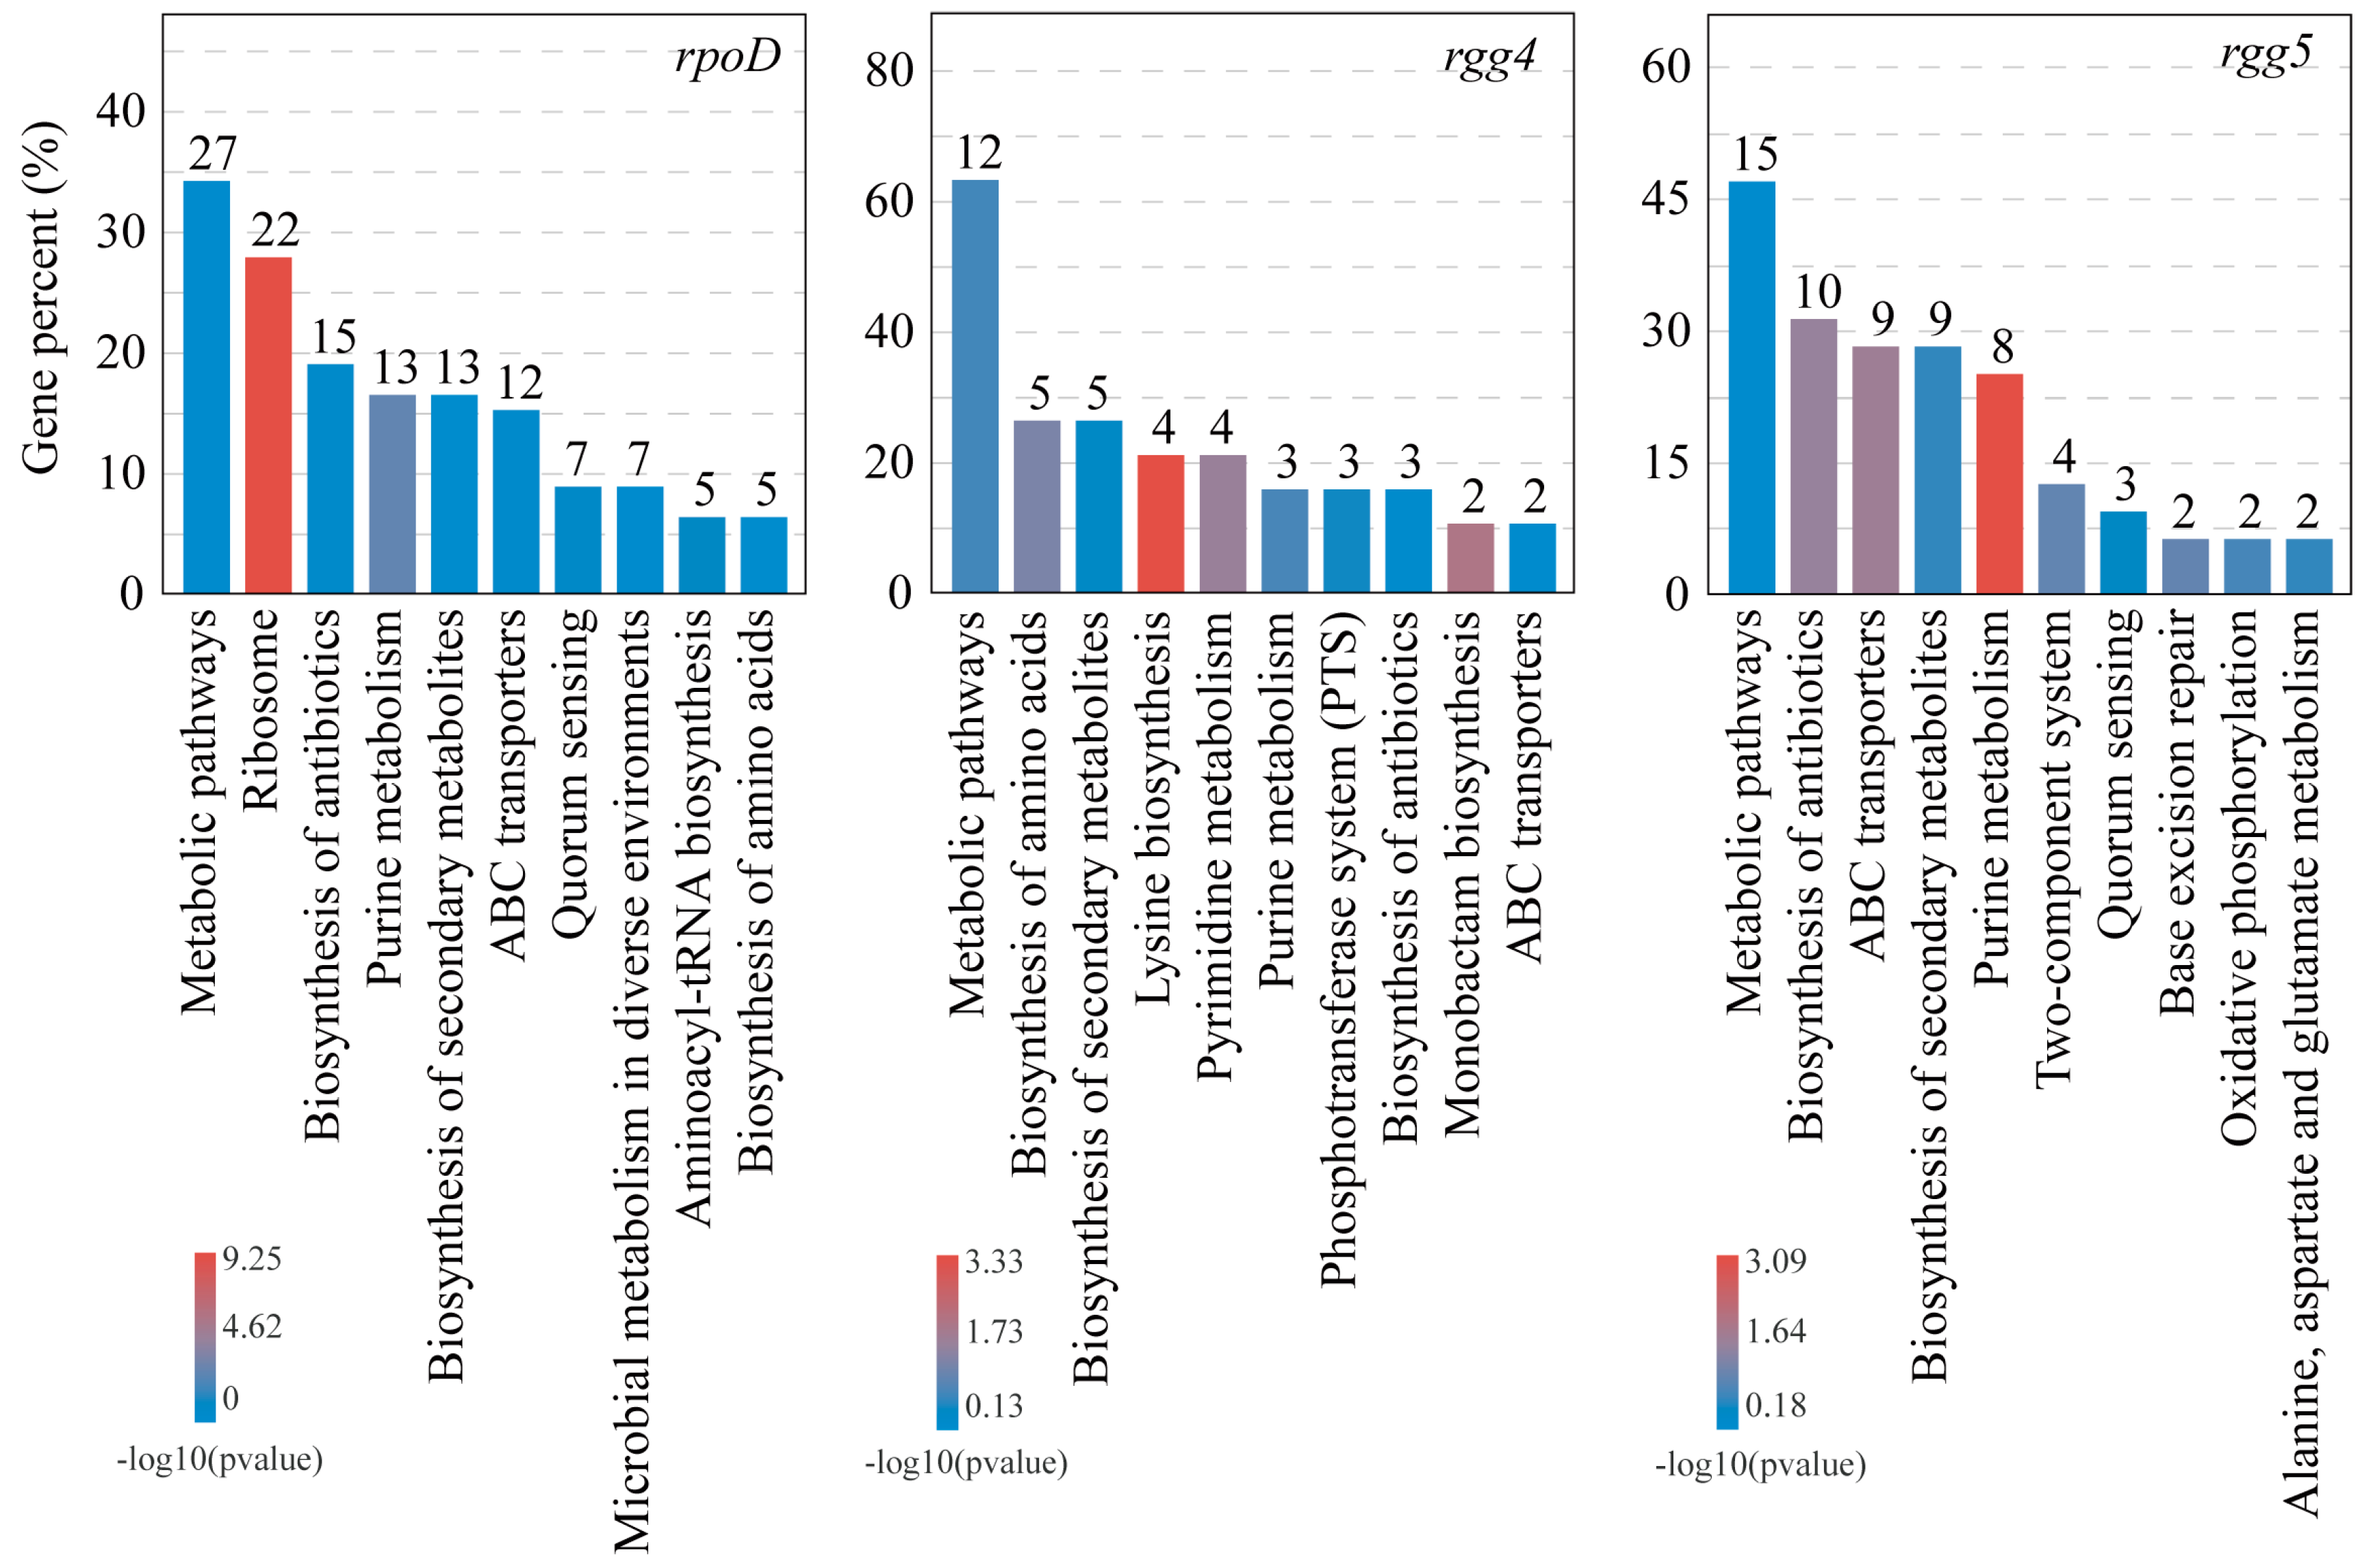
To analyse the relationship between the bacteriocin regulatory system and differentially expressed genes, a co-occurrence network analysis of genes was performed. The differentially expressed genes associated with the bacteriocin regulatory system can be divided into three categories according to the modular analysis (Figure 3c). A class of genes was significantly associated with comD, rpoD and sigma 70–1; a class of genes was significantly associated with comE, rgg 1/2/3/4 and sigma 54; and a class of genes was significantly associated with rgg 5 (Figure S5). This shows that the preregulation system and the postregulation system of bacteriocin are connected with each other. The number of genes significantly associated with rpoD, rgg 4 and rgg 5 increased with increasing acetic acid concentration (Figure 3d). This indicates that acetic acid activates the transcriptional regulators rpoD, rgg 4 and rgg 5, which regulate the differential expression of more genes. Then, KEGG enrichment analysis of the above genes showed that the pathways regulated by rpoD were ribosome, microbial metabolism in diverse environments and aminoacyl-trna biosynthesis; the pathways regulated by rgg 4 were pyrimidine metabolism, phosphotransferase system (PTS) and monobactam biosynthesis; the pathways regulated by rgg 5 were two-component system, base excision repair and oxidative phosphorylation; and the pathways that both rpoD and rgg can regulate were metabolic pathways, ribosome, biosynthesis of antibiotics, purine metabolism, biosynthesis of secondary metabolites, abc transporters, quorum sensing, microbial in diverse metabolism environments, aminoacyl-trna biosynthesis and biosynthesis of amino acids (Figure 4). Therefore, the transcriptional regulators rpoD, rgg 4 and rgg 5 may be responsive to changes in the extracellular environment, such as acetic acid production, in response to population competition.

3.5. Extracellular Acetic Acid Concentration Was Significantly Correlated with rpoD and rgg

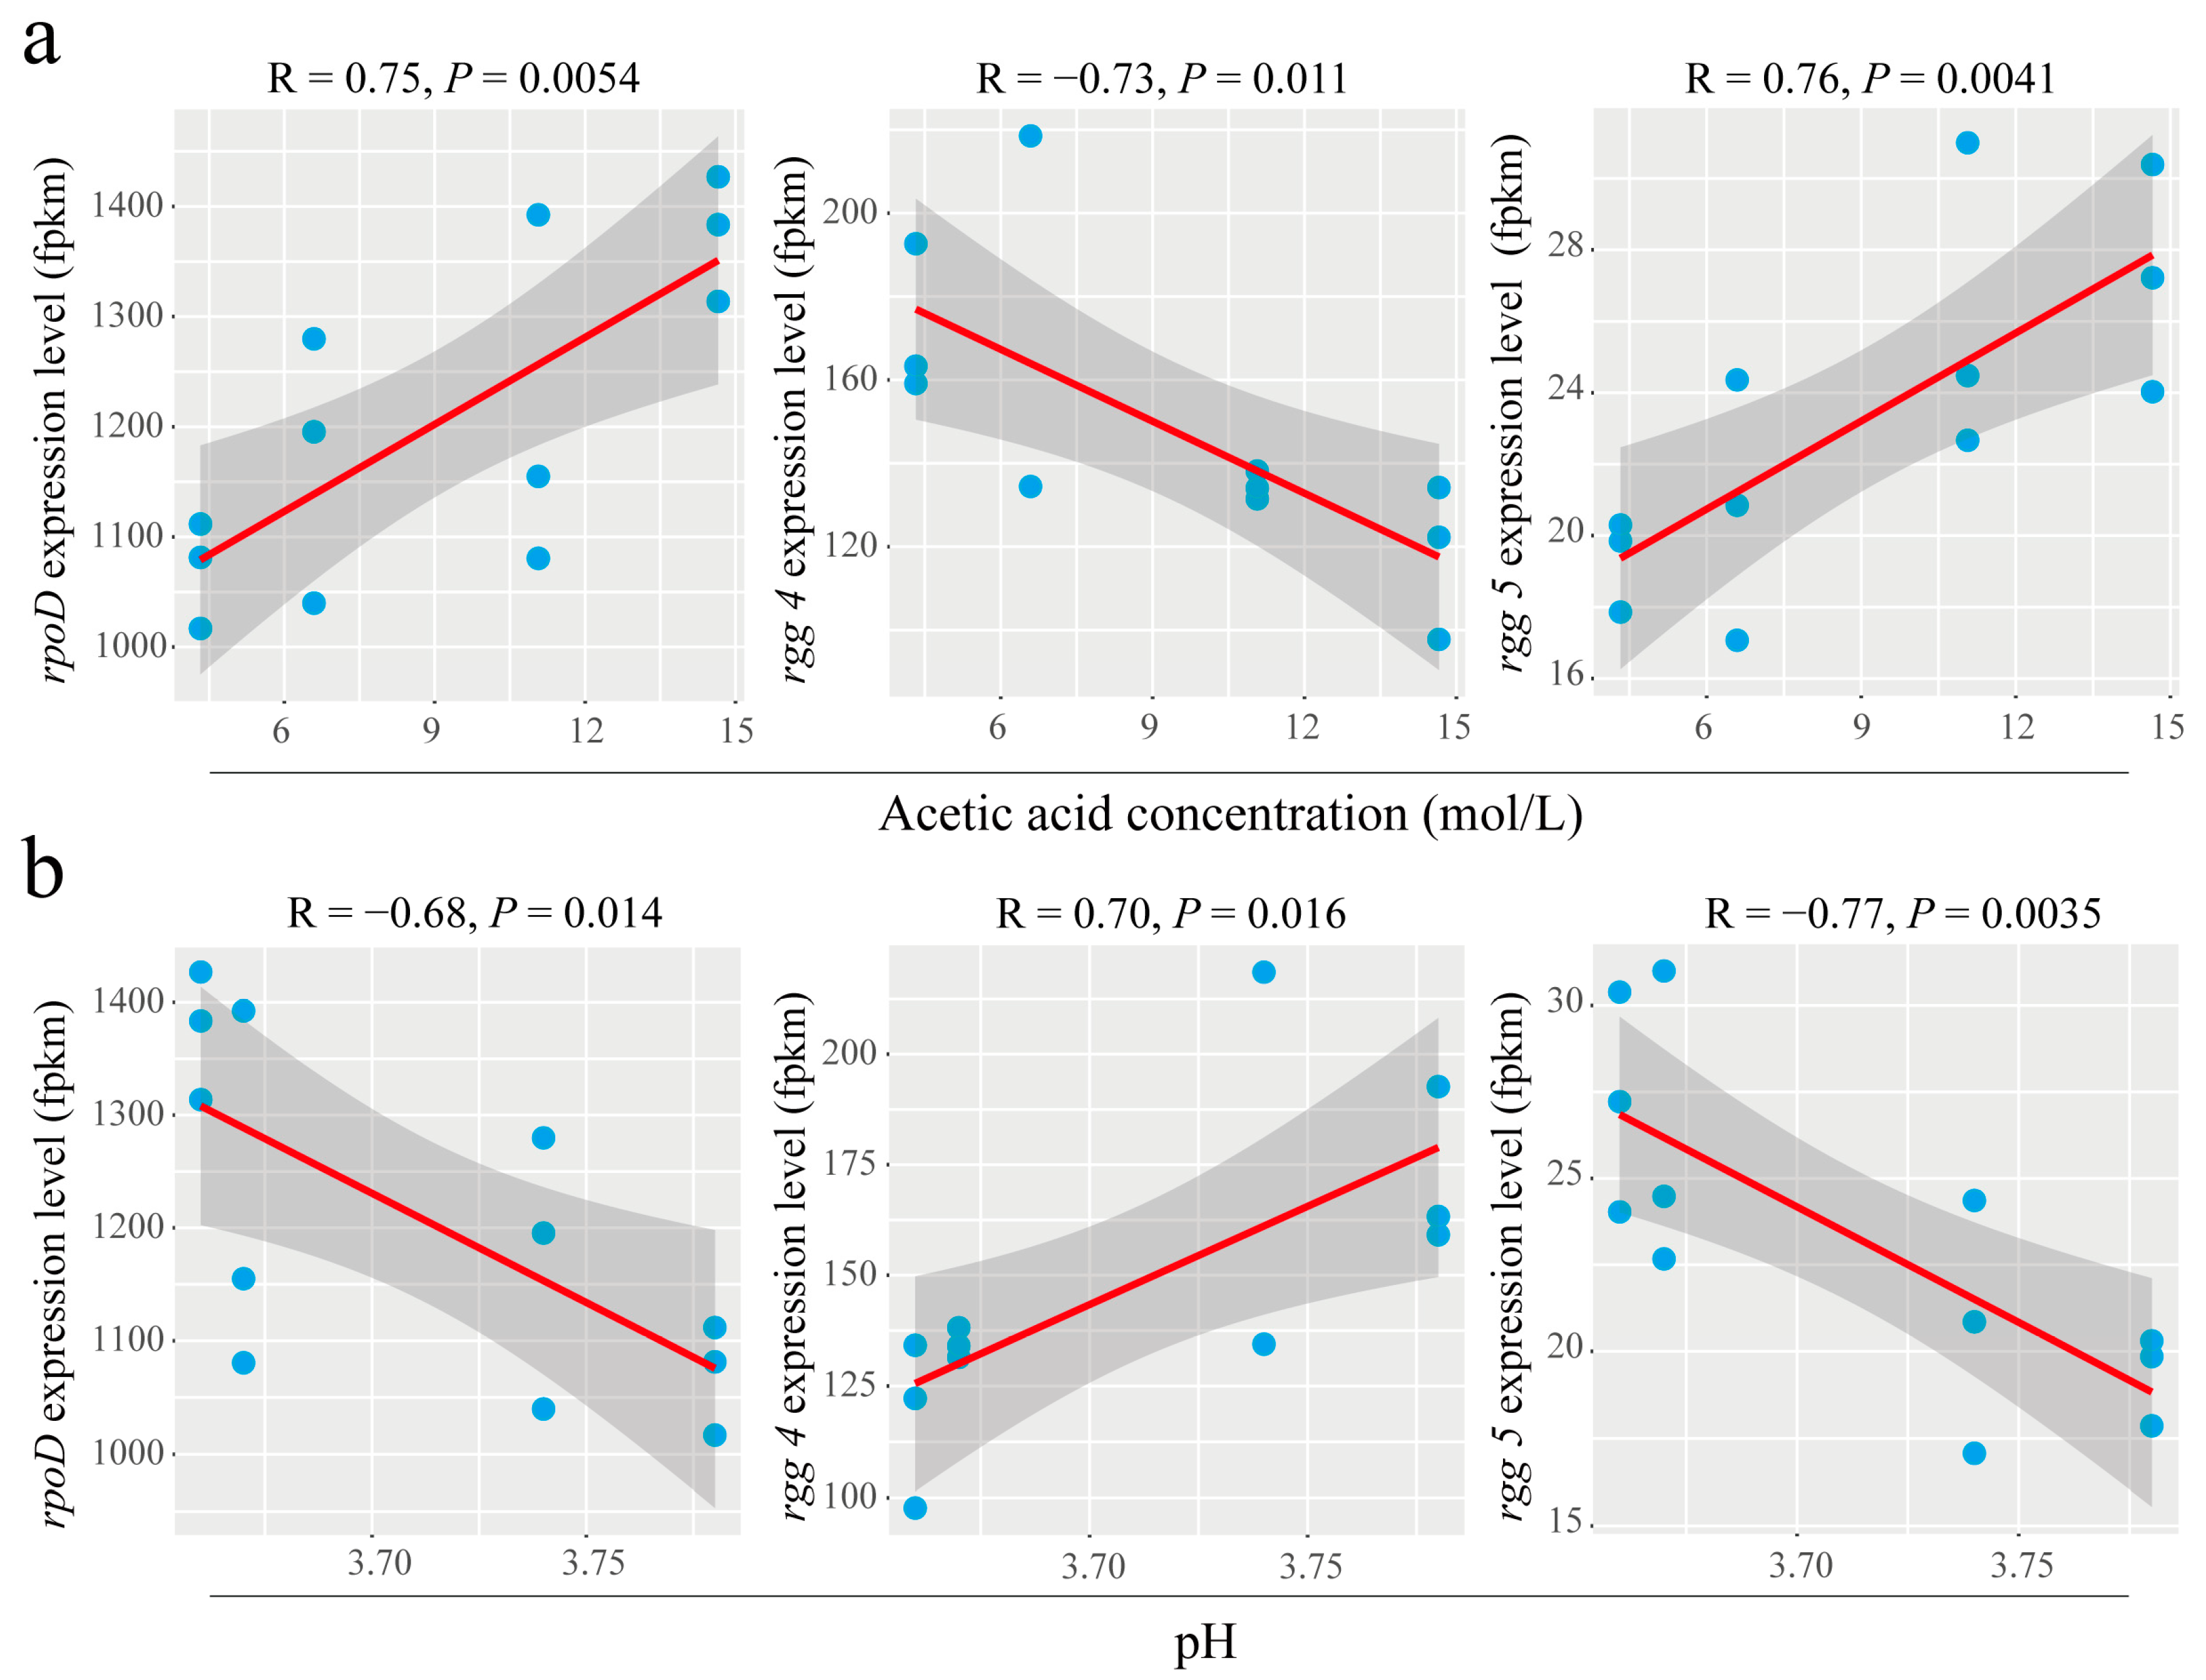
There was a significant positive correlation between rpoD and extracellular acetic acid concentration (p = 0.0054), a significant negative correlation between rgg 4 and extracellular acetic acid concentration (p = 0.011) and a significant positive correlation between rgg 5 and extracellular acetic acid concentration (p = 0.0041) (Figure 5a). It was further shown that rpoD, rgg 4 and rgg 5 were changed in response to extracellular acetic acid concentration. In addition, it was found that rpoD was significantly negatively correlated with extracellular pH (p = 0.014); rgg 4 was significantly positively correlated with extracellular pH (p = 0.016); and rgg 5 was significantly negatively correlated with extracellular pH (p = 0.0035) (Figure 5b). This finding indicates that H+ may be a key regulator in response to rpoD, rgg 4 and rgg 5. However, under acetic acid stress (even 10 g/L acetic acid), the extracellular pH changed very little (Figure 5b). Acetic acid, as an environmental factor, did not merely provide H+.

3.6. Confirming the Effect of Acetic Acid and H+ on the Bacteriocin Regulatory System

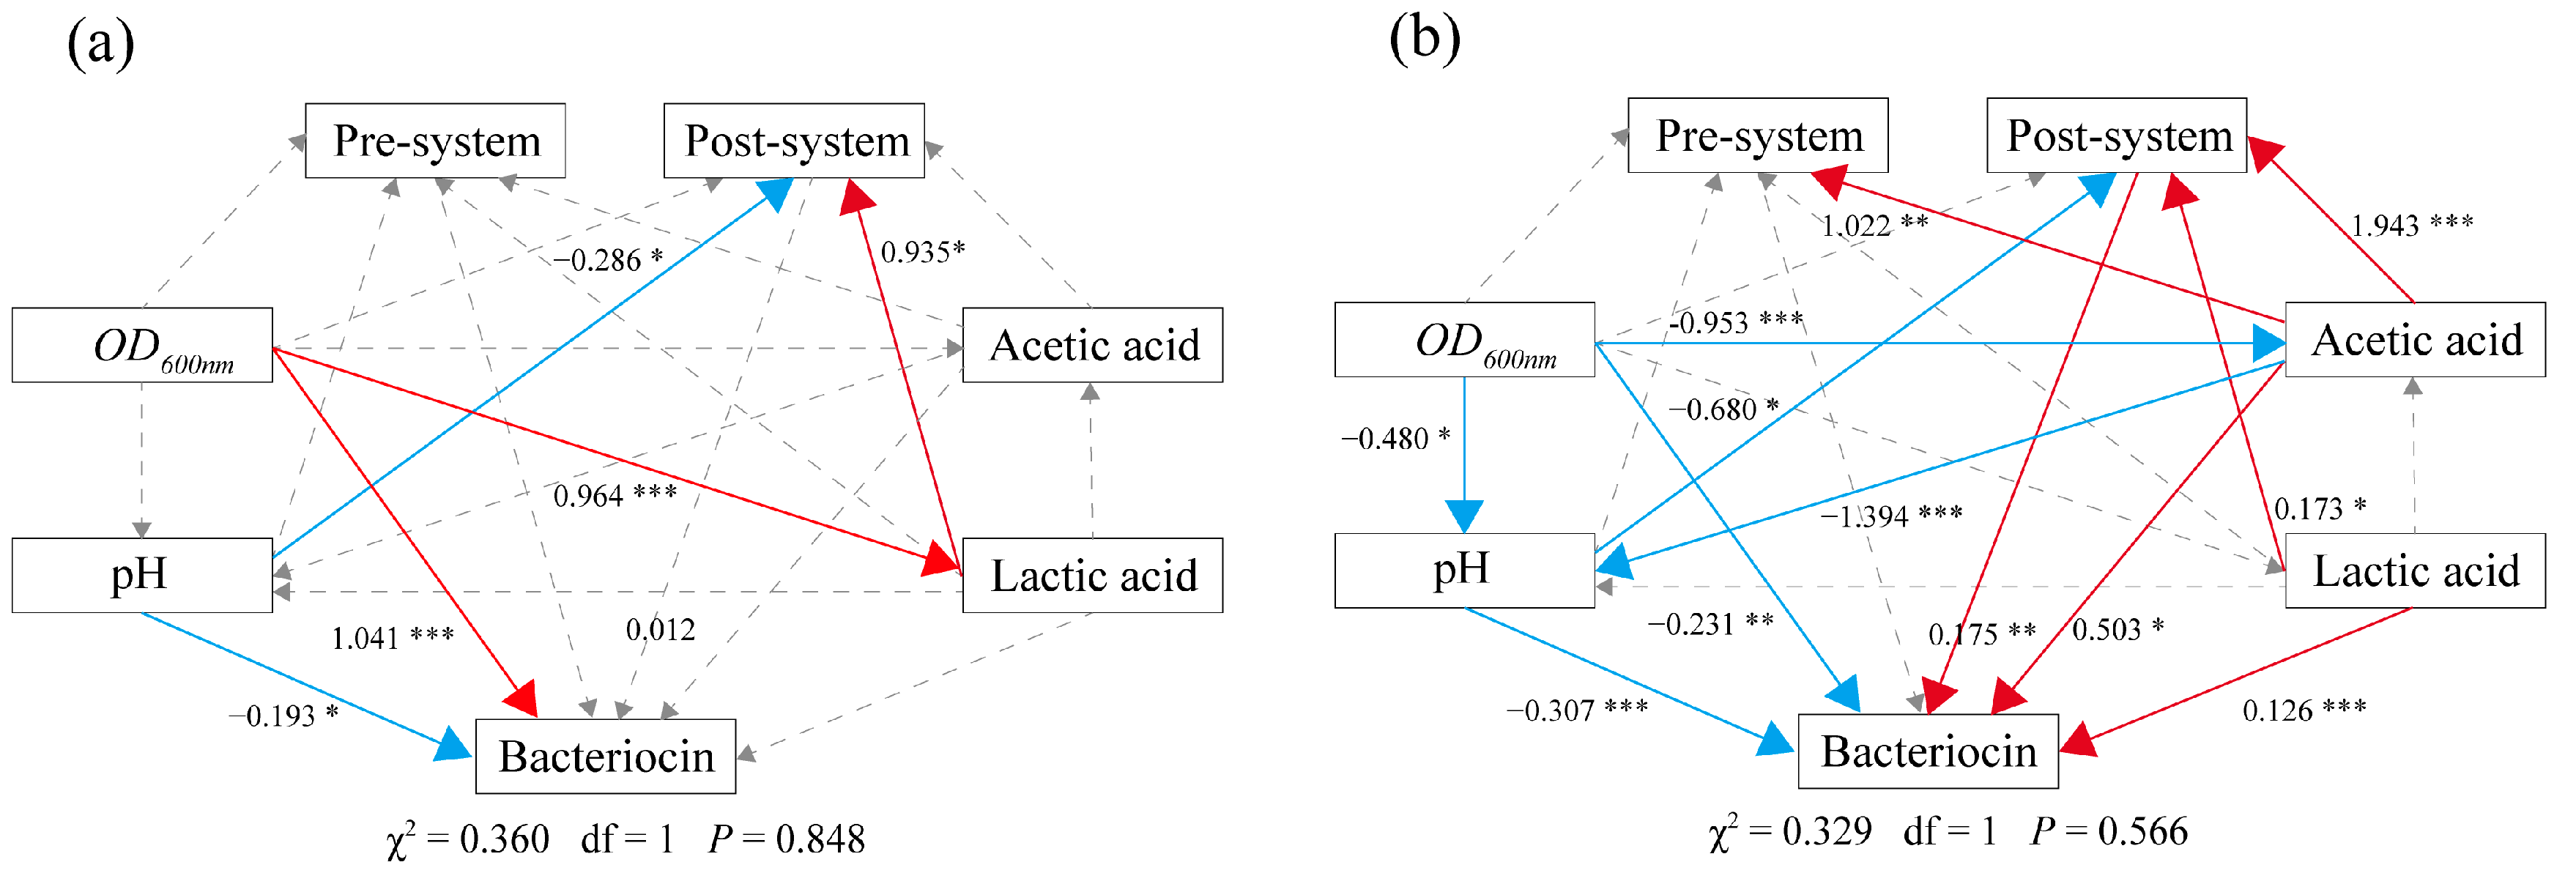
SEM analysis showed that the bacteriocin postregulation system was the key to the high production of bacteriocin (Figure 6). Acetic acid, lactic acid and pH were significantly involved in regulating the bacteriocin postregulation system, which positively regulates the production of bacteriocin. Acetic acid and lactic acid are primary metabolites of bacterial growth. This suggests that the bacteriocin postregulation system responds to changes in bacterial growth metabolism. Therefore, the bacteriocin postregulation system may be the hub linking bacterial growth metabolism and bacteriocin production. This may be because the bacteriocin postregulation system is composed of the global transcriptional regulators sigma and rgg. In addition, in the CFS-B and acetic acid treatments, the pH value was significantly negatively correlated with bacteriocin production and the bacteriocin postregulation system (Figure 6). This finding indicates that H+ may be one of the environmental factors that activate the bacteriocin postregulation system to regulate the production of bacteriocin. In addition, although the OD value is the basic condition for triggering the quorum sensing system, the OD value and bacteriocin production were not strongly positively correlated (Figure 6).
In the CFS-B treatment, the bacteriocin postregulation system was significantly positively correlated with lactic acid; in the acetic acid treatment, the bacteriocin postregulation system was significantly positively correlated with acetic acid and lactic acid (Figure 6). CFS-B treatment produced lower concentrations of acetic acid only for a short period of time, however, higher concentrations of lactic acid were produced for a longer period of time (Figure S6). It was found that acetic acid was more active than lactic acid in activating the bacteriocin postregulation system (Figure 6), and acetic acid was required at lower concentrations than lactic acid (Figure S7). In addition, acetic acid was also significantly positively correlated with the bacteriocin preregulation system, while lactic acid was not (Figure 6b). This is consistent with the result that acetic acid was more favourable than lactic acid to induce bacteriocin production (Figure S7). This shows that there is a strong connection between acetate metabolism and the bacteriocin regulatory system. In summary, activation of the postregulation system is the key to high production of bacteriocin. Acetic acid, lactic acid and pH can all regulate the bacteriocin postregulation system. Therefore, rgg and sigma are the dominant players that transmit environmental signals into the cell and respond to them.

4. Discussion

CFS-B promoted the production of bacteriocin by L. paracasei HD1.7, and the positive and negative feedback of CFS-B to regulate the production of bacteriocin depended on the incubation time and the addition ratio of CFS-B. B. subtilis ATCC 11774 effectively improves plantaricin production in Lactiplantibacillus plantarum [10]. Bacteriocin production in Lactobacillus salivarius, Lactobacillus acidophilus, Enterococcus faecium and Lactiplantibacillus plantarum can also be induced by cocultivation with a range of specific strains [1,11]. Therefore, increasing bacteriocin production by cocultivation is a common approach. However, CFS-B60 can promote and inhibit bacteriocin production depending on the inoculation ratio. CFS-B60 may contain DNA-degrading bacteriocin, which is not only lethal to its adversaries, but also induces expression of its adversary toxins at lower doses [25]. It is also possible that CFS-B60 contains protease inhibitors that reduce bacteriocin activity [26]. Bacteriocin and acetic acid are closely related to bacterial population competition [27]. The purpose of bacteriocin production is to compete with competitors for space and resources to gain an advantage over competitors [5,13]. Bacteriocin production is one of the ways to promote bacteria to become dominant bacteria. The competitiveness of competitors directly affects the production of bacteriocin [9]. Competition between bacteriocin producers and competitors results in the exclusion of one or the other, depending on their initial ratio, community density and nutrient availability [12]. When the density of the competitor is low, the producer slightly upregulates the production of bacteriocin [28]; when the density of the competitor is much higher than that of the producer, the production of bacteriocin is reduced or the producer cannot become the dominant flora [12]. Therefore, there is positive and negative feedback regulation in the regulation of bacteriocin production by population competition. Additionally, nutrient availability can affect bacteriocin production even in the absence of competitors. This is because of the high cost of bacteriocin production, resulting in a reduction in bacteriocin production in poor medium (CO medium) compared to rich medium (MRS medium) [13]. To further optimize cost and benefit, bacteriocin production is restricted to specific growth stages or specific life cycle stages [7]. Therefore, accelerated bacteriocin production at late exponential stages may be the best choice for producers [9]. It may also be nutrient competition caused by increased cell density [8]. In addition to competition for resources, high cell density is also a necessary condition for bacteriocin production [9]. In summary, the growth stage and ratio of competing strains should be fully considered to improve the producer’s bacteriocin production by cocultivation.
Acetic acid is effluxed after L. paracasei HD1.7 senses CFS-B, thereby promoting bacteriocin production. The bacteriocin production strategy monitors the enemy on the one hand and itself on the other hand [7]. This is considered “hazard perception”. Perceived information is not a stressor but is related to the presence of a competitor [7]. Bacteriocin producers can rely on environmental information (abiotic information) to regulate bacteriocin production [7]. This paper found that acetic acid may be sensory information to promote the production of bacteriocin. In co-culture fermentation, the inhibition of B. cereus by Bifidobacteria was also accompanied by the production of acetic acid [29]. In co-cultures, acetic acid production is thought to be universal and dominant [30,31]. Increased production of bacteriocins results in a metabolic shift to acetic acid production [32]. In addition, it has been shown that acetic acid can induce bacteriocin synthesis in lactic acid bacteria [33]. Therefore, in lactic acid bacteria, acetic acid may act as environmental information for population dynamics to regulate bacteriocin synthesis.
There is a strong correlation between acetic acid metabolism and the bacteriocin regulatory system. Increased production of bacteriocin was accompanied by increased production of acetic acid [32]. Acetic acid activates bacteriocin synthesis in lactic acid bacteria by controlling quorum sensing (histidine kinase) [34]. Acetic acid binds to positively charged regions (Arg-Arg-Tyr-Ser-His-Lys) in histidine kinases via electrostatic interactions to regulate bacteriocin synthesis [35]. Acetic acid can exert its inducing ability in the early exponential phase (bacteriocin production mainly occurs in the exponential phase), while acetic acid cannot in the late exponential phase; the induction of bacteriocin by acetic acid is dose-dependent [36]. Acetic acid stress also upregulated comCDE and comRS expression [6,37]. Acetic acid may be used as a volatile signal for cross-species communication [38]. The production of bacteriocin may be the result of participation in the stress response. Ecologically, unfavourable growth conditions are an advantage for bacteriocin production [36]. In addition, the postregulation system of bacteriocin is the key to affecting the high production of bacteriocin. The postregulation system (comRS and sigma) directly couples bacteriocin production and competence commitment [39]. The signal peptide (XIP) of the postregulation system is more capable of regulating population competition and bacteriocin production than the signal peptide (CSP) of the preregulation system, and XIP directly regulates the production of bacteriocin [6].
The functions of the transcriptional regulators sigma factor (rpoD) and rgg were enhanced with increasing acetic acid concentration. Sigma factor (rpoS) is a global transcriptional regulator that positively regulates the response to acid or alkali stress [40]. In the antimicrobial peptide induction assay, it was found that rpoD may be closely related to purine/pyrimidine biosynthesis and metabolic pathways [41]. In Pseudomonas fluorescens, sigma factor (rpoD) positively regulates antibiotic production [42]. The sigma factor (σ54) regulates the transport and metabolism of various nitrogen and carbon sources and the synthesis of secondary metabolites associated with the biosynthesis of antibiotics (phenazine) [43]. The sigma 70 subunit activates transcription of the lux operon during quorum sensing [44]; rpoD may be related to aminoacyl-tRNA biosynthesis and amino acid metabolism in response to cold stress [45]. H+ can bind to the sigma factor protein so that its protein structure is stable and mature, and it easily functions as a transcriptional regulator [19]. When the intracellular or extracellular environment changes, sigma factors can promote the rapid adaptation of bacteria to global metabolic changes [27]. The XIP and RGG proteins interact directly to form a complex, which then induces transcription of the sigma factor (rpoD) [17]. Therefore, after KEGG enrichment analysis of genes related to rpoD and rgg 4/5, the pathways were relatively consistent, but the genes were inconsistent. The rgg gene exerts control over a wide range of events, including stress responses, nutrient metabolism, bacteriocin production, biofilm formation, quorum sensing and virulence [46]. A positive feedback loop mediated by the sigma factor enhances the expression of the streptococcal regulator rgg [46]. This finding indicates that rpoD may mediate the expression of rgg 4 and rgg 5. At present, research on the functions of the transcriptional regulators rpoD and rgg mainly focuses on virulence factors, cell membranes, quorum sensing and competence but less on nutrient metabolism. The production of bacteriocin is vital for the domination of the environment and competition for nutrients [6].

5. Conclusions

CFS-B promoted the production of bacteriocins and induced acetate production by L. paracasei HD1.7. Moreover, acetate metabolism is closely related to the bacteriocin regulatory system. H+ is the main factor for acetic-acid-induced bacteriocin production. Additionally, the functions of the transcriptional regulators rgg and rpoD in the bacteriocin regulatory system were enhanced with increasing acetic acid stress concentration.

Supplementary Materials

The following supporting information can be downloaded at: https://www.mdpi.com/article/10.3390/fermentation8100524/s1, Figure S1: The mechanism of production of Gram-positive bacteria bacteriocin and the effect of acetic acid on bacteriocin production; Figure S2: Effects of Bacillus subtilis cell-free supernatants (CFS) at different time points and ratios on bacteriocin production of Lactobacillus paracasei HD1.7; Figure S3: Effects of acetic acid, lactic acid, HCI and their salts on bacteriocin production by L. paracasei HD1.7; Figure S4: pH changes of L. paracasei HD1.7; Figure S5: Correlations between genes of the bacteriocin regulatory system; Figure S6: Effects of 12 h and 60 h Bacillus subtilis cell-free supernatants on glucose, acetic acid, lactate and bacteriocins of Lactobacillus paracasei HD1.7; Figure S7: Effects of acetic acid and lactic acid stress on the growth and metabolism of L. paracasei HD1.7; Table S1: Primers sequences for qRT-PCR; Table S2: Differences between metabolites in CFS12 and CFS60; Table S3: Effects of CFS-B on the growth of L. paracasei HD1.7.

Author Contributions

J.K.: Conceptualization, Methodology, Software, Writing—original draft, Writing—review and editing. W.Z.: Methodology, Data curation. R.S.: Investigation. G.S.: Visualization. J.G. and W.P.: Conceptualization, Resources, Supervision, Project administration, Funding acquisition. All authors have read and agreed to the published version of the manuscript.

Funding

This study was financially supported by the Key Program of the Natural Science Foundation of Heilongjiang Province, China (ZD2020C008) and the National Natural Science Foundation of China (No. 32071519).

Institutional Review Board Statement

Not applicable.

Informed Consent Statement

Not applicable.

Data Availability Statement

Not applicable.

Conflicts of Interest

The authors declare that they have no known competing financial interest or personal relationships that could have appeared to influence the work reported in this paper.

References

  1. Zhi, X.; Abdullah, I.T.; Gazioglu, O.; Manzoor, I.; Shafeeq, S.; Kuipers, O.P.; Hiller, N.L.; Andrew, P.W.; Yesilkaya, H. Rgg-Shp regulators are important for pneumococcal colonization and invasion through their effect on mannose utilization and capsule synthesis. Sci. Rep. 2018, 8, 6369. [Google Scholar] [CrossRef] [PubMed] [Green Version]
  2. Khan, R.; Junges, R.; Amdal, H.A.; Chen, T.; Morrison, D.A.; Petersen, F.C. A positive feedback loop mediated by Sigma X enhances expression of the streptococcal regulator ComR. Sci. Rep. 2017, 7, 5984. [Google Scholar] [CrossRef] [Green Version]
  3. Wu, A.; Fu, Y.; Kong, L.; Shen, Q.; Liu, M.; Zeng, X.; Wu, Z.; Guo, Y.; Pan, D. Production of a Class IIb bacteriocin with broad-spectrum antimicrobial activity in Lactiplantibacillus plantarum RUB1. Probiotics Antimicrob. Proteins 2021, 13, 1820–1832. [Google Scholar] [CrossRef]
  4. Ricci, A.; Bernini, V.; Maoloni, A.; Cirlini, M.; Galaverna, G.; Neviani, E.; Lazzi, C. Vegetable by-product lacto-fermentation as a new source of antimicrobial compounds. Microorganisms 2019, 7, 607. [Google Scholar] [CrossRef] [PubMed] [Green Version]
  5. Ge, J.P.; Sun, Y.Y.; Xin, X.; Wang, Y.; Ping, W.P. Purification and Partial characterization of a novel bacteriocin synthesized by Lactobacillus paracasei HD1-7 isolated from chinese sauerkraut juice. Sci. Rep. 2016, 6, 19366. [Google Scholar] [CrossRef] [PubMed] [Green Version]
  6. Ghequire, M.G.K.; Swings, T.; Michiels, J.; Buchanan, S.K.; De Mot, R. Hitting with a BAM: Selective killing by lectin-like bacteriocins. mBio 2018, 9, e02138-17. [Google Scholar] [CrossRef] [Green Version]
  7. Bruce, J.B.; West, S.A.; Griffin, A.S. Bacteriocins and the assembly of natural Pseudomonas fluorescens populations. J. Evol. Biol. 2017, 30, 352–360. [Google Scholar] [CrossRef]
  8. Garcia-Curiel, L.; Del Rocio Lopez-Cuellar, M.; Rodriguez-Hernandez, A.I.; Chavarria-Hernandez, N. Toward understanding the signals of bacteriocin production by Streptococcus spp. and their importance in current applications. World J. Microbiol. Biotechnol. 2021, 37, 15. [Google Scholar] [CrossRef] [PubMed]
  9. Gonzalez, D.; Mavridou, D.A.I. Making the best of aggression: The many dimensions of bacterial toxin regulation. Trends. Microbiol. 2019, 27, 897–905. [Google Scholar] [CrossRef] [Green Version]
  10. Cornforth, D.M.; Foster, K.R. Competition sensing: The social side of bacterial stress responses. Nat. Rev. Microbiol. 2013, 11, 285–293. [Google Scholar] [CrossRef]
  11. Bhattacharya, A.; Pak, H.T.; Bashey, F. Plastic responses to competition: Does bacteriocin production increase in the presence of nonself competitors? Ecol. Evol. 2018, 8, 6880–6888. [Google Scholar] [CrossRef] [Green Version]
  12. Liu, G.; Nie, R.; Liu, Y.; Li, X.; Duan, J.; Hao, X.; Shan, Y.; Zhang, J. Bacillus subtilis BS-15 effectively improves plantaricin production and the regulatory biosynthesis in Lactiplantibacillus plantarum RX-8. Front. Microbiol. 2021, 12, 772546. [Google Scholar] [CrossRef] [PubMed]
  13. Maldonado-Barragan, A.; Caballero-Guerrero, B.; Lucena-Padros, H.; Ruiz-Barba, J.L. Induction of bacteriocin production by coculture is widespread among plantaricin-producing Lactobacillus plantarum strains with different regulatory operons. Food Microbiol. 2013, 33, 40–47. [Google Scholar] [CrossRef] [PubMed]
  14. Ghazaryan, L.; Giladi, I.; Gillor, O. The Effects of colicin production rates on allelopathic interactions in Escherichia coli populations. Microorganisms 2019, 7, 564. [Google Scholar] [CrossRef] [PubMed] [Green Version]
  15. Maldonado-Barragan, A.; West, S.A. The cost and benefit of quorum sensing-controlled bacteriocin production in Lactobacillus plantarum. J. Evol. Biol. 2020, 33, 101–111. [Google Scholar] [CrossRef] [PubMed]
  16. Wolfe, A.J. The acetate switch. Microbiol. Mol. Biol. Rev. 2005, 69, 12–50. [Google Scholar] [CrossRef] [Green Version]
  17. Guaragnella, N.; Bettiga, M. Acetic acid stress in budding yeast: From molecular mechanisms to applications. Yeast 2021, 38, 391–400. [Google Scholar] [CrossRef]
  18. Meng, F.; Zhao, H.; Nie, T.; Lu, F.; Zhang, C.; Lu, Y.; Lu, Z. Acetate activates lactobacillus bacteriocin synthesis by controlling quorum sensing. Appl. Environ. Microbiol. 2021, 87, e0072021. [Google Scholar] [CrossRef]
  19. Ge, J.P.; Kang, J.; Ping, W.X. Effect of acetic acid on bacteriocin production by gram-positive bacteria. J. Microbiol. Biotechnol. 2019, 29, 1341–1348. [Google Scholar] [CrossRef]
  20. Kumari, S.; Simel, E.J.; Wolfe, A.J. σ70 is the principal sigma factor responsible for transcription of acs, which encodes acetyl coenzyme a synthetase in Escherichia coli. J. Bacteriol. 2000, 182, 551–554. [Google Scholar] [CrossRef]
  21. Do, H.; Makthal, N.; VanderWal, A.R.; Saavedra, M.O.; Olsen, R.J.; Musser, J.M.; Kumaraswami, M. Environmental pH and peptide signaling control virulence of Streptococcus pyogenes via a quorum-sensing pathway. Nat. Commun. 2019, 10, 2586. [Google Scholar] [CrossRef] [Green Version]
  22. Embaby, A.M.; Yasmin, H.; Ahmed, H.; Marey, H.S. A sequential statistical approach towards an optimized production of a broad spectrum bacteriocin substance from a soil bacterium bacillus sp. yas 1 strain. Sci. World J. 2014, 2014, 396304. [Google Scholar] [CrossRef] [PubMed] [Green Version]
  23. Gottesman, S. Trouble is coming: Signaling pathways that regulate general stress responses in bacteria. J. Biol. Chem. 2019, 294, 11685–11700. [Google Scholar] [CrossRef] [PubMed] [Green Version]
  24. Bortoni, M.E.; Terra, V.S.; Hinds, J.; Andrew, P.W.; Yesilkaya, H. The pneumococcal response to oxidative stress includes a role for Rgg. Microbiology 2009, 155, 4123–4134. [Google Scholar] [CrossRef] [Green Version]
  25. Ye, Z.M.; Jiang, B.T.; Gao, D.N.; Ping, W.X.; Ge, J.P. Bacillus spp. increase the Paracin 1.7 titer of L. paracasei HD1.7 in sauerkraut juice: Emphasis on the influence of inoculation conditions on the symbiotic relationship. LWT 2021, 146, 111443. [Google Scholar] [CrossRef]
  26. Ge, J.P.; Fang, B.Z.; Wang, Y.; Song, G.; Ping, W.X. Bacillus subtilis enhances production of Paracin1.7, a bacteriocin produced by Lactobacillus paracasei HD1-7, isolated from Chinese fermented cabbage. Ann. Microbiol. 2014, 64, 1735–1743. [Google Scholar] [CrossRef]
  27. Majeed, H.; Gillor, O.; Kerr, B.; Riley, M.A. Competitive interactions in Escherichia coli populations: The role of bacteriocins. ISME J. 2011, 5, 71–81. [Google Scholar] [CrossRef] [PubMed] [Green Version]
  28. Vogel, V.; Fuchs, M.; Jachmann, M.; Bitzer, A.; Mauerer, S.; Münch, J.; Spellerberg, B. The role of SilX in bacteriocin production of Streptococcus anginosus. Front. Microbiol. 2022, 13, 904318. [Google Scholar] [CrossRef] [PubMed]
  29. Tse, T.J.; Shen, J.; Shim, Y.Y.; Reaney, M.J.T. Changes in bacterial populations and their metabolism over 90 sequential cultures on wheat-based thin stillage. J. Agric. Food. Chem. 2020, 68, 4717–4729. [Google Scholar] [CrossRef] [PubMed]
  30. Gardner, A.; West, S.A.; Buckling, A. Bacteriocins, spite and virulence. Proc. Biol. Sci. 2004, 271, 1529–1535. [Google Scholar] [CrossRef]
  31. Karetkin, B.A.; Guseva, E.V.; Evdokimova, S.A.; Mishchenko, A.S.; Khabibulina, N.V.; Grosheva, V.D.; Menshutina, N.V.; Panfilov, V.I. A quantitative model of Bacillus cereus ATCC 9634 growth inhibition by bifidobacteria for synbiotic effect evaluation. World J. Microbiol. Biotechnol. 2019, 35, 89. [Google Scholar] [CrossRef]
  32. Eder, A.S.; Magrini, F.E.; Spengler, A.; da Silva, J.T.; Beal, L.L.; Paesi, S. Comparison of hydrogen and volatile fatty acid production by Bacillus cereus, Enterococcus faecalis and Enterobacter aerogenes singly, in co-cultures or in the bioaugmentation of microbial consortium from sugarcane vinasse. Environ. Technol. Innov. 2020, 18, 100638. [Google Scholar] [CrossRef]
  33. Guo, C.; Zhang, S.; Wang, Y.; Li, M.; Ding, K. Isolation and structure characterization of a polysaccharide from Crataegus pinnatifida and its bioactivity on gut microbiota. Int. J. Biol. Macromol. 2020, 154, 82–91. [Google Scholar] [CrossRef] [PubMed]
  34. Verluyten, J.; Messens, W.; De Vuyst, L. The curing agent sodium nitrite, used in the production of fermented sausages, is less inhibiting to the bacteriocin-producing meat starter culture Lactobacillus curvatus LTH 1174 under anaerobic conditions. Appl. Environ. Microbiol. 2003, 69, 3833–3839. [Google Scholar] [CrossRef] [PubMed] [Green Version]
  35. Kang, J.; Zhou, X.H.; Zhang, W.; Pei, F.Y.; Ge, J.P. Transcriptomic analysis of bacteriocin synthesis and stress response in Lactobacillus paracasei HD1.7 under acetic acid stress. LWT 2022, 154, 112897. [Google Scholar] [CrossRef]
  36. Meng, F.; Lu, F.; Du, H.; Nie, T.; Zhu, X.; Connerton, I.F.; Zhao, H.; Bie, X.; Zhang, C.; Lu, Z.; et al. Acetate and auto-inducing peptide are independent triggers of quorum sensing in Lactobacillus plantarum. Mol. Microbiol. 2021, 116, 298–310. [Google Scholar] [CrossRef]
  37. Nilsson, L.; Nielsen, M.K.; Ng, Y.; Gram, L. Role of acetate in production of an autoinducible class IIa bacteriocin in Carnobacterium piscicola A9b. Appl. Environ. Microbiol. 2002, 68, 2251–2260. [Google Scholar] [CrossRef] [Green Version]
  38. Xia, K.; Han, C.; Xu, J.; Liang, X. Transcriptome response of Acetobacter pasteurianus Ab3 to high acetic acid stress during vinegar production. Appl. Microbiol. Biotechnol. 2020, 104, 10585–10599. [Google Scholar] [CrossRef] [PubMed]
  39. Chen, Y.; Gozzi, K.; Yan, F.; Chai, Y. Acetic acid acts as a volatile signal to stimulate bacterial biofilm formation. mBio 2015, 6, e00392. [Google Scholar] [CrossRef] [Green Version]
  40. Mignolet, J.; Fontaine, L.; Sass, A.; Nannan, C.; Mahillon, J.; Coenye, T.; Hols, P. Circuitry rewiring directly couples competence to predation in the gut dweller Streptococcus salivarius. Cell Rep. 2018, 22, 1627–1638. [Google Scholar] [CrossRef]
  41. Liu, X.; Wu, Y.; Chen, Y.; Xu, F.; Halliday, N.; Gao, K.; Chan, K.G.; Camara, M. RpoS differentially affects the general stress response and biofilm formation in the endophytic Serratia plymuthica G3. Res. Microbiol. 2016, 167, 168–177. [Google Scholar] [CrossRef]
  42. Le, C.F.; Gudimella, R.; Razali, R.; Manikam, R.; Sekaran, S.D. Transcriptome analysis of Streptococcus pneumoniae treated with the designed antimicrobial peptides, DM3. Sci. Rep. 2016, 6, 26828. [Google Scholar] [CrossRef] [PubMed]
  43. Schnider, U.; Keel, C.; Blumer, C.; Troxler, J.; Défago, G.; Haas, D. Amplification of the housekeeping sigma factor in Pseudomonas fluorescens CHA0 enhances antibiotic production and improves biocontrol abilities. J. Bacteriol. 1995, 177, 5387. [Google Scholar] [CrossRef] [Green Version]
  44. Liu, H.-M.; Yan, A.; Zhang, X.-H.; Xu, Y.-Q. Phenazine-1-carboxylic acid biosynthesis in Pseudomonas Chlororaphis GP72 is positively regulated by the sigma factor RpoN. World J. Microbiol. Biotechnol. 2008, 24, 1961–1966. [Google Scholar] [CrossRef]
  45. Johnson, D.C.; Ishihama, A.; Stevens, A.M. Involvement of region 4 of the σ70 subunit of RNA polymerase in transcriptional activation of the lux operon during quorum sensing. FEMS Microbiol. Lett. 2003, 228, 193–201. [Google Scholar] [CrossRef] [Green Version]
  46. Kloska, A.; Cech, G.M.; Sadowska, M.; Krause, K.; Szalewska-Palasz, A.; Olszewski, P. Adaptation of the marine bacterium shewanella baltica to low temperature stress. Int. J. Mol. Sci. 2020, 21, 4338. [Google Scholar] [CrossRef]
Figure 1. Effects of CFS and acetic acid on bacteriocin production: (a,b) effects of different ratios of CFS on bacteriocin production; (c,d) effects of CFS on acetic acid production by L. paracasei HD1.7; (e) effects of different concentrations of acetic acid stress on bacteriocin production; (f) bacteriocin production was positively correlated with extracellular acetic acid. CFS-B12 represents the cell-free supernatant of B. subtilis ATCC 11774 cultured for 12 h; CFS-B60 represents the cell-free supernatant of B. subtilis ATCC 11774 cultured for 60 h. T (1:3) represents the volume ratio of L. paracasei HD1.7 to CFS at 1:3, CK (1:3) represents the control group, and water replaced CFS.
Fermentation 08 00524 g001
Figure 2. Effects of CFS and acetic acid on gene expression of the bacteriocin regulatory system. The numbers in the boxes indicate the relative expression levels of the genes. The relative expression levels of genes were normalized at the time level. Data normalization results are scaled with the legend.
Fermentation 08 00524 g002
Figure 3. Transcriptional profiling of L. paracasei HD1.7 in response to high acetic acid stress. (a) Venn diagram showing the number of differentially expressed genes under acetic acid stress (|Log2FC| > 1.5, p < 0.05); (b) histogram of differentially expressed genes; (c,d) co-occurrence network analysis of genes in the bacteriocin regulatory system under acetic acid stress to explore associations between gene expression (|r| > 0.8; p < 0.05). Each dot represents a gene. (c) Represents overall collinear network analysis; (d) represents grouped collinear network analysis.
Fermentation 08 00524 g003
Figure 4. Regulatory pathways of the transcriptional regulators rpoD and rgg in response to high acetic acid stress. The numbers on each histogram indicate the number of genes significantly associated with the transcriptional regulators rpoD or rgg after KEGG enrichment analysis.
Fermentation 08 00524 g004
Figure 5. The effects of high acetate stress on the expression of rpoD and rgg are related to the extracellular acetic acid concentration and pH. (a) Linear analysis of rpoD expression level and acetate concentration; (b) linear analysis of rpoD expression level and pH value. The results of linear regression analysis in the panel are shown as best-fit trendlines for each sampling site (the shaded areas depict the 95% confidence interval).
Fermentation 08 00524 g005
Figure 6. Pathway analysis of CFS and acetate-induced bacteriocin production. (a) CFS induces bacteriocin production. (b) Acetic acid induces bacteriocin production. The arrows show causality, and the dashed lines indicate nonsignificant correlations. The solid lines indicate significant differences at p < 0.05. The solid red line indicates a positive correlation, and the solid blue line indicates a negative correlation. Significance levels are as follows: *: p < 0.05, **: p < 0.01, ***: p < 0.001.
Fermentation 08 00524 g006
Publisher’s Note: MDPI stays neutral with regard to jurisdictional claims in published maps and institutional affiliations.