Article

Effect of Starters on Quality Characteristics of Hongsuantang, a Chinese Traditional Sour Soup

1
Key Laboratory of Agricultural and Animal Products Store & Processing of Guizhou Province, Guizhou University, Guiyang 550025, China
2
College of Liquor and Food Engineering, Guizhou University, Guiyang 550025, China
3
School of Chemistry and Chemical Engineering, Guizhou University, Guiyang 550025, China
*
Author to whom correspondence should be addressed.
Fermentation 2022, 8(11), 589; https://doi.org/10.3390/fermentation8110589
Submission received: 19 September 2022 / Revised: 26 October 2022 / Accepted: 28 October 2022 / Published: 31 October 2022
(This article belongs to the Special Issue Assessment of the Quality and Safety of Fermented Foods)

Abstract

:
Hongsuantang (HST) is a traditional Chinese and famous sour soup. However, the quality of naturally fermented HST is not controllable. We investigated the effects of different lactic acid bacteria starters on HST acid production, color, antioxidant capacity, total phenols, total carotenoids, organic acids, volatile substances, and sensory properties to determine the most suitable strain for HST production. The results showed that among the seven lactic acid bacteria strains used to inoculate fermented HST, Lactiplantibacillus plantarum SQ-4 exhibited the most excellent fermentation characteristics. SQ-4 rapidly reduced the HST’s pH by 0.77. It significantly increased the HST’s color, organic acids, total phenols, carotenoids, lycopene, and free radical scavenging ability. Lactiplantibacillus plantarum SQ-4 was an excellent starter for preparing HST with good acid production capacity, moderate sourness and spiciness, and good sensory and other characteristics. Each starter produces its distinct flavor components. α-Pinene, myrcene, α-copaene, and guaiol were vital aroma compounds in HST fermentation by the starter. This study laid a foundation for selecting HST starters and potential industrial production.

1. Introduction

With the increase in consumer demand for healthy, traditional, and fermented foods with a local identity, various fermented products have attracted more attention [1,2]. Hongsuantang (HST) is a traditional fermented sour soup with a long history consumed in southwest China, especially in Guizhou province, and there is a dialect called “Three days don’t eat sour (Hongsuantang), walk stumbling”. Guizhou people like HST because of its unique characteristics, such as being spicy but not burning, moderately sour, and slightly sweet, which are also deeply loved by consumers at home and abroad [3]. Traditional HST is made of fresh tomato, red pepper, and ginger as the primary raw materials and then fermented with naturally occurring lactic acid bacteria for about half a month [4]. However, it was unclear how the lactic acid bacteria starter affects the quality characteristics of HST. Therefore, considering the role of probiotic starters in the preparation of HST, it is interesting to explore the effect of the starter on the quality of HST. In addition, the traditional spontaneous fermentation HST products are primarily in the non-sterile state, which has potential quality stability and safety issues [5,6]. Therefore, it is necessary to standardize production by inoculating starters. For this goal, it is also essential to understand the starters’ effects on the soup’s quality, which would lay the foundation for its industrialization application [7]. Lactic acid bacteria (LAB) are indispensable in the fermentation process of HST, so some scholars inoculated lactic acid bacteria to ferment HST [8]. The study found that inoculation fermentation will lead to the consumption of natural bacterial strains and significantly impact the microbial diversity and metabolite content produced during the fermentation process of HST. This study has made a beneficial exploration of inoculation fermentation, but further in-depth research is necessary on the aspects such as antibiotic and physical properties of its fermentation.
The raw materials of HST are rich in nutrients and have a unique flavor after fermentation.
Due to the rapid increase in consumption of HST, the scientific interest in HST products is rising. Tomato (Solanum lycopersicum L.) is one of the world’s most consumed vegetables, providing essential compounds such as sugars, minerals, vitamins, phenolics, carotenoids, and lycopene [9]. The antioxidant activity of lycopene contained in tomatoes is more than twice that of β-carotene. The content of lycopene is related to the type and maturity of tomatoes, especially the process of converting tomatoes into sauces and soups [10,11,12]. Red pepper (Capsicum annuum L.) is a rich source of phenolics, capsaicin, and phytochemicals, and is consumed as seasoning because of its spiciness [13]. Ginger (Zingiber officinale Rosc.) originated in southeast Asia and has been recognized for its characteristic flavor and spice because it contains gingerols and gingerol-related compounds [14]. Li et al. [15] analyzed the characteristics of fortified fermented tomato sour soup with dominant bacteria. He et al. [16] studied the effects of thermal and non-thermal processing technology on the quality of HST after storage. Some researchers also investigated the potential role of sour soup in preventing and treating hyperlipidemia, which can reduce the formation of liver fat in the high-fat diet group [17,18]. In addition, the effect of the bacterial community on the volatile flavor profile and the correlation between dominant bacteria and primary metabolites were reported [8,19].
To the best of our knowledge, no information is available regarding the effect of the starter on the antioxidant and physicochemical properties of HST. Therefore, this study aimed to explore the impact of LAB starters on antioxidant capacity, organic acids, volatile flavor substances, and sensory evaluation of HST. That would lay a foundation for understanding the essential role of starters in the fermentation of HST and their further industrial application in the standardized production of HST.

2. Materials and Methods

2.1. Material and Reagents

The reagents used in high-performance liquid chromatography (HPLC) are all chromatographic grade. The primary raw materials include tomatoes, ginger, chili pepper, salt, and high-grade liquor purchased from a local supermarket in Guiyang, China. Oxalic acid, lactic acid, ascorbic acid, succinic acid, and citric acid as standards (purity > 98%) were purchased from Beijing Solarbio & Technology Co., Ltd., Beijing, China. All other used chemical reagents were analytically pure and commercially available.

2.2. Strains and Starter Culture

Bifidobacterium animalis subsp. lactis BZ11 (China General Microbiological Culture Collection Centre [CGMCC] NO.10224), Bifidobacterium animalis subsp. lactis BZ25 (CGMCC NO.10225), Lactiplantibacillus plantarum SQ-4 (China Center for Type Culture Collection [CCTCC] M 2016002), and Lactiplantibacillus pentosus MT-4 (CCTCC M 2016001) were screened by our laboratory. Lactobacillus bulgaricus (BGS) was obtained from Shanhua yogurt from Guiyang Sanlian Dairy Co., Ltd., China. Commercial Bifidobacterium longum BL1 was obtained from Neimenggu Shuang Qi Pharmaceutical Co., Ltd., China; B. animalis subsp. lactis BB12 was from Christian Hansen (Hørsholm, Denmark). Among these strains, SQ-4 and MT-4 could reduce cholesterol and nitrite and produce acid quickly [20]. BZ11 and BZ25 have good cholesterol-reducing performance and are acid- and bile-salt-resistant [21]. Commercial strains BL1 and Q-1 have strong acid production capacity.
Lactiplantibacillus plantarum SQ-4, Lactiplantibacillus pentosus MT-4, Lactobacillus bulgaricus (BGS), Bifidobacterium animalis subsp. lactis BZ11, Bifidobacterium animalis subsp. lactis BZ25, and Bifidobacterium longum BL1 were respectively anaerobically inoculated in De Man Rogosa Sharpe (MRS) broth [22] at 37 °C for 24 h.
Then, the respective bacterial cell pellets of each single strain were harvested by centrifugation (TGL20M high-speed refrigerated centrifuge, Changsha, China) at 5300× g and 4 °C for 10 min and re-suspended in sterile distilled water to a final cell number of 8.0 log CFU/mL as a single-strain starter culture.

2.3. HST Fermented by Different Single-Strain

The raw materials for the preparation of HST contained 100.0 g of tomatoes, 5.0 g of ginger, 5.0 g of red pepper, 2.0 mL of high-grade liquor, and 2.0 g of salt, which were beaten into a pulp. Then, the HST materials were pasteurized at 70 °C for 15 min and cooled to room temperature. Subsequently, the pasteurized HST materials were inoculated with 5% (v/v) of a single-strain starter culture of 8.0 log CFU/mL and fermented at room temperature (20 °C) without light for 15 days. It should be noted here that after pasteurization, the number of viable bacteria was 4.8 log CFU/mL on MRS agar medium (remaining viable bacteria). The initial viable counts of HST after inoculation was about 6.7 log CFU/mL, representing both the inoculated and remaining viable bacteria.
The HST materials treated under the same conditions without inoculation starter were used as the control (CON) group. The initial viable count of CON group after pasteurization was 4.8 log CFU/mL. The HST materials treated under the same conditions without fermentation were used as the unfermented (UNF) group. During fermentation, samples were taken to analyze pH, total titration acid, cell viability, and color. After the 15-day fermentation of the HST, total phenols, total carotenoids, organic acids, sensory quality, and flavor components were measured. The unfermented group and fermented group were both analyzed.

2.4. Sample Quality Analysis

2.4.1. Determination of pH, Total Titration Acid, and Viable Count

HST prepared with starter cultures Bifidobacterium animalis subsp. lactis BZ11, Bifidobacterium animalis subsp. lactis BZ25, Lactiplantibacillus plantarum SQ-4, Lactiplantibacillus pentosus MT-4, Lactobacillus bulgaricus, Bifidobacterium longum BL1, and Bifidobacterium animalis subsp. lactis BB12 were successively abbreviated as HBZ11, HBZ25, HSQ-4, HMT-4, HBGS, HBL1, and HBB12. The pH of the HST was determined using a precise pH meter (PHSJ-3F; INESA Analytical Instrument Co., Ltd., Shanghai, China). Total titratable acidity (TTA) was measured by alkali titration: 5 mL of HST mixed with 45 mL of distilled water; after filtration, 1% phenolphthalein indicator was added to the filtrate, and 0.01 mol/mL NaOH was used to titrate it to a reddish color. The results were expressed as g lactic acid equivalent/kg. The viable counts (CFU/mL) were measured during fermentation by spreading on MRS agar medium (MRS broth supplemented with 20 g/L agar) plates in anaerobic conditions at 37 °C for 24 h.

2.4.2. Determination of Organic Acid, Total Phenols, Total Carotenoids, and Lycopene

Oxalic acid, ascorbic acid, lactic acid, citric acid, and succinic acid were measured referring to the method of Choi et al. [23]. Then, 1 g of the sample was added to 10.0 mL of distilled water, extracted by ultrasound for 30 min, and filtered twice with filter paper. The filtrate was again filtered by an injection filter (RC, 0.2 um, 25 mm). The filtered samples were analyzed using HPLC (Agilent Technologies 1260 infinity) equipped with a diode array detector and an Agilent C18 column (3.9 mm × 250 mm). The injection volume, mobile phase, flow rate, elution time, column temperature, and detection wave were 10 µL, 0.008 N sulfuric acid, 0.6 mL/min, 30 min, 50 °C, and 210 nm, respectively.
The Folin–Ciocalteu method, slightly adjusted according to [24], was used to determine total phenols. First, 1 mL of methanol was added to 0.5 g of sample at an eddy oscillation of 30 s. After centrifugation at 10,600× g for 5 min, the supernatant was agitated at 180 r/min for 1 h. Then, 100 µL of Folin–Ciocalteu reagent was added to 100 µL of supernatant. After 6 min, 100 µL of Na2CO3 solution (10% w/v) was added. The absorbance value was determined at 750 nm after 90 min. The total phenols content was expressed in mg equivalent gallic acid/g.
According to the method of Bamidele et al. [25], minor adjustments were made to measure carotenoid and lycopene. Total carotenoids and lycopene were extracted using a mixture of hexane, acetonitrile, and ethanol (50:25:25, v/v/v). In brief, 0.5 g of sample was added to 1.0 mL of the mixed solvent for carotenoid extraction, the extract was centrifuged for 5 min at 10,600× g, and the supernatant was shaken at 180 r/min for 15 min. The absorbance of the filtered hydrophobic phase for determining carotenoid and lycopene was at 450 nm and 503 nm, respectively.

2.4.3. Antioxidant Capacity Assay

A sample of 0.5 g was dissolved in 1.0 mL of 80% methanol. The supernatant (methanol extract) was collected after centrifugation at 10,600× g for 5 min, filtered with a 0.45 μm syringe, and stored at −20 °C until antioxidant analysis.
  • DPPH Method
2,2-Diphenyl-1-picrylhydrazyl (DPPH) radical scavenging capacity was analyzed using Peinado et al. [26] with slight adjustments. The methanol extract was added to 0.2 mL of DPPH solution (0.024 g/L methanol solution) and kept away from light for 30 min. Absorbance was determined using an ultraviolet spectrophotometer at 515 nm. DPPH radical scavenging capacity was calculated according to the following formula:
DPPH% = ((AcontrolAsample)/Acontrol) × 100
where Acontrol represents the absorbance value of DPPH solution without sample, and Asample represents the absorbance value of DPPH solution with sample added for 30 min.
  • ABTS Method
According to the method of Tao et al. [27], the 2,2’-azino-bis (3-ethylbenzothiazoline-6-sulphonic acid) (ABTS) radical scavenging capacity of the samples was determined. In brief, 5 mL of ABTS solution (7 mmol/L H2O) and 90 mL of (NH4)2S2O8 (140 mmol) were mixed and left overnight (16 h) in the dark at room temperature. The obtained ABTS˙+ radical solution was diluted with methanol to check its absorbance of 0.70 ± 0.02 at 734 nm. Then, 0.1 mL of the sample solution (methanol extract) was added to 0.2 mL of the ABTS˙+ radical diluent, and the absorbance was measured at 734 nm after leaving the mixture for 10 min in the dark. Then, the absorbance value of ABTS solution without a sample was used as the control. ABTS radical scavenging capacity was calculated according to the following formula:
ABTS% = ((AcontrolAsample)/Acontrol) × 100
where Acontrol is the absorbance value of ABTS solution without the sample, and Asample is the absorbance value of ABTS solution with the sample.

2.4.4. Determination of Color

Sample color analysis was performed using a colorimeter (CR-400; Minolta Camera Co., Osaka, Japan). L* stands for the brightness, a* stands for the change degree of red (+) and green (–), and b* stands for the change degree of yellow (+) and blue (–). The colorimeter was calibrated with a white plate before use.

2.4.5. Analysis of Volatile Flavor Substances

Headspace-solid phase microextraction coupled with gas chromatography (SCION SQ 456, BRUKER, Billerica, MA, USA)-mass spectrometry (HS-SPME/GS-MS) was used for the analysis of volatile flavor substances in HST as the method was described previously [28], with some modifications. For the temperature change, the oven temperature was set at 40 °C during the first 3 min and then increased to 90 °C at 5 °C/min. Then, the temperature was increased to 150 °C at 3 °C/min. Finally, the temperature was increased to 230 °C at 10 °C/min and held for 6 min. The other conditions were the same.
The volatile compounds were identified by NIST 11 Database, which required positive and negative matching degrees greater than 800 and compared their retention indices (RI) with those previously reported in the literature. The C6-C26 n-alkanes were analyzed under the same chromatographic conditions as the sample, and the instrument operation software calculated each substance’s retention index (RI). 2-Octanol was used as an internal standard for semi-quantitative analysis, and the relative content of the test compound was calculated based on the ratio of the peak area of the test compound and the internal standard. The estimated concentration of each volatile compound in the sample was calculated according to the report [29]. The odor activity value (OAV) described the contribution of each volatile compound. OAVs were calculated using the following equation:
OAVi = Ci/Ti
In the equation, Ci and Ti represent each volatile component’s estimated concentration and odor threshold, respectively. Compounds with OAVs greater than or equal to 1 were considered essential contributors to odor.

2.4.6. Sensory Evaluation

According to the reported methods [23], with slight modifications, the sensory evaluation group consisted of 20 trained food-related professionals (10 males and 10 females 20–30 years old). The samples were randomly placed in transparent, food-grade plastic cups and randomly numbered. Clean water was provided to the sensory assessment teams to neutralize their taste in between sample consumption. Sensory evaluation (color, texture, flavor, and taste) was scored using a nine-point scale, where 1 = extremely weak, 3 = weak, 5 = moderate, 7 = strong, and 9 = extremely strong. The overall acceptability was scored using the following nine-point scale: extremely disliked (1), disliked (3), generally (5), liked (7), and extremely liked (9).

2.5. Statistical Analysis

Three replicates were performed for each sample. The experimental data were expressed as mean ± standard deviation (SD). One-way ANOVA and principal component analysis (PCA) were used for sample analysis using the SPSS software package (version 22.0; SPSS, IBM, Armonk, NY, USA). Differences were considered significant at p < 0.05 according to Tukey’s multiple range tests.

3. Results and Discussion

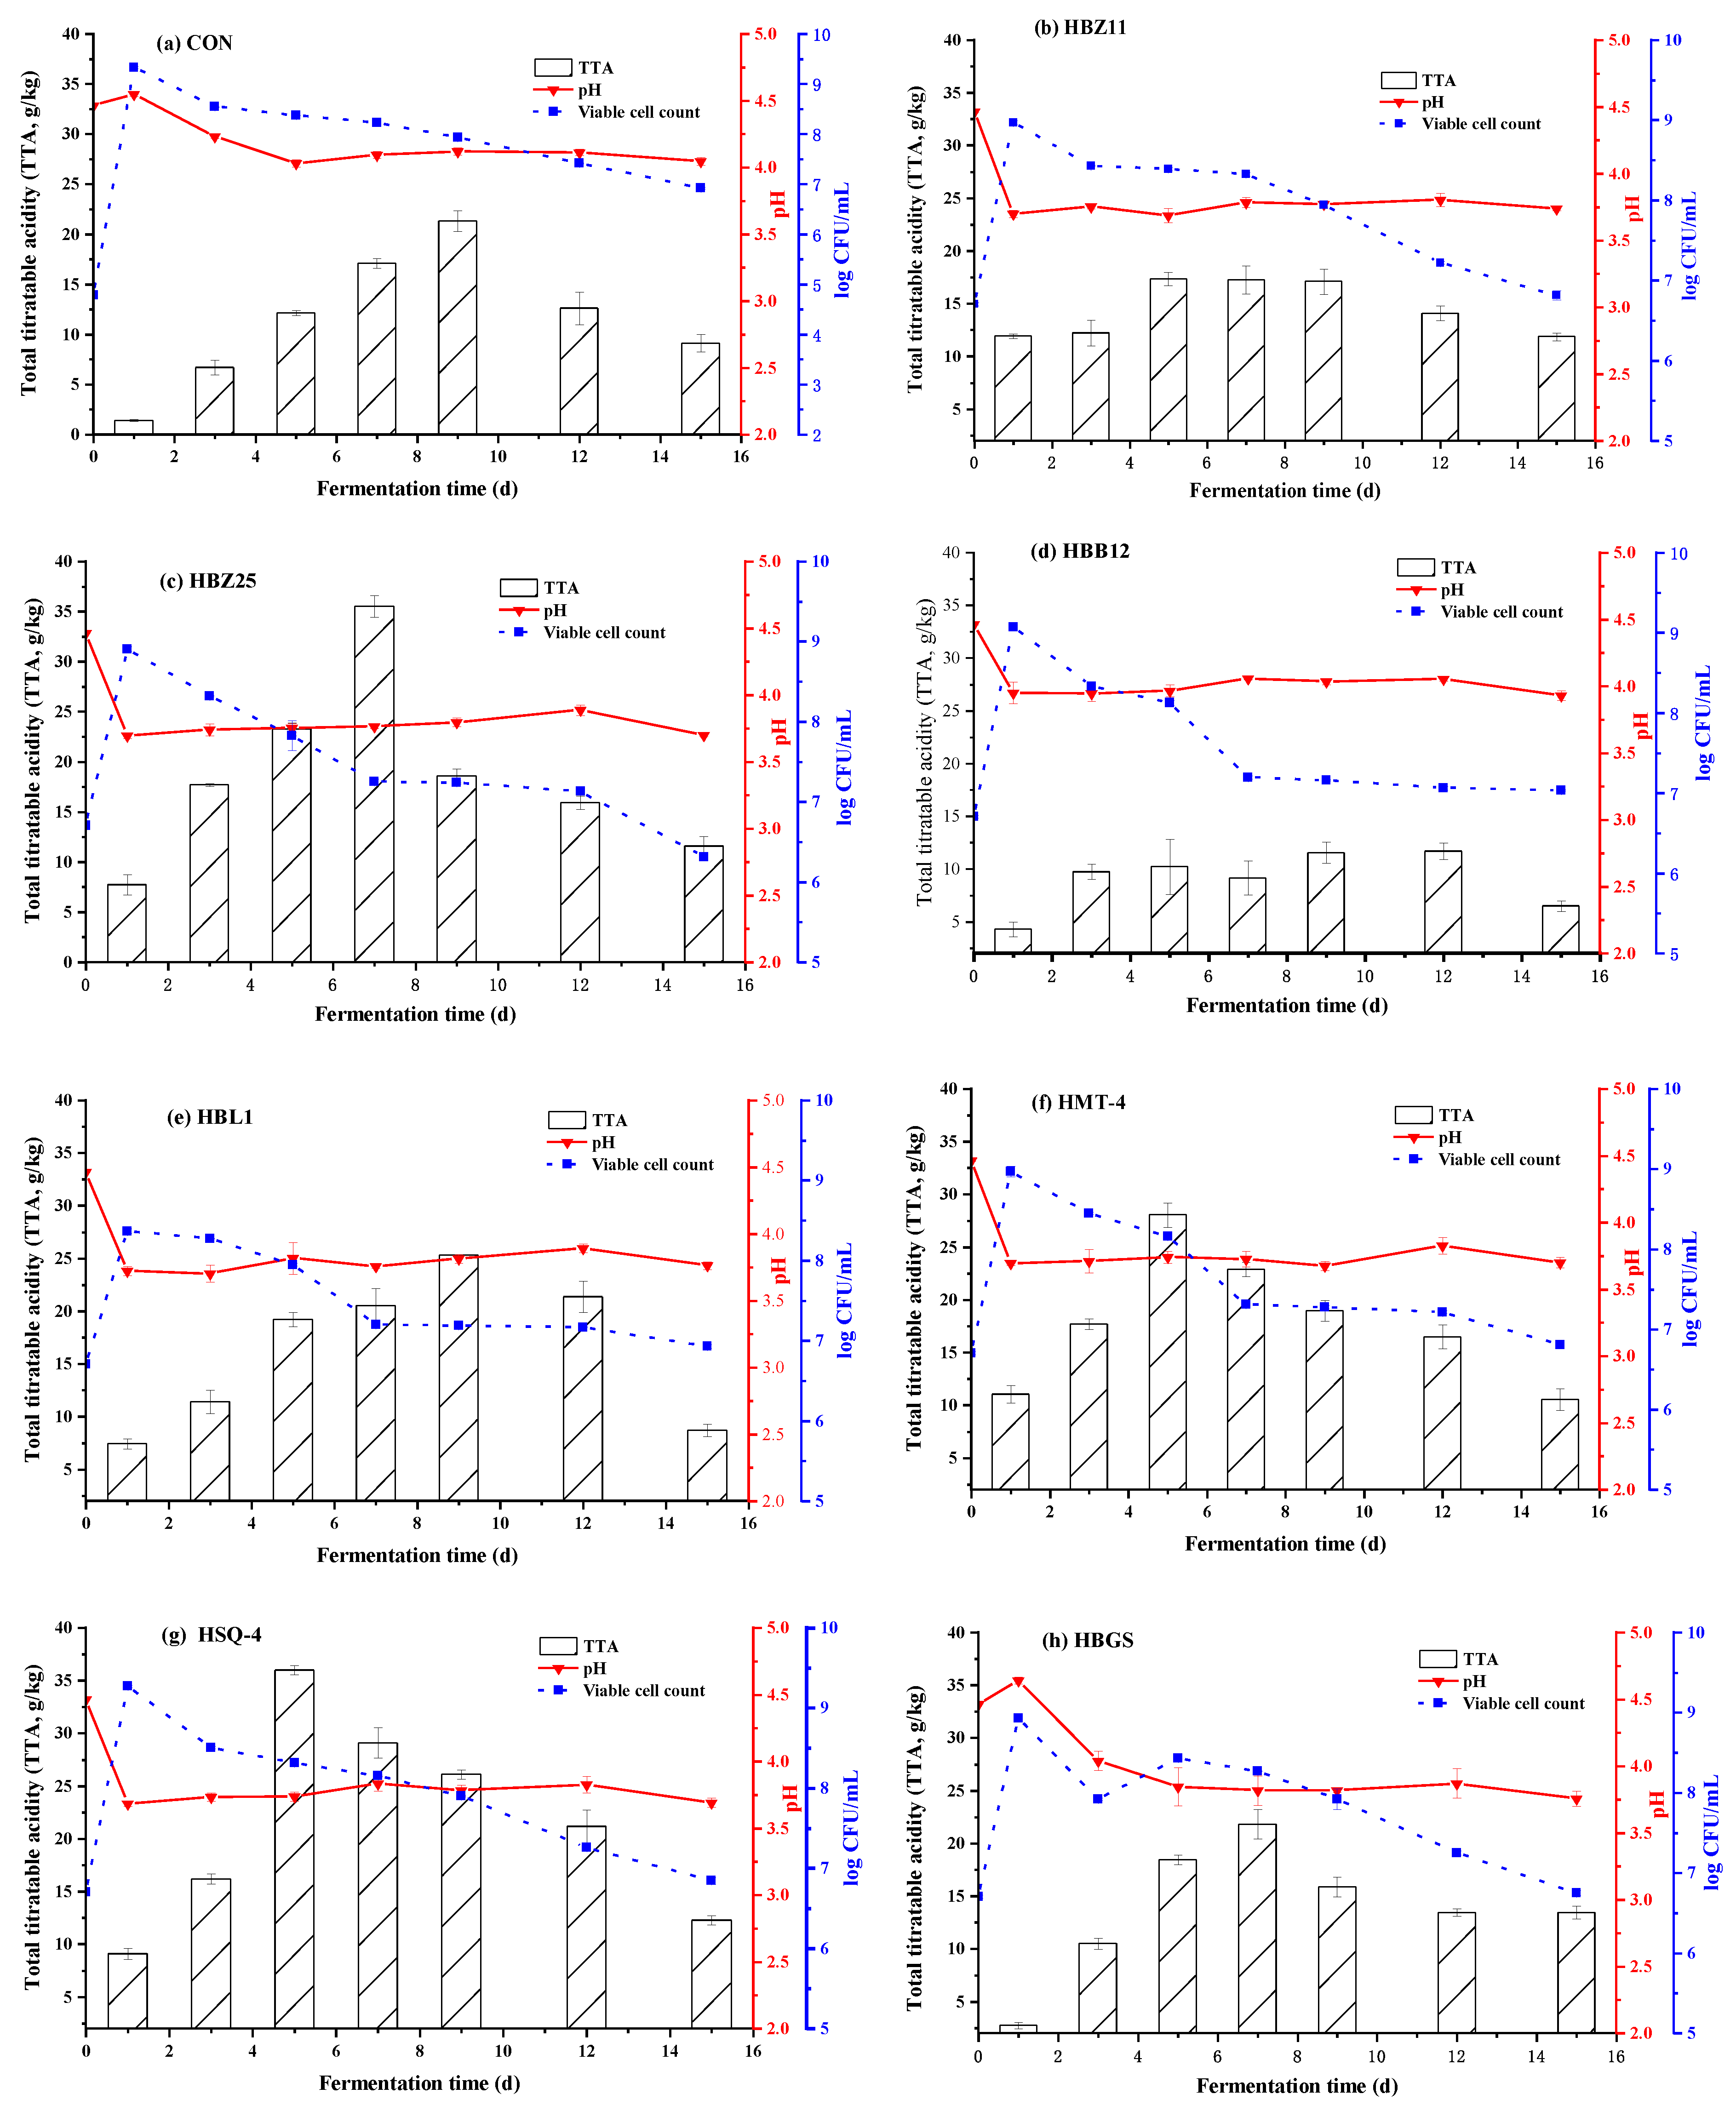
3.1. Changes in pH, TTA, and Microorganisms

The influence of strain on pH is shown in Figure 1. The initial pH was 4.46. With the increase in fermentation time, the pH of the control and inoculation groups decreased and fluctuated slightly during this period. In addition, the pH of the inoculation group at the same fermentation time was lower than that of the control group. For the inoculation group, the pH of HBB12 decreased the least by 0.53, and that of HSQ-4 decreased the most by 0.77. Another interesting phenomenon is that after one day of fermentation, the pH of the inoculated group, except HBGS, dropped to its lowest significantly and basically stayed unchanged until the 15th day fermentation. The pH of HBGS increased on the first day, then continued to decline to its lowest on the third day of fermentation and basically stayed unchanged to the 15th day. From the fifth to the fifteenth day of fermentation, the pH of the fermentation group was basically unchanged (HBGS) or fluctuated slightly. The pH of the control group increased somewhat on the first day, then decreased to its lowest pH of 4.03 on the fifth day, and then rose to 4.04 on the 15th day. The number of viable bacteria in the control group at the fermentation beginning (day 0) is 4.8 log CFU/mL. MRS is used to count lactic acid bacteria, so there must be some residual lactic acid bacteria in the control group after pasteurization, and they will grow during fermentation. That is consistent with the fact that lactic acid bacteria are the dominant bacteria [4] in the traditional fermentation of HST. The lactic acid bacteria in the control group grew fast. Still, their pH reduction performance was not as good as that of the lactic acid bacteria inoculated, mainly because the inoculation group was inoculated with LAB with strong acid production ability.
Therefore, inoculation and fermentation can rapidly reduce the pH of HST. The pH-reducing ability of different LAB is also differential, which is of great significance for selecting excellent lactic acid bacteria to control fermentation and inhibit the growth of harmful bacteria, such as Pseudomonas. In the early stage, we found a certain amount of Pseudomonas in the naturally fermented HST [4]. Yoon et al. [30] and Milica Marković et al. [31] reported another change in the pH during LAB fermentation: pH kept dropping during fermentation. So, the pH change of our HST fermented by lactic acid bacteria has its characteristics, which may be mainly caused by the specificity of raw materials and strains. In particular, SQ-4 can rapidly reduce pH by a wide margin, significantly preventing the proliferation of spoilage bacteria and ensuring product quality.
As for the change of total acid, the total acid of the inoculation group and the control group rose first and then decreased (Figure 1). The total acid of the inoculation group reached the maximum on the fifth or seventh day. In contrast, the total acid of the control group reached the maximum on the nineth day, showing that the inoculation of these lactic acid bacteria can produce acid quickly. Then the pH of the inoculated and the control groups decreased to a lower value on the 15th day. However, the acid production capacity of inoculation and fermentation varies greatly. The maximum acid production is 36.00 ± 0.45 g/kg of HSQ-4 or 35.53 ± 1.06 g/kg of HBZ25, and the minimum is about 17.37 g/kg of HBZ11. Because of the lack of fructooligosaccharide, the maximum acid production was lower than the 59.00 ± 0.17 g/kg reported by Koh et al. [32]. Ricci et al. [33] also studied the acid-production capacity of lactic acid bacteria in different substrates, and their results are similar to our findings. In addition, another exciting phenomenon is that after one to three days of fermentation, the pH fluctuates slightly, but the total acid fluctuates wildly, especially HSQ-4. That may be because the organic acids that changed considerably in the middle and later fermentation stages were weak, so the change had little impact on the pH. It also shows that the organic acid metabolism is active during fermentation. Combined with the sensory characteristics below, it can be seen that the organic acid metabolism is in the direction of better flavor: the acid taste is softer. In addition, the different production of these strains in the middle and late stages of fermentation is mainly due to the difference in the production of weak acids. Yoon et al. [30] displayed another phenomenon of pH and TTA in the tomato juice fermented by LAB: the pH changes of tomato juice during LAB fermentation were consistent with the TTA changes. The change inconsistency of pH and TTA between the presented study and Yoon et al.’s report [30] was mainly due to differences in strains and raw materials.
Concerning the change in the number of viable bacteria (Figure 1), it should be noted that after pasteurization (70 °C, 15 min), the number of viable bacteria in the control group (HST materials) at the fermentation beginning (day 0) was 4.8 log CFU/mL (described in Section 2.3). The initial (0 day) viable count of materials of HST after inoculation was 6.7 log CFU/mL (described in Section 2.3). After one day of fermentation, the changing trend of viable counts was similar: they all increased and reached the maximum value on fermentation’s first day, then gradually decreased. That is because the accumulation of acid and harmful metabolic substances inhibits LAB growth with the fermentation time. That was consistent with the research results of Raffaella Di Cagno et al. [34], indicating that the selected strains are suitable for growth in HST. After 1 day of fermentation, the viable count of Lactiplantibacillus plantarum SQ-4 reached 9.27 ± 0.02 log CFU/mL, and the viable count of Bifidobacterium BB12 reached 9.07 ± 0.03 log CFU/mL. In the control group, strains grew after fermentation, indicating that the sterilization was incomplete under this condition. Zhang et al. [35] studied the inoculation of lactic acid strains as a starter to ferment vegetable food, which can inhibit the growth of potentially pathogenic strains and greatly reduce the harm of pathogenic bacteria in food. This study showed that the number of viable bacteria in the control group was the highest at the same fermentation time, but the pH of the control group was the highest at the same fermentation time. That was consistent with the report that the high viable cell count did not cause the low pH value [36]. That shows that the acid-producing ability of many bacteria in the control group is weak. That also indicates that the inoculation of excellent LAB is necessary for rapid acid production and inhibition of the growth of miscellaneous bacteria. In the next step, we will further study microbial community structure changes in the fermentation process of HST with and without added bacterial inoculum. That will help reveal the reasons for the difference in pH and TTA among the control and inoculation groups.

3.2. Effect of Fermentation on Organic Acid, Total Phenols, Total Carotenoids, Lycopene, and Antioxidant Activity of HST

To further explore the influence of fermentation on several common organic acids, we detected the contents of several organic acids (Table 1). For the detected organic acids, the lactic acid content is the highest after fermentation, which was in accordance with the reports [37,38]. The natural fermentation of fruits and vegetables may be mainly LAB fermentation, and LAB inoculated will also produce a large amount of lactic acid. Succinic acid is the second largest organic acid output, and it is also significantly higher in the fermentation group than in the non-fermentation group (50.95 mg/100 g). Succinic acid in HMT-4 was the highest (107.45 mg/100 g), and HBB12 was the lowest (75.72 mg/100 g) among the fermentation groups. Ascorbic acid in the inoculated fermentation and control groups was significantly higher than in the unfermented group (0). Still, ascorbic acid in the HMT-4 and HSQ-4 remained 0. Ascorbic acid was a physiologically active substance in tomato’s primary raw material [39]. However, ascorbic acid was not found in the raw materials. That may be because some ascorbic acid was oxygenated by oxygen, and some exist in the raw material in the form of a bound state. The increase in ascorbic acid in some fermentation groups may be due to the conversion of the bound form in the raw material to the free form of ascorbic acid or newly generated ascorbic acid. Zhou reported that Lacticaseibacillus rhamnosus enriched metabolites, including lactic acid and ascorbic acid, which can desirably contribute to the flavor and quality of the HST [8].
The control and HBGS groups significantly reduced citric acid’s content to 0. Other inoculated strains had a specific contribution to the content of citric acid. Compared with the unfermented group (26.54 mg/100 mL), the highest content was 31.98 mg/100 mL (HBB12), and the lowest was HMT-4 and HBZ11 (21.37 mg/100 mL). Fermentation also affected oxalic acid. Compared with the unfermented group, oxalic acid in the control group was reduced by over onefold. Still, the oxalic acid content in the inoculation group was significantly higher than that in the unfermented group, with the highest being HBZ25 and HMT-4 (31.54 mg/100 mL). Oxalic acid, citric acid, and succinic acid are mainly the tricarboxylic acid cycle’s products, mostly produced by aerobic organisms. Anaerobic fermentation anaerobic organisms generally do not directly produce such substances. Therefore, such substances in HST mainly come from raw materials. The changes caused by inoculation and fermentation are primarily due to the release or transformation of metabolic activities. Although the concentrations of organic acids were different at the end of fermentation, they were related to starters because lactic acid bacteria may produce organic acids and activate various endogenous enzymes [40].
The content of total phenols in HST was significantly higher than that in the unfermented group (p < 0.05). Still, the differences were insignificant (p > 0.05) for total phenol contents of different HST, but HBGS. Compared with the unfermented group, total phenols content in the fermented group was improved over onefold, but the HBGS only increased by 32%. Ye et al. [41] demonstrated that fermentation could increase phenolic compounds’ content, which is consistent with our findings. Similarly, the content of total carotenoids in the fermented group, especially the HBZ11 group (3.52 ± 0.05 mg/mL), was significantly higher than that in the unfermented group (p < 0.05). The inoculated group had more folds of improvement. The highest multiples were HBZ11 and HBGS, higher than 2.8 times, while the control group only increased by 28%. The significant increase in carotenoid content suggests that a higher mobilization/solubilisation of these antioxidant compounds occurs [42]. Similarly, Managa et al. [43] repoted that Lactiplantibacillus plantarum L75 increased phenolic content, and Weissella cibaria W64 enhanced the total carotenoid content of the smoothies.
Hornero-Méndez et al. [44] found that the total carotenoid content of fermented orange juice was significantly higher than that of unfermented orange juice, indicating that fermentation can also increase the content of total carotenoids. Interestingly, however, we found that for total carotenoids, all the selected strains had significant differences (p < 0.05) in the total carotenoid content of fermented HST, which may be related to the growth of each strain on the substrate. The growth and metabolism of the starters created an acidic environment (about pH 3.7) [45]. In this environment, the internal structure of raw materials might be destroyed, and phenols and carotenoids might be released [41,46].
Lycopene, mainly derived from tomatoes, is a crucial biologically active composition in HST. It improves immunity, is anti-cancer, and prevents cardiovascular and cerebrovascular diseases [5,47].
As shown in Table 1, lycopene content in fermented and unfermented red acid soup is significantly different. The lycopene content in the unfermented group was 18.31 µg/mL, the highest lycopene content in the fermented group was HBZ25 (24.39 ± 0.46) and HSQ-4 (24.39 ± 0.46 µg/mL), and the lowest lycopene content was in the control group (14.70 ± 0.48 µg/mL) and HMT-4 (14.73 ± 0.10 µg/mL). It indicated that lycopene could be increased or decreased by inoculation, which was related to the characteristics of the strain. Lu et al. [48] reported that fermentation could improve the bio-accessibility of free lycopene in tomato juice. But J. García-Hernández et al. [9] showed that probiotics would harm lycopene. Phenolic compounds, carotenoids, and other bioactive substances play an essential role in the antioxidant capacity of various plant foods, which is conducive to improving the antioxidant capacity of fermented HST.
Fermentation also had a significant effect on the antioxidant activity of HST. The ABTS radical scavenging capacity of the fermented group was much higher than the unfermented group (18.83%), and that of the inoculated group was significantly higher than the control group (73.94%). HBZ25, HMT-4, HSQ-4, and HBGS had the highest ABTS radical scavenging capacity, and the highest value was around 84%. DPPH scavenging effect were similar, except that the fold of increase of the fermented group was higher (11) than that of the unfermented group (5.11). Differences among samples in the inoculated group were not significant (p > 0.05). That shows that DPPH and ABTS radical scavenging capacities are not consistent, which is also caused by the difference in characterization properties. Xue Zhang et al. [49] also found that ferment by lactic acid bacteria can enhance raw materials’ antioxidant activity.
The antioxidant capacity of HST is related to biologically active substances. The fermentation process can increase food’s antioxidant capacity [50,51,52]. Khubber et al. [53] believe that lactic acid bacteria can promote the release of antioxidant substances such as organic acids, alcohols, phenolics, exopolysaccharides, and bioactive peptides, which also helps to enhance the antioxidant properties of fermented materials. In addition, fermenting lactic acid bacteria can produce antioxidant active substances such as polysaccharides, etc. [54,55]. Lactic acid bacteria inoculated in this study reduced pH, which contributed to the total phenols and carotenoids release, and improved ABTS radical scavenging capacity and DPPH radical scavenging capacity. These all enhanced the antioxidant activity of the fermented group.

3.3. Effect of Fermentation on the Color of HST

The influence of fermentation on the color of HST is shown in Table 2. During the fermentation of HST, the change of color was expressed by L*, a*, and b*. The L* value of all samples increased during the fermentation, indicating that the sample color became white and bright. The a* value means that the sample color becomes red, and the increase in the b* value indicates that the sample color turns yellow.
The L* value of the control group reached the maximum value of 25.72 on the first day of fermentation and remained unchanged after that. In contrast, the L* value of the inoculation group went to the maximum on the 7th to 15th day of fermentation, and the L* value remained basically unchanged or slightly decreased after reaching the maximum. The differences in the maximum L* values of the inoculated groups were slight, all within the range of 30 ± 1, but the changes were significantly different. In addition, the L* value of the inoculated group at the same fermentation time was greater than that of the control group, which indicated that the fermentation of these lactic acid bacteria could make the product brighter.
The a* value of the control group first increased, then fluctuated, and then decreased after 15 days of fermentation. The a* value of the inoculated group also first rose to the maximum and then remained unchanged (HBZ11 and HSQ-4), or decreased (HBZ25, HBB12, HBL1, and HMT-4). The a* value of HBGS first increased to the maximum, then remained unchanged, and then fluctuated in a small range. It decreased by day 15 of fermentation but was still significantly higher than the starting value. The a* value of the inoculated group was higher than that of the control group, but HBGS. That shows that inoculation with appropriate strains can significantly improve the a* value.
The b* values of the control group and the inoculated group first increased and then remained unchanged until the end of fermentation (HBZ11, HBZ25, HBGS) or rose to the maximum, then maintained for some time, then decreased, and then stabilized (HBB12). As for HBL1, its b* value increased to the maximum, stabilized for a while, fluctuated, and stabilized to the maximum at a later stage. The HSQ-4’ b* value rose to the top, then decreased slightly and stabilized to the end of the fermentation. The highest b* value was 13.33 (HMT-4), higher than the control group’s 8.04–8.75. Moreover, the maximum b* value of the inoculated group was higher than that of the control group. In addition, the b* value after fermentation was higher than the initial value.
It shows that fermentation and inoculation with suitable strains can improve the color of the product [56]. Therefore, judging from the color changes, fermentation increased the L*, a*, and b* values, and the maximum color values of the inoculated bacteria were higher than those of the control group. That is mainly due to the metabolism of microorganisms. It is just that different strains reflect individual specificity, so the change rules are not precisely the same. That reflects both commonalities and individual differences.
ΔE* (total color difference) indicates the total color difference between two samples. When the value of ΔE* is greater than 1, the color difference can be perceived by the human eye. The higher the value, the easier it is to distinguish the difference between colors [57]. Tiwar et al. [58] believe that when the value of ΔE* is more than 3, the color difference between two samples can be clearly distinguished. The effect of fermentation process on the color of HST is shown in Table 1. After fermentation, ΔE* basically increases. During fermentation, the maximum can reach 10.28 ± 0.74 (HBZ25, the 12th day). Each HST showed its own ΔE* change characteristics. At the end of fermentation, the ΔE* of the inoculation group was significantly higher than that of the control group (3.48), which also showed that the inoculation significantly changed the color of HST. In addition, the color of fermented HST is significantly different from that of unfermented HST (ΔE* > 3) [58]. Combined with the changes of L*, a*, and b*, it can be considered that the color of HST is significantly improved by inoculation and fermentation and that the inoculation group is better. Costa et al. [59] also found L. casei fermentation improved the color of pineapple juice.
The product’s color was primarily generated from the phenols and carotenoids such as lycopene and β-carotene and was an important factor affecting consumers’ judgment on appearance [27]. Hence, the increase in L*, a*, b*, and ΔE* might be mainly due to the bacterial metabolism’s release of phenols and carotenoids [60]. The growth and metabolism of the starters created an acidic environment (about pH 3.7) [45]. In this environment, the internal structure of raw materials might be destroyed, and phenols and carotenoids might be released [41,46].

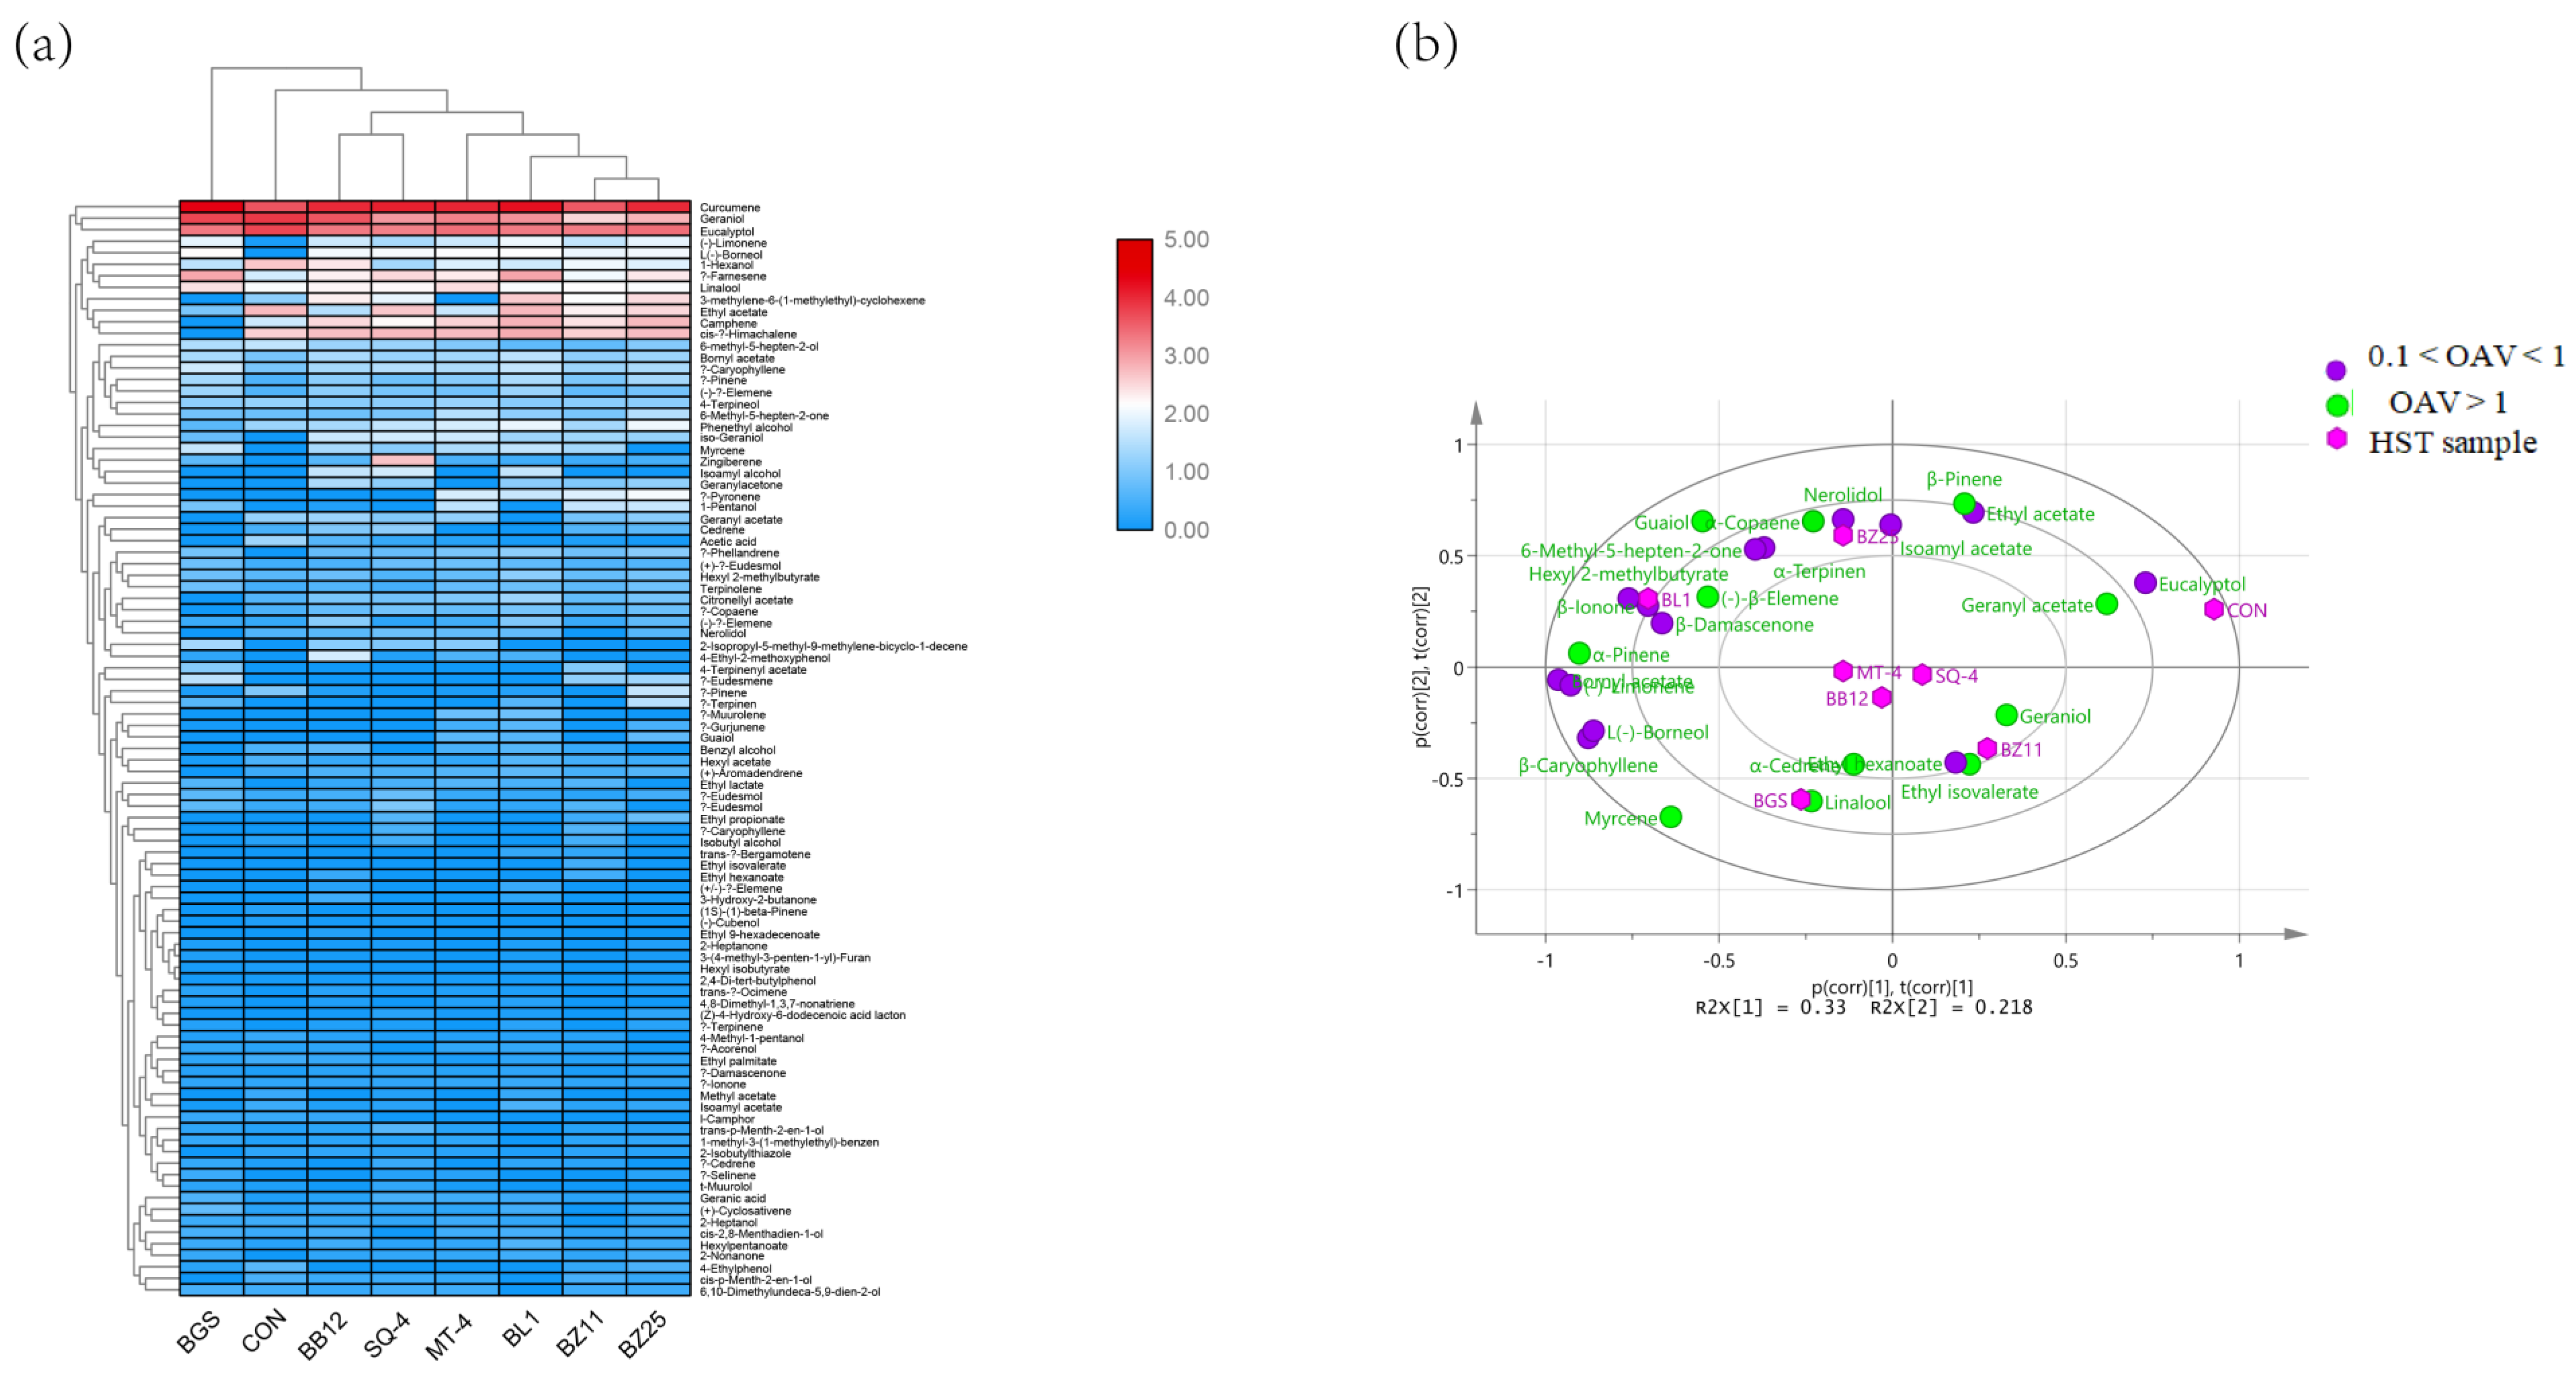
3.4. PCA of the Volatile Substances of HST

Besides metabolites such as lactic acid and ethanol, many volatile metabolites such as alcohols, esters, and alkenes are also produced [61,62]. A total of 95 volatile flavor substances were detected (Table S1), including hydrocarbons (34), alcohols (26), esters (18), ketones (8), phenols (3), acids (2), and others (4). Figure 2a shows a clustered heatmap of fermentations by different strains, with red (blue) representing larger (smaller) values. Higher concentrations of curcumene, geraniol, eucalyptol, ethyl acetate, hexyl 2-methylbutyrate, bornyl acetate, 6-Methyl-5-hepten-2-one, α-pinene, (–)-limonene, β-caryophyllene, α-farnesene, (–)-β-elemene, (–)-γ-elemene, 1-hexanol, 6-methyl-5-hepten-2-ol, linalool, 4-terpineol, and phenethyl alcohol were determined, indicating these aroma substances may have enormous contributions to the aroma of HST. However, cis-α-himachalene, camphene, acetic acid, citronellyl acetate, and α-copaene were identified in other strain starter samples but not detected in HBGS. α-Phellandrene, zingiberene, L(–)-borneol, iso-geraniol, and 2-nonanone were not measured in the CON but were in the inoculated groups, which was related to the sensory perceptions of citrus aromas and weak sweetness, reported previously as main volatile components of fresh ginger [63]. Moreover, compared with CON, eucalyptol, 1-hexanol, and geraniol were reduced in the inoculated groups. They were also reported as the main volatile components of fresh ginger and might be related to the formation of esters, aldehydes, and ketones [63].
Due to lack of odor threshold, some terpenes and alcohols cannot be evaluated for aroma using OAV. Twenty-five aroma compounds in Table 3 were found to have corresponding thresholds, and OAVs were calculated as shown. Our result showed that geranyl acetate, α-pinene, myrcene, β-pinene, α-copaene, α-cedrene, (–)-β-elemene, linalool, geraniol, and guaiol were quantified with OAV > 1, suggesting that these were a significant contribution to the characteristic aroma of HST. Based on the odor descriptions of aroma compounds in Table 3, these compounds contributed a similar aroma profile to that of fresh, herbal, fruity, spicy, woody, and sweet balsamic smells.
PCA was performed with various aroma compounds whose OAVs were >0.1 to reveal the varietal aroma traits of the HST samples. PC1 and PC2 comprised 33% and 21.8% of the total variance. The loadings of the varietal compounds and distribution of the HST samples are shown in Figure 2b. CON was located in the first quadrant and characterized by eucalyptol. Eucalyptol (OAV = 0.23) was previously reported as the main alcohol in fresh ginger and had a camphor-like aroma and cool flavor, which would make people feel unpleasant [64]. HBL1 and HBZ25 were located in the second quadrant, which were characterized by guaiol (OAV > 54.74), α-pinene (OAV > 2.61), hexyl 2-methylbutyrate (OAV > 0.5), and β-pinene (OAV > 0.23). HBGS lay on the third quadrant and was mostly characterized by linalool (OAV = 1.47), myrcene (OAV = 4.37), and β-caryophyllene (OAV = 0.36). Likewise, (–)-β-elemene (OAV = 94.7), geranyl acetate (OAV = 1.59), α-copaene (OAV = 1.19), nerolidol (OAV = 0.59), and ethyl hexanoate (OAV = 0.57) were characteristic compounds in HBB12. Guaiol (OAV = 59.5) and 6-methyl-5-hepten-2-one (OAV = 0.27) were highly correlated with HMT-4. HBZ11 was in the fourth quadrant, and its characteristic compounds included ethyl isovalerate (OAV =1.27), ethyl acetate (OAV = 0.4), and α-cedrene (OAV = 0.83). Nerolidol (OAV = 0.78), β-damascenone (OAV = 0.9), α-copaene (OAV = 1.46), and ethyl acetate (OAV = 0.54) were characteristic compounds in HSQ-4. These results show that HST fermented with the starter is more fruity, woody, and spicy than uninoculated HST. Li et al. [15] proved that enhanced fermentation shortens the fermentation cycle of sour tomato soup and significantly improves its flavor quality, which has great value in the industrial production of sour tomato soup and the development of a vegetable fermentation starter.
Table 3. The retention time (RT), odor descriptions, odor thresholds (OT), and odor activity values (OAVs) of aroma compounds in HST.
Compounds (μg/100 mL)RT (min)Odor DescriptionOdor Threshold(μg/L)OAVs
CONHBZ11HBZ25HBB12HBL1HMT-4HSQ-4HBGS
Ethyl acetate3.447Pineapple, fruity, balsamic97.8 a0.590.400.480.190.600.230.540.10
Ethyl isovalerate7.191Banana, sweet fruity3 aND1.27ND0.12NDNDND0.06
Isoamyl acetate8.653Banana, fruity, sweet30 a0.110.060.080.040.15ND0.060.02
Ethyl hexanoate11.832Flowery, fruity5 aND0.74ND0.57NDNDNDND
Hexyl 2-methylbutyrate15.512Sweet fruit18 a0.330.400.500.430.670.400.280.45
Bornyl acetate18.811Woody, herbal75 b0.130.170.190.220.260.200.180.22
Geranyl acetate21.002Sweet, floral9 c1.481.001.301.59ND1.421.18ND
α-Pinene5.991Woody, fir needle, cooling, minty6 b0.811.642.611.972.791.881.372.58
Myrcene9.732Spicy, mint4.9 bND3.17ND3.304.143.502.354.37
β-Pinene9.805Woody, pine, minty, camphor6 b1.71ND3.530.200.230.12ND0.15
α-Terpinene10.038Woody, lemon, citrus80 cNDND0.24ND0.07NDND0.07
(–)-Limonene10.853Citrus34 b0.020.620.850.680.910.680.480.84
α-Copaene17.528Woody, spicy, honey6 b0.770.961.311.191.541.201.46ND
α-Cedrene18.706Floral, herbal2.13 d0.470.83NDND0.95ND1.371.20
β-Caryophyllene19.918Fried, wood64 d0.150.230.260.250.330.270.280.36
(–)-β-Elemene18.959Spicy, fennel0.12 b22.5324.8454.5794.7085.9330.8317.0425.56
Linalool18.249Spicy, citrus, woody30 b1.141.191.151.251.121.501.221.47
Geraniol22.068Sweet, floral, fruity130 e1.050.370.470.880.590.650.560.97
Nerolidol24.021Fir, linoleum10 d0.51ND0.550.590.690.690.78ND
Guaiol25.173 Smoky, bitter, woody0.1 fNDND67.18ND54.7459.51NDND
L(–)-Borneol20.428Camphoraceous, pine180 bND0.170.180.180.200.190.180.20
6-Methyl-5-hepten-2-one14.501Sweet, fruity68 g0.120.140.270.120.180.270.140.13
β-Damascenone21.828Sweet, woody, fruity2.5 b0.390.290.640.720.850.660.900.63
β-Ionone23.117Balsamic, rose, violet5 b0.430.430.440.460.570.490.460.45
Eucalyptol11.104Eucalyptus, camphor550 b0.230.160.180.160.160.170.160.17
ND: not detectable; a Odor thresholds taken from reference [65], reprinted/adapted with permission from Ref. [65]. 2017, Wang, X.C.; Li, A.H.; Dizy, M.; Ullah, N.; Sun, W.X.; Tao, Y.S.; b Odor thresholds taken from reference [66], reprinted/adapted with permission from Ref. [66]. 2021, Sun, X.; Du, J.; Xiong, Y.; Cao, Q.; Wang, Z.; Li, H.; Zhang, F.; Chen, Y.; Liu, Y.; c Odor thresholds taken from reference [67], reprinted/adapted with permission from Ref. [67]. 2020, Liu, Y.; Li, Q.; Yang, W.; Sun, B.; Zhou, Y.; Zheng, Y.; Huang, M.; Yang, W.; d Odor thresholds taken from reference [68], reprinted/adapted with permission from Ref. [68]. 2020, Hou, Z.-W.; Wang, Y.-J.; Xu, S.-S.; Wei, Y.-M.; Bao, G.-H.; Dai, Q.-Y.; Deng, W.-W.; Ning, J.-M.; e Odor thresholds taken from reference [69], reprinted/adapted with permission from Ref. [69]. 2021, Zhao, L.; Ruan, S.; Yang, X.; Chen, Q.; Shi, K.; Lu, K.; He, L.; Liu, S.; Song, Y.; f Odor thresholds taken from reference [70], reprinted/adapted with permission from Ref. [70]. 2010, Yang, C.; Luo, L.; Zhang, H.; Yang, X.; Lv, Y.; Song, H.; g Odor thresholds taken from reference [71], reprinted/adapted with permission from Ref. [71]. 2014, Welke, J.E.; Zanus, M.; Lazzarotto, M.; Alcaraz Zini, C.

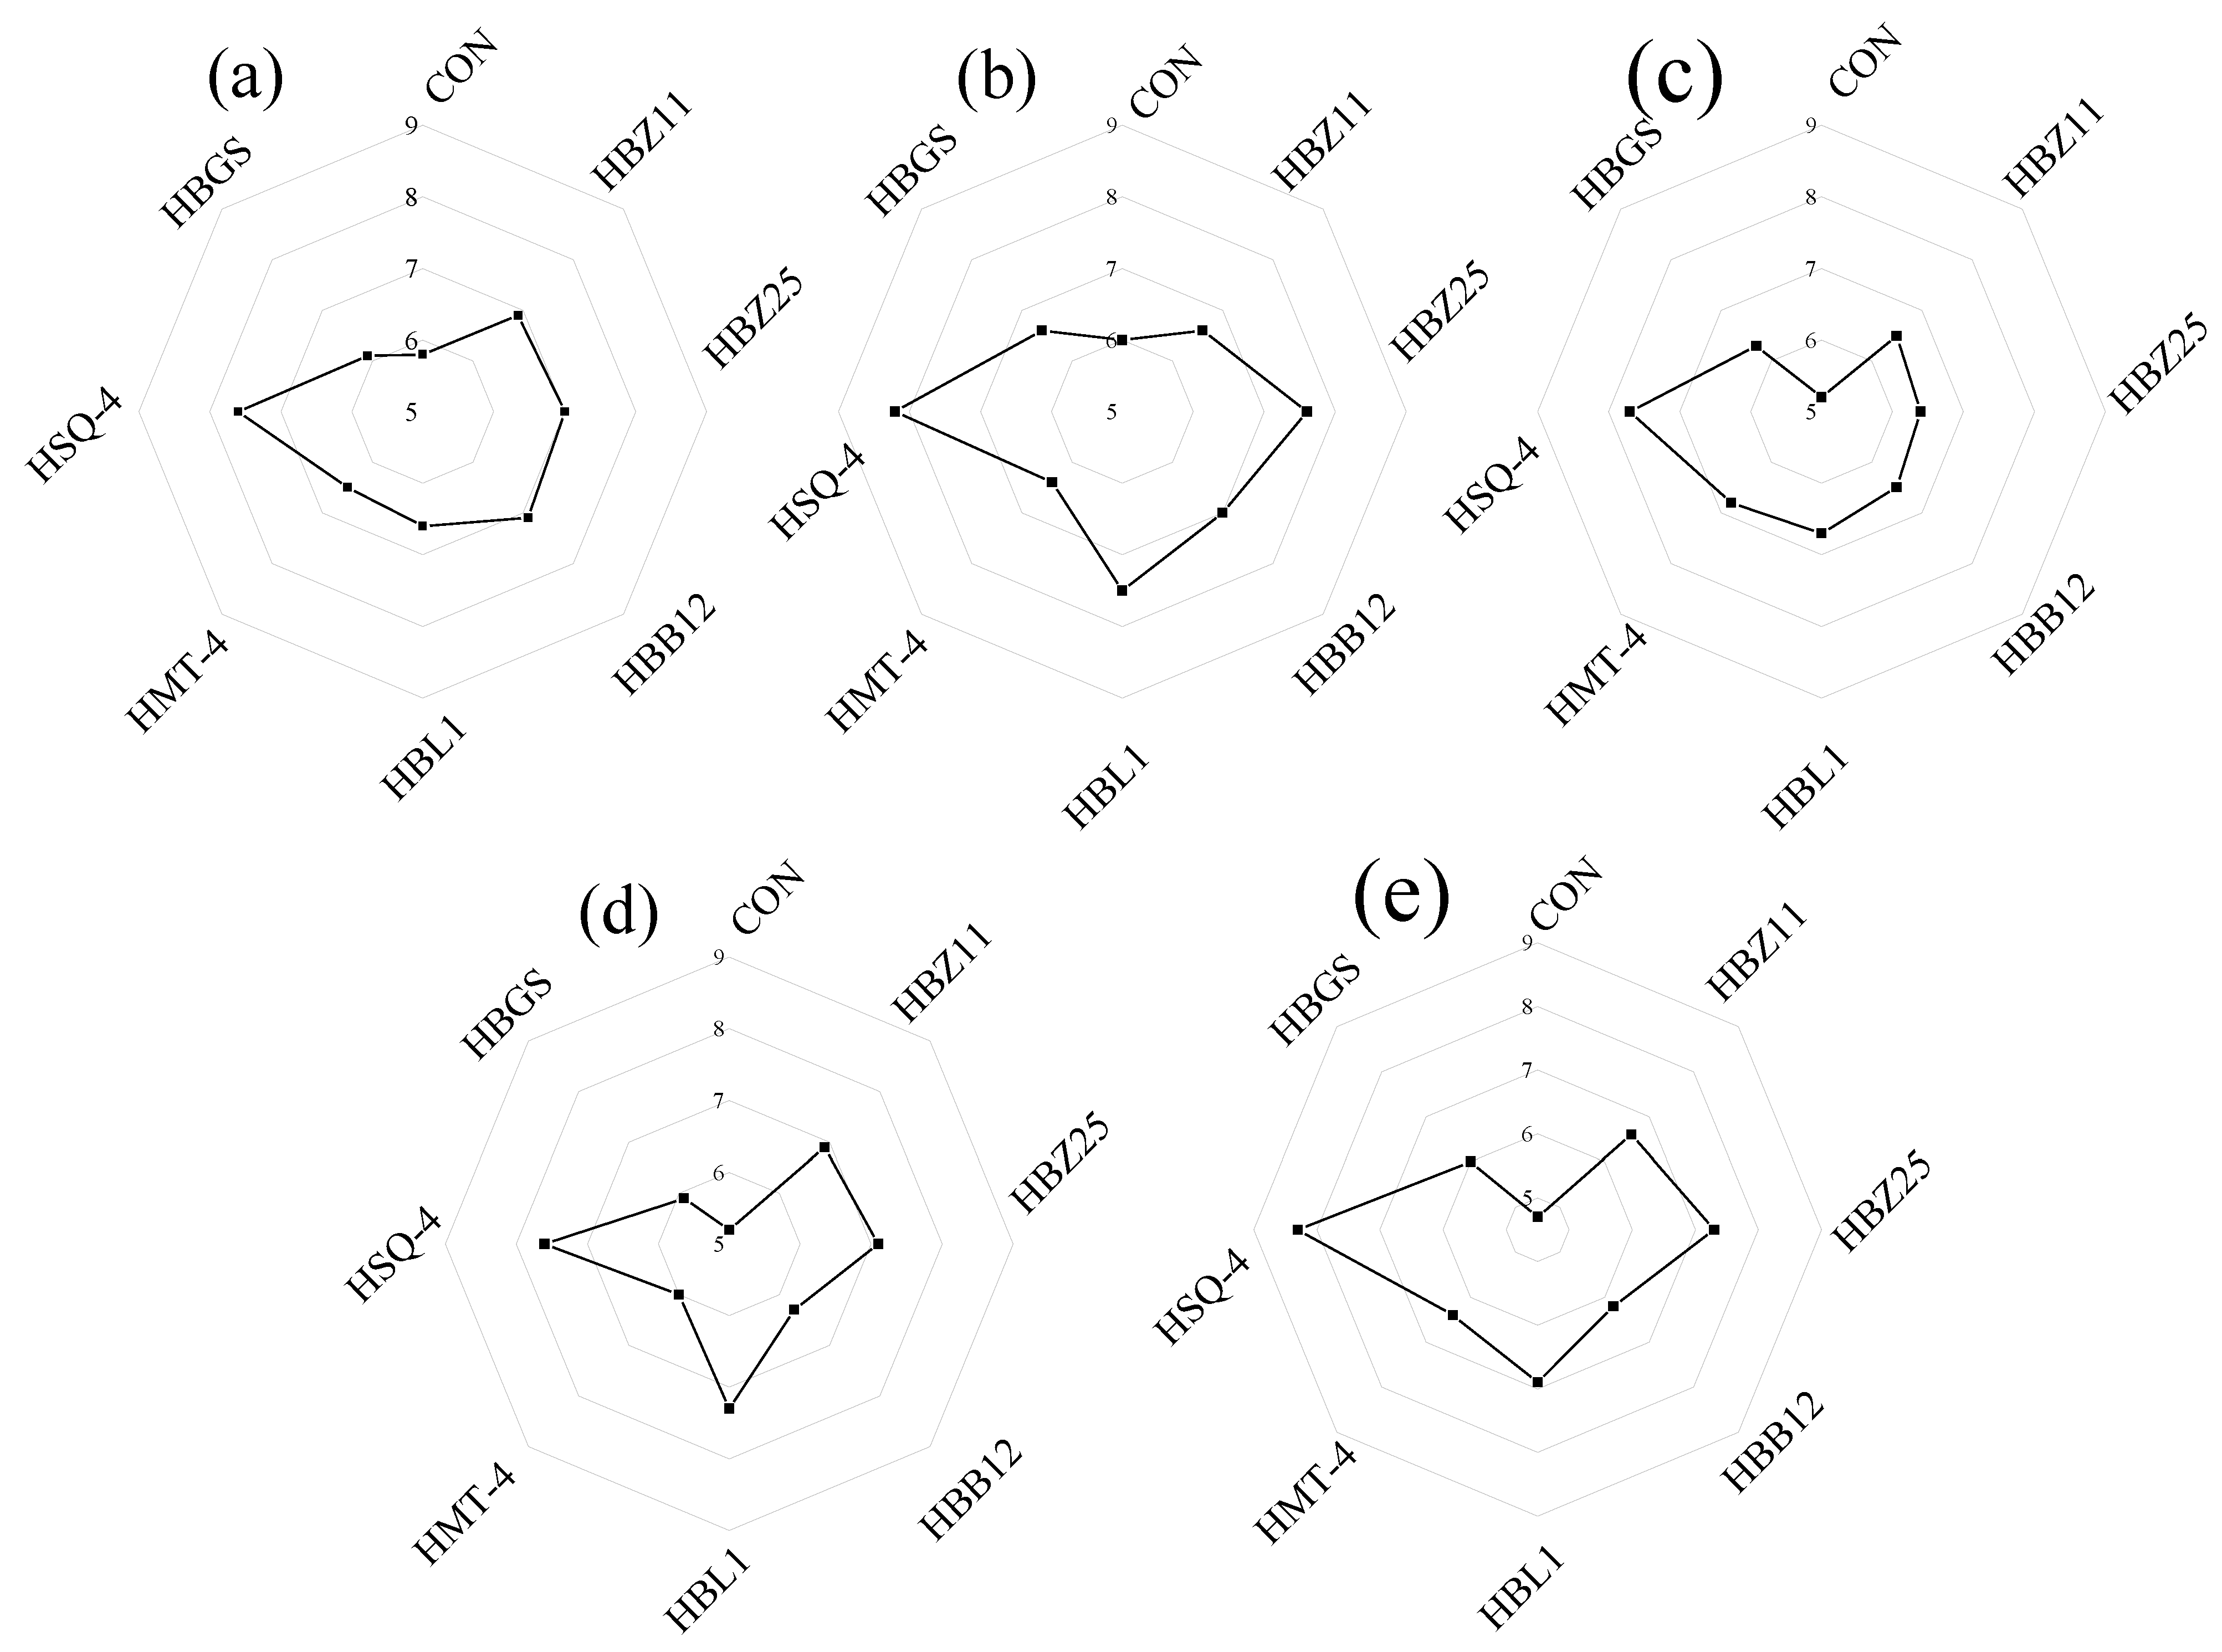
3.5. Sensory Analysis

The sensory evaluation results of HST are illustrated in Figure 3. The appearance and texture of all fermented HST samples were glossy, bright red, sticky, and homogenous (Figure 3a,b). The CON group was reddish and grainy. The scores of HBZ11, HBZ25, and HBB12 were relatively high. The score of HSQ-4 was the highest: all aspects of sensory performance were excellent, being pleasant, uniform, sticky, moderately sour taste, and moderately spicy (Figure 3a–d), which was different from fermented tomatoes [72], fermented red pepper [73], and Doubanjiang [74]. Acid can react with capsaicin and weaken the pungent, spicy taste of capsicum, which is one of the reasons for the decrease in the pungent taste of HST fermented with starter. In addition, the spicy and sour taste of HSQ-4 was the most suitable, while HBGS had a pungent, spicy taste. It showed that the weak effect of pungent taste caused by acid produced via BGS could not counteract the enhanced impact of pungent spicy due to the metabolism of capsicum and ginger materials by the BGS strain. It remained to be further explored what kind of metabolism caused this change. On the whole, the highest sensory score was HSQ-4, followed by HBZ25 (Figure 3e).
Each sensory property of the control group was lower than the inoculated group, and the overall acceptability was only 4.7. The HSQ-4 group showed the best in all aspects of the sensory properties, and the overall acceptability was 8.3. Slightly weaker than the HSQ-4 was HBZ25, with overall acceptability of 7.3. It has a lot of room for improvement in terms of flavor. However, the scores of HBZ11, HMT-4, and HBGS in each index are not more than 7, especially the taste of HBGS at only 5.9, indicating that these bacteria are not suitable for fermentation to produce HST. The flavor, taste, and overall acceptability of HBB12 were all lower than 7. The appearance, flavor, and overall acceptability of HBL1 were lower than 7, indicating that it was also suitable for fermented HST. The flavors of HBL1, HMT-4, HBZ11, HBZ25, and HBB12 are all weak, which may be related to the content of incompatible flavor components. For example, the OAV of Guaiol of HBL1 and HMT-4 is greater than 54, and its flavor is smoky, bitter, and woody. Overall acceptability of the HSQ-4 was 8.3, an excellent performance.
Our previous study indicated that Lactiplantibacillus plantarum SQ-4 could reduce cholesterol and nitrite and produce acid quickly and is acid-resistant and bile-salt-resistant. It has an inhibitory effect on Staphylococcus aureus and Escherichia coli. There is no hemolysis on the blood plate and no acute toxicity. When 6% NaCl and 150 mg/kg NaNO2 were added to MRS liquid medium, the growth of SQ-4 was somewhat inhibited, but the growth performance was good [20] [citing Song Xiaojuan’s master’s thesis]. Moreover, from all indicators, HSQ-4 showed good performance, indicating that SQ-4 was an excellent potential starter for preparing red acid soup.
Raffaella Di Cagno et al. point out that tailored LAB starters may exploit the potential of fruits and vegetables, improving hygiene, nutritional, sensory, and shelf life properties [75].

4. Conclusions

In conclusion, our study finds that different probiotic starters significantly affect the quality characteristics of HST. Adding tailored LAB starters, such as SQ-4, rapidly decreased HST’s pH; improved color; and increased organic acids, total phenols, total carotenoids, lycopene, antioxidant activity, and sensory properties of HST. Each starter produces its characteristic flavor components. α-Pinene, myrcene, α-copaene, and guaiol were vital aroma compounds in the inoculated HST. Among the seven single strains of fermented HST, HSQ-4 showed good performance from all indicators, indicating that SQ-4 was an excellent starter for preparing HST. However, it also shows that there is still room for further improvement, such as optimizing the process or mixing fermentation, which is our subsequent research. Moreover, further studies on the characteristics of HST are needed to obtain more information on the relationship between starters and metabolites. This work helped reveal the role of starters and the quality change of HST during fermentation. Moreover, it had an indicative value in further improving the quality of HST and promoting the industrial application of starters.

Supplementary Materials

The following supporting information can be downloaded at: https://www.mdpi.com/article/10.3390/fermentation8110589/s1, Table S1: Concentration of volatile compounds in HST samples.

Author Contributions

All authors contributed to the research design. Designed and conducted the experiments, writing—original draft, Q.Z.; writing—original draft, formal analysis, software, C.W.; supervision, funding acquisition, C.L.; writing—review and editing, funding acquisition, L.H.; validation, supervision, H.T.; investigation, supervision, X.Z.; Y.D., writing—review and editing. All authors have read and agreed to the published version of the manuscript.

Funding

This work was financially supported by the high-level innovative talents training project of Guizhou province (QKHPTRC-GCC[2022]026-1), the Key Agricultural Project of Guizhou Province ((QKHZC-[2021]YB184, QKHZC-[2021] YB278, QKHZC-[2021]YB142, QKHZC-[2019]2382, and QKHZC-[2016]2580)), National Natural Science Foundation of China (31660010, 31870002, and 32260640), and Qiankehe talents project ([2018]5781 and [2017]5788-11).

Institutional Review Board Statement

Not applicable.

Informed Consent Statement

Not applicable.

Data Availability Statement

Data is contained in the main article and Supplementary Materials.

Conflicts of Interest

The authors declare no conflict of interest.

References

  1. Bressani, A.P.P.; Martinez, S.J.; Sarmento, A.B.I.; Borém, F.M.; Schwan, R.F. Organic acids produced during fermentation and sensory perception in specialty coffee using yeast starter culture. Food Res. Int. 2019, 128, 108773. [Google Scholar] [CrossRef] [PubMed]
  2. He, Z.; Chen, H.; Wang, X.; Lin, X.; Ji, C.; Li, S.; Liang, H. Effects of different temperatures on bacterial diversity and volatile flavor compounds during the fermentation of suancai, a traditional fermented vegetable food from northeastern China. LWT-Food Sci. Technol. 2020, 118, 108773. [Google Scholar] [CrossRef]
  3. Li, D.; Duan, F.; Tian, Q.; Zhong, D.; Wang, X.; Jia, L. Physiochemical, microbiological and flavor characteristics of traditional Chinese fermented food Kaili Red Sour Soup. LWT-Food Sci. Technol. 2021, 142, 110933. [Google Scholar] [CrossRef]
  4. Wang, C.; Zhang, Q.; He, L.; Li, C. Determination of the microbial communities of Guizhou Suantang, a traditional Chinese fermented sour soup, and correlation between the identified microorganisms and volatile compounds. Food Res. Int. 2020, 138, 109820. [Google Scholar] [CrossRef]
  5. Xiong, K.; Han, F.; Wang, Z.; Ming, D.; Chen, Y.; Tang, Y.; Wang, Z. Screening of dominant strains in red sour soup from Miao nationality and the optimization of inoculating fermentation conditions. Food Sci. Nutr. 2020, 9, 261–271. [Google Scholar] [CrossRef] [PubMed]
  6. Lin, L.J.; Du Fang, M.; Zeng, J.; Liang, Z.J.; Zhang, X.Y.; Gao, X.Y. Deep insights into fungal diversity in traditional Chinese sour soup by Illumina MiSeq sequencing. Food Res. Int. 2020, 137, 109439. [Google Scholar] [CrossRef]
  7. Evivie, S.E.; Huo, G.-C.; Igene, J.O.; Bian, X. Some current applications, limitations and future perspectives of lactic acid bacteria as probiotics. Food Nutr. Res. 2017, 61, 1318034. [Google Scholar] [CrossRef] [PubMed] [Green Version]
  8. Zhou, X.; Liu, Z.; Xie, L.; Li, L.; Zhou, W.; Zhao, L. The correlation mechanism between dominant bacteria and primary metabolites during fermentation of Red Sour Soup. Foods 2022, 11, 341. [Google Scholar] [CrossRef]
  9. García-Hernández, J.; Hernández-Pérez, M.; Peinado, I.; Andrés, A.; Heredia, A. Tomato-antioxidants enhance viability of L. reuteri under gastrointestinal conditions while the probiotic negatively affects bioaccessibility of lycopene and phenols. J. Funct. Foods 2018, 43, 1–7. [Google Scholar] [CrossRef]
  10. Story, E.N.; Kopec, R.E.; Schwartz, S.J.; Harris, G.K. An update on the health effects of tomato lycopene. Annu. Rev. Food Sci. Technol. 2010, 1, 189–210. [Google Scholar] [CrossRef]
  11. Azabou, S.; Abid, Y.; Sebii, H.; Felfoul, I.; Gargouri, A.; Attia, H. Potential of the solid-state fermentation of tomato by products by Fusarium solani pisi for enzymatic extraction of lycopene. LWT-Food Sci. Technol. 2016, 68, 280–287. [Google Scholar] [CrossRef]
  12. Jabbari, S.-S.; Jafari, S.M.; Dehnad, D.; Shahidi, S.-A. Changes in lycopene content and quality of tomato juice during thermal processing by a nanofluid heating medium. J. Food Eng. 2018, 230, 1–7. [Google Scholar] [CrossRef]
  13. Watts, E.G.; Janes, M.E.; Prinyawiwatkul, W.; Shen, Y.; Xu, Z.; Johnson, D. Microbiological changes and their impact on quality characteristics of red hot chilli pepper mash during natural fermentation. Int. J. Food Sci. Technol. 2018, 53, 1816–1823. [Google Scholar] [CrossRef]
  14. Kizhakkayil, J.; Sasikumar, B. Diversity, characterization and utilization of ginger: A review. Plant Genet. Resour. 2011, 9, 464–477. [Google Scholar] [CrossRef]
  15. Li, J.; Wang, X.; Wu, W.; Jiang, J.; Feng, D.; Shi, Y.; Hu, P. Comparison of fermentation behaviors and characteristics of tomato sour soup between natural fermentation and dominant bacteria-enhanced fermentation. Microorganisms 2022, 10, 640. [Google Scholar] [CrossRef] [PubMed]
  16. Yangbo, H.; Yongfu, L.; Xingbang, L.; Guolin, L.; Zhaoyan, D.; Chaojun, C. Effects of thermal and nonthermal processing technology on the quality of red sour soup after storage. Food Sci. Nutr. 2021, 9, 3863–3872. [Google Scholar] [CrossRef] [PubMed]
  17. Cong, S.; Li, Z.; Yu, L.; Liu, Y.; Hu, Y.; Bi, Y.; Cheng, M. Integrative proteomic and lipidomic analysis of Kaili Sour Soup-mediated attenuation of high-fat diet-induced nonalcoholic fatty liver disease in a rat model. Nutr. Metab. 2021, 18, 26. [Google Scholar] [CrossRef]
  18. Yang, H.; Xie, J.; Wang, N.; Zhou, Q.; Lu, Y.; Qu, Z.; Wang, H. Effects of Miao sour soup on hyperlipidemia in high-fat diet-induced obese rats via the AMPK signaling pathway. Food Sci. Nutr. 2021, 9, 4266–4277. [Google Scholar] [CrossRef]
  19. Lin, L.-J.; Zeng, J.; Tian, Q.-M.; Ding, X.-Q.; Zhang, X.-Y.; Gao, X.-Y. Effect of the bacterial community on the volatile flavour profile of a Chinese fermented condiment–Red sour soup–During fermentation. Food Res. Int. 2022, 155, 111059. [Google Scholar] [CrossRef]
  20. Song, X. Screening and Performance Evaluation of Cholesterol-Reducing Lactic Acid Bacteria Suitable for Meat Fermentation. Master’s Thesis, Guizhou Univesrsity, Guiyang, China, 2016. (In Chinese). [Google Scholar]
  21. Zhang, R. Screening and Evalutation of Cholesterol-Lowing Bifidobacteium from Guizhou Xiang Pig. Master’s Thesis, Guizhou Univesrsity, Guiyang, China, 2014. (In Chinese). [Google Scholar]
  22. Zhang, R.; He, L.; Zhang, L.; Li, C.; Zhu, Q. Screening of cholesterol-lowering Bifidobacterium from Guizhou Xiang Pigs, and evaluation of its tolerance to oxygen, acid, and bile. Korean J. Food Sci. Anim. Resour. 2016, 36, 37–43. [Google Scholar] [CrossRef]
  23. Choi, Y.-J.; Yong, S.; Lee, M.J.; Park, S.J.; Yun, Y.-R.; Lee, M.-A. Changes in volatile and non-volatile compounds of model kimchi through fermentation by lactic acid bacteria. LWT 2019, 105, 118–126. [Google Scholar] [CrossRef]
  24. Chang, C.-H.; Lin, H.-Y.; Chang, C.-Y.; Liu, Y.-C. Comparisons on the antioxidant properties of fresh, freeze-dried and hot-air-dried tomatoes. J. Food Eng. 2006, 77, 478–485. [Google Scholar] [CrossRef]
  25. Bamidele, O.P.; Fasogbon, M.B. Chemical and antioxidant properties of snake tomato (Trichosanthes cucumerina) juice and Pineapple (Ananas comosus) juice blends and their changes during storage. Food Chem. 2017, 220, 184–189. [Google Scholar] [CrossRef] [PubMed]
  26. Peinado, I.; Rosa, E.; Heredia, A.; Andrés, A. Use of isomaltulose to formulate healthy spreadable strawberry products. Application of response surface methodology. Food Biosci. 2015, 9, 47–59. [Google Scholar] [CrossRef] [Green Version]
  27. Tao, Y.; Sun, D.-W.; Górecki, A.; Błaszczak, W.; Lamparski, G.; Amarowicz, R.; Fornal, J.; Jeliński, T. A preliminary study about the influence of high hydrostatic pressure processing in parallel with oak chip maceration on the physicochemical and sensory properties of a young red wine. Food Chem. 2016, 194, 545–554. [Google Scholar] [CrossRef]
  28. Xu, Y.X.; Zhang, M.; Fang, Z.X.; Sun, J.C.; Wang, Y.Q. How to improve bayberry (Myrica rubra Sieb. et Zucc.) juice flavour quality: Effect of juice processing and storage on volatile compounds. Food Chem. 2014, 151, 40–46. [Google Scholar] [CrossRef]
  29. Zhou, X.; Chong, Y.; Ding, Y.; Gu, S.; Liu, L. Determination of the effects of different washing processes on aroma characteristics in silver carp mince by MMSE–GC–MS, e-nose and sensory evaluation. Food Chem. 2016, 207, 205–213. [Google Scholar] [CrossRef]
  30. Yoon, K.Y.; Woodams, E.E.; Hang, Y.D. Probiotication of tomato juice by lactic acid bacteria. J. Microbiol. 2004, 42, 315–318. [Google Scholar]
  31. Markovic, M.; Markov, S.; Pejin, D.; Mojovic, L.; Vukasinovic, M.; Pejin, J.; Joković, N. The possibility of lactic acid fermentation in the triticale stillage. Chem. Ind. Chem. Eng. Q. 2011, 17, 153–162. [Google Scholar] [CrossRef]
  32. Koh, J.-H.; Kim, Y.; Oh, J.-H. Chemical characterization of tomato juice fermented with Bifidobacteria. J. Food Sci. 2010, 75, C428–C432. [Google Scholar] [CrossRef]
  33. Ricci, A.; Cirlini, M.; Levante, A.; Dall’Asta, C.; Galaverna, G.; Lazzi, C. Volatile profile of elderberry juice: Effect of lactic acid fermentation using L. plantarum, L. rhamnosus and L. casei strains. Food Res. Int. 2018, 105, 412–422. [Google Scholar] [CrossRef] [PubMed]
  34. Di Cagno, R.; Surico, R.F.; Paradiso, A.; De Angelis, M.; Salmon, J.-C.; Buchin, S.; De Gara, L.; Gobbetti, M. Effect of autochthonous lactic acid bacteria starters on health-promoting and sensory properties of tomato juices. Int. J. Food Microbiol. 2009, 128, 473–483. [Google Scholar] [CrossRef] [PubMed]
  35. Jun, Z.; Shuaishuai, W.; Lihua, Z.; Qilong, M.; Xi, L.; Mengyang, N.; Tong, Z.; Hongli, Z. Culture-dependent and -independent analysis of bacterial community structure in Jiangshui, a traditional Chinese fermented vegetable food. LWT 2018, 96, 244–250. [Google Scholar] [CrossRef]
  36. Zhu, Y.; Sims, C.A.; Klee, H.J.; Sarnoski, P.J. Sensory and flavor characteristics of tomato juice from garden gem and Roma tomatoes with comparison to commercial tomato juice. J. Food Sci. 2017, 83, 153–161. [Google Scholar] [CrossRef] [PubMed]
  37. Tian, H.; Shen, Y.; Yu, H.; He, Y.; Chen, C. Effects of 4 Probiotic strains in coculture with traditional starters on the flavor profile of yogurt. J. Food Sci. 2017, 82, 1693–1701. [Google Scholar] [CrossRef]
  38. Mousavi, Z.E.; Mousavi, M. The effect of fermentation by Lactobacillus plantarum on the physicochemical and functional properties of liquorice root extract. LWT-Food Sci. Technol. 2019, 105, 164–168. [Google Scholar] [CrossRef]
  39. García-Alonso, F.J.; González-Barrio, R.; Martín-Pozuelo, G.; Hidalgo, N.; Navarro-González, I.; Masuero, D.; Soini, E.; Vrhovsek, U.; Periago, M.J. A study of the prebiotic-like effects of tomato juice consumption in rats with diet-induced non-alcoholic fatty liver disease (NAFLD). Food Funct. 2017, 8, 3542–3552. [Google Scholar] [CrossRef]
  40. Singhvi, M.; Zendo, T.; Sonomoto, K. Free lactic acid production under acidic conditions by lactic acid bacteria strains: Challenges and future prospects. Appl. Microbiol. Biotechnol. 2018, 102, 5911–5924. [Google Scholar] [CrossRef]
  41. Ye, J.-H.; Huang, L.-Y.; Terefe, N.S.; Augustin, M.A. Fermentation-based biotransformation of glucosinolates, phenolics and sugars in retorted broccoli puree by lactic acid bacteria. Food Chem. 2019, 286, 616–623. [Google Scholar] [CrossRef]
  42. Antognoni, F.; Mandrioli, R.; Potente, G.; Saa, D.L.T.; Gianotti, A. Changes in carotenoids, phenolic acids and antioxidant capacity in bread wheat doughs fermented with different lactic acid bacteria strains. Food Chem. 2019, 292, 211–216. [Google Scholar] [CrossRef]
  43. Managa, M.G.; Akinola, S.A.; Remize, F.; Garcia, C.; Sivakumar, D. Physicochemical parameters and bioaccessibility of lactic acid bacteria fermented chayote leaf (Sechium edule) and pineapple (Ananas comosus) smoothies. Front. Nutr. 2021, 8, 649189. [Google Scholar] [CrossRef] [PubMed]
  44. Hornero-Méndez, D.; Cerrillo, I.; Ortega, Á.; Rodríguez-Griñolo, M.-R.; Escudero-López, B.; Martín, F.; Fernández-Pachón, M.-S. β-Cryptoxanthin is more bioavailable in humans from fermented orange juice than from orange juice. Food Chem. 2018, 262, 215–220. [Google Scholar] [CrossRef] [PubMed] [Green Version]
  45. Dagostin, J.L.A.; Carpiné, D.; Masson, M.L. Influence of acidification method on composition, texture, psychrotrophs, and lactic acid bacteria in Minas frescal cheese. Food Bioprocess Technol. 2012, 6, 3017–3028. [Google Scholar] [CrossRef]
  46. Markkinen, N.; Laaksonen, O.; Nahku, R.; Kuldjärv, R.; Yang, B. Impact of lactic acid fermentation on acids, sugars, and phenolic compounds in black chokeberry and sea buckthorn juices. Food Chem. 2019, 286, 204–215. [Google Scholar] [CrossRef] [PubMed]
  47. Mazidi, M.; Ferns, G.A.; Banach, M. A high consumption of tomato and lycopene is associated with a lower risk of cancer mortality: Results from a multiethnic cohort. Public Health Nutr. 2020, 23, 1569–1575. [Google Scholar] [CrossRef]
  48. Lu, Y.; Mu, K.; McClements, D.J.; Liang, X.; Liu, X.; Liu, F. Fermentation of tomato juice improves in vitro bioaccessibility of lycopene. J. Funct. Foods 2020, 71, 104020. [Google Scholar] [CrossRef]
  49. Zhang, X.; Zhang, S.; Xie, B.; Sun, Z. Influence of lactic acid bacteria fermentation on physicochemical properties and antioxidant activity of chickpea yam milk. J. Food Qual. 2021, 2021, 5523356. [Google Scholar] [CrossRef]
  50. Chu, J.; Zhao, H.; Lu, Z.; Lu, F.; Bie, X.; Zhang, C. Improved physicochemical and functional properties of dietary fiber from millet bran fermented by Bacillus natto. Food Chem. 2019, 294, 79–86. [Google Scholar] [CrossRef]
  51. Verotta, L.; Panzella, L.; Antenucci, S.; Calvenzani, V.; Tomay, F.; Petroni, K.; Caneva, E.; Napolitano, A. Fermented pomegranate wastes as sustainable source of ellagic acid: Antioxidant properties, anti-inflammatory action, and controlled release under simulated digestion conditions. Food Chem. 2018, 246, 129–136. [Google Scholar] [CrossRef]
  52. Oh, B.-T.; Jeong, S.-Y.; Velmurugan, P.; Park, J.-H.; Jeong, D.-Y. Probiotic-mediated blueberry (Vaccinium corymbosum L.) fruit fermentation to yield functionalized products for augmented antibacterial and antioxidant activity. J. Biosci. Bioeng. 2017, 124, 542–550. [Google Scholar] [CrossRef]
  53. Khubber, S.; Marti-Quijal, F.J.; Tomasevic, I.; Remize, F.; Barba, F.J. Lactic acid fermentation as a useful strategy to recover antimicrobial and antioxidant compounds from food and by-products. Curr. Opin. Food Sci. 2021, 43, 189–198. [Google Scholar] [CrossRef]
  54. Angelin, J.; Kavitha, M. Exopolysaccharides from probiotic bacteria and their health potential. Int. J. Biol. Macromol. 2020, 162, 853–865. [Google Scholar] [CrossRef] [PubMed]
  55. Jurášková, D.; Ribeiro, S.C.; Silva, C.C.G. Exopolysaccharides produced by lactic acid bacteria: From biosynthesis to health-promoting properties. Foods 2022, 11, 156. [Google Scholar] [CrossRef] [PubMed]
  56. Bautista-Gallego, J.; Medina, E.; Sánchez, B.; Benítez-Cabello, A.; Arroyo-López, F.N. Role of lactic acid bacteria in fermented vegetables. Grasas Y Aceites 2020, 71, 358. [Google Scholar] [CrossRef]
  57. Tatol, W.M.M. Color difference delta E—A surve. Mach. Graph. Vis. 2011, 20, 383–411. [Google Scholar]
  58. Tiwari, B.K.; Muthukumarappan, K.; O’Donnell, C.; Chenchaiah, M.; Cullen, P. Effect of ozonation on the rheological and colour characteristics of hydrocolloid dispersions. Food Res. Int. 2008, 41, 1035–1043. [Google Scholar] [CrossRef]
  59. Costa, M.G.M.; Fonteles, T.V.; de Jesus, A.L.T.; Rodrigues, S. Sonicated pineapple juice as substrate for L. casei cultivation for probiotic beverage development: Process optimisation and product stability. Food Chem. 2013, 139, 261–266. [Google Scholar] [CrossRef] [Green Version]
  60. Wang, H.; Yin, L.-J.; Cheng, Y.-Q.; Li, L.-T. Effect of sodium chloride on the color, texture, and sensory attributes of douchi during post-fermentation. Int. J. Food Eng. 2012, 8. [Google Scholar] [CrossRef]
  61. Chen, C.; Lu, Y.; Yu, H.; Chen, Z.; Tian, H. Influence of 4 lactic acid bacteria on the flavor profile of fermented apple juice. Food Biosci. 2018, 27, 30–36. [Google Scholar] [CrossRef]
  62. Huang, Z.-R.; Guo, W.-L.; Zhou, W.-B.; Li, L.; Xu, J.-X.; Hong, J.-L.; Liu, H.-P.; Zeng, F.; Bai, W.-D.; Liu, B.; et al. Microbial communities and volatile metabolites in different traditional fermentation starters used for Hong Qu glutinous rice wine. Food Res. Int. 2018, 121, 593–603. [Google Scholar] [CrossRef]
  63. Wang, J.; Wang, R.; Xiao, Q.; Liu, C.; Deng, F.; Zhou, H. SPME/GC-MS characterization of volatile compounds of Chinese traditional-chopped pepper during fermentation. Int. J. Food Prop. 2019, 22, 1863–1872. [Google Scholar] [CrossRef] [Green Version]
  64. Mokoena, M.P.; Mutanda, T.; Olaniran, A.O. Perspectives on the probiotic potential of lactic acid bacteria from African traditional fermented foods and beverages. Food Nutr. Res. 2016, 60, 29630. [Google Scholar] [CrossRef] [PubMed]
  65. Wang, X.-C.; Li, A.-H.; Dizy, M.; Ullah, N.; Sun, W.-X.; Tao, Y.-S. Evaluation of aroma enhancement for “Ecolly” dry white wines by mixed inoculation of selected Rhodotorula mucilaginosa and Saccharomyces cerevisiae. Food Chem. 2017, 228, 550–559. [Google Scholar] [CrossRef]
  66. Sun, X.; Du, J.; Xiong, Y.; Cao, Q.; Wang, Z.; Li, H.; Zhang, F.; Chen, Y.; Liu, Y. Characterization of the key aroma compounds in Chinese JingJiu by quantitative measurements, aroma recombination, and omission experiment. Food Chem. 2021, 352, 129450. [Google Scholar] [CrossRef] [PubMed]
  67. Liu, Y.; Li, Q.; Yang, W.; Sun, B.; Zhou, Y.; Zheng, Y.; Huang, M.; Yang, W. Characterization of the potent odorants in Zanthoxylum armatum DC Prodr. pericarp oil by application of gas chromatography–mass spectrometry–olfactometry and odor activity value. Food Chem. 2020, 319, 126564. [Google Scholar] [CrossRef]
  68. Hou, Z.-W.; Wang, Y.-J.; Xu, S.-S.; Wei, Y.-M.; Bao, G.-H.; Dai, Q.-Y.; Deng, W.-W.; Ning, J.-M. Effects of dynamic and static withering technology on volatile and nonvolatile components of Keemun black tea using GC-MS and HPLC combined with chemometrics. LWT 2020, 130, 109547. [Google Scholar] [CrossRef]
  69. Zhao, L.; Ruan, S.; Yang, X.; Chen, Q.; Shi, K.; Lu, K.; He, L.; Liu, S.; Song, Y. Characterization of volatile aroma compounds in litchi (Heiye) wine and distilled spirit. Food Sci. Nutr. 2021, 9, 5914–5927. [Google Scholar] [CrossRef]
  70. Yang, C.; Luo, L.; Zhang, H.; Yang, X.; Lv, Y.; Song, H. Common aroma-active components of propolis from 23 regions of China. J. Sci. Food Agric. 2010, 90, 1268–1282. [Google Scholar] [CrossRef]
  71. Welke, J.E.; Zanus, M.; Lazzarotto, M.; Zini, C.A. Quantitative analysis of headspace volatile compounds using comprehensive two-dimensional gas chromatography and their contribution to the aroma of Chardonnay wine. Food Res. Int. 2014, 59, 85–99. [Google Scholar] [CrossRef] [Green Version]
  72. Liu, Y.; Chen, H.; Chen, W.; Zhong, Q.; Zhang, G.; Chen, W. Beneficial effects of tomato juice fermented by Lactobacillus plantarum and Lactobacillus casei: Antioxidation, antimicrobial effect, and volatile profiles. Molecules 2018, 23, 2366. [Google Scholar] [CrossRef] [Green Version]
  73. Li, Z.; Dong, L.; Zhao, C.; Zhu, Y. Metagenomic insights into the changes in microbial community and antimicrobial resistance genes associated with different salt content of red pepper (Capsicum annuum L.) sauce. Food Microbiol. 2020, 85, 103295. [Google Scholar] [CrossRef] [PubMed]
  74. Zhang, L.; Che, Z.; Xu, W.; Yue, P.; Li, R.; Li, Y.; Pei, X.; Zeng, P. Dynamics of physicochemical factors and microbial communities during ripening fermentation of Pixian Doubanjiang, a typical condiment in Chinese cuisine. Food Microbiol. 2019, 86, 103342. [Google Scholar] [CrossRef] [PubMed]
  75. Di Cagno, R.; Coda, R.; De Angelis, M.; Gobbetti, M. Exploitation of vegetables and fruits through lactic acid fermentation. Food Microbiol. 2013, 33, 1–10. [Google Scholar] [CrossRef] [PubMed]
Figure 1. The changes of pH, total titration acid, and viable count during the preparation of HST: (a) CON (HST prepared by natural fermentation of pasteurized HST materials); (b) HBZ11; (c) HBZ25; (d) HBB12; (e) HBL1; (f) HMT-4; (g) HSQ-4; (h) HBGS. CON indicated HST prepared by natural fermentation of pasteurized HST materials. HBZ11, HBZ25, HSQ-4, HMT-4, HBGS, HBL1, and HBB12 were HST prepared with starter cultures Bifidobacterium animalis subsp. lactis BZ11, Bifidobacterium animalis subsp. lactis BZ25, Lactiplantibacillus plantarum SQ-4, Lactiplantibacillus pentosus MT-4, Lactobacillus bulgaricus, Bifidobacterium longum BL1, and Bifidobacterium animalis subsp. lactis BB12, respectively.
Fermentation 08 00589 g001
Figure 2. Heat map visualization and clustering results of the volatile compounds in HST (a) and biplot of principal component analysis from aroma compounds (OAV > 0.1) (b).
Fermentation 08 00589 g002
Figure 3. The sensory evaluation of the HST. (a) appearance; (b) texture; (c) flavor; (d) taste; (e) overall acceptability. CON indicated HST prepared by natural fermentation of pasteurized HST materials. HBZ11, HBZ25, HSQ-4, HMT-4, HBGS, HBL1, and HBB12 were HST prepared with starter cultures Bifidobacterium animalis subsp. lactis BZ11, Bifidobacterium animalis subsp. lactis BZ25, Lactiplantibacillus plantarum SQ-4, Lactiplantibacillus pentosus MT-4, Lactobacillus bulgaricus, Bifidobacterium longum BL1, and Bifidobacterium animalis subsp. lactis BB12, respectively.
Fermentation 08 00589 g003
Table 1. Effects of starter on organic acids, total phenols, total carotenoids, lycopene, and antioxidant activity in HST.
SampleOxalic Acid (mg/100 mL)Ascorbic Acid (mg/100 mL)Lactic Acid (mg/100 mL)Citric Acid (mg/100 mL)Succinic Acid (mg/100 mL)Total Phenols (mg/mL)Total Carotenoids (mg/mL)Lycopene (µg/mL)ABTS%DPPH%
UNF24.11 ± 0.47 cNDND26.54 ± 0.73 b59.95 ± 0.34 g6.61 ± 0.11 c0.91 ± 0.01 h18.31 ± 1.01 c18.83 ± 0.71 f5.11 ± 0.57 c
CON11.43 ± 1.01 e6.99 ± 0.08 b317.26 ± 8.5 bND104.69 ± 3.54 b12.89 ± 0.03 a1.17 ± 0.09 g14.70 ± 0.48 e73.94 ± 0.51 e62.88 ± 1.74 b
HBZ1127.07 ± 1.3 b6.90 ± 0.33 b260.74 ± 3.53 d21.37 ± 1.26 c77.90 ± 1.41 f12.87 ± 0.04 a3.52 ± 0.05 a22.19 ± 0.73 b81.55 ± 1.23 cd67.23 ± 2.37 a
HBZ2531.84 ± 0.54 a5.25 ± 0.16 c234.72 ± 6.31 e26.27 ± 1.88 b90.53 ± 0.34 d12.91 ± 0.03 a3.15 ± 0.03 c24.39 ± 0.46 a84.27 ± 0.94 ab69.13 ± 1.74 a
HBB1230.60 ± 0.79 a7.60 ± 0.29 a143.46 ± 3.59 f31.98 ± 0.91 a75.72 ± 0.71 f12.89 ± 0.03 a2.98 ± 0.02 d14.59 ± 0.86 e80.38 ± 1.55 d68.75 ± 1.5 a
HBL131.50 ± 0.62 a5.42 ± 0.07 c235.24 ± 4.74 e25.65 ± 0.67 b87.01 ± 1.00 e12.92 ± 0.05 a2.08 ± 0.04 f16.49 ± 0.33 d81.92 ± 1.87 bcd69.89 ± 1.14 a
HMT-431.54 ± 0.20 aND380.95 ± 2.15 a21.39 ± 0.88 c107.45 ± 1.32 a12.89 ± 0.10 a3.42 ± 0.05 b14.73 ± 0.10 e83.80 ± 0.88 abc69.70 ± 1.83 a
HSQ-421.45 ± 0.25 dND269.76 ± 0.93 c22.20 ± 1.23 c86.37 ± 1.67 e12.90 ± 0.04 a2.83 ± 0.04 e23.41 ± 0.15 ab86.15 ± 0.29 a70.27 ± 1.83 a
HBGS26.86 ± 0.43 b5.48 ± 0.12 c324.07 ± 8.13 bND97.90 ± 1.29 c8.74 ± 0.04 b3.49 ± 0.02 ab22.60 ± 1.43 b83.90 ± 2.19 abc69.32 ± 1.97 a
ND: not detectable. The data expressed as mean ± standard deviation (SD) of the measured values (n = 3). Mean values with different superscripts in the same row are significantly different (p < 0.05), the same below. UNF indicated pasteurized HST materials without fermentation. CON indicated HST prepared by natural fermentation of pasteurized HST materials. HBZ11, HBZ25, HSQ-4, HMT-4, HBGS, HBL1, and HBB12 were HST prepared with starter cultures Bifidobacterium animalis subsp. lactis BZ11, Bifidobacterium animalis subsp. lactis BZ25, Lactiplantibacillus plantarum SQ-4, Lactiplantibacillus pentosus MT-4, Lactobacillus bulgaricus, Bifidobacterium longum BL1, and Bifidobacterium animalis subsp. lactis BB12, respectively. The same abbreviation indicates the same meaning as below in Table 2 and Table 3.
Table 2. Effects of fermentation on the changes of HST color.
0 Day1 Day3 Days5 Days7 Days9 Days12 Days15 Days
CONL*23.80 ± 0.70 b25.72 ± 0.80 a26.49 ± 0.36 a25.74 ± 0.22 a26.84 ± 0.85 a25.68 ± 0.63 a26.16 ± 0.53 a26.52 ± 0.50 a
a*11.53 ± 0.61 e14.61 ± 0.70 bcd15.22 ± 0.44 abc14.02 ± 0.46 cd14.22 ± 0.77 bcd15.42 ± 0.44 ab16.02 ± 0.82 a13.40 ± 0.87 d
b*7.67 ± 0.40 bc4.60 ± 0.35 d7.49 ± 0.57 bc7.09 ± 0.74 c8.37 ± 0.22 ab7.93 ± 0.69 abc8.75 ± 0.57 a8.04 ± 0.76 abc
ΔE*04.75 ± 0.45 a4.75 ± 0.59 a4.75 ± 0.59 a4.20 ± 0.99 b4.36 ± 0.74 b5.24 ± 0.74 a3.48 ± 0.41 b
HBZ11L*23.80 ± 0.70 c26.93 ± 0.55 b27.19 ± 0.39 b27.42 ± 0.52 b29.36 ± 0.84 a29.68 ± 0.73 a29.92 ± 0.93 a29.77 ± 0.91 a
a*11.53 ± 0.61 d13.67 ± 0.44 c13.85 ± 0.28 c14.86 ± 0.42b16.26 ± 0.76 a15.72 ± 0.69 ab16.35 ± 0.10 a13.70 ± 0.61 c
b*7.67 ± 0.40 cd6.20 ± 0.61 e7.03 ± 0.39 de9.29 ± 0.88 ab9.49 ± 0.89 ab8.84 ± 0.22 bc10.20 ± 0.62 a8.82 ± 0.96 bc
ΔE*04.18 ± 0.42 c4.22 ± 0.29 c5.33 ± 0.84 bc7.54 ± 1.22 a7.37 ± 1.10 a8.23 ± 0.95 a6.51 ± 1.74 ab
HBZ25L*23.80 ± 0.70 d28.26 ± 0.05 b27.47 ± 0.32 bc27.29 ± 0.56 bc27.18 ± 0.35 c26.59 ± 0.20 c29.86 ± 0.78 b30.07 ± 0.99 a
a*11.53 ± 0.61 c14.96 ± 0.60 b14.66 ± 0.47 b15.37 ± 0.62 b15.52 ± 0.66 b14.96 ± 0.49 b18.92 ± 0.28 a15.58 ± 0.92 b
b*7.67 ± 0.40 bcd7.39 ± 0.51 cd7.52 ± 0.59 cd8.34 ± 0.61 bc8.70 ± 0.86 b6.88 ± 0.35 d11.39 ± 0.52 a12.39 ± 0.77 a
ΔE*05.72 ± 0.10 c4.91 ± 0.24 cd5.28 ± 0.16 cd5.54 ± 0.52 c4.55 ± 0.75 d10.28 ± 0.74 a8.40 ± 0.63 b
HBB12L*23.80 ± 0.70 d26.80 ± 0.19 c27.38 ± 0.33 bc28.01 ± 0.84 b27.52 ± 0.69 bc27.90 ± 0.29 b29.26 ± 0.56 a28.23 ± 0.52 b
a*11.53 ± 0.61 e16.83 ± 0.27 a15.69 ± 0.54 b14.63 ± 0.67 c15.82 ± 0.37 b14.64 ± 0.71 c14.41 ± 0.41 cd13.60 ± 0.59 d
b*7.67 ± 0.40 cd9.23 ± 0.55 ab6.91 ± 0.90 d7.80 ± 0.93 cd9.99 ± 0.56 a8.02 ± 0.10 bcd8.22 ± 0.79 bc8.74 ± 0.54 bc
ΔE*06.32 ± 0.28 a5.71 ± 0.14 a5.46 ± 0.56 a6.19 ± 0.81 a5.18 ± 0.81 a6.28 ± 0.87 a5.13 ± 0.63 a
HBL1L*23.80 ± 0.70 e26.57 ± 0.81 cd27.11 ± 0.66 cd27.86 ± 0.70 bc27.41 ± 0.17 bcd26.28 ± 0.96 d30.19 ± 0.63 a28.51 ± 0.78 b
a*11.53 ± 0.61 e17.01 ± 0.42 b16.24 ± 0.66 bc14.52 ± 0.80 d14.53 ± 0.75 d15.42 ± 0.44 cd18.17 ± 0.68 a15.53 ± 0.82 cd
b*7.67 ± 0.40 c8.98 ± 0.51 ab8.80 ± 0.23 abc8.16 ± 0.77 bc8.62 ± 0.57 abc8.20 ± 0.78 bc9.41 ± 0.78 a9.51 ± 0.60 a
ΔE*06.38 ± 0.90 b6.01 ± 0.14 b5.15 ± 0.47 c4.84 ± 0.47 c4.68 ± 0.46 c9.50 ± 0.36 a6.50 ± 0.18 b
HMT-4L*23.80 ± 0.70 f29.32 ± 0.30 bc26.67 ± 0.21 cd27.53 ± 0.21 de28.11 ± 0.64 d26.94 ± 0.56 e30.61 ± 0.80 a30.08 ± 0.72 ab
a*11.53 ± 0.61 e14.72 ± 0.61 c15.33 ± 0.26 c14.24 ± 0.89 cd15.06 ± 0.66 c13.38 ± 0.37 d17.78 ± 0.62 a16.54 ± 0.25 b
b*7.67 ± 0.40 de9.02 ± 0.44 b7.43 ± 0.83 bcd7.93 ± 0.50 cde8.51 ± 0.54 bcd6.94 ± 0.35 e8.92 ± 0.92 bc13.33 ± 0.64 a
ΔE*06.60 ± 0.42 b5.74 ± 0.72 bc4.72 ± 0.98 cd5.69 ± 0.86 bc3.88 ± 0.84 d9.46 ± 0.52 a9.86 ± 0.37 a
HSQ-4L*23.80 ± 0.70 e27.88 ± 0.33 c28.39 ± 0.85 d28.01 ± 0.18 c30.83 ± 0.64 a30.18 ± 0.25 ab30.73 ± 0.60 a29.69 ± 0.99 b
a*11.53 ± 0.61 d15.50 ± 0.44 b14.87 ± 0.17 b14.01 ± 0.54 c14.97 ± 0.70 bc17.28 ± 1.02 a17.16 ± 0.58 a14.04 ± 0.43 c
b*7.67 ± 0.40 de8.32 ± 0.75 cd8.17 ± 0.32 d7.01 ± 0.94 d12.73 ± 0.77 a9.54 ± 0.94 bc10.34 ± 0.89 b9.88 ± 0.79 b
ΔE*05.77 ± 0.10 bc4.88 ± 0.20 c5.09 ± 0.63 c9.36 ± 1.35 a8.87 ± 1.13 a9.36 ± 0.72 a6.87 ± 1.05 b
HBGSL*23.80 ± 0.70 d23.49 ± 0.18 d27.14 ± 0.23 bc28.04 ± 0.39 b27.10 ± 0.69 bc26.6 ± 0.43 c29.11 ± 0.80 a27.63 ± 0.95 bc
a*11.53 ± 0.61 c14.36 ± 0.51 ab14.93 ± 0.79 ab13.87 ± 0.15 b14.03 ± 0.59 b14.63 ± 0.89 ab15.47 ± 0.06 a14.00 ± 0.92 b
b*7.67 ± 0.40 b5.78 ± 0.34 c5.51 ± 0.64 c7.41 ± 0.41 b9.07 ± 0.64 a8.90 ± 0.61 a8.49 ± 0.74 ab9.47 ± 0.89 a
ΔE*03.47 ± 0.33 c5.36 ± 0.34 b4.88 ± 0.13 b4.61 ± 0.51 bc4.40 ± 0.86 bc6.74 ± 0.57 a4.95 ± 1.20 b
Publisher’s Note: MDPI stays neutral with regard to jurisdictional claims in published maps and institutional affiliations.

