Abstract
Obesity causes metabolic syndrome disorders that are detrimental to health. The current study examined the effects of intermittent fasting (IF), fermented camel milk (FCM), and fermented camel milk incorporating 10% Sukkari date (FCM-D) on weight loss, blood profile, and antioxidant status in obese rats for 6 weeks. Subsequently, leptin and adiponectin levels and histopathological examination of adipose tissue were carried out. Results showed that IF with FCM or FCM-D decreased body weight by 0.92 and −5.45%, respectively. IF alone lowered non-fasting blood glucose (NFBG) and fasting blood glucose FBG after 6 weeks, whereas adding FCM or FCM-D reduced NFBG after 4 weeks. Intermittently fasting obese rats given FCM or FCM-D had the lowest blood glucose levels (BGL). The hypolipidemic effects of IF, FCM, and FCM-D on obese rats reduced triglycerides (TG), cholesterols (CHO), and their derivatives. FCM-D with IF presented a superior effect on lipid profile. A reduction rate of 40, 37, 66, and 40% for TG, CHO, low-density lipoprotein (LDL-c), and very low-density lipoprotein (VLDL-c), respectively, and an increase in HDL-C by 34% were noticed. Reductions of 40, 37, 66, and 40% for TG, CHO, LDL-c, and VLDL-c, respectively, and a 34% rise in high-density lipoprotein (HDL-C) were noted. Combining IF with FCM or FCM-D lowered the atherogenic index (AI) by 42% and 59%, respectively. Remarkably, treating rats with FCM+IF or FCM-D+IF effectively attenuated leptin and adiponectin levels. Malondialdehyde (MDA) was significantly decreased in a type-dependent manner. Implementing FCM-D or FCM with IF significantly attenuated reduced glutathione (GSH), superoxide dismutase (SOD), MDA, and catalase (CAT) levels. The most efficient treatment was giving FCM-D with IF. Histopathologically, adipocyte lipolysis increases free fatty acids (FFAs) and promotes inflammation. Only IF+FCM-D indicated no histopathological alteration except for a few focal areas of a few inflammatory cell infiltrations in the parenchyma. In conclusion, combining IF and Probiotic-FCM or Probiotic-FCM-D effectively accelerated weight loss, attenuated metabolic markers, and reversed histopathological alterations. Thus, IF combined with Probiotic-FCM or Probiotic-FCM-D is highly recommended for weight loss, strengthening antioxidative status, and preventing health disorders.
1. Introduction
Obesity and overweight among adults and children worldwide are growing public health concerns. This is related to numerous risk factors such as diabetes mellitus, hypertension, hyperlipidemia, and other metabolic syndrome diseases [1,2]. Weight loss in obese people has been shown to positively impact overall health and quality of life [3]. Interestingly, the association of camel milk (CM) with health benefits may be partly underlined by its function as food for the gut microbiota (prebiotic) [4,5]. CM can improve microbial community diversity in obese human subjects [6]. It has been scientifically proven that CM has antiviral, antibacterial, antitumor, antifungal, antioxidant, hypoglycemic, anticancer, antiaging, and anti-autoimmune properties [7,8]. CM also impacts many biological processes, including metabolic reactions to nutrition absorption, digestion, the maturation of various body parts, and the body’s ability to ward against damage [9]. The protective proteins in CM play a crucial role in improving the body’s immunological defense mechanisms, including antibacterial and antiviral activities [10]. Some of the defensive proteins found in CM include lactoferrin (Lf), immunoglobulin (Ig) IgGs, lactoperoxidase, lysozyme, peptidoglycan recognition protein-1 (PGRP-1), and other enzymes; these proteins are linked to CM’s antibacterial function [10,11,12].
Recently, a rat model found that CM consumption results in microbial community alteration and weight loss better than cow and goat milk [13]. Furthermore, the research has also confirmed multiple beneficial health impacts of fermented dairy foodstuffs such as yogurt and cheese, including regulation of food intake, satiety, and obesity-related metabolic disorders [13,14,15]. Senok [16] indicated that a rich selection of probiotic drinks, both dairy and non-dairy, is accessible in Persian Gulf countries; in particular, dairy probiotic-fermented milk beverages are consumed daily with rich meat and rice diets. In addition, the date fruit is an important foodstuff in the dietary system in Gulf countries, usually consumed with unsweetened Arabic coffee. However, fermented dairy products such as FCM have not been examined in detail. Thus, studying the effect of probiotic-fermented CM incorporating Sukkari dates combined with intermittent fasting on diet-induced obesity in animal model is highly motivated.
Pioneering research that compared the healthy microbiota of lean and obese subjects was conducted by Ley et al. in 2006 [17] using 16SrRNA sequencing. Sequencing of extracted DNA from fecal samples demonstrated that obese subjects present a greater level of Firmicutes and a smaller level of Bacteroidetes than lean individuals [17], which validated previous murine studies [18]. Subsequent investigations revealed that the gut microbiota composition of obese subjects is less diverse than in lean subjects [19]. However, different results have been also reported [20,21], and the significance of Firmicutes and Bacteroidetes abundance remains disputed. A meta-analysis report recently found that the microbial changes associated with obesity are not based on variations in the species but rather are the result of various minor differences within the bacterial population [22]. Therefore, it is important to consider the overall composition of the gut microbiota rather than the ratio of Bacteroidetes to Firmicutes alone.
Importantly, not only different bacteria but also the metabolites they produce (postbiotics) can play a role in obesity and metabolic syndrome. For example, patients with type 2 diabetes have reduced levels of SCFA-producing bacteria [23], and some SCFAs (e.g., butyrate) facilitate improved insulin sensitivity, muscle fatty acid oxidation, and increased satiety. [24]. Because obesity has been linked to less diverse gut microbiota composition than in lean subjects, it may be important to increase its diversity, and nutritional approaches to do so (via IF combined fasting with FCM consumption) can promote weight loss. FCM by Lactococcus lactis subsp. cremoris increased SOD, CAT, and GPx activity, oxidative stress, and decreased cardiac damage induced by acute exposure of mouse heart tissues to CCl4 [25]. Because of its high antioxidant chemical content, fermented CM was found to have a protective impact on heart tissue. These compounds include oligosaccharides, vitamins, bioactive peptides, and conjugated linoleic acid [26]. Also, fermented CM has large amounts of magnesium, which plays an important role in GSH biosynthesis [27], thus lowering oxidative stress. Moreover, vitamin C scavenges free radicals, preventing cell damage [28].
Intermittent fasting refers to fasting during the day. No energy restriction is required; however, bodyweight variations can occur as food consumption decreases [29]. The significant weight loss that occurs during fasting [30,31] is notable, because total daily energy consumption does not seem to be significantly different. Importantly, approaches that rely mostly on fasting have been generally successful for weight loss but not in sustaining the lost weight [32]. However, the impact of CM and fermented CM (FCM) consumption on the biodiversity of gut microbiota and its association with increased production of short-chain fatty acids (SCFAs) has not been studied.
Gut microbiota may be contributing to the obesity epidemic: recent studies have shown that obesity is accompanied by altered gut microbiota [33,34]. While establishing a causal relationship between diet, gut microbiota, and obesity has been challenging, evidence indicates that the Western diet, rich in refined carbohydrates and fat, can induce changes in gut microbiota that promote obesity (particularly, by decreasing microbiota diversity) [35]. Dietary patterns have changed worldwide to converge on Western-type diets [36]. On the other hand, fasting and consuming foods rich in protein and/or fiber have been associated with increasing gut microbiota diversity and health benefits [37,38,39].
Comprehensive approaches that combine fasting and consumption of FCM or FCM-D by obese subjects can reduce body weight and fat mass by increasing gut microbiota diversity, which is accompanied by the increased microbial production of SCFAs in the gut. Therefore, the current study was developed to test our central hypothesis with two approaches. The first was to study the efficacy of IF and FCM or FCM-D consumption on weight loss, blood profile, and antioxidant status in a 6-week experimental rat module. The second was to study the effects of IF and FCM or FCM-D consumption on leptin and adiponectin levels and subsequent alterations in adipose tissue.
2. Materials and Methods
2.1. Camel Milk and Other Ingredients
In February and March of 2021, we purchased fresh CM from the Qassim University College of Agriculture and Veterinary Medicine Farm. The Sukkari variety of the date palm (Phoenix dactylifera L.) was obtained from a nearby market in the Qassim district for the upcoming 2020 harvest. The antioxidant activity and chemical and physicochemical properties of CM and SD were analyzed and are presented in Table S1. Chr. Hansen, Copenhagen, Denmark supplied their ABT-5 starter with Streptococcus thermophiles, Lactobacillus acidophilus, and Bifidobacterium bifidum in freeze-dried direct-to-vat set form (DVS), stored at −20 °C.
2.2. Preparation of Probiotic-Enriched FCM and FCM-SD
Sukkari dates were washed under running water to remove dust and microscopic contaminants, kernels were manually removed, and then the date’s flesh was transferred into date paste using a scraw grinder (Panasonic, MK-ZG1500, Kadoma, Japan). Before being processed further, fresh CM was blended with 5, 7.5, 10, 12.5, or 15% SD pasta (v:w) in a benchtop food processor (Santos, VITA-MAX CORP-Light Industrial Food Preparing Machine Model, VM0122E, Orlando, FL, USA) at high speed (speed 6). We pasteurized CM at 85 °C for 15 min, then cooled it to the inoculation temperature (42 °C). This was done with both unfortified CM and CM fortified with 10% SD (v:w). Under the aseptic addition, the Chr. Hansen ABT-5 DVS starter was introduced at a rate of 0.1 g per 100 mL (g/v) of CM. After a 4 h incubation at 42 °C, samples were cooled for another 12–18 h to attain a final pH of 4.6–4.7 [40]. The chemical, physicochemical, and antioxidant properties, as well as probiotics count, were determined in our previous research [41] and are presented here in Tables S2–S5.
2.3. Animals and Experimental Design
Wistar rats (48 rats) weighing 125–140 g were used in the present investigation. All experiments will be approved by the Institutional Animal Ethics Committee (IAEC) of Qassim University, KSA (21-07-13 on 26 January 2022). Animals were housed in air-conditionally polypropylene cages under standard laboratory conditions at 25 ± 1 °C for a week for acclimatization. Rats were fed a high-fat diet formulated according to Kong et al. [42] with a modification, as we used camel hump fat instead of used lard) and water ad libitum. After 45 d of feeding, the rats’ boxes were divided into 6 groups (n = 8/group). Group 1: obese rats did not receive treatment, only 10 mL kg−1 body weight (bw) intragastric normal saline (Obese Rats group, OR). Group 2: obese rats were treated with fasting for 16 h daily and left to have free access to diet and water for 8 h (Fasting group, OR+IF). Group 3: obese rats received intragastric FCM at 10 mL kg−1 bw (FCM group, OR+FCM). Group 4: obese rats treated with fasting for 16 h and received intragastric FCM at 10 mL kg−1 bw (Fasting and FCM group, OR+F+FCM). Both groups 3 and 4 had free access to diet and water for 8 h. Group 5: obese rats received intragastric FCM-D at 10 mL kg−1 bw (FCM group, OR+FCM-D). Group 6: obese rats treated with fasting for 16 h and received intragastric FCM-D at 10 mL kg−1 bw (Fasting and FCM-D group, OR+IF+FCM-D). Both groups 5 and 6 had free access to diet and water for 8 h.
2.4. Blood Samples and Organs’ Relative Weight
The 12-hour-fasted rats were anesthetized with a mixture of alcohol/chloroform/ether (1:2:3), blood samples were collected from the heart puncture of all rats, and serum was separated by centrifugation; then, clear serum was kept at −18 ± 1 °C for screening of biochemical analysis and antioxidant markers. Subsequently, animals were humanely sacrificed by cervical dislocation, the abdomen was opened, and the cardiac and pyloric regions were ligated. Then, the spleen, liver, and kidneys were excised and immediately washed with phosphate buffer, dried with paper tissues, and weighted [43]. Moreover, abdominal perivascular adipose tissue (PAT), e.g., perirenal adipose tissue (PAT), was removed, and the cell size of adipocytes was diagnosed histologically, according to Bertrand et al. [44].
2.5. Biochemical Examinations
2.5.1. Adiponectin and Leptin
Adiponectin and leptin concentrations in blood serum were quantified using ELISA kits according to the method in [45]. Leptin rat ELISA kit (ab100773) and adiponectin rat ELISA kit (ab108784) were obtained from (Abdulla Fouad Co. Dammam, KSA as the main distributor of Abcam Co., Cambridge, UK) for the quantification of leptin and adiponectin concentrations. Depending on the performed standard curve and its generated line equation, the concentration of leptin and adiponectin were calculated and are presented in ng mL−1 and µg mL−1, respectively.
2.5.2. Determination of Lipid Profile and Fasting Blood Glucose Level
All biochemical test kits were bought from Human Co. in Wiesbaden, Germany. According to Nwagha et al. [46], the atherogenic index (AI) was calculated. An enzymatic colorimetric test kit was used to determine fasting blood glucose (mg dL−1). High-density lipoproteins (HDL-c, mg dL−1), total cholesterol (CHO, mg dL−1), and triglycerides (TG, mg dL−1), according to manufacturer instructions, were examined. According to Friedewald et al. [47], low-density lipoproteins (LDL-c, mg dL−1) and very-low-density lipoproteins (VLDL-c, mg dL−1) were mathematically calculated.
2.5.3. Oxidative Stress Biomarkers
According to the described method by Beutler et al. [48], reduced glutathione (GSH, µg dL−1) was determined. According to Ohkawa et al. [49], lipid peroxidation was evaluated by detecting thiobarbituric acid reactive substance (TBARS), and the measured malondialdehyde (MDA) concentration was expressed as nmol mL−1. Superoxide dismutase (SOD, U L−1) activity was determined following the protocol of Giannopolitis and Ries [50]. Catalase (CAT, U L−1) activity was assessed using the Aebi technique [51]. All oxidative-stress biomarkers were determined using a blood chemistry analyzer (HumaLyzer 4000, Wiesbaden, Germany).
2.5.4. Histopathological Examinations
Autopsy samples were taken from the PAT of rats in different groups and fixed in 10% buffered neutral formalin for 24 h. Washing was done in the saline buffer; then, serial dilutions of absolute ethyl alcohol 95% were used for dehydration. Specimens were cleared in xylene and embedded in paraffin at 56 °C in an air-heated oven for 24 h. The rotary LEITZ microtome prepared paraffin beeswax tissue blocks for sectioning at 4-micron thickness. The tissue sections were collected on glass slides, deparaffinized, and stained by hematoxylin and eosin stains, according to Banchroft et al. [52], for examination through the electric light microscope.
2.6. Data Analysis
SPSS (Ver. 22.0 for Windows) was used to conduct the statistical analysis. According to Steel et al. [53], one-way ANOVA was used to assess the statistical significance, p-values of 0.05 were used for the post hoc test, and means of the experimental results and standard error were presented.
3. Results
3.1. Effect of IF, FCM, and FCM-D on Weight Change and Relative Organ Weight
Table 1 shows the final bodyweight gain percentages and the relative weight of the liver, kidneys, and spleen. All treatments reduced the final weight of rats. IF or FCM alone significantly increased the final weight by 15.58 and 5.58% (p < 0.05) compared to G1. Interestingly, the administration of FCM-D to obese rats increased the final weight by 3.93%. However, IF with FCM and IF with FCM-D resulted in a change of 0.92 and −5.45%, respectively. The most efficient treatment for obese rat weight was combining IF with FCM-D. The relative weights of the liver varied significantly across all groups, but no significant (p > 0.05) change was found in the kidneys and spleen.

Table 1.
Effect of FCM, FCM-D, and intermittent on relative organs weight in obese rats fed a high-fat diet for 6 weeks, n = 8.
3.2. Effect of IF, FCM, and FCM-D on Lipid Profile and Atherogenic Index
Data in Table 2 illustrates the effect of IF, FCM, and FCM-D individually or in combinations on non-fasting and fasting blood glucose levels (md dL−1) in obese rats fed a high-fat diet for 6 weeks. Intermittent fasting alone reduced NFBG only after 6 weeks. In contrast, combining IF with FCM or FCM-D reduced the NFBG after 4 weeks. This cumulative effect of IF with FCM or FCM-D significantly (p < 0.05) reduced the FBG during the experimental period. The lowest glucose level was recorded when obese rats intermittently fasted and were administered FCM or FCM-D.
Table 2.
Effect of FCM, FCM-D, and intermittent fasting and non-fasting on blood glucose level (md dL−1) in obese rats fed a high-fat diet for 6 weeks, n = 8.
3.3. Effect of IF, FCM, and FCM-D on Lipid Profile and Atherogenic Index
The hypolipidemic efficiency of IF, FCM, and FCM-D individually or in combinations on obese rats was determined; data are shown in Table 3. FBG changed according to the treatments, whereas a significant (p < 0.05) reduction was found in G2 (OR+IF) and G3 (OR+FCM). The reduction percentage was 19 and 18% for G2 (OR+IF) and G3 (OR+FCM), respectively. This reduction effect was increased in G4 (OR+FCM+F) and G5 (OR+FCM-D) to 30 and 24%, respectively. A reduction of 40% in FBG level was recorded for G6 (OR+IF+ FCM-D), confirming the cumulative effect of FCM-D with IF. For TG, CHO, and its derivatives levels, fasting alone slightly attenuated the TG, CHO, HDL-c, LDL-c, and VLDL-c levels, confirming the positive response to IF (G2, OR+IF). In G3, administrating FCM alone was not significantly (p > 0.05) deferred compared to G2. Administration of FCM-D significantly attenuated TG, CHO, HDL-c, LDL-c, and VLDL-c levels. Interestingly, combining FCM or FCM-D with IF effectively attenuated the TG, CHO, HDL-c, LDL-c, and VLDL-c levels and improved the lipid profile. Obviously, FCM-D with IF for 16 h presented a superior effect on lipid profile, confirming the improving effect on obese rats. In G6, the lowest TG, CHO, LDL-C, and VLDL-c levels and the highest HDL-C level were found. A reduction rate of 40, 37, 66, and 40% for TG, CHO, LDL-c, and VLDL-c, respectively, and an increase in HDL-C by 34% were also found.
Table 3.
Effect of FCM, FCM-D, and intermittent on lipid profile (md dL−1) in obese rats fed a high-fat diet for 6 weeks, n = 8.
3.4. Effect of IF, FCM, and FCM-D on Atherogenic Index
Interestingly, the AI was significantly (p < 0.05) increased in obese rats (G1), Figure 1. All treatments effectively reduced the AI. Intermittent fasting alone reduced AI by 21%, which correlated to the reduction in TG, Table 3. Similarly, administrating FCM to obese rats reduced AI by 19% (G3). Also, the administration of FCM-D reduced AI by 23% (G5). However, combining IF with FCM (G4) or FCM-D (G6) reduced AI by 42 and 59%, respectively. This cumulative effect of IF with FCM or FCM-D was correlated to obtained the data shown in Table 1 and Table 3.
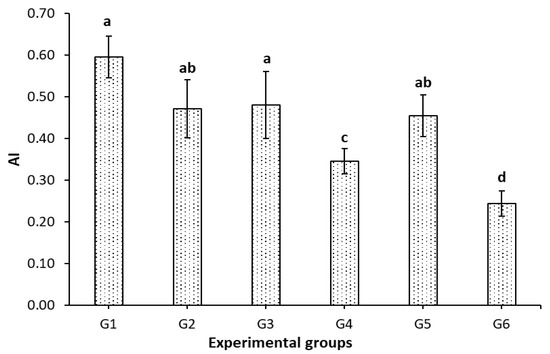
Figure 1.
Effect of IF, FCM, and FCM-D on the atherogenic index in obese rats fed a high-fat diet for 6 weeks, n = 8. G1–G6: experimental groups see materials and methods, Section 2.3; a,b,c,d: bars not sharing similar letters are significantly different (p > 0.05).
3.5. Effect of FCM, FCM-D, and IF on Leptin and Adiponectin Levels
Figure 2 shows the effect of FCM, FCM-D, and IF on leptin and adiponectin levels. Since the amount of leptin in the blood is directly proportional to the amount of adipose tissue, the high level of leptin (hyperleptinemia) is related to obesity. As seen in Figure 2, the highest level of leptin hormone was recorded in G1. Interestingly, a significant (p < 0.05) reduction in leptin level was found associatively when body weight decreased as a response to treatments. Treating rats with IF, FCM, FCM+IF, FCM-D, and FCM-D+IF resulted in a significant (p < 0.05) reduction of 5.95, 13.31, 18.99, 10.41, and 20.38%, respectively. The most effective and efficient treatments were the combination of FCM+IF or FCM-D + IF.
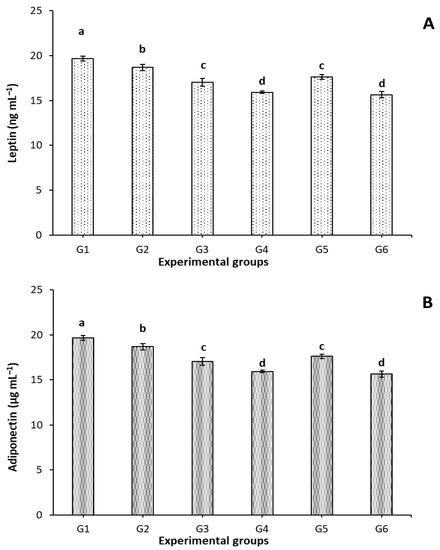
Figure 2.
Effect of IF, FCM, and FCM-D on leptin and adiponectin levels in obese rats fed a high-fat diet for 6 weeks, n = 8; G1-G6: experimental groups see materials and methods, Section 2.3; a,b,c,d: bars not sharing similar letters are significantly different (p > 0.05). (A): Leptin level (ng mL−1) and (B): Adiponectin (µg mL−1).
Adiponectin plays an important role in several metabolic and cellular functions. Its two main functions deal with insulin sensitization and anti-inflammatory effects. Increasing the level of adiponectin is associated with decreasing the obesity rate. Obese rats (G1) exhibited a significant (p < 0.05) reduction in adiponectin level compared to treated groups, Figure 2. Applying the IF, FCM, FCM+IF, FCM-D, and FCM-D+IF resulted in significant (p < 0.05) increases of 15.51, 42.72, 61.75, 28.10, and 60.58%, respectively. Remarkably, treating rats with FCM+IF or FCM-D+IF effectively increased the adiponectin level.
3.6. Effect of FCM, FCM-D, and IF on Oxidative Stress Biomarkers
Feeding a high-fat diet could affect GSH, SOD, and CAT levels and elevated MDA levels in the blood serum of G1, as shown in Table 4. The activity of the antioxidant enzymes GSH, CAT, and SOD was significantly (p < 0.05) changed as a response to different treatments. The levels of MDA were significantly (p < 0.05) decreased in a type-dependent manner, as shown in Table 3. IF alone did not considerably affect GSH, CAT, SOD, and MDA levels. However, administrating FCM attenuated GSH, SOD, and MDA significantly (p < 0.05) while keeping the CAT level with nonsignificant (p > 0.05) change. Interestingly, administrating FCM-D or FCM with fasting attenuated GSH, SOD, MDA, and CAT levels significantly (p < 0.05). The most efficient treatment was giving FCM-D with fasting for 16 h. A remarkable increase in the activity of antioxidant enzymes GSH, CAT, and SOD and a significant (p < 0.05) decrease in MDA levels was observed.
Table 4.
Effect of FCM, FCM-D, and IF on oxidative stress biomarkers in obese rats (mean ± SE), n = 8.
3.7. Effect of FCM, FCM-D, and IF on Histopathological Alterations of Adipose Tissues
The results of the biochemical investigations were supported by histopathological examination. Figure 3 shows the degree of histological changes in the underlying structure of rat PAT in various experimental groups. Our investigation noted no histopathological alteration, confirming normal histological structure in the adipoblasts as hexagonal shapes with a thin rim of cytoplasm, flattened nuclei, and very fine connective tissue stroma dividing the parenchyma into lobules (G1, OR). In G2 (OR+IF), which was subjected to fasting for 16 h, severe dilatation and congestion were observed in the stromal blood vessels (G2.a), associated with diffuse inflammatory cells infiltration with focal hemorrhage and sclerosis in the vascular wall of the blood vessels (G2.b). In addition, focal massive inflammatory cell aggregations, mainly eosinophils, were detected between the parenchyma cells. In obese rats administrated with FCM (OR+FCM), there was inflammatory cell infiltration in the thick stroma between the parenchyma cells (G3.a). Diffuse inflammatory cell infiltration, mainly eosinophils, was detected between the adiopoblasts (G3.b). Also, there was focal inflammatory cell aggregation, mainly eosinophils, in the parenchyma. Obese rats treated with 16 h fasting and intragastric FCM (10 mL kg−1) administration (OR+IF+FCM) showed focal inflammatory cells infiltration, mainly eosinophils, in the parenchyma (G4.a), associated with hyalinization of the connective tissue stroma (G4.b). When rats in G5 (OR+FCM-D) received intragastric FCM-D (10 mL kg−1), focal inflammatory cell aggregation—mainly lymphocytes—in the parenchyma (G5.a) was associated with congestion in stromal blood vessels. Focal inflammatory cells were also detected in the parenchyma, which is associated with the hyalinization of the connective tissue stroma (G5.b). In G6 (OR+IF+FCM-D), there was no histopathological alteration in most of the tissue (G6), except for a few focal areas of inflammatory cell infiltration in the parenchyma in obese rats that were fasted for 16 h and received intragastric FCM-D as 10 mL kg−1.
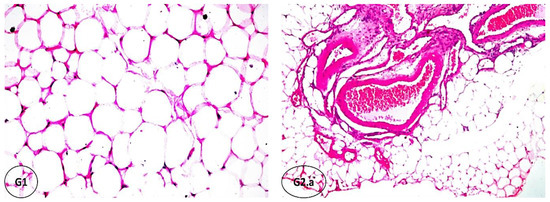
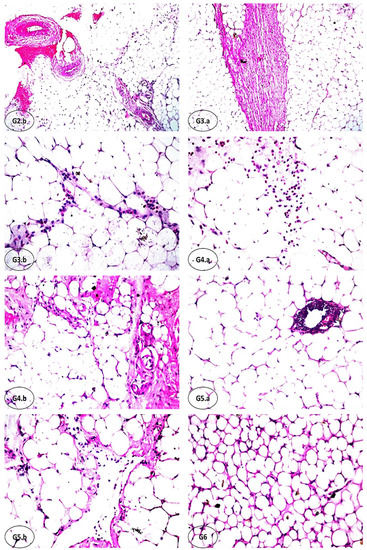
Figure 3.
Histopathological findings of rats’ PAT of the experimental groups (hematoxylin–eosin, HE; x16). (G1): no histopathological alteration, and the normal histological structure of adipoblasts as hexagonal shapes with a thin rim of cytoplasm, flattened nuclei, and very fine connective tissue stroma dividing the parenchyma into lobules was confirmed (x16). (G2.a) and (b): severe dilatation and congestion were observed in the stromal blood vessels, associated with diffuse inflammatory cells infiltration with focal hemorrhages and sclerosis in the vascular wall of the blood vessels; focal massive inflammatory cell aggregations, mainly eosinophils, were detected between the parenchyma cells. (G3.a) and (b): inflammatory cell infiltration in the thick stroma between the parenchyma cells with diffuse inflammatory cell infiltration, mainly eosinophils, was detected between the adiopoblasts. (G4.a) and (b): focal inflammatory cell infiltration, mainly eosinophils, was detected in the parenchyma, associated with hyalinization of the connective tissue stroma. (G5.a) and (b): focal inflammatory cell aggregation, particularly lymphocytes, was detected in the parenchyma, associated with congestion in stromal blood vessels; focal inflammatory cells were observed in the parenchyma, associated with hyalinization of the connective tissue stroma. (G6): no histopathological alteration in most of the tissue, except for a few focal areas of inflammatory cell infiltration of the parenchyma.
4. Discussion
There has been much investment, both in terms of research and products, into addressing or limiting excess fat buildup in the body due to the close link between obesity and many other metabolic illnesses and health concerns. Probiotics and gut microbiota have only lately been recognized for their potential to alleviate dysbiosis in obese mice on a high-fat diet [42,54]. Here, we investigated the effect of IF and consumption of probiotics FCM or FCM-D on weight loss, blood profile, antioxidant status, leptin, adiponectin levels, and histopathological alteration of adipose tissue in the experimental rat modules. Regarding weight loss, IF with FCM and IF with FCM-D yielded a change of 0.92 and −5.45%, respectively. IF with FCM or FCM-D is the most effective method for treating obesity in rats. As a good indicator, liver weights varied widely across study groups, whereas kidneys and spleen did not show any signs of alteration. In a recent study, CM or Probiotic-FCM exhibited various gut microbiota diversity, which increased SCFA and weight loss more than cow and goat milk [13]. These findings were also confirmed in weight gain and organ weight, as previously mentioned [37,38,39,42]. FCM improved the anthropometric measures and blood pressure of adolescents with MetS, as previously found [55].
Insulin resistance is linked to obesity, which in turn worsens type 2 diabetes and cardiovascular disease. Obesity disrupts homeostasis pathways involved in endocrine, inflammatory, neurological, and cellular functions. It is believed that the pathophysiology of insulin resistance is based on the dynamic interplay of multiple of these components; however, any one of them may play a more significant role [56]. Intriguingly, NFBG was reduced in just 4 weeks when IF was combined with FCM or FCM-D, but IF alone had a delayed effect of 6 weeks. This experiment also showed that the cumulative impact of alternating fasting with FCM or FCM-D reduced the FBG measured during the study. Obese mice treated with FCM or FCM-D and allowed to fast intermittently had the lowest blood glucose levels. According to Cho et al. [57], IF is highly beneficial when chronic metabolic disorders are not present, as it reduces body mass index, decreases leptin levels, and increases adiponectin concentrations. FBG levels altered in response to treatments, although both IF and FCM significantly reduced BGL by 19 and 18% in Groups 2 and 3, respectively. However, research has shown that combining IF with FCM or FCM-D has a synergistic effect and leads to a tremendous reduction. The hypoglycemic effect of CM and FCM could be supportive [7,8], in addition to the impact of IF [29,57,58]. As predicted, many of our findings might be attributed to camel milk properties regarding the production insulin-like substances and its fermented state [59].
Interestingly, Deng et al. [60] indicated that IF and probiotics can improve fat metabolism, reduce fat accumulation, promote white fat conversion to beige, and improve gut microbiota. In our study, fasting alone reduced TG, CHO, HDL-c, LDL-c, and VLDL-c levels, supporting the benefits of IF (G2, OR+IF). In G3, FCM alone was not delayed compared to G2. Combining FCM or FCM-D with IF improved lipid profile in obese rats. G6 had the lowest TG, CHO, LDL-c, and VLDL-c and the greatest HDL-C. TG, CHO, LDL-c, and VLDL-c all dropped by 40%, whereas HDL-C rose by 34% [58]. Morales-Suarez-Varela et al. [61] found that a combination of IF and a healthy diet significantly lowered cardiovascular risk in overweight or diabetic subjects. Regulation of lipid and glucose metabolism and oxidative stress were outlined. Furthermore, IF changes the composition of the gut microbiota in a beneficial way, which can reduce inflammatory immune responses [61]. All treatments effectively lowered AI. IF alone decreased AI by 21%, which is linked to a drop in TG. Combining IF with FCM (G4) or FCM-D (G6) lowered AI by 42 and 59%, respectively. This cumulative effect of IF with FCM or FCM-D was correlated with observed data for the lipid profile and showed consistent agreement [42,60].
FCM, FCM-D, and IF affect leptin and adiponectin levels. Hyperleptinemia is linked to obesity because leptin in the blood is proportional to fat tissue [62]. Leptin levels fell as a result of treatment-induced weight loss. IF, FCM, FCM+, FCM-D, and FCM-D+ reduced rat weight by 5.95, 13.31, 18.99, 10.41, and 20.38%, respectively. FCM+IF or FCM-D+ intermittent was the most effective [62,63]. Adiponectin helps in metabolic and cellular processes. It has insulin-sensitizing and anti-inflammatory properties [64]. Increasing adiponectin reduces obesity. Compared to treated groups, obese rats (G1) had a lower adiponectin level (Figure 2). IF, FCM, FCM+, FCM-D, and FCM-D+ led to increases of 15.51, 42.72, 61.75, 28.10, and 60.58%. FCM+ or FCM-D+ IF raised adiponectin levels in rats [64]. Obesity-related increased adipokines production may have a role in tumor progression [65]. For instance, it has been shown that the increased plasma levels of leptin in obese patients encourage the growth of neoplastic cells [66], although at a lower level in obese people. Adiponectin, however, was found to suppress tumor growth and angiogenesis [67]. An increased risk of breast cancer has been linked to low plasma adiponectin levels, which may play a role in preventing carcinogenesis [68]. As with leptin, pro-inflammatory cytokines promote the growth of neoplastic cells, hence causing cancer [65].
In the present study, a high-fat diet influenced GSH, SOD, and CAT levels and raised MDA levels, as seen in obese rats. The antioxidant enzymes GSH, CAT, and SOD were considerably altered, suggested treatments, and MDA levels fell in a type-dependent way. FCM administration reduced GSH, SOD, and MDA while keeping the CAT level unchanged. FCM-D or FCM with IF attenuated GSH, SOD, MDA, and CAT levels. Combining FCM-D with IF efficiently increased antioxidant enzymes GSH, CAT, and SOD and decreased MDA levels. Similar findings were confirmed when probiotics were accompanied with inulin as a novel psychobiotic that could have beneficial psychotropic effects [60,69,70].
In the PAT histoarchitectures of the current study, photomicrographs of the G1 section showed normal adipoblasts with a hexagonal shape, thin rim of cytoplasm, flattened nuclei, and very fine connective tissue stroma dividing the parenchyma into lobules. Treating with IF caused severe dilatation and congestion associated with diffuse inflammatory cell infiltration with focal hemorrhages and sclerosis in the vascular wall of the blood vessels. Focal massive inflammatory cell aggregations, mainly eosinophils, were detected between the parenchyma cells. An inflammatory cell infiltration in the thick stroma between the parenchyma cells and diffuse inflammatory cell infiltration, predominantly eosinophils, between the adiopoblasts were observed and associated with the administration of FCM. Many proinflammatory adipokines (chemicals produced by fat cells) that stimulate lipolysis were present. These include IL-1, IL-6, TNF-, and the interferon family [71]. Suganami et al. [72] demonstrated that, during lipolysis in adipocytes, free fatty acids are produced, activating monocytes to cause local inflammation. An increase in free fatty acids (FFAs) drives lipolysis in adipose tissue, triggering inflammation. When fatty acids are in excess, they have a paracrine impact that promotes more inflammation. Lipolysis is accelerated by inflammatory cytokines, which in turn boost ATGL and HSL activity, leading to a buildup of free fatty acids (FFA) in the interstitial adipose tissue [73]. A focal inflammatory cell infiltration, mostly eosinophils, was observed in the parenchyma of IF and FCM treated groups and is associated with hyalinization of the connective tissue stroma. In obesity, high levels of FFAs and proinflammatory mediators in serum could be introduced [74]. It is known that obesity and chronic low-grade inflammation go hand in hand, but researchers have not yet pinpointed what sets off this vicious cycle. Several lines of evidence suggest that lipids play a significant role as mediators of both obesity and chronic inflammation [75], eliciting a robust immune response that includes the release of cytokines and chemokines by immune cells and adipocytes and the upregulation of costimulatory molecules that aid in the induction of adaptive immune responses [76,77].
Intragastric FCM-D (10 mL kg−1) resulted in a focal inflammatory cell aggregation of mainly lymphocytes in the parenchyma, which is associated with congestion in stromal blood vessels. Focal inflammatory cells were also detected in the parenchyma, associated with the hyalinization of the connective tissue stroma. Possible causes include an increase in lipolysis, which increases lipolysis-derived fatty acid levels by activating Toll-like receptor (TLR-4) signaling, stimulating the NF-kB pathway, and ultimately upregulating the expression of several cytokines and chemokines in immune cells and adipocytes. Thereby, a positive feedback loop is established such that lipolysis-derived fatty acids stimulate TLR-4, increasing the inflammatory response and adipocyte release of pro-inflammatory adipokines [73]. Interestingly, combining IF with intragastric FCM-D resulted in no histopathological alteration in most of the tissue, except for a few focal areas with inflammatory cell infiltration in the parenchyma. This may be due to the synergistic effect of IF and FCM-D, which contain probiotic microorganisms that modulate SCFAs production [78] and generate CM-derived bioactive peptides (CM-BAPs) with functional and therapeutical effectiveness. The health-related bioactive properties of CM-BAPs through in vitro and in vivo studies have recently been reported [79]. CM-BAPs have been reported to have antioxidant, anti-diabetic, anti-obesity, antihypertensive, antibacterial, antibiofilm, anticancer, anti-inflammatory, anti-hemolytic, and anti-hyperpigmentation activities [79]. This may be due to the combined effects of the probiotic microbes in FCM-D and IF, which influence SCFAs synthesis [78] and produce CM-derived bioactive peptides (CM-BAPs) that have functional and therapeutic efficacy. In vitro and in vivo investigations have recently demonstrated the health-related bioactive characteristics of CM-BAPs [79]. Antioxidant, anti-diabetic, anti-obesity, antihypertensive, antibacterial, antibiofilm, anticancer, inflammatory, hemolytic, and hyperpigmentation properties are some documented benefits of CM-BAPs [79]. Most recently, Narmaki et al. [80] suggested that probiotic supplementation may be useful in conjunction with a low-calorie diet for its appetite-suppressing and microbial-community-altering properties.
5. Conclusions
The current investigation examined the effects of intermittent fasting (IF), fermented camel milk (FCM), and fermented camel milk incorporating 10% sukkari date (FCM-D) on weight loss, blood profile, and antioxidant status in obese rats for 6 weeks. Leptin and adiponectin levels and histopathological examination of adipose tissue were also carried out. Results indicated that IF with FCM or IF with FCM-D encouraged effective body weight loss and reduced NFBG and FBG. The hypolipidemic efficiency of IF, FCM, and FCM-D individually or in combination on obese rats attenuated TG, CHO, and their derivatives levels. Combining IF with FCM or FCM-D considerably reduced AI. Remarkably, treating rats with FCM+IF or FCM-D+IF effectively attenuated leptin and adiponectin levels. Implementing FCM-D or FCM with IF significantly attenuated GSH, SOD, MDA, and CAT levels. Histopathologically, lipolysis in adipocytes increased free fatty acids (FFAs), promoting inflammation. Only IF+FCM-D exhibited no histopathological alteration, except for a few focal areas of inflammatory cell infiltration in the parenchyma. Combining IF with Probiotic-FCM or Probiotic-FCM-D effectively accelerated weight loss, attenuated metabolic markers, and reserved histopathological alterations. Thus, IF combined with Probiotic-FCM or Probiotic-FCM-D are highly recommended for weight loss, strengthening antioxidative status, and preventing health disorders.
Supplementary Materials
The following supporting information can be downloaded at: https://www.mdpi.com/article/10.3390/fermentation8110619/s1, Table S1: Chemical composition and physicochemical properties of camel milk and SKD (mean ± SE), n = 6; Table S2: Chemical composition and physicochemical properties of fermented camel milk fortified with 10% Sukkari date (SKD), (mean ± SE), n = 6; Table S3: Mineral contents (mg 100 g−1) of fermented camel milk fortified with 10% Sukkari date (SKD), (mean ± SE), n = 6; Table S4: Total phenolic, total flavonoids, total flavonols contents, and relative antioxidant capacity of fermented camel milk fortified with 10% Sukkari date (SKD), (mean ± SE), n = 6; Table S5: Microbiological analysis of fermented camel milk fortified with 10% Sukkari date (SKD) palm (mean ± SE), n = 6.
Author Contributions
Conceptualization, methodology, investigation, T.A., H.B., M.R.; project administration, T.A.; validation, M.M.A.M.; data curation, M.R., H.B.; data visualization: T.A.; writing—original draft preparation, writing—review, editing, and visualization, T.A., H.B. All authors have read and agreed to the published version of the manuscript.
Funding
This project was funded by the Deanship of Scientific Research, Qassim University, under the number (10199-cavm-2020-1-3-I).
Institutional Review Board Statement
The study was approved by the committee of Research Ethics, Deanship of Scientific Research, Qassim University (21-07-13 on 26 January 2022), SA, which is governed by the Control and Supervision of Experiments on Animals (CPCSEA) Committee of the National Committee of BioEthics (NCBE), which implements regulations related to the ethics of research on living creatures.
Informed Consent Statement
Not applicable.
Data Availability Statement
The data presented in this study are available on request from the corresponding author.
Acknowledgments
The authors gratefully acknowledge Qassim University, represented by the Deanship of Scientific Research, on the financial support for this research under the number (10199-cavm-2020-1-3-I) during the academic year 1441AH/2020 AD.
Conflicts of Interest
The authors declare no conflict of interest.
Abbreviations
AI, Atherogenic index; Bw, body weight; CAT, catalase; CHO, cholesterols; CM, camel milk; DVS, direct-to-vat set; FBG, fasting blood glucose; FCM, fermented camel milk; FCM-D, fermented camel milk incorporating 10% Sukkari date; FFAs, free fatty acids; GSH, reduced glutathione; HDL-c, high-density lipoprotein; IF, intermittent fasting; LDL-c, low-density lipoprotein; MDA, malondialdehyde; NFBG, mon-fasting blood glucose; OR, obese rats; PAT, perivascular adipose tissue; SCFAs, short-chain fatty acids; SD, Sukkari date; SOD, superoxide dismutase; SPSS, Statistical Package for the Social Sciences; TBARS, thiobarbituric acid reactive substance; TG, triglycerides; VLDL-c, very-low-density lipoprotein.
References
- Pi-Sunyer, X. The Medical Risks of Obesity. Postgrad. Med. 2009, 121, 21–33. [Google Scholar] [CrossRef] [PubMed]
- Aliss, E.M.; Sutaih, R.H.; Kamfar, H.Z.; Alagha, A.E.; Marzouki, Z.M. Physical Activity Pattern and its Relationship with Overweight and Obesity in Saudi Children. Int. J. Pediatr. Adolesc. Med. 2020, 7, 181–185. [Google Scholar] [CrossRef] [PubMed]
- Kolotkin, R.L.; Andersen, J.R. A Systematic Review of Reviews: Exploring the Relationship Between Obesity, Weight Loss and Health-Related Quality of Life. Clin. Obes. 2017, 7, 273–289. [Google Scholar] [CrossRef] [PubMed]
- Berhe, T.; Seifu, E.; Ipsen, R.; Kurtu, M.Y.; Hansen, E.B. Processing Challenges and Opportunities of Camel Dairy Products. Int. J. Food Sci. 2017, 2017, 9061757. [Google Scholar] [CrossRef]
- Elagamy, E.I. Effect of Heat Treatment on Camel Milk Proteins with Respect to Antimicrobial Factors: A Comparison with Cows’ and Buffalo Milk Proteins. Food Chem. 2000, 68, 227–232. [Google Scholar] [CrossRef]
- Wang, Z.; Zhang, W.; Wang, B.; Zhang, F.; Shao, Y. Influence of Bactrian Camel MILK on the Gut Microbiota. J. Dairy Sci. 2018, 101, 5758–5769. [Google Scholar] [CrossRef]
- Al-Juboori, A.; Mohammed, M.; Rashid, J.; Kurian, J.; El Refaey, S. Nutritional and Medicinal Value of Camel (Camelus dromedarius) Milk; WIT Press: Billerica, MA, USA, 2013; Volume 170, pp. 221–232. [Google Scholar]
- Sharma, C.; Singh, C. Therapeutic Value of Camel Milk–A Review. Adv. J. Pharm. Life Sci. Res. 2014, 2, 7–13. [Google Scholar]
- Salwa, M.Q.; Lina, A.F.K. Antigenotoxic and Anticytotoxic Effect of Camel Milk in Mice Treated with Cisplatin. Saudi J. Biol. Sci. 2010, 17, 159–166. [Google Scholar] [CrossRef][Green Version]
- El Agamy, E.S.I.; Ruppanner, R.; Ismail, A.; Champagne, C.P.; Assaf, R. Antibacterial and Antiviral Activity of Camel Milk Protective Proteins. J. Dairy Res. 1992, 59, 169–175. [Google Scholar] [CrossRef]
- Konuspayeva, G.; Serikbayeva, A.; Loiseau, G.; Narmuratova, M.; Faye, B. Lactoferrin of Camel Milk of Kazakhstan; 2005; Volume 362, pp. 158–167. Available online: https://agritrop.cirad.fr/525438/ (accessed on 18 October 2022).
- Aljutaily, T. Evaluating the Nutritional and Immune Potentiating Characteristics of Unfermented and Fermented Turmeric Camel Milk in Cyclophosphamide-Induced Immunosuppression in Rats. Antioxidants 2022, 11, 792. [Google Scholar] [CrossRef]
- Aljutaily, T.; Huarte, E.; Martinez-Monteagudo, S.; Gonzalez-Hernandez, J.L.; Rovai, M.; Sergeev, I.N. Probiotic-Enriched Milk and Dairy Products Increase the Gut Microbiota Diversity: A Comparative Study. Nutr. Res. 2020, 82, 25–33. [Google Scholar] [CrossRef] [PubMed]
- Aryana, K.J.; Olson, D.W. A 100-Year Review: Yogurt and Other Cultured Dairy Products. J. Dairy Sci. 2017, 100, 9987–10013. [Google Scholar] [CrossRef] [PubMed]
- Ebringer, L.; Ferenčík, M.; Krajčovič, J. Beneficial Health Effects of Milk and Fermented Dairy Products. Folia Microbiol. 2008, 53, 378–394. [Google Scholar] [CrossRef]
- Senok, A.C. Probiotics in the Arabian Gulf Region. Food Nutr. Res. 2009, 53, 1842. [Google Scholar] [CrossRef] [PubMed][Green Version]
- Ley, R.E.; Turnbaugh, P.J.; Klein, S.; Gordon, J.I. Microbial Ecology: Human Gut Microbes Associated with Obesity. Nature 2006, 444, 1022–1023. [Google Scholar] [CrossRef] [PubMed]
- Ley, R.E.; Backhed, F.; Turnbaugh, P.; Lozupone, C.A.; Knight, R.D.; Gordon, J.I. Obesity Alters Gut Microbial Ecology. Proc. Natl. Acad. Sci. USA 2005, 102, 11070–11075. [Google Scholar] [CrossRef] [PubMed]
- Turnbaugh, P.J.; Hamady, M.; Yatsunenko, T.; Cantarel, B.L.; Duncan, A.; Ley, R.E.; Sogin, M.L.; Jones, W.J.; Roe, B.A.; Affourtit, J.P.; et al. A Core Gut Microbiome in Obese and Lean Twins. Nature 2009, 457, U480–U487. [Google Scholar] [CrossRef]
- Schwiertz, A.; Taras, D.; Schafer, K.; Beijer, S.; Bos, N.A.; Donus, C.; Hardt, P.D. Microbiota and SCFA in Lean and Overweight Healthy Subjects. Obesity 2010, 18, 190–195. [Google Scholar] [CrossRef]
- Duncan, S.H.; Belenguer, A.; Holtrop, G.; Johnstone, A.M.; Flint, H.J.; Lobley, G.E. Reduced Dietary Intake of Carbohydrates by Obese Subjects Results in Decreased Concentrations of Butyrate and Butyrate-Producing Bacteria in Feces. Appl. Environ. Microbiol. 2007, 73, 1073–1078. [Google Scholar] [CrossRef]
- Walters, W.A.; Xu, Z.; Knight, R. Meta-Analyses of Human Gut Microbes Associated with Obesity and IBD. FEBS Lett. 2014, 588, 4223–4233. [Google Scholar] [CrossRef]
- Qin, J.; Li, Y.; Cai, Z.; Li, S.; Zhu, J.; Zhang, F.; Liang, S.; Zhang, W.; Guan, Y.; Shen, D.; et al. A Metagenome-Wide Association Study of Gut Microbiota in Type 2 Diabetes. Nature 2012, 490, 55–60. [Google Scholar] [CrossRef] [PubMed]
- Udayappan, S.D.; Hartstra, A.V.; Dallinga-Thie, G.M.; Nieuwdorp, M. Intestinal Microbiota and Faecal Transplantation as Treatment Modality for Insulin Resistance and Type 2 Diabetes Mellitus. Clin. Exp. Immunol. 2014, 177, 24–29. [Google Scholar] [CrossRef] [PubMed]
- Hamed, H.; Chaari, F.; Ghannoudi, Z.; ElFeki, A.; Ellouz, S.C.; Gargouri, A. Beneficial Effects of Fermented Camel Milk by Lactococcus lactis Subsp cemoris on Cardiotoxicity Induced by Carbon Tetrachloride in Mice. Biomed. Pharm. 2018, 97, 107–114. [Google Scholar] [CrossRef] [PubMed]
- Fernández, M.; Hudson, J.A.; Korpela, R.; de los Reyes-Gavilán, C.G. Impact on Human Health of Microorganisms Present in Fermented Dairy Products: An Overview. BioMed Res. Int. 2015, 2015, 1–13. [Google Scholar] [CrossRef]
- Ewis, S.A.; Abdel-Rahman, M.S. Effect of Metformin on Glutathione and Magnesium in Normal and Streptozotocin-Induced Diabetic Rats. J. Appl. Toxicol. 1995, 15, 387–390. [Google Scholar] [CrossRef] [PubMed]
- May, J.M. How Does Ascorbic Acid Prevent Endothelial Dysfunction? Free Radic. Biol. Med. 2000, 28, 1421–1429. [Google Scholar] [CrossRef]
- Patterson, R.E.; Sears, D.D. Metabolic Effects of Intermittent Fasting. Annu. Rev. Nutr. 2017, 37, 371–393. [Google Scholar] [CrossRef]
- Ziaee, V.; Razaei, M.; Ahmadinejad, Z.; Shaikh, H.; Yousefi, R.; Yarmohammadi, L.; Bozorgi, F.; Behjati, M.J. The Changes of Metabolic Profile and Weight During Ramadan Fasting. Singap. Med. J. 2006, 47, 409–414. [Google Scholar]
- Mindikoglu, A.L.; Opekun, A.R.; Gagan, S.K.; Devaraj, S. Impact of Time-Restricted Feeding and Dawn-to-Sunset Fasting on Circadian Rhythm, Obesity, Metabolic Syndrome, and Nonalcoholic Fatty Liver Disease. Gastroenterol. Res. Pract. 2017, 2017, 3932491. [Google Scholar] [CrossRef]
- Hajek, P.; Myers, K.; Dhanji, A.R.; West, O.; McRobbie, H. Weight Change During and After Ramadan Fasting. J. Public Health 2012, 34, 377–381. [Google Scholar] [CrossRef]
- Le Chatelier, E.; Nielsen, T.; Qin, J.J.; Prifti, E.; Hildebrand, F.; Falony, G.; Almeida, M.; Arumugam, M.; Batto, J.M.; Kennedy, S.; et al. Richness of Human Gut Microbiome Correlates with Metabolic Markers. Nature 2013, 500, 541–546. [Google Scholar] [CrossRef]
- Dewulf, E.M.; Cani, P.D.; Claus, S.P.; Fuentes, S.; Puylaert, P.G.; Neyrinck, A.M.; Bindels, L.B.; de Vos, W.M.; Gibson, G.R.; Thissen, J.P.; et al. Insight Into the Prebiotic Concept: Lessons from an Exploratory, Double Blind Intervention Study With Inulin-Type Fructans in Obese Women. Gut 2013, 62, 1112–1121. [Google Scholar] [CrossRef] [PubMed]
- Statovci, D.; Aguilera, M.; MacSharry, J.; Melgar, S. The Impact of Western Diet and Nutrients on the Microbiota and Immune Response at Mucosal Interfaces. Front. Immunol. 2017, 8, 838. [Google Scholar] [CrossRef]
- Popkin, B.M.; Adair, L.S.; Ng, S.W. Global Nutrition Transition and the Pandemic of Obesity in Developing Countries. Nutr. Rev. 2012, 70, 3–21. [Google Scholar] [CrossRef]
- Anton, S.D.; Moehl, K.; Donahoo, W.T.; Marosi, K.; Lee, S.A.; Mainous, A.G.; Leeuwenburgh, C.; Mattson, M.P. Flipping the Metabolic Switch: Understanding and Applying the Health Benefits of Fasting. Obesity 2018, 26, 254–268. [Google Scholar] [CrossRef]
- Zibaee, S.; Hosseini, S.M.; Yousefi, M.; Taghipour, A.; Kiani, M.A.; Noras, M.R. Nutritional and Therapeutic Characteristics of Camel Milk in Children: A Systematic Review. Electron. Physician 2015, 7, 1523–1528. [Google Scholar] [CrossRef] [PubMed]
- Davati, N.; Tabatabaee Yazdi, F.; Zibaee, S.; Shahidi, F.; Edalatian, M.R. Study of Lactic Acid Bacteria Community From Raw Milk of Iranian One Humped Camel and Evaluation of Their Probiotic Properties. Jundishapur. J. Microbiol. 2015, 8, e16750. [Google Scholar] [CrossRef]
- Rahman, I.E.A.; Dirar, H.A.; Osman, M.A. Microbiological and Biochemical Changes and Sensory Evaluation of Camel Milk Fermented by Selected Bacterial Starter Cultures. Afr. J. Food Sci. 2009, 3, 398–405. [Google Scholar]
- Aljutaily, T.; Barakat, H.; Moustafa, M.M.; Rehan, M. Incorporation of Sukkari Date in Probiotic-Enriched Fermented Camel Milk Improves the Nutritional, Physicochemical, and Organoleptical Characteristics. Fermentation 2021, 8, 5. [Google Scholar] [CrossRef]
- Kong, C.; Gao, R.; Yan, X.; Huang, L.; Qin, H. Probiotics improve gut microbiota dysbiosis in obese mice fed a high-fat or high-sucrose diet. Nutrition 2019, 60, 175–184. [Google Scholar] [CrossRef] [PubMed]
- Kang, J.-H.; Yun, S.-I.; Park, H.-O. Effects of Lactobacillus Gasseri BNR17 on Body Weight and Adipose Tissue Mass in Diet-Induced Overweight Rats. J. Microbiol. 2010, 48, 712–714. [Google Scholar] [CrossRef] [PubMed]
- Cariou, B.; van Harmelen, K.; Duran-Sandoval, D.; van Dijk, T.H.; Grefhorst, A.; Abdelkarim, M.; Caron, S.; Torpier, G.; Fruchart, J.-C.; Gonzalez, F.J. The Farnesoid X Receptor Modulates Adiposity and Peripheral Insulin Sensitivity in Mice. J. Biol. Chem. 2006, 281, 11039–11049. [Google Scholar] [CrossRef] [PubMed]
- Hamad, E.M.; Sato, M.; Uzu, K.; Yoshida, T.; Higashi, S.; Kawakami, H.; Kadooka, Y.; Matsuyama, H.; Abd El-Gawad, I.A.; Imaizumi, K. Milk Fermented by Lactobacillus Gasseri Sbt2055 Influences Adipocyte Size Via Inhibition of Dietary Fat Absorption in Zucker Rats. Br. J. Nutr. 2008, 101, 716–724. [Google Scholar] [CrossRef] [PubMed]
- Nwagha, U.; Ikekpeazu, E.; Ejezie, F.; Neboh, E.; Maduka, I. Atherogenic Index of Plasma as Useful Predictor of Cardiovascular Risk Among Postmenopausal Women in Enugu, Nigeria. Afr. Health Sci. 2010, 10, 248–252. [Google Scholar]
- Friedewald, W.T.; Levy, R.I.; Fredrickson, D.S. Estimation of the Concentration of Low-Density Lipoprotein Cholesterol in Plasma, Without Use of the Preparative Ultracentrifuge. Clin. Chem. 1972, 18, 499–502. [Google Scholar] [CrossRef] [PubMed]
- Beutler, E. Improved Method for the Determination of Blood Glutathione. J. Lab. Clin. Med. 1963, 61, 882–888. [Google Scholar]
- Ohkawa, H.; Ohishi, N.; Yagi, K. Assay for Lipid Peroxides in Animal Tissues by Thiobarbituric Acid Reaction. Anal. Biochem. 1979, 95, 351–358. [Google Scholar] [CrossRef]
- Giannopolitis, C.N.; Ries, S.K. Superoxide dismutases: I. Occurrence in Higher Plants. Plant Physiol. 1977, 59, 309–314. [Google Scholar] [CrossRef]
- Aebi, H. [13] Catalase In Vitro. Meth. Enzymol. 1984, 105, 121–126. [Google Scholar]
- Bancroft, J.; Suvarna, S.; Layton, C. Bancroft’s Theory and Practice of Histological Techniques, 7th, ed.; Churchill Livingstone: London, UK; Elsevier Ltd.: New York, NY, USA, 2013. [Google Scholar]
- Steel, R.G. Pinciples and Procedures of Statistics A Biometrical Approach, 3rd ed.; McGraw-Hill: Boston, MA, USA, 1997. [Google Scholar]
- Shabana; Shahid, S.U.; Irfan, U. The Gut Microbiota and its Potential Role in Obesity. Future Microbiol. 2018, 13, 589–603. [Google Scholar] [CrossRef]
- Fallah, Z.; Feizi, A.; Hashemipour, M.; Namazi, N.; Azarbayejani, L.; Kelishadi, R. Effect of Fermented Camel Milk on Obesity Measures and Blood Pressure of Adolescents With Metabolic Syndrome. J. Pediatr. Rev. 2019, 7, 181–189. [Google Scholar] [CrossRef]
- Qatanani, M.; Lazar, M.A. Mechanisms of Obesity-associated Insulin Resistance: Many Choices on the Menu. Genes Dev. 2007, 21, 1443–1455. [Google Scholar] [CrossRef] [PubMed]
- Cho, Y.; Hong, N.; Kim, K.-w.; Cho, S.j.; Lee, M.; Lee, Y.-h.; Lee, Y.-h.; Kang, E.S.; Cha, B.-S.; Lee, B.-W. The Effectiveness of Intermittent Fasting to Reduce Body Mass Index and Glucose Metabolism: A Systematic Review and Meta-Analysis. J. Clin. Med. 2019, 8, 1645. [Google Scholar] [CrossRef] [PubMed]
- Tay, A.; Pringle, H.; Penning, E.; Plank, L.D.; Murphy, R. PROFAST: A Randomized Trial Assessing the Effects of Intermittent Fasting and Lacticaseibacillus rhamnosus Probiotic among People with Prediabetes. Nutrients 2020, 12, 3530. [Google Scholar] [CrossRef] [PubMed]
- Fallah, Z.; Feizi, A.; Hashemipour, M.; Kelishadi, R. Effect of fermented camel milk on glucose metabolism, insulin resistance, and inflammatory biomarkers of adolescents with metabolic syndrome: A double-blind, randomized, crossover trial. J. Res. Med. Sci. 2018, 23, 32. [Google Scholar]
- Deng, Y.; Liu, W.; Wang, J.; Yu, J.; Yang, L.Q. Intermittent Fasting Improves Lipid Metabolism Through Changes in Gut Microbiota in Diet-Induced Obese Mice. Med. Sci. Monit. 2020, 26, 1643–3750. [Google Scholar] [CrossRef] [PubMed]
- Morales-Suarez-Varela, M.; Collado Sánchez, E.; Peraita-Costa, I.; Llopis-Morales, A.; Soriano, J.M. Intermittent Fasting and the Possible Benefits in Obesity, Diabetes, and Multiple Sclerosis: A Systematic Review of Randomized Clinical Trials. Nutrients 2021, 13, 3179. [Google Scholar] [CrossRef] [PubMed]
- Beltowski, J. Leptin and Atherosclerosis. Atherosclerosis 2006, 189, 47–60. [Google Scholar] [CrossRef]
- Ibars, M.; Ardid-Ruiz, A.; Suárez, M.; Muguerza, B.; Bladé, C.; Aragonès, G. Proanthocyanidins Potentiate Hypothalamic Leptin/STAT3 Signalling and Pomc Gene Expression in Rats with Diet-Induced Obesity. Int. J. Obes. 2017, 41, 129–136. [Google Scholar] [CrossRef]
- Choi, H.M.; Doss, H.M.; Kim, K.S. Multifaceted Physiological Roles of Adiponectin in Inflammation and Diseases. Int. J. Mol. Sci. 2020, 21, 1219. [Google Scholar] [CrossRef]
- Fenton, J.I.; Hord, N.G.; Lavigne, J.A.; Perkins, S.N.; Hursting, S.D. Leptin, Insulin-Like Growth Factor-1, and Insulin-Like Growth Factor-2 Are Mitogens in ApcMin/+ but not Apc+/+ Colonic Epithelial Cell Lines. Cancer Epidemiol. Biomark. Prev. 2005, 14, 1646–1652. [Google Scholar] [CrossRef] [PubMed]
- Bråkenhielm, E.; Veitonmäki, N.; Cao, R.; Kihara, S.; Matsuzawa, Y.; Zhivotovsky, B.; Funahashi, T.; Cao, Y. Adiponectin-Induced Antiangiogenesis and Antitumor Activity Involve Caspase-Mediated Endothelial Cell Apoptosis. Proc. Natl. Acad. Sci. USA 2004, 101, 2476–2481. [Google Scholar] [CrossRef] [PubMed]
- Mantzoros, C.; Petridou, E.; Dessypris, N.; Chavelas, C.; Dalamaga, M.; Alexe, D.M.; Papadiamantis, Y.; Markopoulos, C.; Spanos, E.; Chrousos, G.; et al. Adiponectin and Breast Cancer Risk. J. Clin. Endocr. Met. 2004, 89, 1102–1107. [Google Scholar] [CrossRef] [PubMed]
- Shaw, J.h.; Wolfe, R.R. Fatty Acid and Glycerol Kinetics in Septic Patients and in Patients with Gastrointestinal Cancer. The Response to Glucose Infusion and Parenteral Feeding. Ann. Surg. 1987, 205, 368–376. [Google Scholar] [CrossRef]
- Morshedi, M.; Valenlia, K.B.; Hosseinifard, E.S.; Shahabi, P.; Abbasi, M.M.; Ghorbani, M.; Barzegari, A.; Sadigh-Eteghad, S.; Saghafi-Asl, M. Beneficial Psychological Effects of Novel Psychobiotics in Diabetic Rats: The Interaction Among the Gut, Blood and Amygdala. J. Nutr. Biochem. 2018, 57, 145–152. [Google Scholar] [CrossRef]
- Blythe, J.; Ruggiero, M.; Pacini, S. Case Report: Intermittent Fasting and Probiotic Yogurt Consumption are Associated with Reduction of Serum Alpha-N-Acetylgalactosaminidase and Increased Urinary Excretion of Lipophilic Toxicants. Madr. J. Immunol. 2017, 1, 23–27. [Google Scholar] [CrossRef]
- Feingold, K.R.; Doerrler, W.; Dinarello, C.A.; Fiers, W.; Grunfeld, C. Stimulation of Lipolysis in Cultured Fat Cells by Tumor Necrosis Factor, Interleukin-1, and the Interferons is Blocked by Inhibition of Prostaglandin Synthesis. Endocrinology 1992, 130, 10–16. [Google Scholar] [CrossRef]
- Suganami, T.; Nishida, J.; Ogawa, Y. A Paracrine Loop Between Adipocytes and Macrophages Aggravates Inflammatory Changes: Role of Free Fatty Acids and Tumor Necrosis Factor A. Arterioscler. Thromb. Vasc. Biol. 2005, 25, 2062–2068. [Google Scholar] [CrossRef]
- de Souza Teixeira, A.A.; Lira, F.S.; Pimentel, G.D.; de Souza, C.O.; Batatinha, H.; Biondo, L.A.; Yamashita, A.S.; Junior, E.A.L.; Neto, J.C.R. Aerobic Exercise Modulates The Free Fatty Acids and Inflammatory Response During Obesity and Cancer Cachexia. Crit. Rev. Eukaryot. 2016, 26, 187–198. [Google Scholar] [CrossRef]
- Dirat, B.; Bochet, L.; Escourrou, G.; Valet, P.; Muller, C. Unraveling the Obesity and Breast Cancer Links: A Role for Cancer-Associated Adipocytes? Endocr. Dev. 2010, 19, 45–52. [Google Scholar] [CrossRef]
- Uysal, K.T.; Wiesbrock, S.M.; Marino, M.W.; Hotamisligil, G.S. Protection from Obesity-Induced Insulin Resistance in Mice Lacking TNF-α Function. Nature 1997, 389, 610–614. [Google Scholar] [CrossRef] [PubMed]
- Schäffler, A.; Schölmerich, J. Innate Immunity and Adipose Tissue Biology. Trends Immunol. 2010, 31, 228–235. [Google Scholar] [CrossRef] [PubMed]
- Tsukumo, D.M.L.; Carvalho-Filho, M.A.; Carvalheira, J.B.C.; Prada, P.c.O.; Hirabara, S.M.; Schenka, A.A.; Araújo, E.P.; Vassallo, J.; Curi, R.; Velloso, L.c.A.; et al. Loss-of-Function Mutation in Toll-Like Receptor 4 Prevents Diet-Induced Obesity and Insulin Resistance. Diabetes 2007, 56, 1986–1998. [Google Scholar] [CrossRef] [PubMed]
- Markowiak-Kopeć, P.; Śliżewska, K. The Effect of Probiotics on the Production of Short-Chain Fatty Acids by Human Intestinal Microbiome. Nutrients 2020, 12, 1107. [Google Scholar] [CrossRef] [PubMed]
- Ali Redha, A.; Valizadenia, H.; Siddiqui, S.A.; Maqsood, S. A State-of-Art Review on Camel Milk Proteins as An Emerging Source of Bioactive Peptides with Diverse Nutraceutical Properties. Food Chem. 2022, 373, 131444. [Google Scholar] [CrossRef] [PubMed]
- Narmaki, E.; Borazjani, M.; Ataie-Jafari, A.; Hariri, N.; Doost, A.H.; Qorbani, M.; Saidpour, A. The combined effects of probiotics and restricted calorie diet on the anthropometric indices, eating behavior, and hormone levels of obese women with food addiction: A randomized clinical trial. Nutr. Neurosci. 2022, 25, 963–975. [Google Scholar] [CrossRef] [PubMed]


Publisher’s Note: MDPI stays neutral with regard to jurisdictional claims in published maps and institutional affiliations. |
© 2022 by the authors. Licensee MDPI, Basel, Switzerland. This article is an open access article distributed under the terms and conditions of the Creative Commons Attribution (CC BY) license (https://creativecommons.org/licenses/by/4.0/).