Article

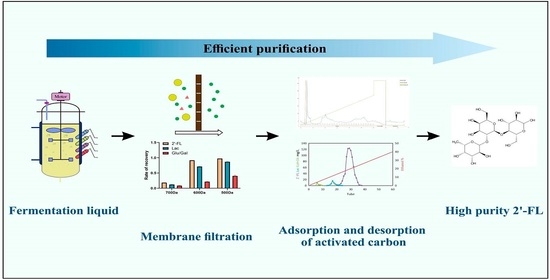
Efficient Purification of 2′-Fucosyllactose by Membrane Filtration and Activated Carbon Adsorption

Tianjin Key Laboratory of Food Science and Health, School of Medicine, Nankai University, Tianjin 300071, China
*
Author to whom correspondence should be addressed.
Fermentation 2022, 8(11), 655; https://doi.org/10.3390/fermentation8110655
Submission received: 30 September 2022 / Revised: 14 November 2022 / Accepted: 15 November 2022 / Published: 19 November 2022
(This article belongs to the Special Issue Separation and Purification of Biosynthetic Products)

Abstract

:
With the rapid development of synthetic biology, the production of 2′-fucosyllactose by biological fermentation gradually has the basis for industrialization. However, the lack of efficient downstream technology of biological fermentation, especially purification technology, has become the main factor limiting its commercialization. In this study, based on the general E. coli biosynthesis of 2′-fucosyllactose fermentation broth, most of the impurities were removed and concentrated using membrane filtration technology after simple flocculation. The target 2′-fucosyllactose was eluted in a targeted manner using activated carbon adsorption and ethanol gradient elution technology. The 2′-fucosyllactose product with 90% or even higher purity could be prepared efficiently. This study explored a new direction for the industrial production of 2′-fucosyllactose.

Graphical Abstract

1. Introduction

2′-fucosyllactose (2′-FL), the highest content component of human milk oligosaccharides, has gradually gained commercial interest due to its extensive prebiotic effects [1,2,3]. Its molecular weight is 488.44 Da, and it is formed by connecting a molecule of fucose and a molecule of lactose [4]. As a prebiotic, 2′-FL can resist gastrointestinal digestion to reach the colon and be selectively fermented by microorganisms, increasing the number of beneficial bacteria by regulating intestinal flora [5]. A large number of studies have shown that oral administration of 2′-FL can reduce the level of host inflammation [6,7], reduce the probability of allergy [8,9], enhance the intestinal barrier function [10], reduce the colonization and infection of foodborne pathogens [11,12], improve the cognitive ability of pigs [13], and even reduce the level of oxidative stress caused by aging in mice [14]. Clinically, oral administration of 2′-FL can increase the number of bifidobacteria in adults [15]. It is well known that Bifidobacterium is a typical class of probiotics. As a probiotic with strong regulatory effects on intestinal microecology, 2′-FL can not only selectively proliferate the Bifidobacterium but also increase the concentration of short-chain fatty acids in the intestinal tract and reduce the pH of the intestinal tract [16].
2′-FL is almost exclusively found in human milk [17]. However, due to some objective reasons, some infants can not obtain enough breast milk, as well as the 2′-FL from breast milk. In addition, due to different human genotypes, women who lack the secretor gene almost do not contain 2′-FL in their milk, which makes some infants unable to obtain sufficient 2′-FL even if they ingest breast milk [18]. Lack of 2′-FL intake leads to a higher risk of allergies, asthma, diarrhea, and vomiting [19]. Therefore, the additional intake of commercial 2′-FL should be an appropriate solution. However, it was almost impossible to obtain 2′-FL in large quantities in the past due to its limited sources. With the rapid development of synthetic biology, microbial fermentation of 2′-FL has become feasible and gradually commercialized [20]. Production of 2′-FL through microbial fermentation synthesis successively obtained the approval of the FDA in 2016. The EU had also ratified 2′-FL as a component of infant formula, a dietary supplement, and even a nutraceutical.
However, studies on the purification process of 2′-FL and other HMOs have hardly been reported. Only Priem and his colleagues have relevant applications for human milk oligosaccharides produced by biological fermentation with activated carbon separation [21], and no systematic research has been performed. There are also some reports on the purification of other oligosaccharides by activated carbon in recent years. Nobre et al. purified FOS from fermentation broth using the activated carbon column. Mixtures containing 50.6% (w/w) of FOS were purified to 92.9% (w/w) with a FOS recovery of 74.5% (w/w) [22]. Morales and his colleagues separated monosaccharides and oligosaccharides from honey using activated carbon [23]. In addition, there are studies on the extraction of sulfated Fucans by various purification methods, which show that the purity of the product obtained by the activated carbon method is the highest [24]. At present, commercial companies have applied for patents on the use of organic solvents to crystallize HMOs. However, the use of a large number of organic solvents brings obvious potential safety hazards to the factory. There are also some reports that membrane filtration is used to purify oligosaccharides. Fouling of membranes and related membrane flux decline have a great influence on the performance of membrane processes in biotechnology applications [25], specifically in the ultrafiltration of oligosaccharides [26,27,28]. Goulas and collaborator used cross-flow filtration in a continuous diafiltration module, obtaining yields of 81% and 98% for raffinose and GOS, respectively [29]. Cordova et al. tested the effect of the three-stage serial nanofiltration unit on the purification of GOS under critical transmembrane pressure and obtained a purity similar to that of commercial GOS [30]. Gulec and its collaborators successfully separated lactose, glucose, and galactose from a high-concentration sugar mixture using a cellulose acetate membrane modified by low-pressure plasma [31]. In addition, Kuhn and his colleagues used NP030 membrane to carry out separation experiments and purified FOS from mixtures containing monosaccharides and disaccharides, obtaining FOS with a purity of up to 80% [32].
However, the high production cost of 2′-FL leads to its high selling price, which is still an important problem restricting its commercialization. This study will mainly start with the downstream purification process of 2′-FL production by fermentation and explore a new purification method of 2′-FL that is more industrialized by combining an efficient membrane filtration process with cheap activated carbon adsorption and re-elution process.

2. Materials and Methods

2.1. 2′-FL Production

The fermentation strain is E. coli XYY1, which is stored in our laboratory. The strain can de novo synthesize 2′-FL from glucose and lactose. The strain was cultured in Luria Bertani (LB) medium (Becton, Dickinson and Company, Franklin Lakes, NJ, USA) (1% tryptone, 0.5% yeast extract, 1% NaCl) with appropriate antibiotic at 37 °C, 220 rpm. Inoculate 10% of the inoculum into 10 L fermentation medium in a 30 L fermentation tank after overnight culture [13.5 g/L KH2PO4, 4.0 g/L (NH4)2HPO4, 1.7 g/L citric acid, 1.4 g/L MgSO4·7H2O, 10 mL/L trace element solution (10 g/L Fe(III) citrate, 2.25 g/L ZnSO4·7H2O, 1.0 g/L CuSO4·5H2O, 0.35 g/L MnSO4·H2O, 0.23 g/L Na2B4O7·10H2O, 0.11 g/L (NH4)6Mo7O24, 2.0 g/L CaCl2·2H2O), pH 6.8]. In addition, add glucose with a final concentration of 20 g/L after autoclaving. After the first addition of glucose was depleted, IPTG and lactose were added to final concentrations of 0.2 mM and 10 g/L, respectively, and a feeding solution containing 600 g/L of glycerol and 20 g/L of MgSO4·7H2O was fed to minimize acetate production. The pH of the culture medium was maintained at 6.8 by adding 28% (w/v) NH4OH. Furthermore, to prevent dissolved oxygen deficiency, the agitation speed within the bioreactor was increased from 300 rpm to 900 rpm, and the airflow rate was also increased throughout the cultivation.
After fermentation, in order to prevent the spread of living bacteria, the temperature in the tank was raised to 70 °C for 30 min to kill most living bacteria effectively. Then, the pH was adjusted with NaOH, and a certain amount of polymerized ferric sulfate was mixed as the flocculant when the fermentation broth was hot at 100 rpm for 2 h until complete settlement. The clarified fermentation liquid was collected after being filtered using the plate and frame filtering equipment.

2.2. Study on Purification of Fermentation Broth by Membrane Filtration

The 1812 experimental spiral wound membrane separation equipment (Goodshine Biological Engineering Equipment Co., Ltd., Shanghai, China) was used for membrane filtration. The spiral wound membrane elements were purchased from Goodshine Biological Engineering Equipment Co., Ltd. Detailed information is shown in Table 1. The clear fermentation liquid was passed through the pore diameter of 0.1 μm microfiltration membrane to remove all particles and bacteria, and then the permeate was passed through the ultrafiltration membrane to remove macromolecular proteins and impurities. Finally, the intercepted products are concentrated through the nanofiltration membrane to remove some monosaccharides and inorganic salts. Specific procedure: All the clarified fermentation broth was poured into the membrane filtration equipment, select a microfiltration membrane was selected with a pore size of 0.1 μm, the pressure was set at 0.5 MPa, and the filtration speed was about 20 L/h. After filtration, the retentate was discarded, and the equipment was cleaned with pure water. The previous permeate was injected into the equipment, and ultrafiltration membranes were selected with pore diameters of 10,000 Da, 3000 Da, and 1000 Da, respectively, for the second filtration. The pressure was set at 0.5 MPa, and the initial filtering speed was about 7L/h. After filtration, the retentate was discarded, and the equipment was cleaned with pure water. Finally, 700 Da, 600 Da, and 500 Da nanofiltration membranes were selected respectively as the third filtration. The pressure was set at 1.5 MPa, and the initial filtration speed was about 3.6 L/h. When the filtration speed was lower than 0.1 L/h, the filter process was shut down, and all the retentate was collected in the tank and pipeline.
The ratio of recovery (R) of 2′-FL was computed using the following equation:
R = (c1∗V1)/(c2∗V2)
The c1 is the concentration of 2′-FL in the permeate or retentate, V1 is the volume of the permeate or retentate, c2 is the concentration of 2′-FL in the feed, and V2 is the volume of the feed. It should be noted that c1 and V1 permeate in the ultrafiltration step and retentate in the nanofiltration step. The recovery ratio of other substances is calculated in the same way.

2.3. Study on Elution Conditions of Activated Carbon Chromatographic Column

The coconut shell activated carbon sold in the market was soaked in 8% HCl and 4% NaOH overnight and then washed to neutral with water. The stainless steel screen was used to screen 30 mesh to 120 mesh powdered coconut shell activated carbon, and the screened activated carbon was placed in an oven at 105 °C overnight to dry it thoroughly. After drying, 20% ethanol-water solution was added to wash with a stir, then the washing solution was discarded. The 60% ethanol-water solution was added to wash with a stir; then, the washing solution was discarded. Finally, the absolute ethanol was used to wash with a stir, and then the column was loaded with the wet activated carbon. The adsorption column’s inner diameter is 16 mm, the adsorbent bed high is 400 mm, and the adsorbent bed volume is 80.425 mL. After standing overnight, the column was connected to AKTA low-pressure chromatography system, and 80%, 60%, 40%, and 20% aqueous ethanol solution and ultrapure water were used to balance the column with 4 bed volumes, respectively. The column loading of activated carbon was completed.
In order to explore the optimal ethanol elution concentration, 0–40% ethanol volume fraction was set to linearly wash the 2′-FL concentrated solution after membrane removal and filtration. The loading volume was 10 mL, the flow rate was 1 mL/min, and the total elution time was 960 min. The filtrate was collected in a tube every 16mL (i.e., 0.2 bed volume), for a total of 60 tubes. After collection, the concentration of 2′-FL and other impurity sugars were detected by HPLC.

2.4. Adsorption of Activated Carbon Kinetic Studies

2.4.1. Determination of Static Adsorption Capacity

The dry activated carbon was accurately weighed about 10 g, which was recorded as m, and 100 mL of 2′-FL with a concentration of 20 g/L was added to the activated carbon, stirred with a glass rod, and then stood still. The supernatant was taken at different time points to measure the concentration of 2′-FL, and the calculation formula of static adsorption capacity (Qs) is:
Qs(g/g) = (cs − ct)∗Vs/m
The cs is the concentration of the 2′-FL standard solution, and the ct is the concentration of 2′-FL at t minutes standing. Vs is the volume of the 2′-FL standard solution. The m is the mass of dry activated carbon.

2.4.2. Determination of Dynamic Adsorption Capacity

The dry activated carbon was accurately weighed about 10 g, which was recorded as mc. The activated carbon was ultrasonicated and stirred until there were no bubbles, stood overnight, and fully soaked. The upper liquid of the activated carbon was removed carefully, and the volume and mass of the wet activated carbon were recorded at this time, which was recorded as Vt and mt, respectively. Calculate the water phase ratio of the activated carbon chromatographic column by the following formula:
Rw(%) = (mt − mc)/(ρ∗Vt)
The ρ is the density of distilled water. The mc is the mass of dry activated carbon. The Vt and mt are the volume and mass of wet activated carbon, respectively.
The volume of the pretreated activated carbon column was measured, which was recorded as Vc. The 2′-FL standard solution with a concentration of 10 g/L was used to rinse the activated carbon column at a certain rate. The filtrate was collected in a tube every 0.1 bed volume, and the concentration of 2′-FL respectively was measured by HPLC. When 2′-FL was detected, the total volume of 2′-FL standard solution used from the beginning of rinsing to the end of collecting the previous tube of the filtrate was recorded as Vs, and the calculation formula of dynamic adsorption capacity is:
Qd(g/mL) = (Vs − Vc∗Rw)∗cs/Vc
The cs is the concentration of the 2′-FL standard solution. The Vc is the volume of activated carbon. The Vs is the adsorption volume of the 2′-FL standard solution. The Rw is the water phase ratio of the activated carbon.

2.4.3. Study on Adsorption Kinetics

Different kinetic models, such as pseudo-first-order and pseudo-second-order, were used to predict the mechanism involved in the adsorption processes [33]. In the present study, the application of the pseudo-first and pseudo-second-order models was tested for the sorption of 2′-FL from a fermentative broth onto activated charcoal.
The pseudo-first-order model was defined according to the following equation:
ln(qe − qt) = lnqe − k1t
The qt and qe are the amount of sugar adsorbed at time t and equilibrium, respectively, and k1 is the pseudo-first-order rate constant.
The pseudo-second-order equation was defined by the following equation:
t/qt = 1/k2qe2 + t/qe
The qe is the amount of sugar adsorbed at equilibrium, and k2 is the pseudo-second-order rate constant.

2.5. Liquid Phase Detection Method

Samples were analyzed by HPLC using Water Binary HPLC Pump 1525-Detector 2489 and Rezex ROA Organic Acid H+(8%) 300 × 7.8 mm Phenomenex. The mobile phase consisted of 5 mM dilute sulfuric acid. Elution was conducted at 0.8 mL/min flow rate, the column temperature was 50 °C, and the detector temperature was 40 °C. Before loading all samples, a nylon filter membrane with a 0.22 m pore diameter was used to filter in advance. The 2′-fucosyllactose standard was purchased from Glycarbo Co. Ltd., Takamatsu, Japan, with a purity ≥ 95%; the glucose, lactose, galactose, and acetic acid standard was purchased from Sigma-Aldrich LLC., America, with a purity ≥ 98%.

2.6. Qualitative and Quantitative Analysis of Protein

The SDS-PAGE method was used for protein characterization, and all electrophoresis equipment was purchased from BIO-RAD (Bio-Rad Laboratories, Inc., Hercules, CA, USA). The protein was quantified by the Kjeldahl method. The test results of all fermentation broth were subtracted from the test results of undigested fermentation broth to eliminate the inorganic nitrogen in the fermentation broth. The K1160 automatic Kjeldahl nitrogen analyzer (Hanon Advanced Technology Group Co., Ltd., Jinan, Shandong, China) was used as the instrument and equipment.

3. Results

3.1. Fermentation Results

After 96 h of fermentation in a 30 L fermentor, the fermentation liquid rich in 2′-FL can be obtained. After simple determination, its parameters are shown in Table 2.
The results showed that the initial state of the fermentation broth was neutral and its conductivity was high, which meant that the fermentation broth contained many buffer salts. In addition, the lactose residue of the substrate was about 0.45 g/L, which was the main impurity and needed continuous attention in the subsequent purification process. Galactose and acetic acid, as by-products of E. coli substrate utilization and diversion metabolite of sugar, also had high contents in the fermentation broth. The protein residue was mainly produced by the aging and cracking of bacteria, which was higher in the initial fermentation liquid. After inactivation, flocculation, and filtration, the content decreased slightly (by about 0.02 mg/mL), indicating that the flocculation precipitation method had a certain effect on protein removal.

3.2. Effect of Different Pore Size Membranes on Purification of Fermentation Broth by Membrane Filtration

After being filtered by the first 0.1 μm pore diameter microfiltration membrane, it was ensured that there were no granular impurities in the fermentation liquid. Then, the filtrate was passed through the ultrafiltration membrane with different pore diameters to remove protein and polysaccharide impurities. The electrophoresis results (Figure 1) showed that the cell proteins were all macromolecular proteins with over 100 KDa molecular weight, and obvious protein aggregation was observed at the concentration of 34 KDa and 14 KDa. Therefore, three filter membranes below 10,000 Da with different concentrations were chosen to remove the residual proteins in the fermentation broth.
The results (Figure 2a) showed that the larger the pore diameter of the membrane was, the slower the attenuation of the filtration rate was, and the greater the flux was at the same time. After 4 h of continuous operation, the filtration rate of the 1000 Da filter membrane decreased to 39.6% of the initial filtration rate, while that of the 10,000 Da filter membrane remained at 70.7%. However, the protein determination results (Figure 2b) showed that the filter membrane with a large pore size led to more protein impurities passing through the filter membrane, reducing the efficiency of impurity removal. At the same time, the filter membrane with a small pore size can intercept more protein impurities; however, when the pore size was smaller, the interception rate of the target 2′-FL became higher, leading to a significant decline in the recovery ratio, which was undesired. Therefore, within the acceptable recovery ratio, a small pore-size ultrafiltration membrane should be used to remove protein. Preferably, the 3000 Da membrane performs best in this test.
After impurity removal of the first two filter membranes, the function of the third filter membrane was to intercept the target product 2′-FL, remove the substrate lactose with a molecular weight lower than the target and other monosaccharides such as glucose and galactose, and remove most of the small molecules of inorganic salts. Since the molecular weight of target 2′-FL is 488.44, a membrane with a molecular cutting weight slightly greater than the molecular weight of the target was chosen. The experimental results (Figure 2c) showed that the 500 Da membrane had the best retention effect, with a recovery ratio of more than 97%, but at the same time, the residual ratio of lactose was 86.4%, which could only remove a small amount of lactose. Meanwhile, the conductivity is also higher than the membrane with a larger molecular weight, indicating that more inorganic salts are retained. The 600 Da filter membrane had a better effect on removing small molecular impurities such as lactose and inorganic salts than the 500 Da filter membrane, at the cost of losing a part of the product recovery (about 5%). Filter membranes with a higher molecular weight of retention, such as 700 Da, had a worse retention effect on products and lactose and could hardly intercept products (about 18.5%). Therefore, 600 Da and 500 Da had better effects in this experiment. The difference was that 500 Da had a better product retention effect, and 600 Da had a better impurity removal effect. The specific selection needed to be comprehensively considered in combination with the subsequent purification steps.

3.3. Determination of Elution Conditions of Activated Carbon Column

The results of linear ethanol elution are shown in Figure 3a. The component with the highest conductivity was collected in tubes 5–7, and the component with the highest UV280 response value was collected in tubes 6–10. It indicated that the main impurities in the sample solution, inorganic salts and proteins, were first eluted. Subsequently, with the increase of ethanol concentration, other substances with absorption peaks at 280 nm were eluted. The elution results of product 2′-FL and other sugars are shown in Figure 3b. Glucose and galactose were detected in tubes 6–9, while the ethanol concentration was 4–6%, and the elution width was 1 bed volume (BV). Lactose was detected in tubes 14–23 with 9.3–15.3% of the elution concentration and 2.2 BV of the elution width. The product 2′-FL was detected in tanks 22–37; in the meantime, the ethanol concentration was 14.7–25.7%, and the elution width was 3.4 BV. Therefore, we think that the ethanol elution concentration of monosaccharide is 4%, that of lactose is 9.3%, and that of 2′-FL is 14.7%.
According to the linear elution results, we redesigned the elution procedure: 4 BV was eluted with pure water; 4 BV was eluted with 10% ethanol; 4 BV was eluted with 15% ethanol; the chromatographic column was regenerated with 80% ethanol; pure water was balanced. The eluate was collected throughout the process by one tube with 0.2 BV, and the concentration of sugar was detected by HPLC. The results are shown in Figure 4. Monosaccharides and lactose were eluted in pure water and 10% ethanol eluent, respectively. 2′-FL was eluted in 15% ethanol solution (recovery ratio was 87.3 ± 2.15%) and concentrated in 8–10 BV, indicating that the elution concentration was appropriate.
In addition, the experiment was repeated. The collection frequency of eluent was increased, the components were measured, and the product purity was calculated in the collected solution by using the area normalization method. The relationship between each tube’s product purity and the product recovery ratio was determined when the tube was collected (Figure 5). It was found that the product was detected after 1 BV was eluted with 15% ethanol, and its purity was 76.8%. Then the product purity reached its peak at 99%. The product purity gradually decreased, and the rate of decline increased. After 2.6 BV was eluted, almost no product was detected, indicating that the product had been eluted. The eluent with more than 75% purity was collected, while the eluent width was 9–10.4 BV. After recovery, it was used as the refined product of 2′-FL. The purity was 90.09 ± 2.74%, and the recovery ratio was 77.92 ± 4.02%.

3.4. Study on Adsorption Capacity and Kinetics of Activated Carbon

The static and dynamic adsorption capacity of activated carbon is an important basis for the loading range of the activated carbon chromatographic column. The static adsorption experiment results (Figure 6a) showed that the activated carbon was close to the maximum load after static adsorption for 2 h, which was about 47.52 ± 0.92 mg/g, and then gradually tended to balance. Dynamic adsorption results (Figure 6b) showed that the adsorption capacity was the highest when the product concentration reached 20–40 g/L. Interestingly, when the concentration of 2′-FL exceeded 40 g/L, the product concentration increased as the adsorption capacity decreased, which was different from our expectation. It is speculated that this may be due to the competitive adsorption effect between other oligosaccharides and the product due to the higher concentration of the product and the corresponding increase of the impurity concentration. Studies on different elution rates showed that when the elution rate was 0.25 BV, there was a maximum adsorption capacity of about 19.98 ± 0.21 mg/mL. Therefore, the maximum loading capacity was set based on 90% of the maximum dynamic adsorption capacity, i.e., 17.98 mg/mL. At the same time, the product concentration should also be within the range of 20–40 g/L so that the activated carbon chromatographic column can fully absorb the product.
The simulation results (Figure 7) of adsorption kinetics showed that the pseudo-second-order model seems to describe the 2′-FL adsorption mechanism better because the coefficients of determination (R2) obtained were higher compared to the ones obtained for the pseudo-first-order model. The equilibrium capacity q2 determined by the model was basically consistent with the experimental qe value (Table 3).

4. Discussion

Given the maturity of the membrane filtration process in recent years, it has gradually become the preferred process for the industrial separation of polysaccharides or oligosaccharides. In this study, membrane filtration technology was used to separate and purify human milk oligosaccharides produced by biological fermentation. Similar studies have not been seen, and the advantages of doing so are obvious. First of all, the membrane filtration process has high throughput characteristics and can better meet the needs of large-scale industrial preparation, which is not available in other purification technologies such as gel filtration or ion exchange chromatography. Moreover, membrane filtration can integrate three steps of concentration, desalination, and impurity removal by selecting the appropriate type of membrane in the impurity removal process. Hence, higher purification efficiency, higher recovery ratio, and lower production cost are expected, which is extremely important in industrialization. For the selection of membrane modules, this study only lists some attempts. In consideration of membrane pore size and molecular weight cut-off only, 3000 Da membrane modules can meet the requirements of product recovery and impurity removal simultaneously, while the selection of 500 Da and 600 Da membrane modules needs to be determined according to the subsequent purification process. If the subsequent process has a strong ability to remove salt and disaccharides, we can choose a 500 Da membrane with a smaller molecular weight to have a higher recovery. On the contrary, a part of the recovery ratio will be sacrificed for higher product quality. In addition, for some composite membranes, such as the GE 1812 type, although the molecular weight cutoff is 1000 Da, there is an additional interception effect on uncharged sugars in the aqueous solution, which will result in higher 2′-FL recovery than the typical 1000 Da membrane modules, while guaranteeing the same desalination and organic acid removal effects as them (data not shown).
For the fermentation industry, especially for the products whose titer is difficult to improve, simplifying the purification process represents a high recovery ratio and low production cost. However, a single purification process is often difficult to meet the basic qualification requirements, or it is necessary to sacrifice the product recovery ratio to significantly increase production costs. We tried to purify 2′-FL only by membrane filtration. After multi-stage purification, we could get a product with a purity higher than 95%, but the recovery ratio was less than 1% (data not shown). Therefore, it is the best choice to combine with other methods of refining oligosaccharides to obtain high-quality products. Figure 8 shows the flow chart of the best purification process and the recovery ratio and product purity of 2′-FL after each process treatment in this study.
Sugars are physically adsorbed onto the activated charcoal in a reversible process due to Vander Walls’ forces [34]. The major surface area of the activated charcoal is non-polar or hydrophobic [35]. Therefore, the more hydrophobic the solute is, the more adsorbed it will be. Compared with monosaccharides and disaccharides, oligosaccharides are more hydrophobic, so this feature can be used to separate the target oligosaccharides from smaller impurities. In this study, activated carbon showed excellent performance: when pure water was eluted, the residual inorganic salts were almost completely eluted; under the elution of 10% ethanol, both monosaccharide and lactose are completely eluted; the product can be eluted by 15% ethanol. From the perspective of adsorption capacity, the 100 L activated carbon column can achieve the purification of 2′-FL at the kilogram level. Later, extensive screening and modification research will be carried out on the activated carbon filler, which is likely to result in higher adsorption capacity, and even the production of 2′-FL at the kilogram level can be completed at the laboratory level. In addition, after the removal of macromolecular impurities by membrane filtration, the flux of the activated carbon fixed bed is guaranteed, and the sedimentation of macromolecular proteins or polysaccharides will not occur under the leaching of high-concentration ethanol, thus affecting the regeneration effect of activated carbon. This phenomenon is not easy to be found in the laboratory level preparation but is particularly obvious in the scale-up process. This process makes up for the shortcomings of the industrial application of activated carbon fixed beds, namely, the difficulty of regeneration and recovery and the instability of flux. Another problem with activated carbon is the instability of the batch. The adsorption capacity and adsorption characteristics of different batches of activated carbon may vary greatly, which is also an important problem limiting the industrial application of activated carbon. Therefore, it is particularly important to regenerate and reuse.

5. Conclusions

In this study, the product 2′-FL with a purity higher than 90.09% was finally obtained after three-stage membrane filtration and elution by the activated carbon chromatography column. For the selection of membrane pore size, 3000 Da and 500 Da are more appropriate choices. One can effectively remove macromolecular impurities, and the other can effectively remove small molecular impurities while ensuring a certain flux. The activated carbon chromatography process should select 10% ethanol to elute monosaccharide impurities and collect the product 2′-FL eluted by 15% ethanol. The sample loading should be less than 17.98 mg/mL, and the adsorption model should conform to the pseudo-second-order model. In little words, this study described a simple combined process to purify 2′-FL produced by biological fermentation. This collaborative process was completed based on a pilot scale test and had the scale-up feasibility and potential for industrial production.

Author Contributions

Conceptualization, S.W. and Y.W.; methodology, Y.W., J.H. and M.S.; software, Y.W.; data curation, Y.W.; writing—original draft preparation, Y.W.; writing—review and editing, B.P. and S.W.; project administration, S.W. All authors have read and agreed to the published version of the manuscript.

Funding

This research received no external funding.

Institutional Review Board Statement

Not applicable.

Informed Consent Statement

Not applicable.

Data Availability Statement

Not applicable.

Acknowledgments

Thanks to Huan Lv for his help in experimental technology and equipment maintenance.

Conflicts of Interest

The authors declare no conflict of interest.

References

  1. Thurl, S.; Munzert, M.; Boehm, G.; Matthews, C.; Stahl, B. Systematic review of the concentrations of oligosaccharides in human milk. Nutr. Rev. 2017, 75, 920–933. [Google Scholar] [CrossRef] [PubMed] [Green Version]
  2. Bode, L. Human milk oligosaccharides: Prebiotics and beyond. Nutr. Rev. 2009, 67, S183–S191. [Google Scholar] [CrossRef] [PubMed]
  3. Castanys-Muñoz, E.; Martin, M.J.; Prieto, P.A. 2′-fucosyllactose: An abundant, genetically determined soluble glycan present in human milk. Nutr. Rev. 2013, 71, 773–789. [Google Scholar] [CrossRef]
  4. Bode, L.; Jantscher-Krenn, E. Structure-function relationships of human milk oligosaccharides. Adv. Nutr. 2012, 3, 383S–391S. [Google Scholar] [CrossRef] [Green Version]
  5. Marcobal, A.; Barboza, M.; Froehlich, J.W.; Block, D.E.; German, J.B.; Lebrilla, C.B.; Mills, D.A. Consumption of Human Milk Oligosaccharides by Gut-Related Microbes. J. Agr. Food Chem. 2010, 58, 5334–5340. [Google Scholar] [CrossRef] [PubMed] [Green Version]
  6. Goehring, K.C.; Marriage, B.J.; Oliver, J.S.; Wilder, J.A.; Barrett, E.G.; Buck, R.H. Similar to Those Who Are Breastfed, Infants Fed a Formula Containing 2′-Fucosyllactose Have Lower Inflammatory Cytokines in a Randomized Controlled Trial. J. Nutr. 2016, 146, 2559–2566. [Google Scholar] [CrossRef] [Green Version]
  7. He, Y.; Liu, S.; Kling, D.E.; Leone, S.; Lawlor, N.T.; Huang, Y.; Feinberg, S.B.; Hill, D.R.; Newburg, D.S. The human milk oligosaccharide 2′-fucosyllactose modulates CD14 expression in human enterocytes, thereby attenuating LPS-induced inflammation. Gut 2015, 65, 33–46. [Google Scholar] [CrossRef] [Green Version]
  8. Castillo-Courtade, L.; Han, S.; Lee, S.; Mian, F.M.; Buck, R.; Forsythe, P. Attenuation of food allergy symptoms following treatment with human milk oligosaccharides in a mouse model. Allergy 2015, 70, 1091–1102. [Google Scholar] [CrossRef]
  9. Li, A.; Li, Y.; Zhang, X.; Zhang, C.; Li, T.; Zhang, J.; Li, C. The human milk oligosaccharide 2′-fucosyllactose attenuates beta-lactoglobulin-induced food allergy through the miR-146a-mediated toll-like receptor 4/nuclear factor-kappaB signaling pathway. J. Dairy Sci. 2021, 15, 100668. [Google Scholar] [CrossRef]
  10. Kong, C.; Elderman, M.; Cheng, L.; Haan, B.J.; Nauta, A.; Vos, P. Modulation of Intestinal Epithelial Glycocalyx Development by Human Milk Oligosaccharides and Non-Digestible Carbohydrates. Mol. Nutr. Food Res. 2019, 63, 1900303. [Google Scholar] [CrossRef]
  11. Wang, Y.; Zou, Y.; Wang, J.; Ma, H.; Zhang, B.; Wang, S. The Protective Effects of 2′-Fucosyllactose against E. Coli O157 Infection Are Mediated by the Regulation of Gut Microbiota and the Inhibition of Pathogen Adhesion. Nutrients 2020, 12, 1284. [Google Scholar] [CrossRef] [PubMed]
  12. Ruiz-Palacios, G.M.; Cervantes, L.E.; Ramos, P.; Chavez-Munguia, B.; Newburg, D.S. Campylobacter jejuni Binds Intestinal H(O) Antigen (Fucα1, 2Galβ1, 4GlcNAc), and Fucosyloligosaccharides of Human Milk Inhibit Its Binding and Infection. J. Biol. Chem 2003, 278, 14112–14120. [Google Scholar] [CrossRef] [PubMed] [Green Version]
  13. Fleming, S.A.; Mudd, A.T.; Hauser, J.; Yan, J.; Metairon, S.; Steiner, P.; Donovan, S.M.; Dilger, R.N. Human and Bovine Milk Oligosaccharides Elicit Improved Recognition Memory Concurrent With Alterations in Regional Brain Volumes and Hippocampal mRNA Expression. Front. Neurosci. 2020, 14, 770. [Google Scholar] [CrossRef] [PubMed]
  14. Wang, J.; Hu, J.; Song, Y.; Yin, J.; Wang, Y.; Peng, B.; Zhang, B.; Liu, J.; Dong, L.; Wang, S. 2′-Fucosyllactose Ameliorates Oxidative Stress Damage in d-Galactose-Induced Aging Mice by Regulating Gut Microbiota and AMPK/SIRT1/FOXO1 Pathway. Foods 2022, 11, 151. [Google Scholar] [CrossRef]
  15. Elison, E.; Vigsnaes, L.K.; Krogsgaard, L.R.; Rasmussen, J.; Sorensen, N.; McConnell, B.; Hennet, T.; Sommer, M.O.A.; Bytzer, P. Oral supplementation of healthy adults with 2-O-fucosyllactose and lacto-N-neotetraose is well tolerated and shifts the intestinal microbiota. Brit. J. Nutr. 2016, 116, 1356–1368. [Google Scholar] [CrossRef] [Green Version]
  16. Salli, K.; Anglenius, H.; Hiryonen, J.; Hibberd, A.A.; Ahonen, I.; Saarinen, M.T.; Tiihonen, K.; Maukonen, J.; Ouwehand, A.C. The effect of 2′-fucosyllactose on simulated infant gut microbiome and metabolites; a pilot study in comparison to GOS and lactose. Sci. Rep. 2019, 9, 13232. [Google Scholar] [CrossRef] [Green Version]
  17. Warren, C.D.; Chaturvedi, P.; Newburg, A.R.; Oftedal, O.T.; Tilden, C.D.; Newburg, D.S. Comparison of oligosaccharides in milk specimens from humans and twelve other species. Adv. Exp. Med. Biol. 2001, 501, 325. [Google Scholar] [CrossRef]
  18. Erney, R.M.; Malone, W.T.; Skelding, M.B.; Marcon, A.A.; Kleman-Leyer, K.M.; O’Ryan, M.L.; Ruiz-Palacios, G.; Hilty, M.D.; Pickering, L.K.; Prieto, P.A. Variability of human milk neutral oligosaccharides in a diverse population. J. Pediatr. Gastroenterol. Nutr. 2000, 30, 181–192. [Google Scholar] [CrossRef]
  19. Reverri, E.; Devitt, A.; Kajzer, J.; Baggs, G.; Borschel, M. Review of the Clinical Experiences of Feeding Infants Formula Containing the Human Milk Oligosaccharide 2′-Fucosyllactose. Nutrients 2018, 10, 1346. [Google Scholar] [CrossRef] [Green Version]
  20. Zhou, W.; Jiang, H.; Wang, L.; Liang, X.; Mao, X. Biotechnological Production of 2′-Fucosyllactose: A Prevalent Fucosylated Human Milk Oligosaccharide. ACS Synth. Biol. 2021, 10, 447–458. [Google Scholar] [CrossRef]
  21. Priem, B.; Gilbert, M.; Wakarchuk, W.W.; Heyraud, A.; Samain, E. A new fermentation process allows large-scale production of human milk oligosaccharides by metabolically engineered bacteria. Glycobiology 2002, 12, 235–240. [Google Scholar] [CrossRef]
  22. Lagergren, S. About the theory of so-called adsorption of solution substances. Kungliga Svenska Vetenskapsakademiens Handlingar Band 1998, 24, 1–39. [Google Scholar]
  23. Nobre, C.; Teixeira, J.A.; Rodrigues, L.R. Fructo-oligosaccharides purification from a fermentative broth using an activated charcoal column. N. Biotechnol. 2012, 29, 395–401. [Google Scholar] [CrossRef] [Green Version]
  24. Morales, V.; Sanz, M.L.; Olano, A.; Corzo, N. Rapid separation on activated charcoal of high oligosaccharides in honey. Chromatographia 2006, 64, 233–238. [Google Scholar] [CrossRef]
  25. Mohammad, A.W.; Ng, C.Y.; Lim, Y.P.; Ng, G.H. Ultrafiltration in Food Processing Industry: Review on Application, Membrane Fouling, and Fouling Control. Food Bioprocess. Technol. 2012, 5, 1143–1156. [Google Scholar] [CrossRef]
  26. Nabarlatz, D.; Torras, C.; Garcia-Valls, R.; Montane, D. Purification of xylo-oligosaccharides from almond shells by ultrafiltration. Sep. Purif. Technol. 2007, 53, 235–243. [Google Scholar] [CrossRef]
  27. Sen, D.; Sarkar, A.; Das, S.; Chowdhury, R.; Bhattacharjee, C. Batch Hydrolysis and Rotating Disk Membrane Bioreactor for the Production of Galacto-oligosaccharides: A Comparative Study. Ind. Eng. Chem. Res. 2012, 51, 10671–10681. [Google Scholar] [CrossRef]
  28. Sen, D.; Sarkar, A.; Gosling, A.; Gras, S.L.; Stevens, G.W.; Kentish, S.E.; Bhattacharya, P.K.; Barber, A.R.; Bhattacharjee, C. Feasibility study of enzyme immobilization on polymeric membrane: A case study with enzymatically galacto-oligosaccharides production from lactose. J. Membr. Sci. 2011, 378, 471–478. [Google Scholar] [CrossRef]
  29. Goulas, A.K.; Kapasakalidis, P.G.; Sinclair, H.R.; Rastall, R.A.; Grandison, A.S. Purification of oligosaccharides by nanofiltration. J. Membr. Sci. 2002, 209, 321–335. [Google Scholar] [CrossRef]
  30. Cordova, A.; Astudillo, C.; Santibanez, L.; Cassano, A.; Ruby-Figueroa, R.; Illanes, A. Purification of galacto-oligosaccharides (GOS) by three-stage serial nanofiltration units under critical transmembrane pressure conditions. Chem. Eng. Res. Des. 2017, 117, 488–499. [Google Scholar] [CrossRef]
  31. Gulec, H.A.; Topacli, A.; Topacli, C.; Albayrak, N.; Mutlu, M. Modification of cellulose acetate membrane via low-pressure plasma polymerization for sugar separation applications: Part I. Membrane development and characterization. J. Membr. Sci. 2010, 350, 310–321. [Google Scholar] [CrossRef]
  32. Kuhn, R.C.; Palacio, L.; Pradanos, P.; Hernandez, A.; Maugeri, F. Selection of membranes for purification of fructooligosaccharides. Desalin. Water Treat. 2011, 27, 18–24. [Google Scholar] [CrossRef]
  33. Ho, Y.S.; McKay, G. Pseudo-second order model for sorption processes. Process. Biochem. 1999, 34, 451–465. [Google Scholar] [CrossRef]
  34. Hung, Y.T.; Lo, H.H.; Wang, L.K.; Taricska, J.R.; Li, K.H. Granular Activated Carbon Adsorption. In Physicochemical Treatment Processes; Wang, L.K., Hung, Y.T., Shammas, N.K., Eds.; Handbook of Environmental Engineering; Humana Press: Totowa, NJ, USA, 2005; Volume 3. [Google Scholar] [CrossRef]
  35. Nikolic, C.J.; Marion, L.; Larocque, R.; Jam, M.; Jouanneau, D.; Cladiere, L.; Le Gall, S.; Fanuel, M.; Desban, N.; Rogniaux, H.; et al. Systematic comparison of eight methods for preparation of high purity sulfated fucans extracted from the brown alga Pelvetia canaliculata. Int. J. Biol. Macromol. 2022, 201, 143–157. [Google Scholar] [CrossRef] [PubMed]
Figure 1. Results of fermentation supernatant protein after 48 h and 96 h fermentation.
Fermentation 08 00655 g001
Figure 2. Filtration results from different membrane modules. (a) Results of flux changes with time for membrane modules with different pore diameters; (b) Ratio of recovery of different substances filtered by different ultrafiltration membranes; (c) Conductivity of residual solution filtered by different nanofiltration membranes; (d) Ratio of recovery of different substances filtered by different nanofiltration membranes.
Fermentation 08 00655 g002
Figure 3. Results of linear elution of activated carbon by ethanol (by green line, concentration). (a) Conductivity (orange line, values on left axes in mS/cm) and UV280 absorbancy (blue line, right axes in mAU) vs. eluate volume (mL or number of sample tubes on horizontal axes); (b) Concentration of various sugars and ethanol concentration (green line) vs. eluate volume (number of sample tubes).
Fermentation 08 00655 g003
Figure 4. Results of gradient elution of activated carbon with ethanol (by green line, concentration) after optimization. (a) Conductivity (orange line, values on left axes in mS/cm) and UV280 absorbancy (blue line, right axes in mAU) vs. eluate volume (mL or number of sample tubes on horizontal axes); (b) Concentration of various sugars and ethanol concentration (green line) vs. eluate volume (number of bed volume).
Fermentation 08 00655 g004
Figure 5. Relationship between product purity and recovery ratio in product elution process.
Fermentation 08 00655 g005
Figure 6. Static adsorption and dynamic adsorption results of activated carbon. (a) Static adsorption; (b) dynamic adsorption on the feed concentration of 2′-FL with 10 g/L.
Fermentation 08 00655 g006
Figure 7. Linearized data of the pseudo-first-order kinetic model and the pseudo-second-order kinetic model. The solid line in this figure is the connecting line of the measured value, and the dotted line is the fitting straight line. (a) The pseudo-first-order kinetic model; (b) The pseudo-second-order kinetic model.
Fermentation 08 00655 g007
Figure 8. Flow chart of the optimal combination process and the recovery rate and product purity of 2′-FL after each process treatment.
Fermentation 08 00655 g008
Table 1. Detailed Information of Filter Membrane 1.
TypePore Size or MWCOMaterial 2Membrane Area (m2)Flux (m3m−2d−1)Upper Pressure Limit (MPa)Temperature (°C)
Microfiltration0.1 μmPVDF0.335.450.815–50
Ultrafiltration10,000 DaPES0.333.640.815–50
Ultrafiltration3000 DaPES0.332.300.815–50
Ultrafiltration1000 DaPES0.331.820.815–50
Nanofiltration700 DaPES/PA0.331.391.515–50
Nanofiltration600 DaPES/PA0.331.151.515–50
Nanofiltration500 DaPES/PA0.331.031.515–50
1 Filter membrane parameters are measured under pure water conditions. The pressure difference between microfiltration and ultrafiltration under test conditions is 0.05 MPa, and that of nanofiltration is 0.1 MPa. 2 All filter membranes are made of composite materials, and their main materials and abbreviations are as follows: PVDF, polyvinylidene difluoride; PES, polyethersulfone; PA, polyamide.
Table 2. Initial Parameters of Fermentation Broth.
Physical and Chemical Parameters
pH6.87 ± 0.03
Conductivity11.00 ± 0.11 ms/cm
Dry cell weight (DCW) 29.68 ± 3.17 mg/mL
Main Components
2′-FL8.40 ± 0.48 mg/mL
Lactose0.45 ± 0.15 mg/mL
Glucose0.28 ± 0.28 mg/mL
Galactose0.15 ± 0.05 mg/mL
Acetic acid0.45 ± 0.32 mg/mL
Protein0.24 ± 0.04 mg/mL
Table 3. Coefficients of determination of the linearized pseudo-first and pseudo-second-order models and the respective modeled and experimental parameters.
Pseudo-First-OrderExperimental qe (mg g−1)
k1 (min−1)q1 (mg g−1)R2
0.029517.470.920649.20
Pseudo-Second-OrderExperimental qe (mg g−1)
k2 (min−1)q2 (mg g−1)R2
0.020149.750.999749.20
Publisher’s Note: MDPI stays neutral with regard to jurisdictional claims in published maps and institutional affiliations.

