Article

Optimization of Medium Components for Fed-Batch Fermentation Using Central Composite Design to Enhance Lichenysin Production by Bacillus licheniformis Ali5

1
Beijing Advanced Innovation Center for Food Nutrition and Human Health, Beijing Technology & Business University (BTBU), Beijing 100048, China
2
School of Light Industry, Beijing Technology & Business University (BTBU), Beijing 100048, China
*
Author to whom correspondence should be addressed.
These authors contributed equally to this work.
Fermentation 2022, 8(12), 712; https://doi.org/10.3390/fermentation8120712
Submission received: 2 November 2022 / Revised: 1 December 2022 / Accepted: 2 December 2022 / Published: 6 December 2022
(This article belongs to the Section Microbial Metabolism, Physiology & Genetics)

Abstract

:
Lichenysin, an amphiphilic biosurfactant with structural and physicochemical properties similar to surfactin, is produced by Bacillus licheniformis. Its low toxicity, good environmental compatibility, solubilization, foaming, emulsification and detergent activities have led to a wide range of applications in agricultural biocontrol, enhanced oil recovery, foaming agents for cosmetics and detergents for household cleaning products. However, despite the extraordinary surface-active properties and potential applications of lichenysin, the number of wild bacteria found so far is relatively low. Low titers and high costs are the main limiting factors for widespread industrial applications. In this study, a factorial design was used to optimize the composition of the medium for the production of lichenysin by Bacillus licheniformis Ali5. Firstly, the solutions of carbon, nitrogen, amino acids, inorganic salts and trace elements in the medium were evaluated in flasks using a single-factor optimization method. Meanwhile, the operating conditions were optimized in the same way. Afterwards, a partial factorial design was used to investigate the effect of six variables (five medium compositions and inoculum size) on lichenysin production. Based on the results obtained, the concentrations of sucrose and ammonium nitrate and the inoculum size were considered to be important for lichenysin production. Subsequently, a full factorial design was used to optimize these three variables. The optimized medium composition were sucrose 19.8 g/L, NH4NO3 3.9 g/L, K2HPO4·3H2O 4.0 g/L, MgSO4·7H2O 0.6 g/L, FeSO4·7H2O 0.1 g/L, CaCl2 0.01 g/L, NaCl 3.0, trace elements 1.2 mL/L. Finally, the titer of lichenysin after fed-batch fermentation reached 1425.85 mg/L, which was approximately 5.5 times higher than the titer of lichenysin from the original medium. Consequently, the method was further demonstrated to be suitable for lichenysin production.

1. Introduction

Biosurfactants are surface-active compounds produced by a variety of animals, plants and microorganisms [1]. Based on the chemical composition of biosurfactants and the types of microorganisms that produced them, biosurfactants are divided into five major groups, namely glycolipids, lipopeptides and lipoproteins, phospholipids, hydroxylated and cross-linked fatty acids, polymeric surfactants and particulate surfactants [2,3]. Currently, the most widely researched are biosurfactants produced by microorganisms (bacteria, yeast, fungi, etc.), which not only have a short culture cycle but also use waste resources to reduce production costs [2,4,5]. Five different families of lipopeptides are known to be produced by Bacillus species, namely the surfactin family, the iturin family, the fengycin family, the kurstakin family [6] and the locillomycin family [7,8]. Among them, the surfactin family is composed of surfactin, pumilacidin, and lichenysin [9]. Lichenysins were discovered in 1995 and named after the strain from which it originated, Bacillus licheniformis [10]. It is a cyclic structure consisting of a peptide chain of seven amino acids with a β-hydroxy fatty acid with 12–19 carbon atoms in a lactone bond [11,12]. It was previously reported that trace amounts of lichenysin were detected in several Chinese liquors as its antibacterial activity effectively prevented contamination by harmful microorganisms during the fermentation process [13]. However, most of the surfactants currently commercially available are synthetic or semi-synthetic, and they have low biodegradability [14]. Lichenysin exhibits higher biodegradability, lower toxicity and environmental compatibility than other biosurfactants, and they have biological activities (antibacterial, antitumor, antioxidant, etc. [15,16,17]. In addition, lichenysins are also expected to replace synthetic surfactants in the formulation of disinfectants, hand soaps and cleaning products [18,19].
Bacillus licheniformis is a Gram-positive, thermophilic bacterium widely found in the environment, plant material and soil [20]. The organism belongs to the Bacillus subtilis group and is known for its use in the production of enzymes or antibiotics [21]. Meanwhile, the spore reagents of selected strains are used as crop bioprotectants and feed additives [9]. It synthesizes lipopeptide antibiotics such as lichenysin, iturin, bacitracin and fengycin, that have the potential to inhibit the growth and biofilm formation of human and animal pathogens, mainly Gram-positive bacteria, such as Staphylococcus aureus, Listeria monocytogenes, and Bacillus cereus, and some Gram-negative bacteria, such as Escherichia coli, Salmonella typhimurium, and Aeromonas sp. [22,23,24]. Pablo R. Díaz et al. found that the lipopeptide crude extract (LF) produced by Bacillus licheniformis B6 had an antagonistic effect on foodborne pathogenic bacteria (Escherichia coli, Staphylococcus aureus, Klebsiella). Among them, LF at 9 mg/mL showed a strong inhibitory effect on Escherichia coli 4591, equivalent to that of ampicillin at 250 mg/mL [25].
In recent years, research on lichenysin production by Bacillus licheniformis has focused on both medium optimization and molecular modification of the original strain. It was reported that Yakimov and Fredrickson et al. in 1996 studied the regulation of fatty acid and β-hydroxy fatty acid synthesis by changing the culture medium and found that the addition of L-glutamic acid and L-aspartic acid increased the production of lichenysin A by 2-fold and 4-fold, respectively [26]. In 2008, Joshi and Yadav et al. optimized the growth conditions for lichenysin production by Bacillus licheniformis R2 by response surface methodology and increased lichenysin production fourfold compared to that in an unoptimized medium [27]. Similarly, Coronel-Leon and Marques et al. in 2016 applied the response surface approach to optimize an economical molasses-containing medium to enhance lichenysin production, and this new medium resulted in a fourfold increase in production compared to the unoptimized medium [28]. Despite the many advantages of biosurfactants, their scarcity and low production limit their widespread use. We need to increase the variety and titer of microbial biosurfactants by making full use of renewable resources and bracketing large production scales.
In this study, a combination of single-factor and partial factorial designs was used to initially identify the media components that affect lichenysin production and subsequently optimize the appropriate levels of media components using a central composite design. Finally, the optimal medium formulation was obtained by response surface methodology [29,30,31]. After determining the optimal media components, they were expanded using a 1 L bioreactor, while the stirring speed and aeration rate were optimized. Lastly, three fed-batch fermentations were carried out in the 1 L bioreactor to improve the production of lichenysin from Bacillus licheniformis Ali5. Meanwhile, the yields of lichenysin obtained per unit of substrate consumed, i.e., the yield Yp/s (mg/mg), were compared before and after fed-batch fermentation when the maximum lichenysin titer was reached [32]. This study provides a solid basis for the subsequent substitution of lichenysin for synthetic surfactants and industrial applications.

2. Results and Discussion

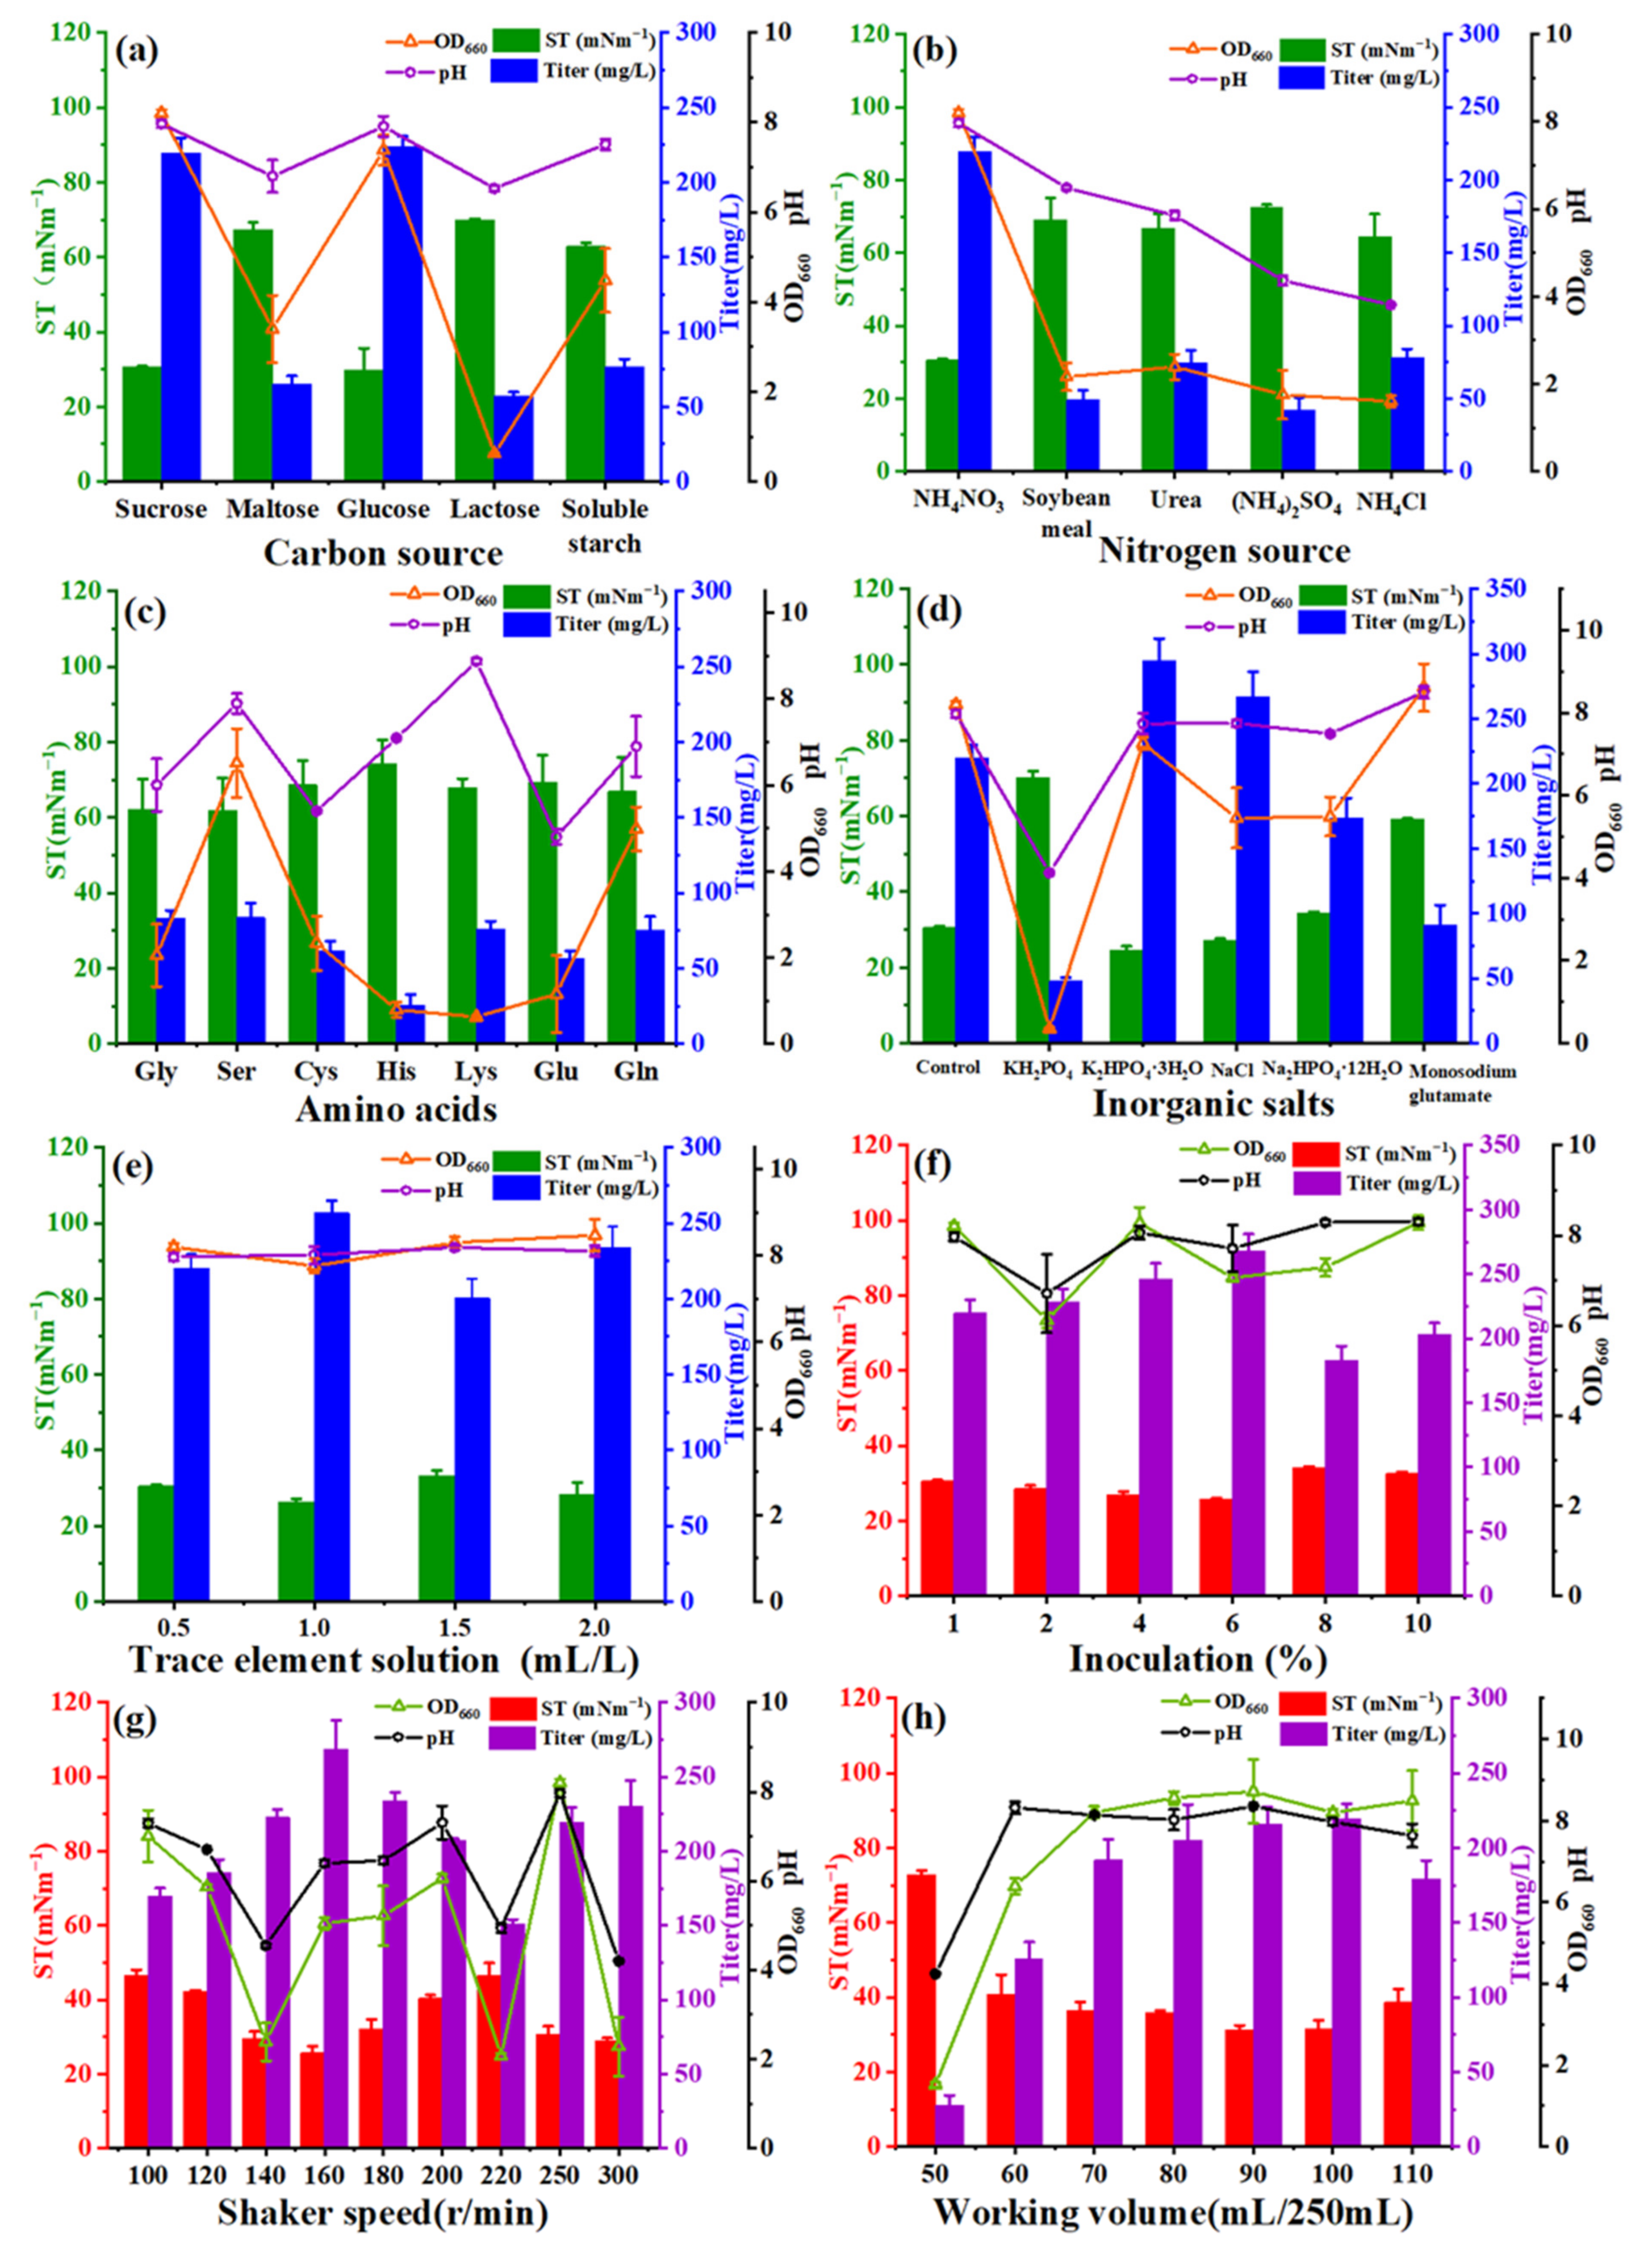
2.1. Screening of Medium Components and Cultivation Conditions by Single-Factor Method

The titer of lichenysin in the fermentation broth was quantified by high-performance liquid chromatography. A linear regression equation was established for a known concentration of surfactin: Y = 15.11X + 373.90, with a correlation coefficient R2 = 0.99, where X is the concentration of surfactin (mg/L), and Y is the peak area (mAU*s). Then, the sum of the peak areas of the samples was brought into the linear regression equation to calculate the titer of lichenysin in the samples.
The stage at which the concentration of lichenysin reached its maximum was not the same for all the different conditions tested. However, at 48 h, most microbial growth reached the end of a logarithmic phase, and a large amount of biosurfactants would be produced at this time. Therefore, the titer of lichenysin in the fermentation broth at 48 h of incubation was chosen as a criterion for screening by the one-factor method. In order to enhance the production of Bacillus licheniformis Ali5, the medium carbon source, nitrogen source, inorganic salt, and trace elements were optimized.
The choice of carbon source in the medium should satisfy both the nutritional requirements for bacterial growth and facilitate the synthesis of large quantities of lipopeptides, while also taking into account the wide range of sources of raw materials and low prices. Among different carbon sources tested (sucrose, maltose, glucose, lactose and soluble starch), highest lichenysin production was at 20 g/L glucose concentration, which has a similar effect to glucose at 20 g/L sucrose concentration (Figure 1a). When glucose and sucrose were used as carbon sources, respectively, not only did they favor the growth of bacteria, but they also promoted the production of lichenysin, while the surface tension (ST) decreased significantly. However, with maltose, lactose and soluble starch as carbon sources, the concentration of lichenysin in the medium was all below 100 mg/L, and the ST was higher than 50 mNm−1 (milli newton meter−1). This result was in contrast to Namir I et al., who studied the effect of seven carbon sources, including maltose, on the production of surfactin by Bacillus subtilis HSO121 and found that maltose was the best carbon source [30]. However, Ghribi et al. reported that Bacillus subtilis SPB1 was capable of producing lipopeptides using various carbon sources such as glucose, sucrose, starch and glycerol, but using glucose as a carbon source seemed to be more interesting [33]. Considering the economic benefits, sucrose was more favorable for lichenysin accumulation and reduced the cost of the culture medium.
Abushady et al. [34] reported that another component other than carbon source also affected the production of surfactants, where inorganic nitrogen sources were more effective in increasing the titer of surfactants than organic nitrogen sources. NH4NO3 and NaNO3 provided higher surfactant titer compared to the other inorganic nitrogen sources used in their study, while El-Sersy [35] reported that low concentrations of (NH4)2SO4 increased surfactant production and biomass. Namir I et al. showed that among the five nitrogen sources, soybean flour was the best source of surfactin production by Bacillus subtilis HSO121, followed by NH4NO3, NaNO3, KNO3 and (NH4)2SO4 [30]. The nitrogen source in the culture medium is the source of protein, nucleic acid and other biological macromolecules in the process of bacterial growth. The effects of different nitrogen sources (inorganic and organic) on lichenysin titer were investigated. The effect of inorganic nitrogen source NH4NO3 on lichenysin production was generally better than that of organic nitrogen sources such as soybean meal powder, glycine, serine, and NH4NO3 was the most favorable nitrogen source for cell growth and lichenysin synthesis (Figure 1b,c).
As shown in Figure 1b, the titer of lichenysin was significantly higher than the other four nitrogen sources when ammonium nitrate was used as the sole nitrogen source. In addition, the concentration of lichenysin in the fermentation supernatant was almost the same when urea and NH4Cl were used as nitrogen sources, and similar for (NH4)2SO4 and soybean meal powder. However, the ST was significantly higher, and the concentration of lichenysin decreased when the above four compounds were used as nitrogen sources, probably because the substrate consumption increased with increasing biomass and the lichenysin biosurfactant acted as a secondary metabolite to provide energy for the growth of bacteria. Therefore, NH4NO3 was considered to be the most influential nitrogen source for lichenysin production.
To promote the production of lichenysin, individual hydrophilic amino acids (Gly, Ser, Cys, His, Lys, Glu, Gln) were added to the medium and their effects on lichenysin production by Bacillus licheniformis Ali5 were studied. In Figure 1c, it was clearly demonstrated that the addition of precursor amino acids required for lichenysin synthesis as organic nitrogen source exhibited different degrees of inhibition of B. licheniformis Ali5 bacterial growth and lichenysin secretion. As previously reported that supplementation with extracellular amino acids inhibited lichenysin production. It was hypothesized that biosynthesis of lichenysin under amino acid-rich conditions was inhibited by the global transcription factor CodY [36].
It was also found that phosphate and sodium salts contribute to both bacterial growth and lichenylsin production by regulating medium pH, maintaining osmotic balance and modulating membrane potential (Figure 1d). K2HPO4·3H20 and NaCl had a significant effect on lichenysin production. The main function of NaCl was to maintain the osmotic pressure and pH of the solution, which had a great influence on the growth of the bacteria and the production of products [37]. The results indicated that K2HPO4·3H2O and NaCl were advantageous for the growth of the bacteria and the accumulation of products. When K2HPO4·3H2O was added at 2.60 g/L, the concentration of 294.63 mg/L of lichenysin in the cell-free supernatant was significantly higher than that of the control group at 219.72 mg/L. In addition, the production of lichenysin was significantly promoted by the appropriate concentration of NaCl, as Qi Liu et al. reported that the biosurfactant-mediated emulsions had better salinity stability [5].
It was worth noting that, in addition to the above nutrients, the effect of trace element solutions, enriched with Fe2+, Mn2+, Ca2+, etc., on lichenysin production was researched. The results showed that the addition of 1.0 mL/L trace element solution had a good promotion effect on the production of lichenysin (Figure 1e). From Figure 1e, we clearly found that although the concentration of lichenysin was varying, the total ST values were all below 30 mNm−1. From Figure 1e,f, it was observed that the concentration of lichenysin, although different under different experimental conditions, did not vary much in terms of ST. This may be due to the fact that increasing concentration of the biosurfactant lichenysin decreases the ST until a critical micelle concentration is reached, after which the ST does not change significantly [31].
The optimization of non-nutrient factors, such as inoculum, pH, temperature, shaker speed and working volume, were essential to improve the cost-effectiveness of any given fermentation process [29]. The inoculum size, shaker speed and working volume of Bacillus licheniformis Ali5 were optimized to improve the titer of its biosurfactants.
Figure 1f showed that the amount of inoculation had a significant effect on the growth of microorganisms. The results demonstrated that the highest lichenysin titer was obtained at 6% inoculum size. According to Stanbury et al. [38], the density of the inoculum or seed culture significantly affected the duration of the lag phase, specific growth rate, biomass, spore production, quality of the final product and thus the cost of production. Thus, they well defined the production and economics of the fermentation process. As suggested by Sen and Swaminathan [39], high initial cell concentrations in the production medium might lead to rapid depletion of oxygen and other nutrients. As a result, there might be limitations in dissolved oxygen and certain nutrients, leading to low growth rates and cell concentrations. Although the concentration and ST of lichenysin at 48 h may not always be an appropriate measure under different test conditions, the fermentation cycle at 48 h is relatively short, and the microorganisms under most test conditions are in the late logarithmic growth period, i.e., the period of maximum biosurfactant production.
The effects of different shaker speeds and working volumes on lichenysin production were illustrated in Figure 1g,h. In Figure 1g, the oxygen transfer coefficient (KLa) was changed by varying the speed of the shaker to control the level of dissolved oxygen in the fermentation broth [40,41]. It was found that low dissolved oxygen levels were detrimental to the fermentation, and the lichenysin titer increased significantly with increasing dissolved oxygen levels. At a low rotation speed (100–140 rpm), dissolved oxygen in the medium decreased, KLa decreased, and lower dissolved oxygen resulted in slow bacterial growth and low lichenysin production [42,43]. The maximum production of lichenysin was observed when the rotational speed was 160 rpm. The high viscosity of lichenysin in the middle and late stages of the fermentation broth during the production of Bacillus licheniformis Ali5 biodigestion at high speed [40,44,45]. This high viscosity caused great difficulties in oxygen transfer, gas-liquid mixing and heat transfer during the fermentation process, slowing down the growth of the bacterium and reducing the production of lichenysin in the later stages [40].
As could be observed from Figure 1h, the highest concentration of lichenysin was obtained when the working volume was 100 mL. The working volume mainly affected the volumetric dissolved oxygen coefficient (KLa); the smaller the working volume, the larger the dissolved oxygen coefficient, accelerating the growth of bacteria while the rate of substrate consumption would also increase [46,47]. Too little working volume led to a lack of nutrients required for later microbial growth, and conversely, less dissolved oxygen in the medium caused slow growth of microorganisms and prolonged the fermentation cycle and lichenysin production time.
In conclusion, six factors (sucrose, ammonium nitrate, sodium chloride, K2HPO4·3H2O, trace elements and inoculum) affecting the secretion of intermediate metabolites by Bacillus licheniformis Ali5 were obtained by single-factor screening.

2.2. Screening for Significant Variables Using Partial Factorial Designs

Six main factors were identified by one-way screening, and the experimental levels of the independent variables were determined by combining the results of the one-way screening (Table S1). Table S2 shows the design matrix and the corresponding responses selected for screening the important variables for lichenysin production. These six variables were run using a 26−2 partial factorial experimental design with a total of 16 experiments. The results in Table S2 showed significant differences in the titers of lichenysin in different tests, with an overall range of 329.72 mg/L to 82.54 mg/L.
To verify the significance and adequacy of the model, the effects, sums of squares, T-values, p-values, and interactions for each variable according to its effect on lichenysin titers are shown in Table S3. A p-value less than 0.05 was considered significant at the 95% or higher confidence level. As could be seen from the results in Table S3, the p-values for sucrose and inoculum size were less than 0.05, while there was an interaction between sucrose and NH4NO3 and inoculum size, which also had p-values less than 0.05, a significant difference, so all three factors, sucrose, NH4NO3 and inoculum size, were considered to be significant variables. On the contrary, there was no significant difference between the effects of other factors on lichenysin concentration at the 95% confidence level. Lower probability values indicated a more significant effect on lichenysin production. All three significant variables, sucrose, NH4NO3 and inoculum size, had a positive effect on lichenysin production. The optimal levels of these three significant variables were further determined by response surface methodology (RSM) design.

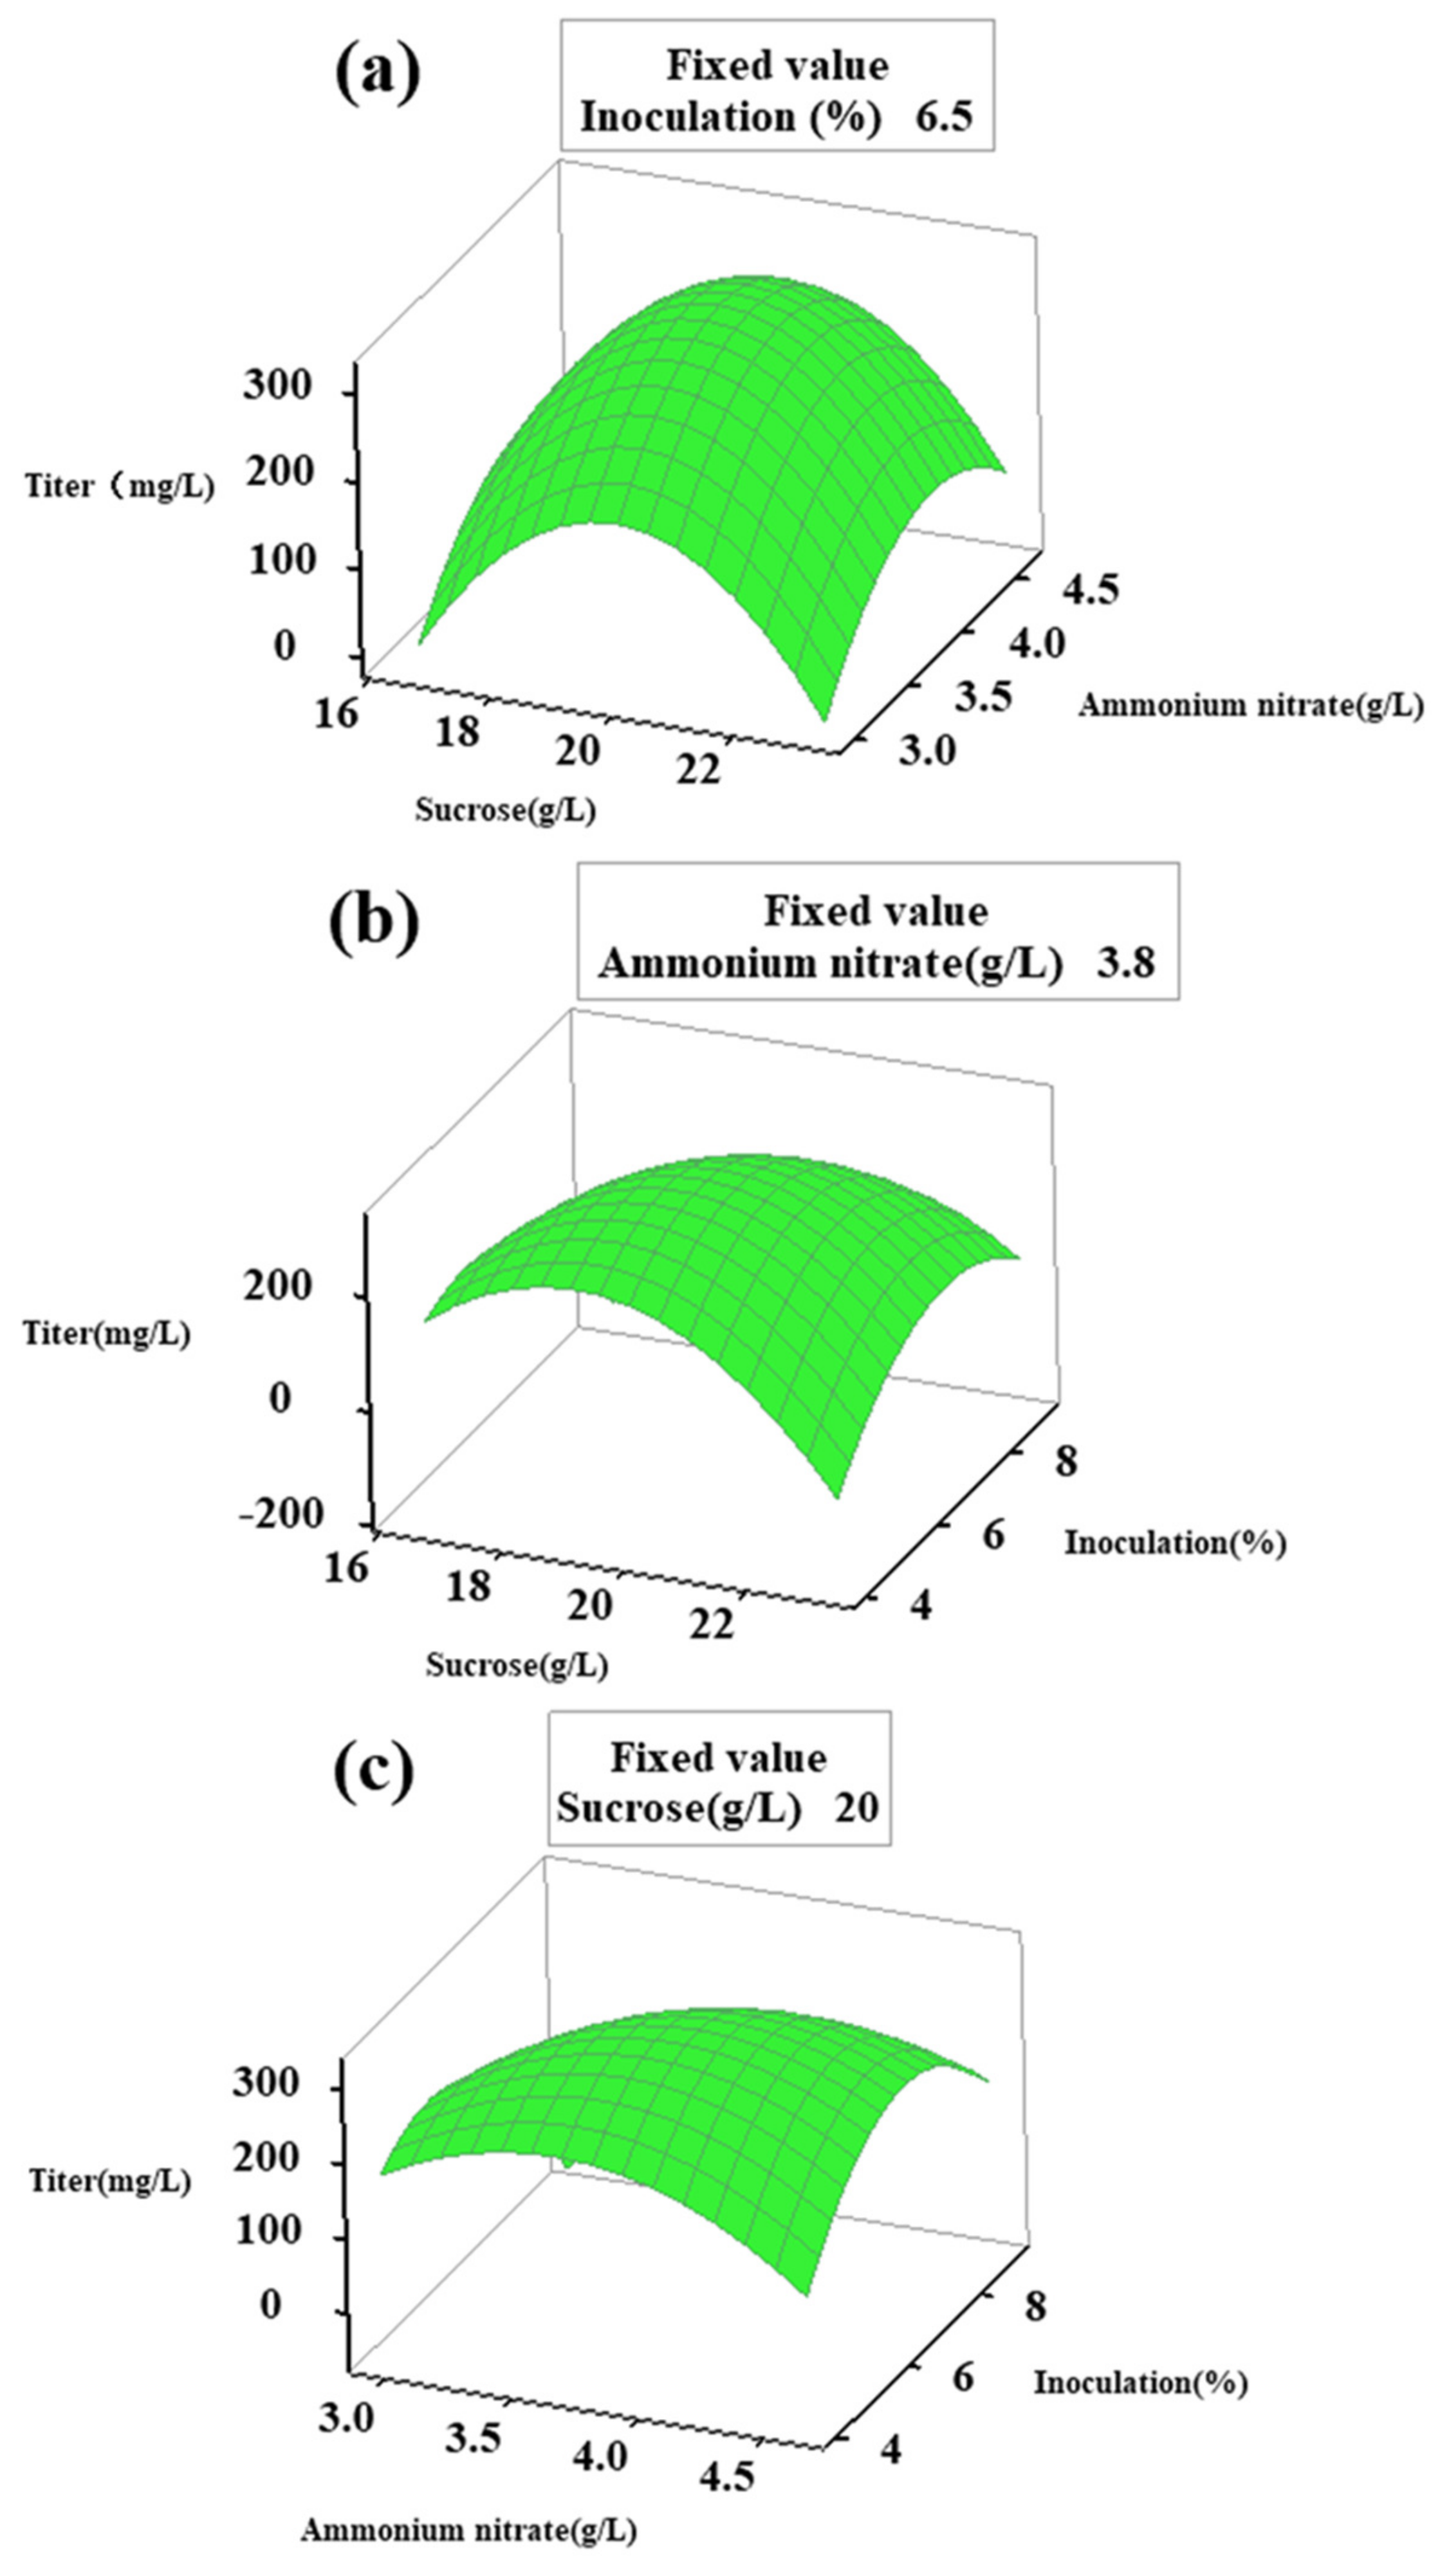
2.3. Optimization of Critical Factors by Response Surface Method

In the partial factorial design, variables with p-values < 0.05 (sucrose, NH4NO3, and inoculum) were selected and further optimized using a central composite experimental design with three factors and five levels. In the full factorial experiment, except for the concentrations of sucrose, NH4NO3 and inoculum size, the concentration of other media components were NaCl 3.0 g/L, a trace element solution of 1.2 mL/L, K2HPO4·3H2O 4.0 g/L—these were the concentration of the medium components at which the titer of lichenysin reached their maximum in partial factorial experiments. In addition, CaCl2 0.01 g/L, FeSO4·7H2O 0.1 g/L, MgSO4·7H2O 0.6 g/L were the same as the original fermentation medium. The experimental codes and levels for the three significant variables were shown in Table S4. Table S5 represented the experimental design and results of lichenysin production. The experimental data relating to lichenysin concentration were fitted with multiple regression according to Table S5 to establish a quadratic response surface regression model, and then to seek the optimal corresponding factor levels. The quadratic polynomial equation was obtained by fitting this experimental data through Minitab 19 software:
Y = 1.16 x 1 + 20.16 x 2 27.90 x 3 64.36 x 1 2 33.68 x 2 2 44.23 x 3 2 + 1.90 x 1 x 2 + 34.11 x 1 x 3 + 24.96 x 2 x 3 + 314.54
where Y is the predicted titer of lichenysin (mg/L) and x 1 , x 2 and x 3 are the coded values of sucrose, NH4NO3 and inoculum (%), respectively.
In order to verify the regression coefficient, the regression model ANOVA for the second-order equation for the production of lichenysin from B. licheniformis Ali5 was presented in Table S6. ANOVA was essential to test the significance and adequacy of the model. p-value less than 0.05 indicated that the model term is significant.
The results showed that the p-values of x 2 , x 3 , x 1 2 , x 2 2 , x 3 2 , x 1 x 3 and x 2 x 3 were all less than 0.05, meaning a significant difference in these model terms. The p-value of the linear term was equal to 0, indicating that the model had a significant linear correlation. Among them, the p-values of x 1 2 , x 2 2 and x 3 2 were highly significant (p < 0.01), illustrating that the squared terms of the three significant influencing factors had a significant effect on the fermentation of lichenysins produced by B. licheniformis Ali5. The F-value can be calculated from the ANOVA by dividing the mean square of the model variance by the mean square of the error variance. It measured how the factors described the variation in the data with respect to their means. The F-value of 138.53 was large, which implied the adequacy of the model and that the interaction between the variables was significant. The lack of fit term p = 0.463 > 0.05, the model was not significant, meaning that the unknown experimental factors interfered little with the results, there was no need to re-introduce a higher number of terms, and the model was correctly chosen.
The closer the coefficient of determination R2 is to 1, the better the correlation between the observed and predicted values. The suitability of the model was determined by the R2 value (0.992) and the adjusted R2 value (0.9849), which reflected the significance of the model. It was much better than 0.75, which indicated that the model was appropriate and suggested that 99.2% of the response variability could be explained by the model and that the regression model was used to analyze the trend of the response. That is, the model reflects the relationship between lichenysin titer and sucrose, ammonium nitrate and inoculum size, so the model can be used for the analysis and prediction of secretion conditions of intermediate metabolites during the fermentation of Bacillus licheniformis Ali5.
The effects of sucrose, NH4NO3 and inoculum on lichenysin titer were analyzed by response surface plots in Figure 2. The response surface was convex with a downward opening. The effect of the interaction of the three operational parameters on the production of biosurfactants by Bacillus licheniformis Ali5 was studied, and response surface curves were plotted for any two independent variables while keeping the third one constant. In fact, 3D response surface curves often represent a graphical representation of the regression equation, allowing for simple prediction and interpretation of the results, and helping to determine the optimal level of factors. Figure 2a contrasted the interaction of sucrose with NH4NO3 significantly higher than sucrose with inoculum (Figure 2b) and NH4NO3 with inoculum (Figure 2c). The quadratic factor of the fitting equation was less than zero, and the response surface was convex, so it had a maximum point. In order to further obtain the best value, the maximum points of response optimization by Minitab 19 software were x 1 = 19.8 g/L, x 2 = 3.9 g/L, x 3 = 6.1%. The optimal fermentation conditions for B. licheniformis Ali5: sucrose19.8 g/L, NH4NO3 3.9 g/L, K2HPO4·3H2O 4.0 g/L, MgSO4·7H2O 0.6 g/L, FeSO4·7H2O 0.1 g/L, CaCl2 0.01 g/L, NaCl 3.0 g/L, trace elements 1.2 mL/L, inoculum 6.1%, shaker speed 160 rpm, initial pH 7.0. The predicted value of the lichenysin titer was 320.60 mg/L.
Figure S1 shows a plot of the normal probability distribution of the residuals of the titer of lichenysin, illustrating the relationship between its concentration and the predicted values determined by the model Equation (3). It was clear that most of the points were near the straight line, indicating that the experimentally determined values were similar to the predicted values of the model [27].
Finally, to verify the real reliability of the predicted value of this model, the experiment was repeated three times in shaking flasks according to the optimized fermentation conditions, and the concentration of lichenysin was measured to be 315.26 mg/L ± 4.79 after 48 h of fermentation, which was 43.5% higher than that before optimization (219.72 mg/L), and the fitting rate between the predicted value and the measured value was 98.3%, indicating that the predicted value was in good agreement with the experimental value. This demonstrated that the second-order model established in this experiment was reasonable and effective.

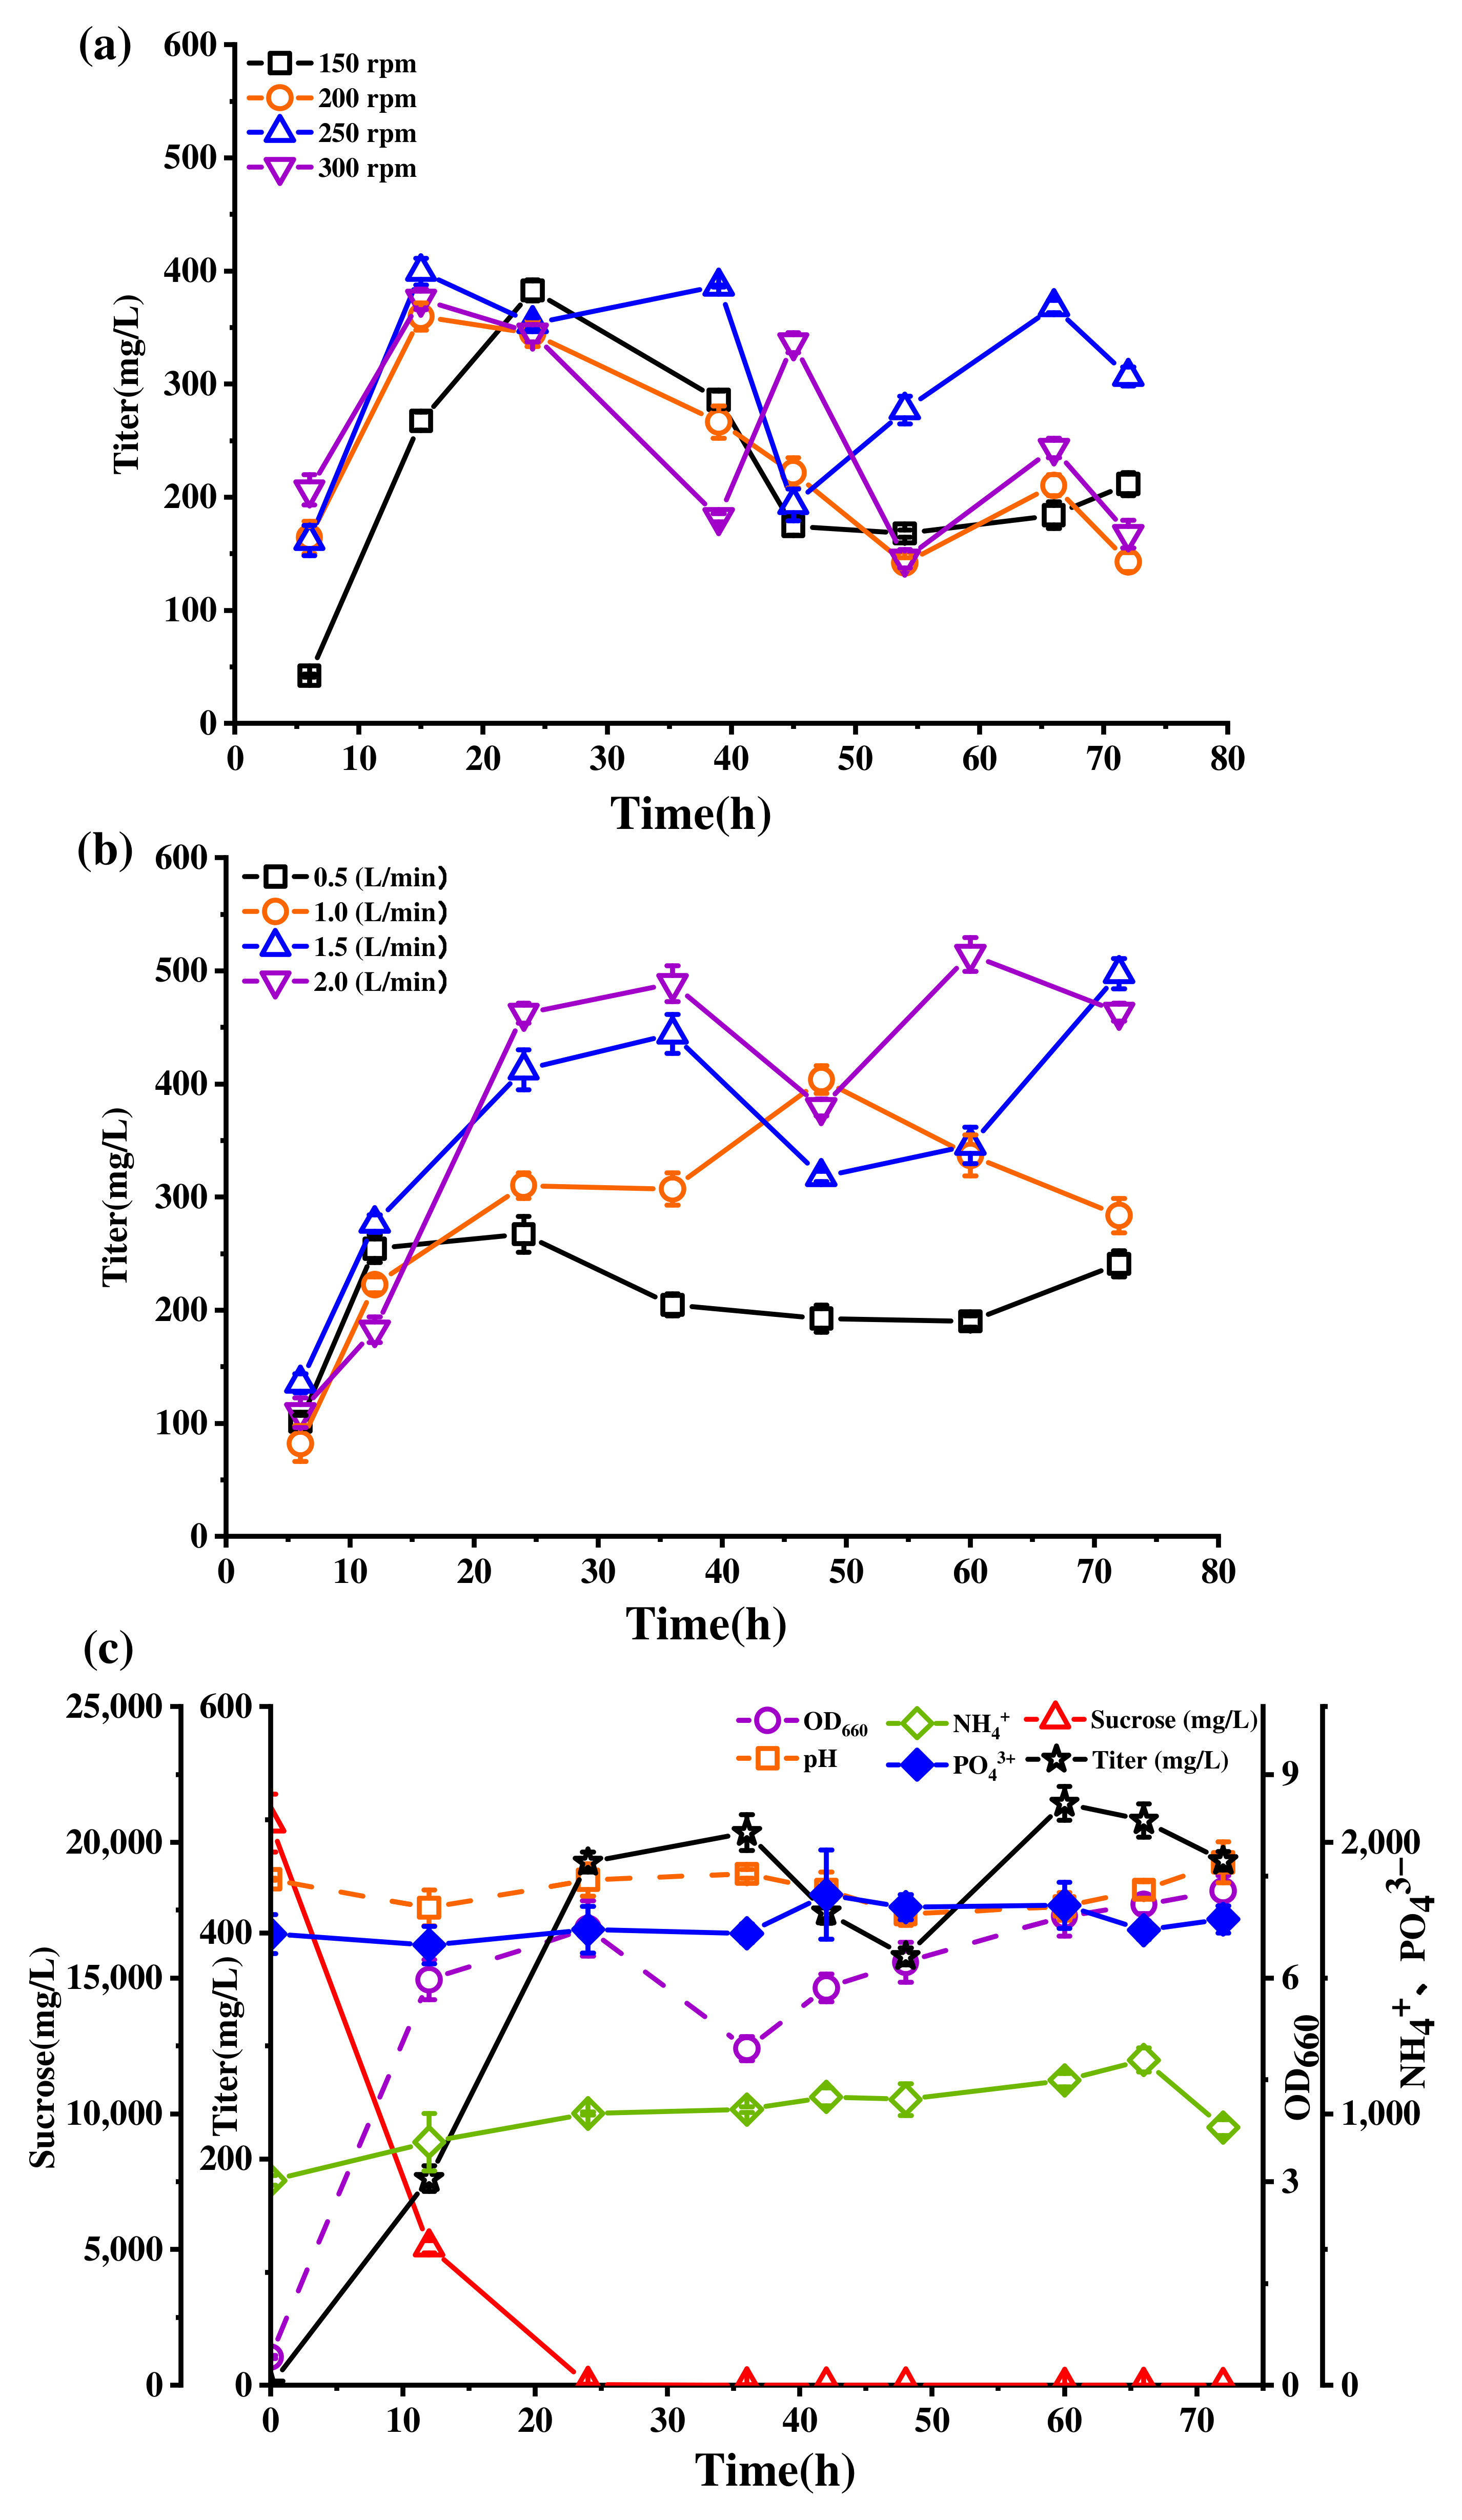
2.4. Effect of Bioreactor Stirring Speed and Aeration Rate on Lichenysin Production

After determining the optimal medium composition by response surface methodology, 1 L bioreactors were employed to expand the culture in order to further increase the production of lichenysin. Figure 3 showed the effect of stirring speed and aeration rate optimization on lichenysin titer and the fermentation kinetics process of lichenysin production after optimization.
Figure 3a indicated the variation of lichenysin produced by B. licheniformis Ali5 under four different stirring speed conditions with time. After 45 h of fermentation, the amount of lichenysin production varied greatly at different time periods. The maximum lichenysin concentration was reached at 150 rpm for 24 h, while the maximum lichenysin titer was reached at 200 rpm, 250 rpm and 300 rpm for 15 h. The changes in the concentration of lichenysin in the fermentation broth were almost the same at 250 rpm and 300 rpm from 0 to 24 h. These changes could be due to the larger rotation speed increasing the dissolved oxygen rate in the medium, leading to faster microbial growth and shorter fermentation cycles, and the concentration of lichenysin reached its maximum at 15 h. However, the concentration of lichenysin decreased sharply after 24 h at 300 rpm. It was possible that lichenysin was used for the “secondary growth” of microorganisms because the oxygen transfer coefficient in the medium increased and the microorganisms grew too fast, resulting in a lack of nutrient components just as the concentration of lichenysin decreased at 39 h under the conditions of 250 rpm. Thus, after 39 h of incubation at 300 rpm, the concentration of lichenolysin increased, but was still lower than the concentration of lichenolysin produced at 15 h. Similarly, a decrease in lichenysin concentration occurred from 24 h and 30 h at 150 rpm and 200 rpm, respectively. Comparison with the fermentation time when lichenysin reached its maximum at 150 rpm, and 200 rpm revealed that the time to reach the maximum at 250 rpm and 300 rpm was significantly reduced to 15 h.
Figure 3b exhibited the variation of lichenysin produced by B. licheniformis Ali5 under four different aeration conditions with time. After 72 h of fermentation, the amount of lichenysin produced varied greatly at different time periods. Between 0 and 36 hours, the production of lichenysin increased continuously with time at different stirring speeds, and the highest production was 514.55 mg/L after 60 h of fermentation at 2.0 L/min. At an aeration rate of 0.5 mL/L, lichenysin concentration increased slowly and reached a maximum at 24 h. Because the aeration rate affected the dissolved oxygen rate in the medium, microbial growth was slow and bacterial density was low in the absence of oxygen, resulting in small lichenysin production. At an aeration rate of 1.0 mL/L, the lichenysin concentration reached a maximum at 48 h and began to decrease gradually thereafter. It might be due to the lack of nutrients caused by the high density of the bacteria, while the higher viscosity of lichenysin reduced the dissolved oxygen rate, and lichenysin was decomposed and utilized [45]. However, the trends of lichenysin were almost identical at 1.5 and 2.0 mL/L aeration rates, both accumulating the most at 36 h. This resulted in a lack of nutrients in the medium to satisfy the conditions for microbial growth, further leading to a decrease in lichenysin concentration within 36–48 h, most likely due to degradation. The rise observed after 48 h might be due to microbial regeneration promoting lichenin secretion.
Eventually, the optimized fermentation conditions were analyzed for fermentation kinetics, as shown in Figure 3c. The results showed that under the optimized medium and fermentation conditions B. licheniformis Ali5 exhibited a vigorous growth trend, good cell metabolic status, rapid proliferation and rapid entry into the logarithmic growth phase. From 0–18 h, the bacteria grew vigorously and consumed substrate rapidly, and the concentration of sucrose gradually decreased. From 18 h the strain entered the late logarithmic growth period, the concentration of lichenysin increased rapidly, and after 18 h the sucrose concentration in the fermentation broth was almost zero. The decay period of the bacteria occurred at 24–36 h, the biomass decreased quickly, and the lichenysin concentration tended to be stabilized. The significant decrease in biomass during this period might be due to the depletion of nutrients and the large accumulation of toxic metabolites, which led to a gradual increase in the rate of microbial death and a decrease in viable bacteria. After 36 h, B. licheniformis Ali5 appeared a secondary growth condition. At that time, the optical density (OD) value began to increase again gradually, and the concentration of lichenysin began to slowly decrease. This might be caused by lichenysin being broken down and utilized. After 48 h, there was a secondary increase in the concentration of B. licheniformis Ali5, which might be caused by the increase in biomass.
The most intermediate metabolites were secreted by the strains in the late logarithmic growth phase. Then the concentration of lichenysin decreased due to the depletion of the nitrogen source, and the biosurfactant was degraded and utilized during the growth stabilization phase, which was consistent with the previous conclusion that lichenysin production was related to microbial growth [48]. During the whole fermentation process, the pH of the fermentation supernatant hardly fluctuated and remained at about 7 to 8. The ammonium and phosphate salts were degraded to ammonium and phosphate ions, respectively, which gradually increased with the consumption of the substrate and finally remained stable. This again demonstrated that phosphate played an important role in lichenysin production by regulating medium pH, maintaining osmotic balance, and modulating membrane potential [37]. The lichenysin concentration reached a maximum of 514.55 mg/L after 60 h cultivation, as concluded in the previous section.

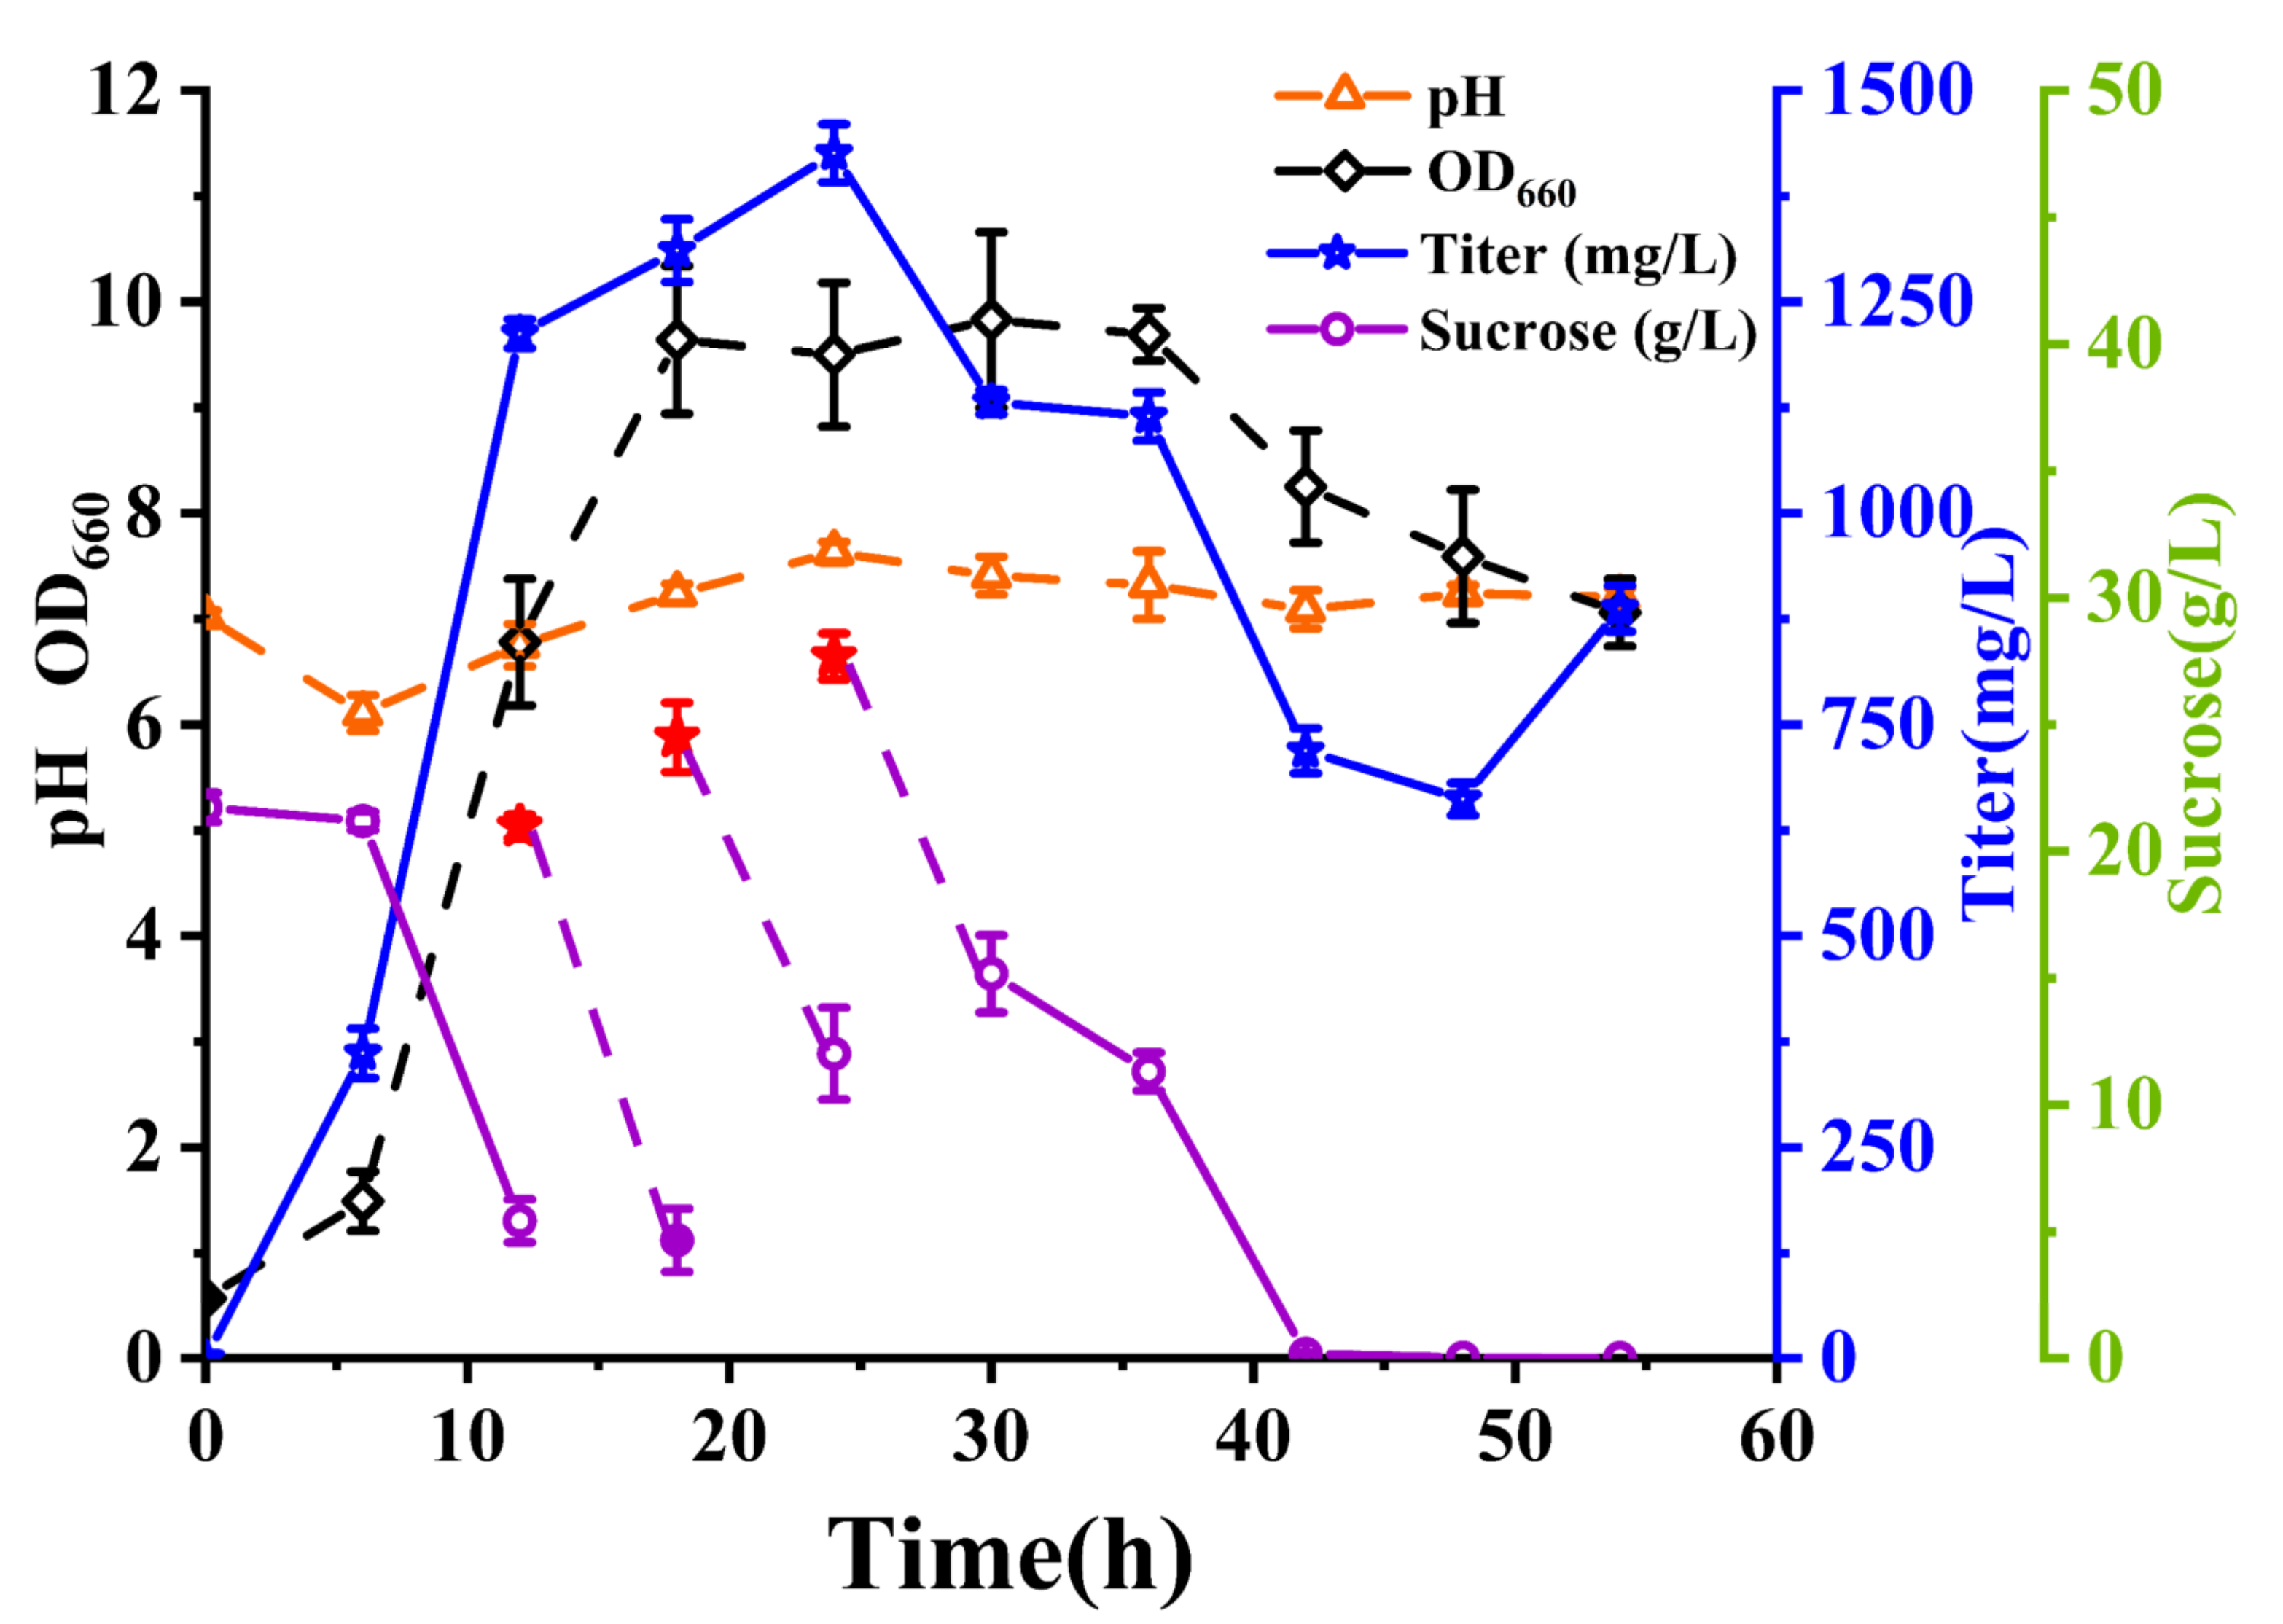
2.5. Fed-Batch Fermentation and Growth Kinetics

Based on the remaining sucrose concentration in the fermentation broth at the time of sampling, the time of each fed batch was calculated, and the sucrose concentration in the fermentation broth was about 20 g/L after each feeding. The fed-batch fermentation process is shown in Figure 4. The results showed that the highest lichenysin concentration reached 1425.85 mg/L at 24 h after three fed-batches, which was approximately 5.5 times the amount of lichenysin produced by the original medium.
As could be seen from Figure 4, in the first 6 h, the growth of bacteria was in a lag period, the titer of lichenysin was very low, and sucrose degradation was slow. At 6–12 h, sucrose was consumed rapidly, and lichenysin concentration increased. After the first feeding at 12 h, the bacteria continued to grow and reproduce by supplementing nutrients, and the concentration of lichenysin was also increasing. At 18 h, the second feeding was carried out. Although the growth of bacteria decreased slightly, the concentration of intermediate metabolites was still rising slowly due to the rich nutrients in the fermentation broth. After the last feeding at 24 h, the bacteria grew slowly. The sucrose concentration showed a rapidly declining trend until 24 h, especially after each feeding. And the trend of lichenysin concentration was the opposite. The sucrose decomposed rapidly after 24 h, the bacteria gradually died and the total concentration of lichenysin showed a decreasing trend. After 48 h of fermentation, the sucrose concentration in the fermentation broth was almost zero. The concentration of lichenysin tended to increase afterward, and the intermediate metabolites were likely broken down and used as nutrients to promote microbial growth.
Comparing Figure 3c and Figure 4, we found that the titer of lichenysin reached its maximum at 60 h before the fed-batch fermentation and at 24 h after the fed-batch, which obviously shortened the fermentation period. Their product yields were also calculated to be 0.025 mg/mg and 0.032 mg/mg, respectively, which were significantly higher than before the fed-batch fermentation.
In conclusion, after three times of fed-batch fermentation, it was found that sufficient substrate would prolong the logarithmic growth period of bacteria. Although biomass did not increase significantly in the second and third times of fed-batch fermentation, the stable logarithmic period was significantly higher than before. Furthermore, compared with Figure 3c, the fed-batch method improved the titer of lichenysin and the productivity. Because the optimal time for lichenysin production was reduced from 36 h to 24 h compared to the batch process. Sanket Josh et al. increased the lichenysin production by Bacillus licheniformis R2 fourfold through response surface optimization [27]. Moreover, J. Coronel-Leon et al. similarly increased lichenysin production by Bacillus licheniformis fourfold by using agricultural waste molasses [28]. Nevertheless, the concentration of lichenysin in this study was increased by 5.5-fold by fed-batch fermentation, much higher than in previous studies. Again, this demonstrated the usefulness of fed-batch fermentation.

3. Materials and Methods

3.1. Bacterial Strains, Growth Media and Inoculum Preparation

The Bacillus licheniformis Ali5 in this study was previously screened from the soil in our laboratory. The GenBank accession number of this strain is MN629226. The strain was stored in 30% glycerol tubes and frozen in −80 °C refrigerator.
Frozen strains were incubated on Luria Bertani (LB) agar plates and then individual colonies were picked out and inoculated into LB medium, where 1 L of LB medium consisted of 10 g NaCl, 10 g peptone and 5 g yeast extract, at 37 °C and 220 rpm for 8 h. When OD660nm was approximately 0.8, it was transferred to 100 mL LB at 3% (v/v) inoculum size. After incubation for about 20–24 h, the fermentation medium was inoculated with 1% (v/v) inoculum size. (Fermentation medium components: 20 g/L sucrose, 3.3 g/L NH4NO3, 0.14 g/L KH2PO4, 2.2 g/L K2HPO4·3H2O, 0.6 g/L MgSO4·7H2O, 0.1 g/L FeSO4·7H2O, 0.01 g/L CaCl2, 0.01 g/L NaCl, 0.5 mL/L trace element solution) [49]. The initial pH of the fermentation medium was adjusted to 7.0, and the culture conditions were 37 °C and 250 rpm. All chemicals were analytical reagent (AR).

3.2. Single-Factor Optimization of Culture Medium and Cultivation Conditions

Media optimization was performed in a series of experiments, changing one variable at a time, and keeping the other factors fixed at a specific set of conditions. Maltose, glucose, lactose and soluble starch were selected as different carbon sources. The required soluble starch was calculated to be 21.1 g/L and the other carbon sources were 20 g/L based on the mass fraction of carbon in the fermentation medium. Similarly, soybean meal powder, urea, (NH4)2SO4 and NH4Cl were selected as nitrogen sources to replace NH4NO3 in the basal medium, which contained 1.2 g, 2.4 g, 5.5 g, and 5 g in 1 L of the medium, respectively. In addition, amino acids as organic nitrogen sources equally affected microbial growth and lichenysin production. Therefore, hydrophilic amino acids such as glycine, serine, cysteine, histidine, lysine, glutamate, and glutamine were preferentially used instead of NH4NO3. They were in the order of 6.2 g/L, 8.7 g/L, 10 g/L, 4.3 g/L, 6 g/L, 12.2 g/L, 6 g/L, and 4.8 g/L according to the C/N ratio. KH2PO4, K2HPO4·3H2O, NaCl and Na2HPO4·12H2O were used as commonly used inorganic salts to replace sodium and potassium salts in fermentation media; the concentrations (g/L) of the above four inorganic salts were 4.1, 2.6, 4.7, and 5.7 respectively.
In addition to the basic effects of carbon, nitrogen and inorganic salts on microbial cultivation, trace element solution (0.5 mL/L, 1.0 mL/L, 1.5 mL/L, and 2.0 mL/L), shaker speed (100 rpm, 120 rpm, 140 rpm, 160 rpm, 180 rpm, 200 rpm, 220 rpm, 250 rpm, and 300 rpm), working volume (50 mL, 60 mL, 70 mL, 80 mL, 90 mL, 100 mL, and 110 mL) and inoculum size (1%, 2%, 4%, 6%, 8%, and 10%) also had a non-negligible effect on lichenysin production. Therefore, it was also optimized using the single-factor method.
In summary, all single-factor experiments were performed in 250 mL conical flasks with incubation temperature of 37 °C. The working volume for all single-factor experiments was 100 mL, except for the optimized working volume. Three parallel experiments were set up for each test condition, and the OD value at 660 nm, pH value of cell-free supernatant, ST value and lichenysin concentration of the fermentation broth incubated for 48 h were measured simultaneously. In addition, all chemically synthesized media used in this study were sterilized at 115 °C for 15 min [50].

3.3. Fractional Factorial Design

A two-level analysis of factors design was used to identify the important medium components. Six components [variables, k = 6] were obtained by single-factor optimization, where each variable was expressed at two levels, high (+) and low (−), in 16 trials (as in the design used, only k variables were screened on the basis of 2k−2 trials), as shown in Tables S1 and S2. The two levels for each variable in Table S1 were the appropriate concentration ranges selected based on the results of the single-factor optimization. As shown in Table S2, each row represents a trial, while each column represents an independent (specified) variable. The effects of each variable, sum of squares, mean square, F-value, p-value, and confidence level (%) were determined using Minitab 19 statistical software [27].

3.4. Full Factorial Experimental Design

Central Composite Designs (CCDs) are one of the most important full factorial experimental designs in process optimization science. It consists of a complete 2k factorial design, where k is the number of test variables, the n o centre points ( n o ≥ 1) and the distance between the two axial points on each design variable axis and the design center is α (=1.68). Hence, the total number of design points is N = 2 k + 2 k + n o . The second-order model equation is displayed as follows [27,30]:
  y = β o + i = 1 k β i X i + i = 1 k   j = 1 , i × j k β i j X i X j + i = 1 k β i i X i 2 + ε
where y represents the predicted response, X i and X j are defined as input variables, and β i , β o , β i i , and β i j Denote the linear effect, intercept, squared effect, and interaction term, respectively. In establishing the regression equation, the independent test variables were coded according to the equation:
  x i = X i x o Δ X
where x i is the coded value of the independent variable, X i is the uncoded value of the independent variable, x o is the uncoded value of the independent variable at the centroid, and Δ X is the order variable. Then, the experiments were designed, and the experimental data were subjected to multiple regression analysis using the statistical regression software Minitab 19. Table S4 showed the experimental levels and actual values of the independent variables. Tables S5 and S6 represent the number of experimental runs and the second-order model regression analysis results, respectively.

3.5. Optimization of Stirring Speed and Aeration Rate in 1 L Bioreactor

After determining the optimal medium composition by response surface methodology, the stirring speed and aeration rate (L/min) were optimized in a 1 L bioreactor (Infors-HT, Switzerland). Firstly, the stirring speed of the four bioreactors (A, B, C, and D) was set to 150 rpm, 200 rpm, 250 rpm, and 300 rpm, respectively, and the aeration rate was 1.0. Secondly, the aeration rate (L/min) was set to 0.5, 1.0, 1.5, and 2.0 (L/min). Each bioreactor had the same temperature and initial pH of 37 °C and 7.0, respectively, and were all connected to a foam collection device to prevent foam overflow and bacterial contamination. The optimal fermentation conditions were determined by observing the effects of different aeration rates and stirring speeds on the growth and intermediate metabolites of B. licheniformis Ali5. The cultivation period for this experiment was 72 h and three replications were performed.

3.6. Fed-Batch Fermentation in 1 L Bioreactor

The B. licheniformis Ali5 fed-batch fermentation method was edited and set up in a 1 L bioreactor using eve software, and the fermentation process was monitored in real-time. 12 h, 18 h and 24 h were selected as the time points for feeding, respectively. The feeding length is calculated according to the sucrose concentration in the fermentation broth to keep it at approximately 20 g/L. Medium B1 (80 g/L sucrose, 14.4 g/L NH4NO3, 18 g/L K2HPO4·3H2O, 12 g/L NaCl) was selected for feeding, and the initial pH was adjusted to 7.0 with a feeding flow rate of 3.5 mL/min. The initial working volume of a bioreactor was 700 mL. The fermentation solution was sampled every 6 h with a volume of 20 mL, and the biomass and lichenysin concentration of the fermentation solution were measured with a fermentation period of 54 h. Finally, a growth curve was established based on the changes in biomass during the fermentation process, and the changes in sucrose, ammonium ion and lichenysin concentration during the microbial growth were also described.
The equation for ratio of biosurfactant titer to sucrose consumption, i.e., Yp/s (mg/mg), is as follows:
Y p / s = P max P o S o S
where P m a x and P o represented the maximum and initial concentration of lichenysin (mg/L), respectively. S o and S represented the initial concentration of sucrose (mg/L) and the concentration of sucrose when the maximum lichenysin concentration was reached, respectively [32,51].

3.7. Analytical Methods

Detection of biomass: In this study, the OD value of B. licheniformis Ali5 suspension at 660 nm was measured using a 722 UV–Vis spectrophotometer (APL, Shanghai, China); the greater the concentration of bacteria, the greater the OD, the growth of microorganisms was indicated by measuring the OD of the culture solution.
Determination of pH value: The pH of the supernatant was measured by a METTLER TOLEDO FE-20K pH meter.
Measurement of compound content: A calibration curve of absorbance versus concentration was established by the two-point method using a Cedex Bio Biochemical Analyzer, and the fermentation broth was centrifuged at 8000 rpm for 10 min at 4 °C to remove the precipitate to obtain a cell-free supernatant for quantification of the compound content.
Determination of surface tension. The fermentation broth (50 mL) was centrifuged at 4 °C and 8500 rpm for 10 min to remove the precipitate, and the supernatant was retained. Immediately afterward, the ST of the cell-free supernatant was gauged using a Krüss Force Tensiometer-K100 surface tension meter (Hamburg, Germany) according to the DuNouy hanging ring method, and the final results were the average of the three measurements [52].

3.8. Determination of the Concentration of the Biosurfactant Lichenysin

The pretreatment of lipopeptides was referred from the method of Yimin Qiu et al. [37]. After acid precipitation and methanol dissolution, the solution was filtered through a 0.22 μm microporous membrane (JINTENG, Tianjin, Nylon66) and subsequently analyzed by high-performance liquid chromatography. Considering that lichenysin and surfactin had almost identical chemical structures and similar molecular weights and that lichenysin was not commercially available at present, surfactin (Yuanye, >98%) was chosen as the standard for its preliminary quantification. The standard curve was plotted using Origin 2019 software, with the sum of peak areas as the horizontal coordinate and the concentration as the vertical coordinate to obtain the linear regression equation; then, the concentration of lichenysin in the fermentation broth was quantified by peak area.
The HPLC system was an Agilent LC 1260 Infinity II instrument equipped with a VWD UV/visible detector; the chromatographic column was an Agilent TC-C18 (packing size 5 μm, column length 250 mm × column inner diameter 4.6 mm). The following suitable gradient elution method was obtained by modifying the mobile phase method of Yimin Qiu et al. [37]. The eluted conditions were as follows: solvent A 50% at 0–5 min, then from 50% to 30% in 25 min, and then from 30% to 50% in 31 min, 50% at 34 min. The flow rate was 0.5 mL/min at 15 °C, and the substances eluted were detected by UV absorption at 210 nm.

3.9. Extraction of Crude Lipopeptides

Extraction of lichenysin with reference to the previously reported method [49,53]. The pH of the fermentation broth was adjusted to 8.0 with 10 M NaOH solution to completely dissolve the lipopeptides in the fermentation broth. After that, the solution was centrifuged at 8000 rpm for 15 min to remove bacteria and solids, and the pH of the cell-free supernatant was adjusted to 2.0 with 6 M HCl and placed in a refrigerator at 4 °C overnight, then centrifuged for 15 min (4 °C, 8000 rpm), the precipitates were collected and washed three times with pH 2.0 hydrochloric acid dilution solution (0.01 M), and dried in an oven at 65 °C. Subsequently, it was extracted three times with methanol, centrifuged to remove insoluble material, and the extracts were combined. The concentrate was concentrated by evaporation through a rotary evaporator, dissolved with an aqueous solution of pH 8.0, and impurities were removed by centrifugation. Eventually, the crude extract of lipopeptides was obtained by vacuum freeze-drying.

4. Conclusions

This study identified better media composition and fermentation conditions to improve lichenysin production using the univariate approach, partial factorial, and central composite experiments. Then, the concentration of lichenysin was increased by 5.5-fold using fed-batch fermentation, which demonstrated that Bacillus licheniformis Ali5 could produce lichenysin and confirmed the efficiency of this method. In summary, this approach could be successfully applied to any process in which the effects and interactions of many experimental factors require analysis. The partial factorial experiments effectively reduced the number of experiments and screened out important impact factors more accurately. The central composite experimental design maximized the amount of information that could be obtained while limiting the number of individual experiments required.
In addition, an expanded culture of B. licheniformis Ali5 in a 1 L bioreactor was borrowed from the fed-batch fermentation process. The titer of lichenysin could be significantly increased by this experimental design approach. When the ST was lower than 30 mNm−1, the high viscosity of the biosurfactant affected the actual dissolved oxygen of the fermentation broth, which also affected the growth of the bacteria during the fed-batch fermentation, so further research is needed to address this issue.
Based on the increasing awareness of environmental protection, biosurfactants are expected to become an alternative to chemically synthesized surfactants. Lichenysin is a member of the surfactin family and has similar physicochemical properties to surfactin but has a lower critical micelle concentration. This study provides a solid basis for further improvement of the purity and applicability of lichenysin.

Supplementary Materials

The following supporting information can be downloaded at: https://www.mdpi.com/article/10.3390/fermentation8120712/s1, Table S1: Factors and coded values of FFD; Table S2: Experimental design and results of the FFD; Table S3: Factors, levels and effect estimates of FFD; Table S4: Experimental codes and levels of independent variables for CCD; Table S5: The predicted and experimental values of lichenysin titer in the CCD experimental matrix; Table S6: Analysis of variance of the second-order regression model; Figure S1. Normal probability plot of the standard residuals of the titer (mg/L).

Author Contributions

All authors contributed to this article as follows, Conceptualization, Z.P. and Y.S.; methodology, Z.P.; software, N.A.; validation, Z.P.; formal analysis, Z.P.; investigation, Z.P.; resources. F.W. and Y.L. (Yonghong Liao); data collation, Z.P.; writing—original draft preparation, Z.P.; writing—review and editing, Y.L. (Yuanzi Li) and D.Z.; visualization, Y.L. (Yonghong Liao); supervision, D.Z. project management, F.W.; funding acquisition, F.W. All authors have read and agreed to the published version of the manuscript.

Funding

This research was funded by the National Key R&D Program of China (2021YFC2102800) and the National Natural Science Foundation of China (32100068).

Institutional Review Board Statement

Not applicable.

Informed Consent Statement

Not applicable.

Data Availability Statement

Not applicable.

Acknowledgments

The authors are highly grateful to the National Key R&D Program of China (2021YFC2102800) for the support and research grants.

Conflicts of Interest

The authors declare no competing financial interests.

References

  1. Jahan, R.; Bodratti, A.M.; Tsianou, M. Biosurfactants, natural alternatives to synthetic surfactants: Physicochemical properties and applications. Adv. Colloid Interface Sci. 2020, 275, 102061. [Google Scholar] [CrossRef] [PubMed]
  2. Marti, M.E.; Colonna, W.J.; Reznik, G. Production of fatty-acyl-glutamate biosurfactant by Bacillus subtilis on soybean co-products. Biochem. Eng. J. 2015, 95, 48–55. [Google Scholar] [CrossRef] [Green Version]
  3. Markande, A.R.; Patel, D.; Varjani, S. A review on biosurfactants: Properties, applications and current developments. Bioresour. Technol. 2021, 330, 124963. [Google Scholar] [CrossRef] [PubMed]
  4. Zhi, Y.; Wu, Q.; Xu, Y. Production of surfactin from waste distillers’ grains by co-culture fermentation of two Bacillus amyloliquefaciens strains. Bioresour. Technol. 2017, 235, 96–103. [Google Scholar] [CrossRef]
  5. Liu, Q.; Niu, J.; Yu, Y. Production, characterization and application of biosurfactant produced by Bacillus licheniformis L20 for microbial enhanced oil recovery. J. Clean. Prod. 2021, 307, 127193. [Google Scholar] [CrossRef]
  6. Hathout, Y.; Ho, Y.-P.; Ryzhov, V. Kurstakins: A new class of Lipopeptides isolated from Bacillus thuringiensis. J. Nat. Prod. 2000, 63, 1492–1496. [Google Scholar] [CrossRef]
  7. Md, F. Biosurfactant: Production and application. J. Pet. Environ. Biotechnol. 2012, 3, 124. [Google Scholar] [CrossRef] [Green Version]
  8. Meng, Y.; Zhao, W.; You, J. Structural analysis of the lipopeptide produced by the Bacillus subtilis mutant R2-104 with mutagenesis. Appl. Biochem. Biotechnol. 2016, 179, 973–985. [Google Scholar] [CrossRef]
  9. Cochrane, S.A.; Vederas, J.C. Lipopeptides from Bacillus and Paenibacillus spp.: A gold mine of antibiotic candidates. Med. Res. Rev. 2016, 36, 4–31. [Google Scholar] [CrossRef]
  10. Yakimov, M.M.; Timmis, K.N.; Wray, V. Characterization of a new lipopeptide surfactant produced by thermotolerant and halotolerant subsurface Bacillus licheniformis BAS50. Appl. Environ. Microbiol. 1995, 61, 1706–1713. [Google Scholar] [CrossRef]
  11. Smith, M.L.; Gandolfi, S.; Coshall, P.M. Biosurfactants: A COVID-19 Perspective. Front. Microbiol. 2020, 11, 1341. [Google Scholar] [CrossRef]
  12. Zhao, F.; Wu, Y.; Wang, Q. Glycerol or crude glycerol as substrates make Pseudomonas aeruginosa achieve anaerobic production of rhamnolipids. Microb. Cell Factories 2021, 20, 185. [Google Scholar] [CrossRef]
  13. Zhang, R.; Wu, Q.; Xu, Y. Isolation, identification, and quantification of lichenysin, a novel nonvolatile compound in Chinese distilled spirits. J. Food Sci. 2014, 79, C1907–C1915. [Google Scholar] [CrossRef]
  14. Johnson, P.; Trybala, A.; Starov, V. Effect of synthetic surfactants on the environment and the potential for substitution by biosurfactants. Adv. Colloid Interface Sci. 2021, 288, 102340. [Google Scholar] [CrossRef]
  15. Dierickx, S.; Castelein, M.; Remmery, J. From bumblebee to bioeconomy: Recent developments and perspectives for sophorolipid biosynthesis. Biotechnol. Adv. 2021, 54, 107788. [Google Scholar] [CrossRef]
  16. Gaur, V.K.; Sharma, P.; Sirohi, R. Production of biosurfactants from agro-industrial waste and waste cooking oil in a circular bioeconomy: An overview. Bioresour. Technol. 2022, 343, 126059. [Google Scholar] [CrossRef]
  17. Souza, K.S.T.; Gudiña, E.J.; Schwan, R.F. Improvement of biosurfactant production by Wickerhamomyces anomalus CCMA 0358 and its potential application in bioremediation. J. Hazard. Mater. 2018, 346, 152–158. [Google Scholar] [CrossRef] [Green Version]
  18. Mohanty, S.S.; Koul, Y.; Varjani, S. A critical review on various feedstocks as sustainable substrates for biosurfactants production: A way towards cleaner production. Microb. Cell Factories 2021, 20, 120. [Google Scholar] [CrossRef]
  19. Moutinho, L.F.; Moura, F.R.; Silvestre, R.C. Microbial biosurfactants: A broad analysis of properties, applications, biosynthesis, and techno-economical assessment of rhamnolipid production. Biotechnol. Prog. 2021, 37, e3093. [Google Scholar] [CrossRef]
  20. Madslien, E.; Rønning, H.; Lindbäck, T. Lichenysin is produced by most Bacillus licheniformis strains. J. Appl. Microbiol. 2013, 115, 1068–1080. [Google Scholar] [CrossRef]
  21. Giri, S.S.; Ryu, E.; Sukumaran, V. Antioxidant, antibacterial, and anti-adhesive activities of biosurfactants isolated from Bacillus strains. Microb. Pathog. 2019, 132, 66–72. [Google Scholar] [CrossRef] [PubMed]
  22. Lin, L.-Z.; Zheng, Q.-W.; Wei, T. Isolation and Characterization of Fengycins Produced by Bacillus amyloliquefaciens JFL21 and Its Broad-Spectrum Antimicrobial Potential against Multidrug-Resistant Foodborne Pathogens. Front. Microbiol. 2020, 11, 579621. [Google Scholar] [CrossRef]
  23. Cladera-Olivera, F.; Caron, G.; Brandelli, A. Bacteriocin-like substance production by Bacillus licheniformis strain P40. Lett. Appl. Microbiol. 2004, 38, 251–256. [Google Scholar] [CrossRef] [PubMed]
  24. Shobharani, P.; Padmaja, R.J.; Halami, P.M. Diversity in the antibacterial potential of probiotic cultures Bacillus licheniformis MCC2514 and Bacillus licheniformis MCC2512. Res. Microbiol. 2015, 166, 546–554. [Google Scholar] [CrossRef] [PubMed]
  25. Díaz, P.R.; Torres, M.J.; Petroselli, G. Antibacterial activity of Bacillus licheniformis B6 against viability and biofilm formation of foodborne pathogens of health importance. World J. Microbiol. Biotechnol. 2022, 38, 181. [Google Scholar] [CrossRef] [PubMed]
  26. Mm, Y.; Hl, F.; Kn, T. Effect of heterogeneity of hydrophobic moieties on surface activity of lichenysin A, a lipopeptide biosurfactant from Bacillus licheniformis BAS50. Biotechnol. Appl. Biochem. 1996, 23, 13–18. [Google Scholar]
  27. Joshi, S.; Yadav, S.; Desai, A.J. Application of response-surface methodology to evaluate the optimum medium components for the enhanced production of lichenysin by Bacillus licheniformis R2. Biochem. Eng. J. 2008, 41, 122–127. [Google Scholar] [CrossRef]
  28. Coronel-León, J.; Marqués, A.; Bastida, J. Optimizing the production of the biosurfactant lichenysin and its application in biofilm control. J. Appl. Microbiol. 2016, 120, 99–111. [Google Scholar] [CrossRef] [Green Version]
  29. Mnif, I.; Ellouze-Chaabouni, S.; Ghribi, D. Optimization of inocula conditions for enhanced biosurfactant production by Bacillus subtilis SPB1, in submerged culture, using Box–Behnken design. Probiotics Antimicrob. Proteins 2013, 5, 92–98. [Google Scholar] [CrossRef]
  30. Ia Haddad, N.; Gang, H.; Liu, J. Optimization of surfactin production by Bacillus subtilis HSO121 through Plackett-Burman and response surface method. Protein Pept. Lett. 2014, 21, 885–893. [Google Scholar] [CrossRef]
  31. Moshtagh, B.; Hawboldt, K.; Zhang, B. Optimization of biosurfactant production by Bacillus subtilis N3-1P using the brewery waste as the carbon source. Environ. Technol. 2018, 40, 3371–3380. [Google Scholar] [CrossRef]
  32. Mercier, P.; Yerushalmi, L.; Rouleau, D. Kinetics of lactic acid fermentation on glucose and corn by Lactobacillus amylophilus. J. Chem. Technol. Biotechnol. 1992, 55, 111–121. [Google Scholar] [CrossRef]
  33. Zhang, C.-H.; Wu, J.-Y.; He, G.-Y. Effects of inoculum size and age on biomass growth and paclitaxel production of elicitor-treated Taxus yunnanensis cell cultures. Appl. Microbiol. Biotechnol. 2002, 60, 396–402. [Google Scholar]
  34. Xi, B.-D.; He, X.-S.; Wei, Z.-M. Effect of inoculation methods on the composting efficiency of municipal solid wastes. Chemosphere 2012, 88, 744–750. [Google Scholar] [CrossRef]
  35. Tari, C.; Parulekar, S.J.; Stark, B.C. Synthesis and excretion of α-amylase in vgb+ and vgb recombinant escherichia coli: A comparative study. Biotechnol. Bioeng. 1998, 59, 673–678. [Google Scholar] [CrossRef]
  36. Zhu, C.; Xiao, F.; Qiu, Y. Lichenysin production is improved in codY null Bacillus licheniformis by addition of precursor amino acids. Appl. Microbiol. Biotechnol. 2017, 101, 6375–6383. [Google Scholar] [CrossRef]
  37. Qiu, Y.; Xiao, F.; Wei, X. Improvement of lichenysin production in Bacillus licheniformis by replacement of native promoter of lichenysin biosynthesis operon and medium optimization. Appl. Microbiol. Biotechnol. 2014, 98, 8895–8903. [Google Scholar] [CrossRef]
  38. Stanbury, P.F.; Whitaker, A.; Hall, S.J. Principles of Fermentation Technology; Elsevier: Amsterdam, The Netherlands, 2013. [Google Scholar]
  39. Ghribi, D.; Elleuch, M.; Abdelkefi-Mesrati, L. Histopathological effects of Bacillus subtilis SPB1 biosurfactant in the midgut of Ephestia kuehniella (Lepidoptera: Pyralidae) and improvement of its insecticidal efficiency. J. Plant Dis. Prot. 2012, 119, 24–29. [Google Scholar] [CrossRef]
  40. Qiu, H.W.; Yang, S.Z. The characteristics of Aureobasidium pullulans fermentation process. Chin. J. Biotechnol. 1990, 6, 293–302. [Google Scholar]
  41. Govind, R. Dynamic measurement of the volumetric oxygen transfer coefficient in fermentation systems. Biotechnol. Bioeng. 2009, 104, 841–853. [Google Scholar]
  42. Ozbek, B.; Gayik, S. The studies on the oxygen mass transfer coefficient in a bioreactor. Process Biochem. 2001, 36, 729–741. [Google Scholar] [CrossRef]
  43. Badino, A.C.; Facciotti, M.C.R.; Schmidell, W. Volumetric oxygen transfer coefficients (KLa) in batch cultivations involving non-Newtonian broths. Biochem. Eng. J. 2001, 8, 111–119. [Google Scholar] [CrossRef]
  44. Tang, B.; Qiu, B.; Huang, S.S. Distribution and mass transfer of dissolved oxygen in a multi-habitat membrane bioreactor. Bioresour. Technol. 2015, 182, 323–328. [Google Scholar] [CrossRef] [PubMed]
  45. Potumarthi, R.; Ch, S.; Jetty, A. Alkaline protease production by submerged fermentation in stirred tank reactor using Bacillus licheniformis NCIM-2042: Effect of aeration and agitation regimes. Biochem. Eng. J. 2007, 34, 185–192. [Google Scholar] [CrossRef]
  46. Vilaca, P.; Badino Jr, A.; Facciotti, M. Determination of power consumption and volumetric oxygen transfer coefficient in bioreactors. Bioprocess Eng. 2000, 22, 261–265. [Google Scholar] [CrossRef]
  47. Gauthier, L.; Thibault, J.; Leduy, A. Measuring KLa with randomly pulsed dynamic method. Biotechnol. Bioeng. 1991, 37, 889–893. [Google Scholar] [CrossRef]
  48. Lin, S.-C.; Carswell, K.; Sharma, M. Continuous production of the lipopeptide biosurfactant of Bacillus licheniformis JF-2. Appl. Microbiol. Biotechnol. 1994, 41, 281–285. [Google Scholar] [CrossRef]
  49. Ali, N.; Wang, F.; Xu, B. Production and Application of Biosurfactant Produced by Bacillus licheniformis Ali5 in Enhanced Oil Recovery and Motor Oil Removal from Contaminated Sand. Molecules 2019, 24, 4448. [Google Scholar] [CrossRef] [Green Version]
  50. Chang-Gui, Z.; Dan, W.; Qin, Z. Study on processing technology of instant salted soybean curd skin. China Condiment 2013, 38, 89–92. [Google Scholar]
  51. Rodrigues, L.R.; Teixeira, J.A.; Oliveira, R. Low-cost fermentative medium for biosurfactant production by probiotic bacteria. Biochem. Eng. J. 2006, 32, 135–142. [Google Scholar] [CrossRef] [Green Version]
  52. Yalçın, H.T.; Ergin-Tepebaşı, G.; Uyar, E. Isolation and molecular characterization of biosurfactant producing yeasts from the soil samples contaminated with petroleum derivatives. J. Basic Microbiol. 2018, 58, 782–792. [Google Scholar] [CrossRef]
  53. Joshi, S.J.; Desai, A.J. Bench-Scale Production of Biosurfactants and their Potential in Ex-Situ MEOR Application. Soil Sediment Contam. Int. J. 2013, 22, 701–715. [Google Scholar] [CrossRef]
Figure 1. (a) Effect of diverse carbon sources on a lichenysin titer. (b) Influence of various nitrogen sources on lichenysin titer. (c) Impact of distinct amino acids on a lichenysin titer. (d) Effect of inorganic salts on lichenysin concentration. Variation of lichenysin concentration with addition of trace element solution (e), inoculum volume (f), shaker speed (g), and working volume (h).
Fermentation 08 00712 g001
Figure 2. Three-dimensional response surface plots produced for lichenysin showing the interaction effects of sucrose, NH4NO3, and inoculum at different concentrations of the other two factors when one of them was a fixed concentration. (a) The interaction of sucrose and NH4NO3, (b) sucrose and inoculum, and (c) NH4NO3 and inoculum.
Fermentation 08 00712 g002
Figure 3. Optimization of stirring speed (a) and aeration rate (b) based on lichenysin production. (c) Analysis of the kinetic process of lichenysin production.
Fermentation 08 00712 g003
Figure 4. Growth kinetic curves for fed-batch fermentation production of lichenysin.
Fermentation 08 00712 g004
Publisher’s Note: MDPI stays neutral with regard to jurisdictional claims in published maps and institutional affiliations.

