Article

A CRISPR-Cas12a-Based Assay for Efficient Quantification of Lactobacillus panis in Chinese Baijiu Brewing Microbiome

1
Key Laboratory of Carbohydrate Chemistry and Biotechnology, Ministry of Education, Jiangnan University, Wuxi 214122, China
2
Science Center for Future Foods, Jiangnan University, Wuxi 214122, China
3
Engineering Research Center of Ministry of Education on Food Synthetic Biotechnology, Jiangnan University, Wuxi 214122, China
4
Jiangsu Province Engineering Research Center of Food Synthetic Biotechnology, Jiangnan University, Wuxi 214122, China
5
Kweichow Moutai Distillery Co., Ltd., Renhuai 564501, China
6
Kweichow Moutai Group, Renhuai 564501, China
*
Authors to whom correspondence should be addressed.
Fermentation 2022, 8(2), 88; https://doi.org/10.3390/fermentation8020088
Submission received: 4 January 2022 / Revised: 9 February 2022 / Accepted: 14 February 2022 / Published: 19 February 2022
(This article belongs to the Section Industrial Fermentation)

Abstract

:
Although the quantification of key microorganisms in fermentation microbiomes is important for monitoring and regulating fermented food production, conventionally used methods are generally time-consuming, involve complicated operations, and have a high level of equipment dependence. We developed a CRISPR-Cas12a-based quantitative Chinese Baijiu brewing microorganism assay (CQAOB) for Lactobacillus panis, the most important lactic acid-producing fermentative microorganism. We initially verified the feasibility of CQAOB for detecting L. panis, and then optimized the reaction parameters to enhance Cas12a detection sensitivity. The specificity of the developed method was verified via the accurate distinction of L. panis nucleic acids from those of other lactic acid bacteria. The quantitative range and detection time for L. panis were 106–109 copies/μL and 40 min, respectively. Finally, we successfully applied CQAOB for quantifying L. panis count in fermented grains. Given its rapid detection and low level of equipment dependence, CQAOB may make an important contribution to quantifying key microorganisms in brewing processes.

1. Introduction

Maotai-flavored Baijiu is a typical traditional fermented product produced using solid-state fermentation based on a brewing microbiome containing a diverse range of microorganisms [1]. Lactic acid bacteria are key bacteria in the fermentation of Maotai-flavored Baijiu, during which they produce lactic acid [2], a major organic acid and precursor of ethyl lactate, which confers the distinct flavor of Chinese Maotai-flavored Baijiu [3,4,5]. Among the lactic acid-producing bacteria, Lactobacillus panis has been identified as the most important in the fermentation of Maotai-flavored Baijiu, although relative abundances typically vary in the brewing microbiome during the fermentation process [6,7]. In this latter regard, the quantification of important brewing microorganisms can characterize metabolic activity during fermentation and provide guidance for the regulation of the fermentation process.
There are currently multiple quantitative methods available for monitoring lactic acid bacteria [8], among which plate counting has traditionally been used to determine changes in the number of lactic acid bacteria during the solid-state fermentation [9,10]. However, although plate counts are inexpensive and entail relatively simple procedures, they typically involve long cultivation times, are unable to measure non-cultivable microorganisms, and are often unable to distinguish between different species. In terms of bacterial nucleic acid detection, quantitative real-time PCR (qPCR) is currently used as the standard method, and quantitative methods have been developed for L. acetotolerans, Lactobacillus. sp. and other microorganisms used in the brewing process, with minimum quantitative detection sensitivities of down to 20 copies/μL [11,12]. However, despite the high sensitivity, high accuracy, and short detection times, qPCR is both expensive and has a high level of equipment dependence. Moreover, when using this technique, it is generally difficult to distinguish among highly homologous microbial species. As an alternative technique, flow cytometry has also been used to analyze bacteria in biological fermentation systems based on in situ hybridization fluorescence detection [13,14]. Nevertheless, although the flow cytometry procedure is rapid and provides accurate cell counts, similar to qPCR, it has a high level of equipment dependence and high costs. More importantly, using flow cytometry, it is difficult to distinguish between different microbial species. A further approach, based on high-throughput amplicon sequencing in combination with qPCR, has been developed for multi-strain quantification of the microorganisms in the brewing microbiome, with L. acetotolerans and L. jinshani as internal standards [15,16]. Again, however, this is a high-cost technique and involves lengthy sequencing and data analysis procedures.
To overcome the various limitations associated with the aforementioned quantification methods, clustered regularly spaced short palindrome repeats (CRISPR)-Cas12a-based microbial detection has been developed in recent years [17]. Cas12a (also referred to as Cpf1) is a class II type V CRISPR protein system [18]. When Cas12a, a target double-stranded DNA (dsDNA) containing a protospacer adjacent motif (PAM) sequence, and CRISPR RNA (crRNA), complementary to the target dsDNA, are mixed, a ternary complex is generated, which has trans-cleavage activity that facilitates the indiscriminate cleavage of ssDNA (single-stranded DNA). Thus, by constructing probes comprising fluorescent and quenching groups linked by an ssDNA, fluorescence can be detected with the release of fluorescent groups following ssDNA cleavage, thereby establishing a relationship between the targeted nucleic acid fragments and fluorescence, and consequently enabling the qualitative and quantitative detection of target nucleic acid [19]. A number of nucleic acid detection tools based on the CRISPR system have subsequently been developed, including a DNA endonuclease-targeted CRISPR trans-reporter, which has the advantages of having a short detection time, low cost, a low level of equipment dependence, high sensitivity, and high specificity [17]. To date, however, CRISPR-Cas12a-based detection has yet to be applied in analyses of the microbes used in the brewing process.
In this study, we developed a CRISPR-Cas12a-based quantitative Chinese Baijiu brewing microorganism assay (CQAOB) for L. panis, for which we optimized key parameters of the detection system to enhance detection sensitivity. Moreover, we verified the high specificity of the system on the basis of analyses of multiple strains of homologous lactic acid bacteria and established a quantitative standard curve for L. panis. By quantifying samples of known concentrations, we also demonstrated the good consistency of detection achievable when using this method. Finally, we demonstrated the applicability of the CQAOB procedure in quantifying L. panis in fermented grains. We accordingly believe that the CQAOB system can make an important contribution toward quantifying key microorganisms in the brewing process.

2. Materials and Methods

2.1. Reagents and Instruments

All the primers and ssDNA probes used in this study were synthesized by Genewiz (Jiangsu, China). The crRNA used is a synthetic single-stranded primer annealed using a Beyotime (Jiangsu, China) annealing buffer to generate a double-stranded DNA transcription template, which was then transcribed using a T7 high-yield RNA transcription kit (Thermo Fisher, Waltham, MA, USA). Following transcription, the RNA was purified using an RNA purification kit (Zymo Research, Irvine, CA, USA). A plasmid extraction kit was purchased from Shanghai Sangon (Shanghai, China); an RNase inhibitor and RNase/DNase-free water were purchased from Takara Bio (Beijing, China); Cas12a and its dedicated buffer were purchased from TOLOBIO (Shanghai, China); and lactic acid bacteria strains were obtained from a Chinese Baijiu company. The lactic acid bacteria genome was extracted using a Sangon (Shanghai, China) genome kit, and part of the dsDNA was derived from double-stranded annealing and PCR amplification and purified using a Thermo Fisher (Waltham, MA, USA) purification kit. For PCR amplification, we used a Thermo Fisher Proflex PCR system (Waltham, MA, USA). The quantification of nucleic acids was performed using a Nanodrop accounting quantification instrument (Lifes Bio, Nanjing, China) and nucleic acid sample inspection was conducted using a nucleic acid gel electrophoresis instrument (Bio-Rad, CA, USA), with detection using a BioTek (Winooski, VT, USA) microplate reader, which also enabled us to generate kinetic curves and related data.

2.2. Preparation of Target Nucleic Acids

The target nucleic acid samples used in this study can be divided into three types. The first of these is derived from the annealing of complementary single-stranded DNA primers at 95 °C for 2 min, with each cycle lasting 8 s. The temperature was then reduced by 0.1 °C per cycle over 700 cycles, followed by incubation at 4 °C for 10 min. The second sample type is derived from lactic acid bacteria using a genomic extraction kit. The bacteria used were cultured at 37 °C for 3 days, after which 5 mL aliquots were withdrawn for nucleic acid extraction using a Biotech Genome Extraction Kit, following the manufacturer’s instructions. The third sample type was derived from the PCR products of genomic samples, which were amplified using the following PCR program: an initial denaturation at 98 °C for 2 min, followed by 35 cycles of 98 °C for 15 s, 55 °C for 15 s, and 72 °C for N/2000 min, and a final elongation at 72 °C for 5 min, with subsequent incubation at 4 °C for 10 min (where N is the length of PCR products (bp)). The PCR products, thus obtained, were purified using a Thermo Fisher (Waltham, MA, USA) purification kit, following the manufacturer’s instructions.

2.3. Preparation of crRNA and ssDNA Probes

The crRNA sequences (8 pairs) were designed based on the 16S rDNA and gyrB genes of lactic acid bacteria, for which multiple sequences had been aligned. To these sequences, enhancer and T7 promoter sequences were subsequently added at the 5′ ends (Table 1).
For ssDNA probes, we selected FAM 5′-TTATT-3′ BHQ1 and HEX 5′-TTATT-3′ BHQ1, in which FAM and HEX are fluorescent groups, BHQ1 is a quenching group, and 5′-TTATT-3′ is the ssDNA. These probes were synthesized commercially by Genewiz (Jiangsu, China).

2.4. Overview of the Detection Process

Schematic diagrams of the CQAOB process and detection procedure used in this study are shown in Figure 1A,B, respectively. Initially, we performed the rapid extraction of the target DNA of the sample to be assessed, and used this DNA as a template for CQAOB detection. The 20 µL reaction systems consisted of 2 μL of 10× TOLOBIO Buffer, 2 μL of 50 nM Cas12a, 1 μL of 1000 nM crRNA, 0.5 μL of RNase inhibitor(1U), 1 μL of 500 nM ssDNA probe, 12.5 μL of enzyme-free water, and 1 μL of DNA template. The reaction mixtures were pipetted into the wells of 96-well plates, to which a further 80 μL of enzyme-free water was added. The plates were then placed in a microplate reader to provide a constant reaction temperature of 37 °C, which was maintained for 1 h. Assessments were made at 2 min intervals, shaking for 15 s prior to analysis. The data, thus obtained, were processed to yield the detection results.

2.5. Verification of the CRISPR-Cas12a-Mediated Trans-Cleavage Fluorescent Reporter System (CQAOB)

We initially sought to verify that the purchased Cas12a has trans-cleavage activity. To this end, we selected crRNA and target DNA sequences reported in the literature, which were inserted into a PET28a plasmid. These constructs were then used to transform Escherichia coli JM109, as a host, to amplify the recombinant plasmid. We designed a pair of primers to generate a 2400 bp product, in which the insertion of the target DNA causes the cleavage of PCR products into 1000 and 1400 bp fragments. A crRNA transcription template was then synthesized and transcribed in vitro to obtain crRNA. Thereafter, we prepared a mixed detection system comprising the 2400 bp template containing the aforementioned target sequence. Samples were thoroughly mixed and, following reactions, 5 μL of the reaction mixtures was added to 1 μL of DNA loading buffer and run on agarose gels for detection, using a 5000 bp DNA marker as a reference. As a control sample, we used the same reaction without the addition of Cas12a.
To verify the ability of the CQAOB system to specifically detect lactic acid bacteria nucleic acid, we designed a target sequence from the 16S rDNA of L. panis, with fragments containing the target sequence being obtained via plasmid construction and direct PCR. These fragments were then used to verify the activity of Cas12a and in vitro-transcribed crRNA for detection, based on the analysis of the data obtained using a microplate reader.

2.6. Optimization of CQAOB

The key components of the CQAOB system are Cas12a, crRNA, and ssDNA probes, the respective amounts of which determine the sensitivity of detection. Appropriate amounts of these components can reduce the cost of detection, while still facilitating high detection sensitivity. For the purposes of optimizing the detection system, we adjusted the concentrations of Cas12a and crRNA and evaluated the type of modified probes used for ssDNA. The initially designed detection system comprised 50 nm Cas12a, 1000 nM crRNA, and the HEX-TTATT-BHQ1. To optimize the system contents, we assessed the detection efficacy at Cas12a concentrations of 2000, 1000, 500, 200, 100, and 50 nM, at crRNA concentrations of 2000, 1000, 500, 200, 100, and 50 nM, and with HEX-TTATT-BHQ1 and FAM-TTATT-BHQ1 probe types. Evaluations were made on the basis of single-factor gradient change, with optimization efficacy being assessed from the analysis of microplate reader data.

2.7. Analysis of the Detection Capability of CQAOB

To assess the specificity of the detection system, we used genome sequencing data for 13 Lactobacillus strains based on ClustalW alignment and NCBI BLAST searches, from which a conserved region of the sequences was selected. To verify the specificity of selected target detection, we used BLAST to compare the sequences of all selected targets with that of the Lactobacillus genome (taxid: 91061). On the basis of a combination of our comparative data results and literature reports, we selected 16S rDNA and gyrB gene sequences as target nucleic acid candidate regions, and eight targets were designed for each sequence. The genomes of the selected eight strains were mixed in equal proportions, and the mixed genomes were used as a template to verify the specificity of the detection system in the analyses of these eight targets.
To evaluate the range of quantification, we performed the specific screening of targets. The PCR product of the target gene was purified using the aforementioned purification kit, and this was used as the standard fragment. Having quantified the PCR product using a Nanodrop quantifier and confirmed the concentration, we prepared serial dilutions, which were used as templates for subsequent detection. Using the following formula, we established a gradient range of 10−5–10−13 M:
(6.02 × 10²³ copies/mol) × (concentration g/μL)/(MW g/mol) = copies/μL
The molar concentration was converted to a copy number, and the detection and quantification limits were determined by analyzing the data obtained using the microplate reader.
The reaction system used for qPCR was based on TBgreen II (Takara, Beijing, China), and we followed the manufacturer’s recommendations. As primers, we used the LP1f/LP1r pair, the sequences of which are TTCGGCCATTGAAGAAGAAG and GCCGTCATCCGTTAGTGAAT, respectively. The templates used to construct a standard curve were obtained by serial dilution after the purification of the PCR product. The corresponding amplification primers were q1f-ACCAAGGTACTTCTCCACGGT and q1r-TGGGAATGGAAGTGGAAAGATGA, with the L. panis genome being used as a template.

2.8. Application of CQAOB Detection

To establish the accuracy of the CQAOB system, we constructed a consistency comparison curve, which we used to compare measured with known concentrations.
For this purpose, we used samples of fermented grain collected at a certain period during fermentation in the wine-making process. Bacterial genomic DNA was extracted from the samples, and qPCR and CQAOB were used to quantify the L. panis therein.

2.9. Data Analysis

The study comprised three parallel experiments, in which a BioTek (Winooski, VT, USA) microplate reader was used to detect the fluorescence intensities obtained using the respective reaction systems. The analysis of the data obtained (expressed in terms of the means ± standard error) was performed using Microsoft Office Excel 2019 (Microsoft, Redmond, WA, USA), with results being displayed graphically using OriginPro 2021 (OriginLab, Northampton, MA, USA). The schematics were drawed with Adobe Illustrator 2020 (Adobe Systems Incorporated, San Jose, CA, USA).

3. Results and Discussion

3.1. Workflow of the CQAOB System

Figure 1A shows a schematic diagram of the generation of fluorescence signals using the CRISPR-Cas12a system. The three key elements of this system are Cas12a, crRNA, and the ssDNA probe. In the presence of target DNA, Cas12a binds to crRNA and dsDNA, leading to the cleavage of the ssDNA probe, to which fluorescent and quenching groups are fused, thereby yielding a fluorescence signal. In the absence of the target DNA, the ssDNA probe remains uncleaved, and no fluorescence signal is generated. Figure 1B depicts the detection process of CQAOB analysis, which contains three key steps. In the first of these, Cas12a, crRNA, the ssDNA probe, and the sample to be analyzed are mixed for a duration of 10 min, and in the second step, the mixed reaction solution is pipetted into 96-well plates for 5 min. The reaction mixtures are incubated at a constant temperature for 1h in the third step, and the kinetic curve of fluorescence, which reflects the rate of the ssDNA probe cleavage and is proportional to the target DNA concentration, is determined. The whole detection time is 75 min.

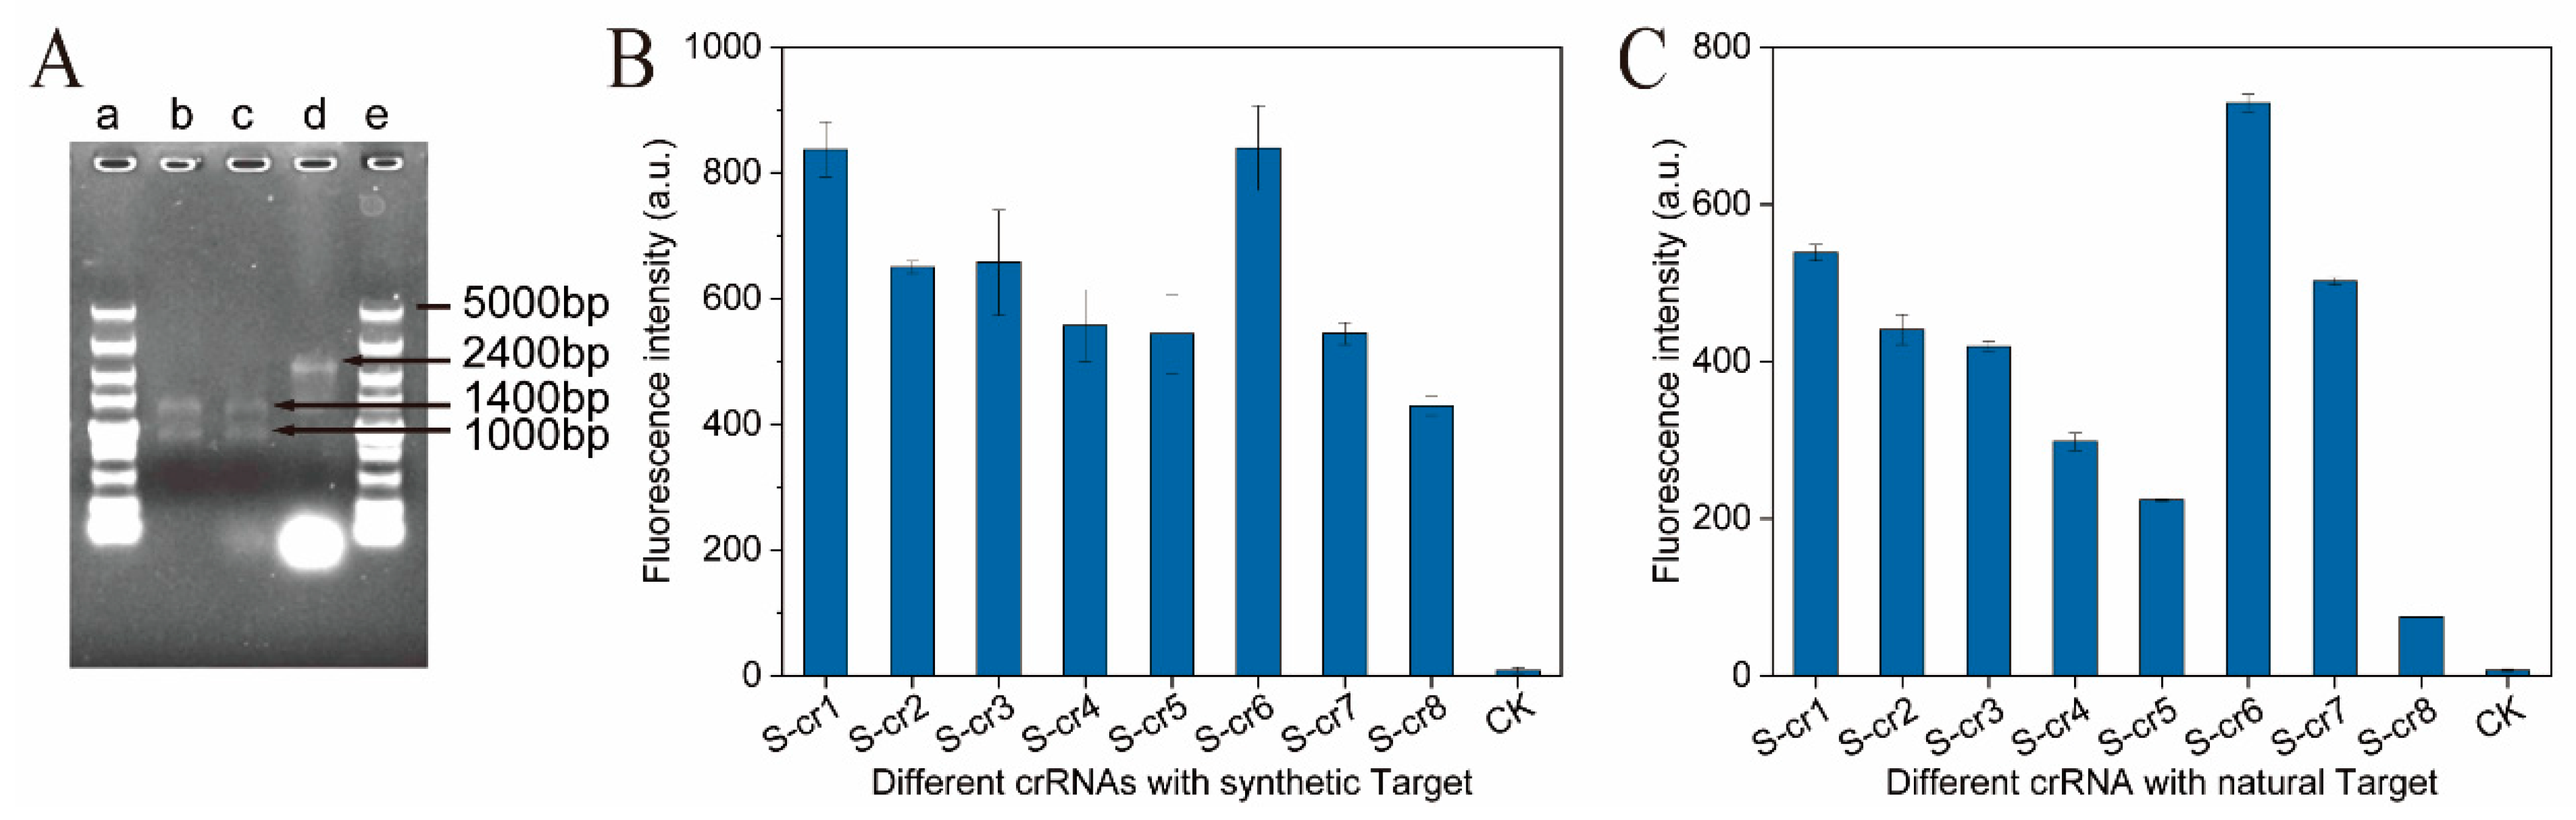
3.2. Construction of a Lactobacillus panis DNA Fluorescence Reporter System Based on Cas12a

The targeted dsDNA cis-cleavage activity of Cas12a is associated with the trans-cleavage activity for ssDNA, which is used for ssDNA probe cleavage and fluorescence generation. Consequently, we initially sought to verify the cleavage activity of Cas12a with respect to the targeted dsDNA. As shown in Figure 2A, using previously reported target and crRNA sequences (DNMT1 and DNMT2, respectively) (Table 1) [19], a 2.4 kb target DNA fragment, crRNA, and Cas12a were mixed and incubated. The reaction products, thus generated, were of fragment sizes 1.4 and 1 kb, which are consistent with expectations and accordingly confirmed the targeted dsDNA cleavage activity of the Cas12a used in this study. On the basis of these observations, we proceeded with the construction of an L. panis DNA fluorescence reporter system based on Cas12a trans-cleavage activity.
For the purposes of L. panis DNA fluorescence reporter system construction, we prepared a reaction mixture comprising Cas12a, crRNA, the ssDNA probe, and a fragment of the 16S rDNA of L. panis (50 bp synthetic fragment of 16S rDNA and a 1.5 kb 16S rDNA fragment amplified by colony PCR with the bacterial universal 16S rDNA primers 27F and 1492R, using an L. panis colony as a template). As shown in Figure 2B, all selected eight crRNAs can be used to facilitate Cas12a binding to the 50 bp synthetic 16S rDNA of L. panis, which activates the trans-cleavage activity of Cas12a, thereby leading to the cleavage of the ssDNA probe and, thus, generating fluorescence. The coding sequences of the crRNAs are shown in Table 1. The sequence region (coding vs. noncoding strand, 5′ vs. 3′ ends) of the 16S rDNA that crRNA targets is shown in Supplementary Figure S1. The 16S rDNA fragment of L. panis obtained by colony PCR using an L. panis colony as a template was similarly assessed using the reporter system (Figure 2C), for which fluorescence generation was likewise detected. Therefore, we established that fluorescence is generated in the presence of an L. panis 16S rDNA fragment. Therefore, the crRNA used for subsequent optimization was S-cr6, which yielded highest fluorescence intensity among different crRNAs.

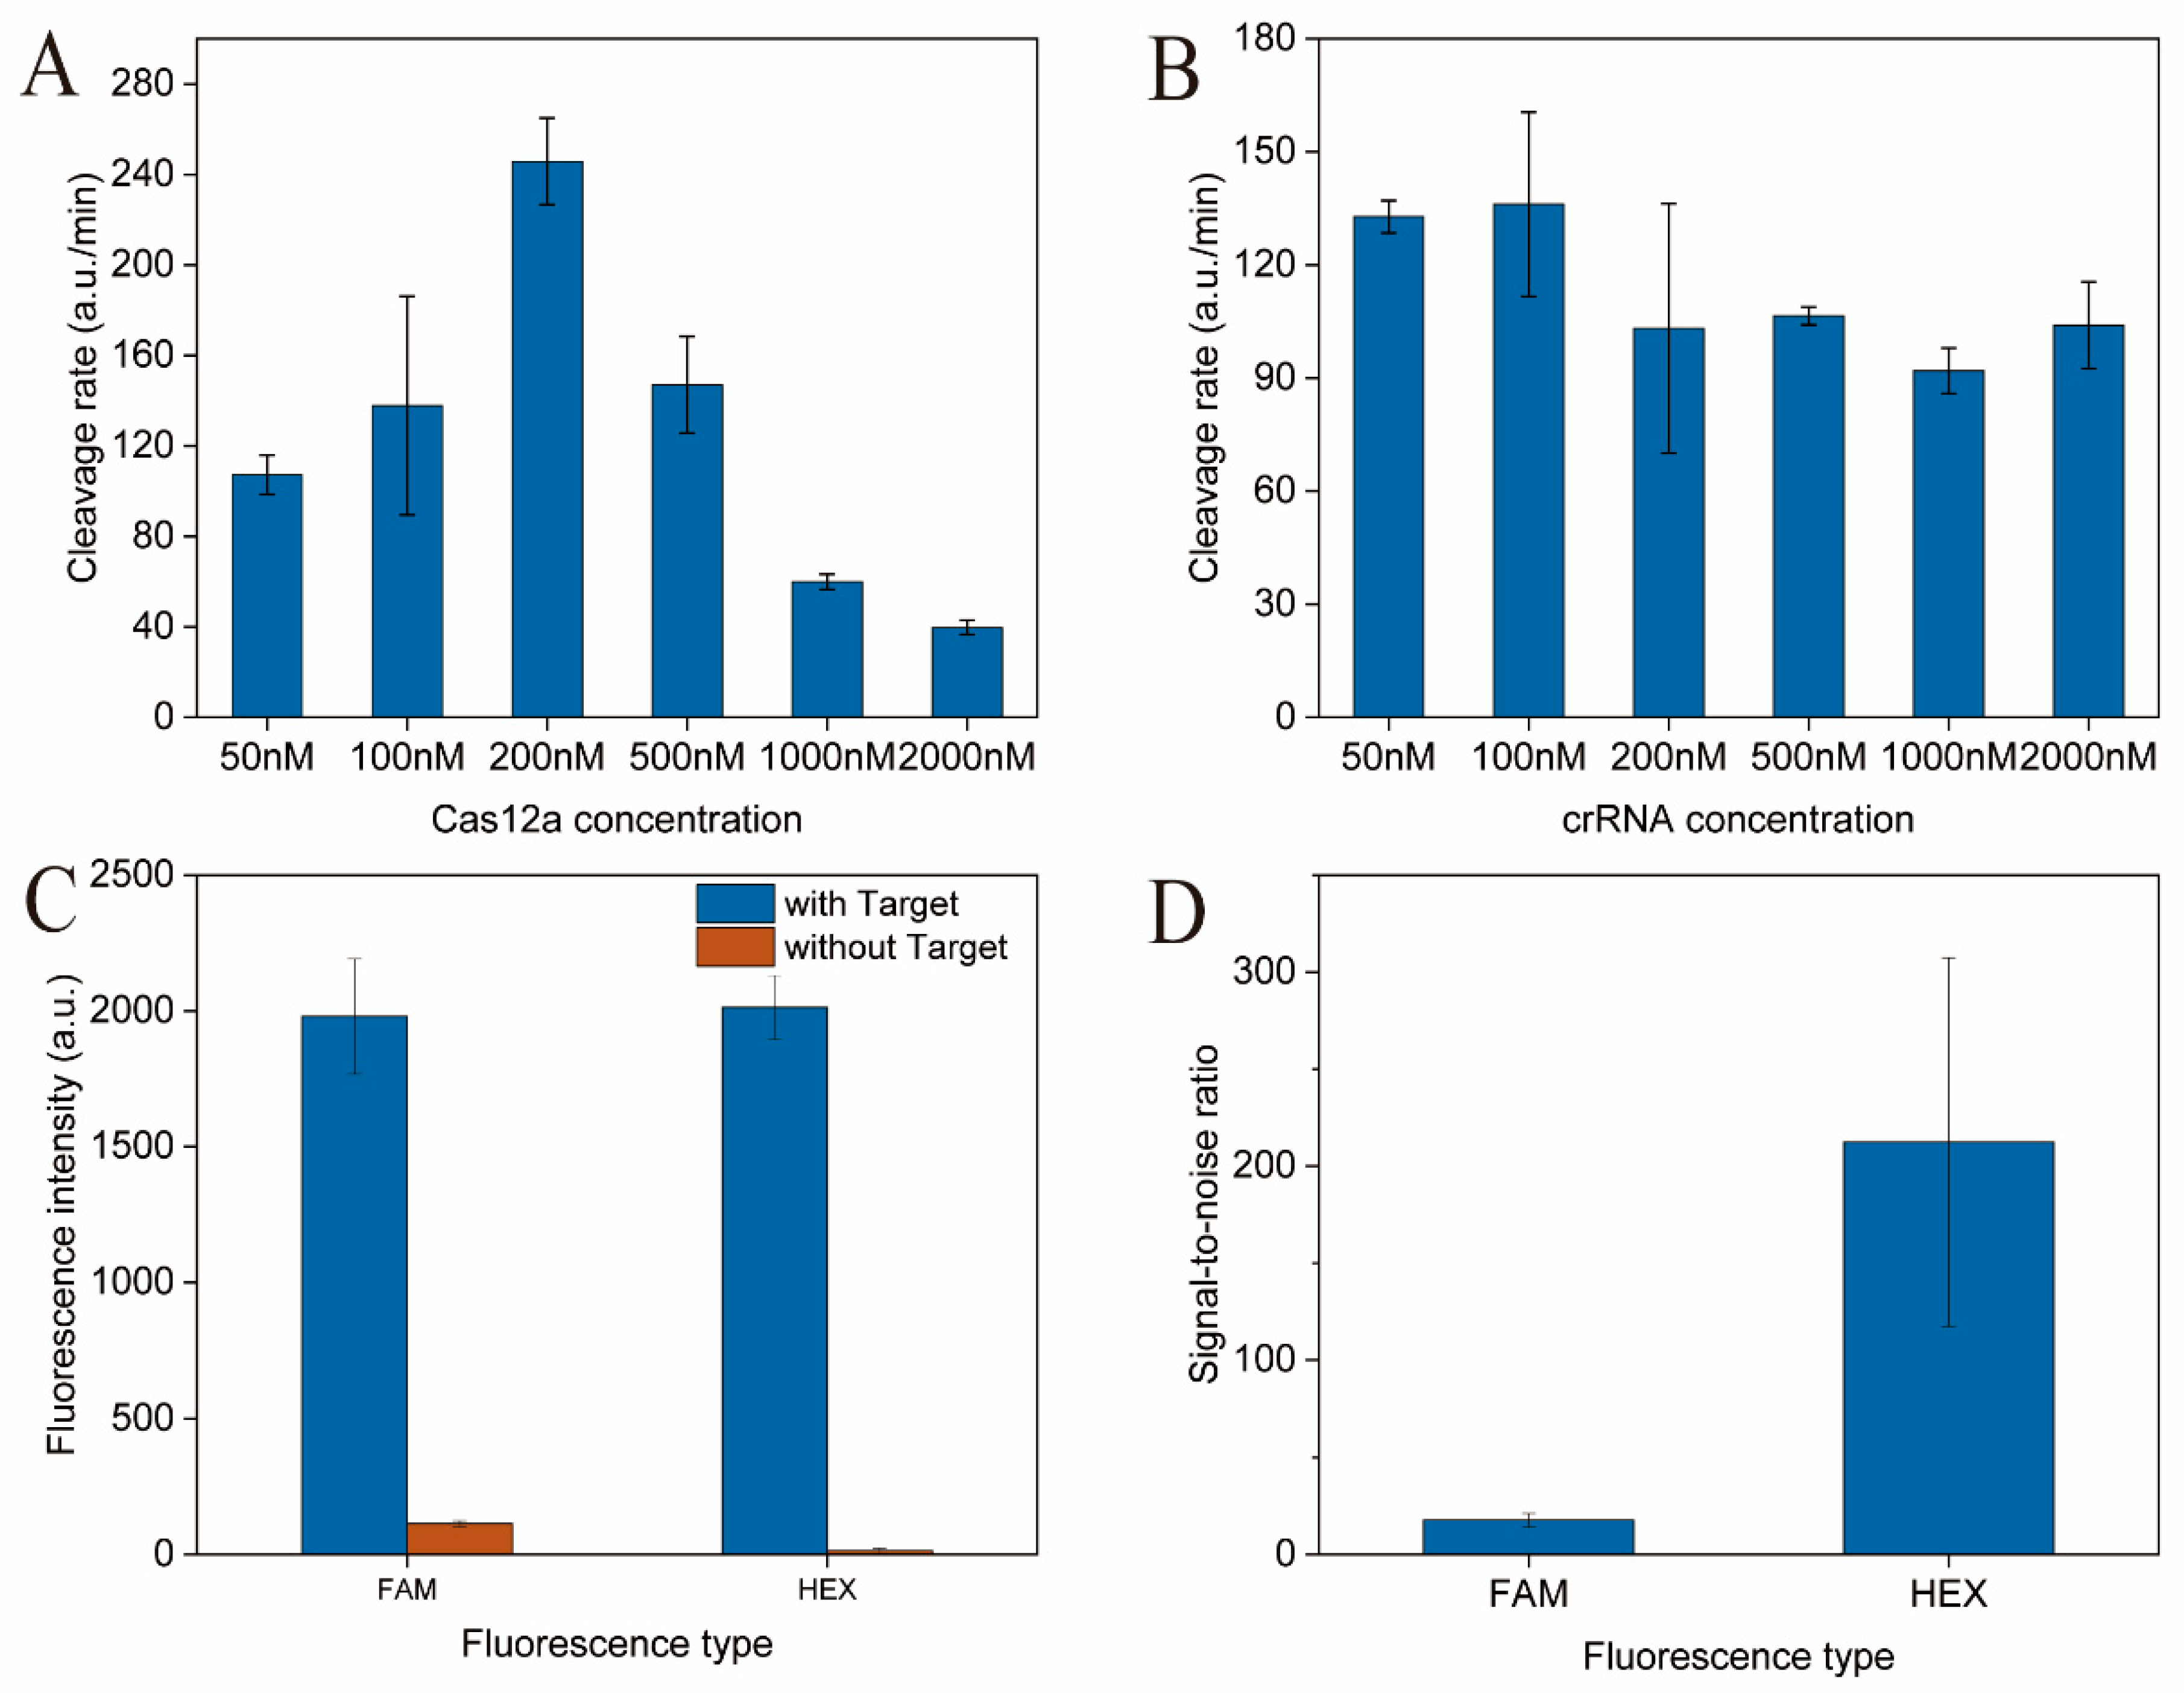
3.3. Optimization of the CRISPR-Cas12a Target DNA Detection System for L. panis

The cleavage rate of CRISPR-Cas12a (the slope of fluorescence intensity) in the L. panis DNA fluorescence reporter system is proportional to the concentration of target DNA [20]. On the basis of this relationship, we thus used the cleavage rate of CRISPR-Cas12a for the quantification of target DNA. For this purpose, we optimized the concentrations of Cas12a and crRNA and the type of ssDNA probe used in the CRISPR-Cas12a target DNA detection system using a stepwise approach. As shown in Figure 3A, the rate of CRISPR-Cas12a cleavage initially increases and subsequently decreases with an increase in the Cas12a concentration. We found that the maximum cleavage could be obtained at a Cas12a concentration of 200 nM, which gave a signal value 2.1-fold higher than that obtained with the initial concentration of 50 nM. With respect to crRNA, we established that the cleavage rate decreases with an increase in the crRNA concentration, with the cleavage at 100 nM crRNA being 1.5-fold higher than that at the initial value of 1000 nM (Figure 3B). Furthermore, in terms of ssDNA probe type, we selected the HEX probe based on a similar fluorescence intensity and a 11.7-fold higher signal-to-noise ratio than the FAM probe (Figure 3C,D). By thus optimizing the detection system, we obtained a considerable enhancement of the signal generated using the newly developed detection system. Accordingly, optimal conditions for the CRISPR-Cas12a target DNA detection system for L. panis are as follows: 200 nM Cas12a, 100 nM crRNA, and a HEX-BHQ1-type ssDNA probe.

3.4. Analysis of the Specificity and Detection Range of the CRISPR-Cas12a Target DNA Detection System for L. panis

To obtain lactic acid bacteria sequences specific to L. panis for crRNA design, we selected a further 12 species of lactic acid bacteria that have a phylogenetically close relationship with L. panis [21], namely, Pediococcus cellicola, L. rhamnosus, L. rapi, L. pontis, L. paracasei, L. parafarraginis, L. homohiochii, L. fructivorans, L. fermentum, L. buchneri, L. amylovorus, and L. alimentarius, for which 16S rDNA and gyrB gene sequences were aligned. We accordingly detected numerous differences among the compared sequences, from which we selected different sequences containing PAM sites to design the respective crRNAs. As shown in Figure 4A, based on our assessment of eight crRNAs, we established that all crRNAs showed good specificity, with crRNA g7 reaching the highest target signal value. crRNA g7 was accordingly selected for L. panis-specific quantification.
As shown in Figure 4C, at the gradient dilution sample copy numbers between 106 and 109, the rate of cleavage showed a good linear relationship with that of the sample copy number, with correlation coefficients reaching 0.997. Based on these findings, we established the following standard curve equation:
y = 2∗10−7x + 4.30,
where x is the number of sample copies (copies/μL) and y is the cleavage rate (a.u./min). The y value was determined by calculating the slope of the kinetic curve from 10 min to 30 min, prepared based on the detection data obtained using the microplate reader. As the curve showed inconsistencies over the initial 10 min of the reaction (Figure 4B), sample points subsequent to 10 min were selected. At 30 min, a sufficient number of sample points had been obtained, and thereafter the slope showed no appreciable further change with increasing time. We accordingly denoted 30 min as the cut-off time point to shorten the detection time. Therefore, the whole detection time was decreased to 45 min.

3.5. Consistency Assessment and Detection in Fermented Grains

To establish the consistency of the developed detection system, we prepared a series of samples with known concentrations and obtained the corresponding cleavage rates through detection. We used this information to construct a standard curve, from which detected sample concentrations can be ascertained. The results revealed a good consistency between the measured and expected concentrations, with correlation coefficient values reaching 0.998 (Figure 5A), thereby establishing that the method developed for L. panis quantification is accurate. To assess L. panis numbers in fermentation samples, we extracted total DNA from a sample of fermented grain, and accordingly obtained values of 1.94 × 10⁷ copies/μL using the CQAOB and 4.32 × 10⁶ copies/μL based on qPCR analysis (Figure 5B). Given the broad comparability of these values, we deemed the newly developed detection method to be applicable for microbial quantification in fermented grains.
The core of this method is the specific recognition of crRNA and target microbial nucleic acid; therefore, this method may also be used for the detection of spoilage microorganisms in fermentation systems or the detection of gut microorganisms. We need to identify the microorganisms to be detected and design reasonable crRNAs based on sequence alignment. Notably, nucleic acid samples should be extracted using genome extraction kits in the corresponding environment to achieve better detection results, which is time-consuming. Another important research direction in the future will be the development of detection methods that do not require traditional nucleic acid extraction, which can greatly simplify the detection process. Despite its multiple advantages, the CQAOB system does, nevertheless, have a major limitation, in that the scope of qualitative detection is limited. When detecting unknown samples, multiple sets of dilutions are required to obtain accurate results, which increases the workload to a certain extent. In addition, the sensitivity of the technique needs to be improved. In this latter regard, we would anticipate that recombinant polymerase amplification (RPA) could be incorporated into the system to enhance the sensitivity of detection. RPA can significantly amplify low concentrations of DNA molecules, thereby facilitating accurate quantification over a wider detection range [22].

4. Conclusions

In conclusion, CQAOB detection is developed for the efficient quantification of Lactobacillus panis in the Chinese Baijiu brewing microbiome, which is based on combining CRISPR-Cas12a and specific crRNA for the target genomic DNA sequence. The total time for CQAOB detection is only 40 min, which is shorter and less equipment-dependent than the detection time of qPCR. By using a portable fluorescence meter, portability can be further improved to expand application scenarios. CQAOB may be used as a generic method for quantifying key microorganisms in brewing processes.

Supplementary Materials

The following supporting information can be downloaded at: https://www.mdpi.com/article/10.3390/fermentation8020088/s1, Figure S1: Sequence region (coding vs. noncoding strand, 5′ vs. 3′ ends) of the 16S rDNA that crRNA targets for enhanced detection.

Author Contributions

M.W. performed the experiments; Y.L., J.L., G.D. and J.C. conceived the project and supervised the research; and Y.L., M.W., X.Z., F.Y. and L.W. designed the experiments, analyzed the data, and wrote the manuscript. All authors have read and agreed to the published version of the manuscript.

Funding

This study was financially supported by the National Key Research and Development Program of China (2018YFA0900300), the National Natural Science Foundation of China (32172349), and the China Postdoctoral Science Foundation (2021M691282).

Institutional Review Board Statement

Not applicable.

Informed Consent Statement

Not applicable.

Data Availability Statement

The authors declare that all data supporting the findings of this study are available within the paper and its supplementary information files. The datasets generated and analyzed during the current study are also available from the corresponding author upon request.

Acknowledgments

We thank the Lab of Biosystem and Bioprocess Engineering members for their insightful discussions and support.

Conflicts of Interest

The authors declare no conflict of interest.

References

  1. Ji, K. The Flavor of Moutai and Its Technological Characteristics. Food Mach. 1988, 1, 12–14, 16. [Google Scholar]
  2. Yang, F.; Chen, L.; Liu, Y.; Li, J.; Wang, L.; Chen, J. Identification of Microorganisms Producing Lactic Acid During Solid-State Fermentation of Maotai Flavour Liquor. J. Inst. Brew. 2019, 125, 171–177. [Google Scholar] [CrossRef]
  3. Zhou, H. Lactic Acid and Lactic Acid Bacteria Liquor-Making. Sci. Technol. 1995, 05, 11–14. [Google Scholar]
  4. Zeng, W.; Chen, F.; Zhan, X. The Production Technology of Lactic Acid and Its Research Progress. Chem. Ind. Eng. Prog. 2006, 7, 744–749. [Google Scholar]
  5. Li, W. Relationship Between Luzhou Flavor Liquor,Lactic Acid Bacteria,Lactic Acid and Ethyl Lactate. Liquor Mak. 2010, 37, 90–93. [Google Scholar]
  6. Yang, F.; Zhang, Q.; Liu, Y.; Li, J.; Wang, L.; Chen, J. Lactic Acid Biosynthesis Pathways and Important Genes of Lactobacillus panis L7 Isolated from the Chinese Liquor Brewing Microbiome. Food Biosci. 2020, 36, 100627. [Google Scholar] [CrossRef]
  7. Pejin, J.; Radosavljević, M.; Kocić-Tanackov, S.; Djukić-Vuković, A.; Mojović, L. Lactic Acid Fermentation of Brewer’s Spent Grain Hydrolysate by Lactobacillus rhamnosus with Yeast Extract Addition and pH Control. J. Inst. Brew. 2017, 123, 98–104. [Google Scholar] [CrossRef] [Green Version]
  8. Liu, Y.; Shu, Y.; Yang, J.; Gu, H.; Yang, Y. Research Progress of Quantitative Detection Methods of Lactic Acid Bacteria in Food. Sci. Technol. Food Ind. 2020, 41, 358–365. [Google Scholar]
  9. Fang, G.; Shan, L.; Li, H.; Wu, W.; Zhang, H. Study on the Counting Method of Active Lactic Acid Bacteria in Multi-Strain Yogurt. J. Microbiol. 2009, 29, 101–104. [Google Scholar]
  10. Li, Y.; Li, T. Study on the Methods of Affecting the Counting of Lactic Acid Bacteria Plate Colony. China Pract. Med. 2016, 11, 287–288. [Google Scholar]
  11. Du, R.; Wu, Q.; Xu, Y. Based on Three-Step Fluorescence Quantitative PCR Technology to Reveal the Distribution Characteristics of Lactobacillus sp in Liquor Brewing Systems in Different Producing Areas. J. Microbiol. 2020, 47, 1–12. [Google Scholar]
  12. Daranas, N.; Bonaterra, A.; Francés, J.; Cabrefiga, J.; Montesinos, E.; Badosa, E. Monitoring Viable Cells of the Biological Control Agent Lactobacillus plantarum PM411 in Aerial Plant Surfaces by Means of a Strain-Specific Viability Quantitative PCR Method. Appl. Environ. Microbiol. 2018, 84, e00107-18. [Google Scholar] [CrossRef] [PubMed] [Green Version]
  13. Yang, W. Fast Counting Method of Lactic Acid Bacteria Based on Flow Cytometry. China Food Saf. Mag. 2020, 21, 173. [Google Scholar]
  14. Dong, C. Application of Flow Cytometry in Rapid Detection of Bacteria. China Health Ind. 2014, 11, 194–195. [Google Scholar]
  15. Tourlousse, D.M.; Yoshiike, S.; Ohashi, A.; Matsukura, S.; Noda, N.; Sekiguchi, Y. Synthetic Spike-In Standards for High-Throughput 16S RRNA Gene Amplicon Sequencing. Nucleic Acids Res. 2017, 45, e23. [Google Scholar] [CrossRef] [PubMed] [Green Version]
  16. Du, R.; Wu, Q.; Xu, Y. Chinese Liquor Fermentation: Identification of Key Flavor-Producing Lactobacillus spp. by Quantitative Profiling with Indigenous Internal Standards. Appl. Environ. Microbiol. 2020, 86, e00456-20. [Google Scholar] [CrossRef] [PubMed]
  17. Chen, J.S.; Ma, E.; Harrington, L.B.; Da Costa, M.; Tian, X.; Palefsky, J.M.; Doudna, J.A. CRISPR-Cas12a Target Binding Unleashes Indiscriminate Single-Stranded DNase Activity. Science 2018, 360, 436–439. [Google Scholar] [CrossRef] [Green Version]
  18. Safari, F.; Zare, K.; Negahdaripour, M.; Barekati-Mowahed, M.; Ghasemi, Y. CRISPR Cpf1 Proteins: Structure, Function and Implications for Genome Editing. Cell Biosci. 2019, 9, 36. [Google Scholar] [CrossRef] [PubMed] [Green Version]
  19. McMahon, M.A.; Prakash, T.P.; Cleveland, D.W.; Bennett, C.F.; Rahdar, M. Chemically Modified Cpf1-CRISPR RNAs Mediate Efficient Genome Editing in Mammalian Cells. Mol. Ther. 2018, 26, 1228–1240. [Google Scholar] [CrossRef] [Green Version]
  20. Fozouni, P.; Son, S.; Díaz de León Derby, M.D.; Knott, G.J.; Gray, C.N.; D’Ambrosio, M.V.; Zhao, C.; Switz, N.A.; Kumar, G.R.; Stephens, S.I.; et al. Amplification-Free Detection of SARS-CoV-2 with CRISPR-Cas13a and Mobile Phone Microscopy. Cell 2021, 184, 323–333.e9. [Google Scholar] [CrossRef]
  21. Sun, Z.; Harris, H.M.B.; McCann, A.; Guo, C.; Argimón, S.; Zhang, W.; Yang, X.; Jeffery, I.B.; Cooney, J.C.; Kagawa, T.F.; et al. Expanding the Biotechnology Potential of Lactobacilli through Comparative Genomics of 213 Strains and Associated Genera. Nat. Commun. 2015, 6, 8322. [Google Scholar] [CrossRef] [PubMed]
  22. Aman, R.; Mahas, A.; Marsic, T.; Hassan, N.; Mahfouz, M.M. Efficient, Rapid, and Sensitive Detection of Plant RNA Viruses with One-Pot RT-RPA–CRISPR/Cas12a Assay. Front. Microbiol. 2020, 11, 3277. [Google Scholar] [CrossRef] [PubMed]
Figure 1. Schematic diagrams of fluorescence generation (A) and workflow (B) of target DNA detection based on the CRISPR-Cas12a system.
Fermentation 08 00088 g001
Figure 2. Cas12a trans-cleavage activity verification and a CRISPR-Cas12a fluorescence reporting system for Lactobacillus panis. (A) Cas12a activity verification. Lanes a and e are 5000 bp markers; lanes b and c are cleavage products (indicated by arrows) with sequence lengths of the target DNA fragments, Cas12a, and the ssDNA probe with different crRNAs; and lane d is the target DNA, ssDNA probe, and crRNA without Cas12a. (B) The fluorescence intensity of different crRNAs with a 50 bp synthetic 16S rDNA fragment of L. panis. (C) The fluorescence intensity of different crRNAs with 1.5 kb 16S rDNA amplified by colony PCR using an L. panis colony as a template.
Fermentation 08 00088 g002
Figure 3. CRISPR-Cas12a detection system optimization for Lactobacillus panis. (A) Cleavage rate at different working concentrations of Cas12a. (B) Cleavage rate at different working concentrations of crRNA. (C) Fluorescence intensity using different probes. (D) Signal-to-noise ratio using different ssDNA probes.
Fermentation 08 00088 g003
Figure 4. Specificity and detection range analysis of a CRISPR –Cas12a target DNA detection system for Lactobacillus panis. (A) Fluorescence intensity using different crRNAs (g1–g8) designed for L. panis. ‘Targeted’ indicates L. panis genomic DNA, and ‘Non-Targeted’ indicates a mixture of the genomic DNA of L. rhamnosus, L. rapi, L. pontis, L. paracasei, L. parafarraginis, L. fructivorans, L. fermentum, and L. amylovorus. (B) Detection time analysis. Here, we calculated the slope of the kinetic curve from 0 min to 60 min. * indicates significance at the 0.05 level; ** indicates significance at the 0.01 level; ns indicates no significance. (C) Stand curve of the cleavage rate and the target copy numbers of L. panis. (D) A magnified portion of the stand curve of the cleavage rate and the target copy numbers of L. panis (shown in B) from copy number 0 to 1.0 × 10⁸ copies/μL.
Fermentation 08 00088 g004
Figure 5. Consistency curve for the CQAOB detection system and simple quantification. (A) Consistency curve for CQAOB. The expected values are 9 × 10⁸, 6 × 10⁸, 3 × 10⁸, 9 × 10⁷, and 4.5 × 10⁷ copies/μL. (B) Comparison of L. panis quantification in fermented grains samples using qPCR and CQAOB.
Fermentation 08 00088 g005
Table 1. DNA sequences used in this study.
NamesSequences
crRNA transcription templates for gyrB
g1GATCACTAATACGACTCACTATAGGTAATTTCTACTAAGTGTAGATccaatgctgatgggaaccaaggt *
g2GATCACTAATACGACTCACTATAGGTAATTTCTACTAAGTGTAGATccacagctgttcggcgtccattt
g3GATCACTAATACGACTCACTATAGGTAATTTCTACTAAGTGTAGATttaagtacatcgaaagtgatgag
g4GATCACTAATACGACTCACTATAGGTAATTTCTACTAAGTGTAGATtgcggccaatgatcacccacggc
g5GATCACTAATACGACTCACTATAGGTAATTTCTACTAAGTGTAGATtcgtcgaaggggattccgccggt
g6GATCACTAATACGACTCACTATAGGTAATTTCTACTAAGTGTAGATcggtggactccacggtgtggggg
g7GATCACTAATACGACTCACTATAGGTAATTTCTACTAAGTGTAGATgaaacggtcttcacggttctgca
g8GATCACTAATACGACTCACTATAGGTAATTTCTACTAAGTGTAGATtgtgacgaaatcaacgttgaggt
crRNA transcription templates for dsDNA cis-cleavage activity assays
DNMT1GATCACTAATACGACTCACTATAGGAATTTCTACTCTTGTAGATCTgatggtccatgtctgttactc
DNMT2GATCACTAATACGACTCACTATAGGAATTTCTACTCTTGTAGATCTctgatggtccatgtctgttactcg
crRNA transcription templates for 16S rDNA
S-cr1GATCACTAATACGACTCACTATAGGTAATTTCTACTAAGTGTAGATggcattgcaaacttccatggtgt
S-cr2GATCACTAATACGACTCACTATAGGTAATTTCTACTAAGTGTAGATcaatgcccaaagtcagtggccta
S-cr3GATCACTAATACGACTCACTATAGGTAATTTCTACTAAGTGTAGATagagatttgcacaccctcgcggg
S-cr4GATCACTAATACGACTCACTATAGGTAATTTCTACTAAGTGTAGATcacaccctcgcgggttagctgct
S-cr5GATCACTAATACGACTCACTATAGGTAATTTCTACTAAGTGTAGATggatgggcccgcggtgcattagc
S-cr6GATCACTAATACGACTCACTATAGGTAATTTCTACTAAGTGTAGATggctatcactttaggatgggccc
S-cr7GATCACTAATACGACTCACTATAGGTAATTTCTACTAAGTGTAGATgtatcaaagatggtttcggctat
S-cr8GATCACTAATACGACTCACTATAGGTAATTTCTACTAAGTGTAGATgtagttatacggtattagcacct
Synthetic target DNAs for 16S rDNA
S-ds1ACTTTGggcattgcaaacttccatggtgtGACGGGCGGTGTGTACAAGGC **
S-ds2AGTTTGcaatgcccaaagtcagtggcctaACCATTTTGGAGGGAGCTGCC
S-ds3GGCTTTAagagatttgcacaccctcgcgggTTAGCTGCTCGTTGTACCGG
S-ds4AGATTTGcacaccctcgcgggttagctgctCGTTGTACCGGCCATTGTAG
S-ds5CACTTTAggatgggcccgcggtgcattagcTAGTTGGTAGGGTAACGGCC
S-ds6TGGTTTCggctatcactttaggatgggcccGCGGTGCATTAGCTAGTTGG
S-ds7GTTTTCgtatcaaagatggtttcggctatCACTTTAGGATGGGCCCGCGG
S-ds8GGTTTTCgtagttatacggtattagcacctGTTTCCAAATGTTATCCCCC
Gene expression elements
T7 promoterTAATACGACTCACTATAGG
EnhancerGATCAC
ssDNA probes
HEX5′-TTATT-3′BHQ1 ***
FAM5′-TTATT-3′BHQ1
Primers
DNMT-FCACCAGTGAGACGGGCAAC
DNMT-RATTGCAGTTTCATTTGATGCTCGATG
27FAGTTTGATCMTGGCTCAG
1492RGGTTACCTTGTTACGACTT
Notes: * This sequence is the crRNA template sequence used for in vitro transcription, the red font denotes the crRNA circular head, and the lower-case letters indicate the target sequences. ** The lower-case letters indicate the target sequence that is complementary to crRNA. *** FAM and HEX are fluorescent groups, BHQ1 is a quenching group, and the ssDNA is 5′-TTATT-3′.
Publisher’s Note: MDPI stays neutral with regard to jurisdictional claims in published maps and institutional affiliations.

