Article

Analysis of Secondary Metabolite Synthesis Potential of Streptomyces fradiae sf106 Based on the Whole Genome and Non-Target Metabolomics and Exploration of the Biosynthesis of Tylosin

1
School of Life Sciences, Ningxia University, Yinchuan 750021, China
2
Key Laboratory of Ministry of Education for Protection and Utilization of Special Biological Resources in Western China, Yinchuan 750021, China
*
Author to whom correspondence should be addressed.
Fermentation 2023, 9(10), 866; https://doi.org/10.3390/fermentation9100866
Submission received: 4 August 2023 / Revised: 21 September 2023 / Accepted: 22 September 2023 / Published: 25 September 2023
(This article belongs to the Special Issue Antibiotic Production in Streptomyces)

Abstract

:
Streptomyces fradiae sf106 is a type of actinomycete that can produce abundant secondary metabolites, making it a natural cell factory for drug synthesis. In order to comprehensively understand the genomic profile of Streptomyces fradiae sf106 and its potential for producing secondary metabolites, a combination of several methods was used to perform whole-genome sequencing of sf106. The results showed that sf106 is most closely related to Streptomyces xinghaiensis S187; the average nucleotide identity and average amino acid identity of sf106 and S187 were more than 96%. The genome size of sf106 is approximately 7300 kb, the GC content is greater than 72%, and more than 6700 coding sequences (CDS) were identified. Analysis of mobile genetic elements revealed the presence of a large number of horizontally transferred genes in Streptomyces fradiae sf106, which contribute to microbial diversity. Through antiSMASH prediction, 22 secondary metabolite gene clusters were obtained, which had great potential to generate polyketide metabolites. By examining the data, it was found that the genes contained in cluster 9 were similar to those involved in tylosin synthesis. Non-targeted metabolome sequencing revealed that a total of 1855 identifiable metabolites were produced in the fermentation broth, and the majority of metabolites showed highly significant differences in mean relative abundance between the groups. The identified metabolites were compared against the KEGG compound database to obtain metabolite classifications, mainly including Biological Roles, Phytochemical Compounds, Lipids, and Pesticides. One-way ANOVA indicated that the relative concentration of tylosin differed significantly across all the growth periods, except for the late-logarithmic and stabilization stages. This study provides important basic information on the secondary metabolite research of sf106, which will help us to understand and apply Streptomyces fradiae sf106 more comprehensively.

1. Introduction

Streptomyces can produce structurally diverse secondary metabolites and has been extensively studied. More than two-thirds of known antibiotics in nature are discovered and isolated from Streptomyces [1,2,3], such as erythromycin and oxytetracycline, among others [4,5,6,7]. The natural products of Streptomyces usually exhibit good antibacterial, antiviral, and other biological activities and have been widely used in the fields of animal husbandry, public health, etc., playing an important role in the health of humans and animals. Researchers have developed a large number of antibiotics, antitumor drugs, agricultural and veterinary drugs, etc., using secondary metabolites produced by microorganisms [8]. Although chemically modified derivatives of active natural drugs can improve their physical and chemical properties and biological activities, the discovery of new natural products is still an area worthy of attention.
With the development of sequencing technology and the decrease in costs, more and more microbiome data have been reported. The development of whole-genome sequencing of microorganisms has allowed us to have a global understanding of the basic situation of bacteria, which has played a significant role in the molecular genetic research of Streptomyces [9,10]. There is still great potential to discover new natural products from this genus. In the long process of survival and evolution, microorganisms often take in foreign gene fragments with specific functions and integrate them into their own genomes. These foreign genomic fragments, such as virulence genes, drug resistance genes, and metabolic genes, are called mobile genetic elements, and this phenomenon is called horizontal gene transfer [11]. Horizontal gene transfer breaks the boundaries of kinship and increases microbial diversity. This phenomenon is more common in Streptomyces and can help them improve their survival rates and occupy advantageous ecological niches. Common mobile genetic elements include genomic islands [12], prophages [13], CRISPR-Cas [14], and insertion sequences [15]. To develop and utilize secondary metabolites to a greater extent, researchers have explored them from multiple perspectives. For example, efforts have included using Streptomyces as a host cell to express exogenous gene clusters, taking advantage of its complex and rich metabolic pathways, unique post-transcriptional modification systems, and antibiotic resistance mechanisms [16,17,18], which give the genus unique advantages in heterologous expression of secondary metabolite gene clusters [19,20,21,22]. These genetic manipulations are based on a clear understanding of the target strain’s genome and its metabolites. Therefore, it is common to characterize and produce natural products by utilizing genome editing techniques after obtaining genomic information [23,24,25]. In addition, analyzing the genomic information of organisms provides information on the inducement of the expression of silent secondary metabolite gene clusters in the chromosome, which can lead to the discovery of natural products that are not expressed under conventional culture conditions [26].
Several active secondary metabolites synthesized by microorganisms have been discovered [27,28,29,30], and Streptomyces is considered to have great economic value and potential applications. Non-targeted metabolomics is the study of the collection of all metabolites in a cell at a certain point in time. Additionally, it is considered to be the closest to the phenotype of the organism, which is widely used because of its ability to efficiently mine metabolites [31,32,33]. To further explore the natural product synthesis ability of Streptomyces fradiae sf106, a non-targeted metabolomics analysis was conducted on the fermentation broth of Streptomyces fradiae sf106 at different time periods. We can preliminarily clarify the potential of metabolite biosynthesis of the strain, as well as the relative expression of metabolites at different periods. Tylosin, also known as Tylan (Figure 1), is a typical 16-membered macrolide antibiotic for veterinary use. Various microorganisms have been found to produce tylosin, but Streptomyces fradiae is considered one of the most promising strains for tylosin biosynthesis. Tylosin plays a significant role in combating Gram-positive bacterial infections and promoting animal growth, shortening the breeding cycle of livestock and poultry, improving feed utilization efficiency, and increasing economic benefits. Therefore, it is widely used in the livestock and poultry farming industry. Due to its economic value and application potential, extensive scientific research on tylosin biosynthesis has been conducted since the 1970s [34,35,36,37]. The existing research is mainly based on gene editing, mutagenesis, and other technologies to increase the yield of tylosin [38,39,40,41,42]. In the early stages of our laboratory, a strain of Streptomyces fradiae named sf106 was preserved (BioProject ID: PRJNA1017371). What is the potential of this strain to produce secondary metabolites? In order to further understand its genomic profile and explore its secondary metabolism potential, we sequenced the whole genome and metabolome of Streptomyces fradiae sf106. Additionally, we further analyzed its basic biological information and gained a preliminary understanding of its potential secondary metabolism capabilities. This will be beneficial for further exploring the application potential of this strain at a deeper level, enriching the basic research data of this strain and providing theoretical support for industrial genetic manipulation of Streptomyces fradiae sf106.

2. Materials and Methods

2.1. Strain and Culture Conditions

Streptomyces fradiae sf106 was used for this study. Single colonies taken from sf106 on a solid medium of wl-50 were transferred to a TSB liquid medium. The wl-50 medium had the following composition: yeast extract, 1 g/L (Oxoid Ltd., Basingstoke, Britain); soluble starch, 5 g/L (Tianjin Bohuatong Chemical Products Sales Center, Tianjin, China); sodium chloride, 2.5 g/L (Shanghai Aladdin Biochemical Technology Co., Ltd., Shanghai, China); anhydrous magnesium sulfate, 3.6 g/L (Damao Chemical Reagent Factory, Tianjin, China); magnesium chloride hexahydrate, 4.8 g/L (Shanghai Guangnuo Chemical Technology Co., Ltd., Shanghai, China); L-alanine, 0.2 g/L; L-arginine, 0.2 g/L; L-asparagine, 0.5 g/L (Beijing Solarbio Science & Technology Co., Ltd., Beijing, China); and agar, 18 g/L. The medium was sterilized under high pressure at 115 °C for 30 min. Streptomyces fradiae sf106 cultures were prepared in 250 mL conical flasks containing 50 mL of the culture medium. The medium was prepared using TSB (tryptic soy broth) with the following composition: yeast extract, 5 g/L (Oxoid Ltd., Basingstoke, Britain); tryptone, 15 g/L (Oxoid Ltd.); soya peptone, 5 g/L (Beijing Aoboxing Bio-Tech Co. Ltd., Beijing, China); and sodium chloride, 5 g/L (Shanghai Aladdin Biochemical Technology Co., Ltd., Shanghai, China). After preparation, the medium was sterilized under high pressure at 121 °C for 30 min and used for the cultivation of sf106. The pictures of sf106 incubation on the solid medium (wl-50) and in the liquid medium (TSB) are attached in the Supplementary File (Figure S1).

2.2. Genomic DNA Extraction

Streptomyces fradiae sf106 was streaked on a TSB liquid medium and cultured at 28 °C for approximately 96 h at 150 rpm. The cell biomass was harvested after 10 min centrifugation at 12,000 g (approximately 11,000 rpm). The genomic DNA of Streptomyces fradiae sf106 was extracted using a bacterial DNA extraction kit (Wizard Genomic DNA Purification Kit, Madison, WI, USA) according to the manufacturer’s protocol. Purified genomic DNA was quantified by a TBS-380 fluorometer (Turner BioSystems Inc., Sunnyvale, CA, USA). High-quality DNA (OD260/280 = 1.8~2.0, >1 μg) was used to conduct further research (Table S1).

2.3. Library Construction and Genome Sequencing

The genomic DNA was sequenced using a combination of the PacBio RS II Single Molecule Real-Time (SMRT) and Illumina sequencing platforms. The Illumina data were used to evaluate the complexity of the genome.
For Illumina sequencing, at least 1 μg genomic DNA was used for each strain in the sequencing library construction. DNA samples were sheared into 400–500 bp fragments using a Covaris M220 Focused Acoustic Shearer, and the resulting sequencing libraries were purified according to the manufacturer’s protocol. Illumina sequencing libraries were prepared from the sheared fragments using the NEXTflex™ Rapid DNA-Seq Kit (Bioo Scientific, Austin, TX, USA). Briefly, the 5′ prime ends were first end-repaired and phosphorylated. Next, the 3′ ends were A-tailed and ligated to sequencing adapters. The third step was to enrich the adapter-ligated products using PCR. The prepared libraries then were used for paired-end Illumina sequencing (2 × 150 bp) on an Illumina HiSeq X Ten machine.
For Pacific Biosciences sequencing, an aliquot of 15 μg DNA was spun in a Covaris g-TUBE (Covaris, Woburn, MA, USA) at 6000 RPM for 60 s using an Eppendorf 5424 centrifuge (Eppendorf, Hamburg, Germany). The DNA fragments were then purified, end-repaired, and ligated with SMRT bell sequencing adapters following the manufacturer’s recommendations (Pacific Biosciences, Menlo Park, CA, USA). The resulting sequencing libraries were purified three times using 0.45 × volumes of Agencourt AMPure XP beads (Beckman Coulter Genomics, MA, USA) following the manufacturer’s recommendations. Next, a ~10 kb insert library was prepared and sequenced on one SMRT cell using standard methods.

2.4. Genome Assembly and Annotation

The data generated with the PacBio and Illumina platforms were used for bioinformatics analysis. All the analyses were performed using the free online platform Majorbio Cloud Platform (http://cloud.majorbio.com (accessed on 10 January 2021)) from Shanghai Majorbio Bio-pharm Technology Co., Ltd. (Shanghai, China). Glimmer [43] was used for CDS prediction, tRNA-scan-SE [44] was used for tRNA prediction, and Barrnap was used for rRNA prediction. The predicted CDSs were annotated according to the NR, Swiss-Prot, Pfam, GO, COG, and KEGG databases using sequence alignment tools, such as BLAST, Diamond, and HMMER. Briefly, each set of query proteins was aligned with the databases, and annotations of best-matched subjects (e-value < 10−5) were obtained for gene annotation.

2.5. Metabolite Extraction

A total of 200 μL of the liquid sample was extracted using an 800 µL methanol: acetonitrile (1:1, v/v) solution. The mixture was then sonicated at 40 kHz for 30 min at 5 °C. The samples were placed at −20 °C for 30 min to precipitate proteins. After centrifugation at 13,000 g (approximately 11,063 rpm) at 4 °C for 15 min, the supernatant was carefully transferred to new microtubes and evaporated to dryness under a gentle stream of nitrogen. For UHPLC–MS/MS analysis, the samples were reconstituted in 120 µL of a loading solution of acetonitrile: water (1:1, v/v) via brief sonication in a 5 °C water bath. The extracted metabolites were spun for 15 min at 13,000 g (approximately 11,000 rpm) at 4 °C on a bench-top centrifuge, and the cleared supernatant was transferred to sample vials for LC–MS/MS analysis. As a part of the system conditioning and quality control process, a pooled quality control (QC) sample was prepared by mixing equal volumes of all samples.

2.6. (UHPLC–MS/MS) Analysis

The instrument platform for the LC–MS analysis was the UHPLC-Q Exactive HF-X system from Thermo Fisher Scientific (Waltham, MA, USA).
Chromatographic conditions: The chromatographic column was an ACQUITY UPLC HSS T3 (100 mm × 2.1 mm i.d., 1.8 μm, Waters, Milford, MA, USA). The mobile phases consisted of 0.1% formic acid in water: acetonitrile (95:5, v/v) (solvent A) and 0.1% formic acid in acetonitrile: isopropanol: water (47.5:47.5:5, v/v) (solvent B). The sample injection volume was 3 µL, and the flow rate was set to 0.4 mL/min. The column temperature was maintained at 40 °C.
MS conditions: The mass spectrometric data were collected using a Thermo UHPLC-Q Exactive Mass Spectrometer equipped with an electrospray ionization (ESI) source operating in either positive or negative ion mode. The optimal conditions were set as follows: heater temperature, 425 °C; capillary temperature, 325 °C; sheath gas flow rate, 50 arb; aux gas flow rate, 13 arb; ion-spray voltage floating (ISVF), −3500 V in negative mode and 3500 V in positive mode; normalized collision energy, 20–40–60 V. The full MS resolution was 60,000, and the MS/MS resolution was 7500. Data acquisition was performed in Data Dependent Acquisition (DDA) mode. Detection was carried out in a mass range of 70–1050 m/z.

2.7. Data Preprocessing and Annotation

After the mass spectrometry detection was completed, the raw data of LC/MS were preprocessed by Progenesis QI 2.4 (Waters Corporation, Milford, MA, USA) software. At the same time, the metabolites were searched and identified, and the main databases were the Human Metabolome Database (HMDB, http://www.hmdb.ca/ (accessed on 25 August 2022)) [45], Metlin (https://metlin.scripps.edu/ (accessed on 25 August 2022)) [46], and the Majorbio Database. After the database search, the data were uploaded to the Majorbio cloud platform (https://cloud.majorbio.com (accessed on 25 August 2022)) for further analysis. At least 80% of the metabolic features detected in any set of samples were retained. After filtering, minimum metabolite values were imputed for specific samples in which the metabolite levels fell below the lower limit of quantitation, and each feature was normalized by sum. In order to reduce errors caused by sample preparation and instrument instability, the response intensity of the sample mass spectrum peaks was normalized by the sum normalization method, and a normalized data matrix was obtained. At the same time, variables with a relative standard deviation (RSD) greater than 30% in the QC samples were removed, and log10 transformation was performed in order to obtain the final data matrix for subsequent analysis.

3. Results

3.1. Systematic Evolution Analysis of Streptomyces fradiae sf106

Following the whole-genome sequencing of Streptomyces fradiae sf106, the 19 bacterial strains that were most closely related at the genus level were selected on the basis of their 16S rRNA sequences. The neighbor-joining (NJ) method was employed to construct a phylogenetic tree utilizing MEGA 6.0 software (Figure 2a). The analysis revealed that Streptomyces fradiae sf106 exhibited the closest phylogenetic relationship with Streptomyces xinghaiensis. Additionally, a species-level phylogenetic tree was constructed on the basis of the housekeeping gene sequence of Streptomyces fradiae sf106 (Figure 2b), further corroborating its closest relationship with Streptomyces xinghaiensis. Previous studies have identified Streptomyces fradiae sf106 to be the same strain as Streptomyces xinghaiensis [47,48].
Average nucleotide identity (ANI) is a method used to measure the similarity between genomic sequences by comparing the average percentage identity of nucleotide sequences. Average amino acid identity (AAI) is a method used to measure the similarity between protein-coding sequences by comparing the average percentage identity of amino acid sequences. It is similar to ANI but focuses on the functional similarity of proteins rather than the overall genomic similarity. If two genomes have AAI and ANI values above 95%, they are considered to belong to the same species. ANI/AAI analysis is mainly used to assess the phylogenetic relationship between species at the whole-genome level. These analyses are simple, quick, and accurate. In this study, the closely related Streptomyces xinghaiensis S187 (GCA_000220705.2) and sf106 were selected for ANI/AAI analysis. The results showed that the average nucleotide identity (ANI) between Streptomyces fradiae sf106 and Streptomyces xinghaiensis S187 was 96.13% (Figure 3a), and the average amino acid identity (AAI) was 96.34% (Figure 3b).

3.2. The Genomic Overview and Annotation of Streptomyces fradiae sf106

A genomic circle map can comprehensively display the characteristics of a genome, and integrating various information into a single genome circle map can provide us with a more comprehensive and intuitive understanding of the characteristics of a strain’s genome. We obtained a sample genome circle map using Circos software (http://circos.ca/software/) [49].
The genomic features of Streptomyces fradiae sf106, including the genome size, coding DNA sequences (CDSs, total number of genes), rRNA, tRNA, GC content (guanine and cytosine content of the entire genome), and GC skew values (Figure 4), are comprehensively and visually presented using the Circos genome circle plot. The genome size of Streptomyces fradiae sf106 is approximately 7300 kb, with a high GC content of approximately 73% and approximately 6750 coding genes. The annotation results for these genes across various databases were summarized at the gene level to enable multi-dimensional data mining (Table 1).

3.3. Analysis of Mobile Genetic Elements

Horizontal gene transfer can allow for the exchange of genetic material between different biological entities or within individual cellular organelles. Common mobile genetic elements include genomic islands, CRISPR/Cas systems, and insertion sequences, among others. Strain sf106 has a total of 12 genomic islands, 5 insertion sequences, 13 CRISPR/Cas systems, and 1 prophage. The analysis of mobile genetic elements indicated a high degree of horizontal gene transfer in this strain (Table 2).

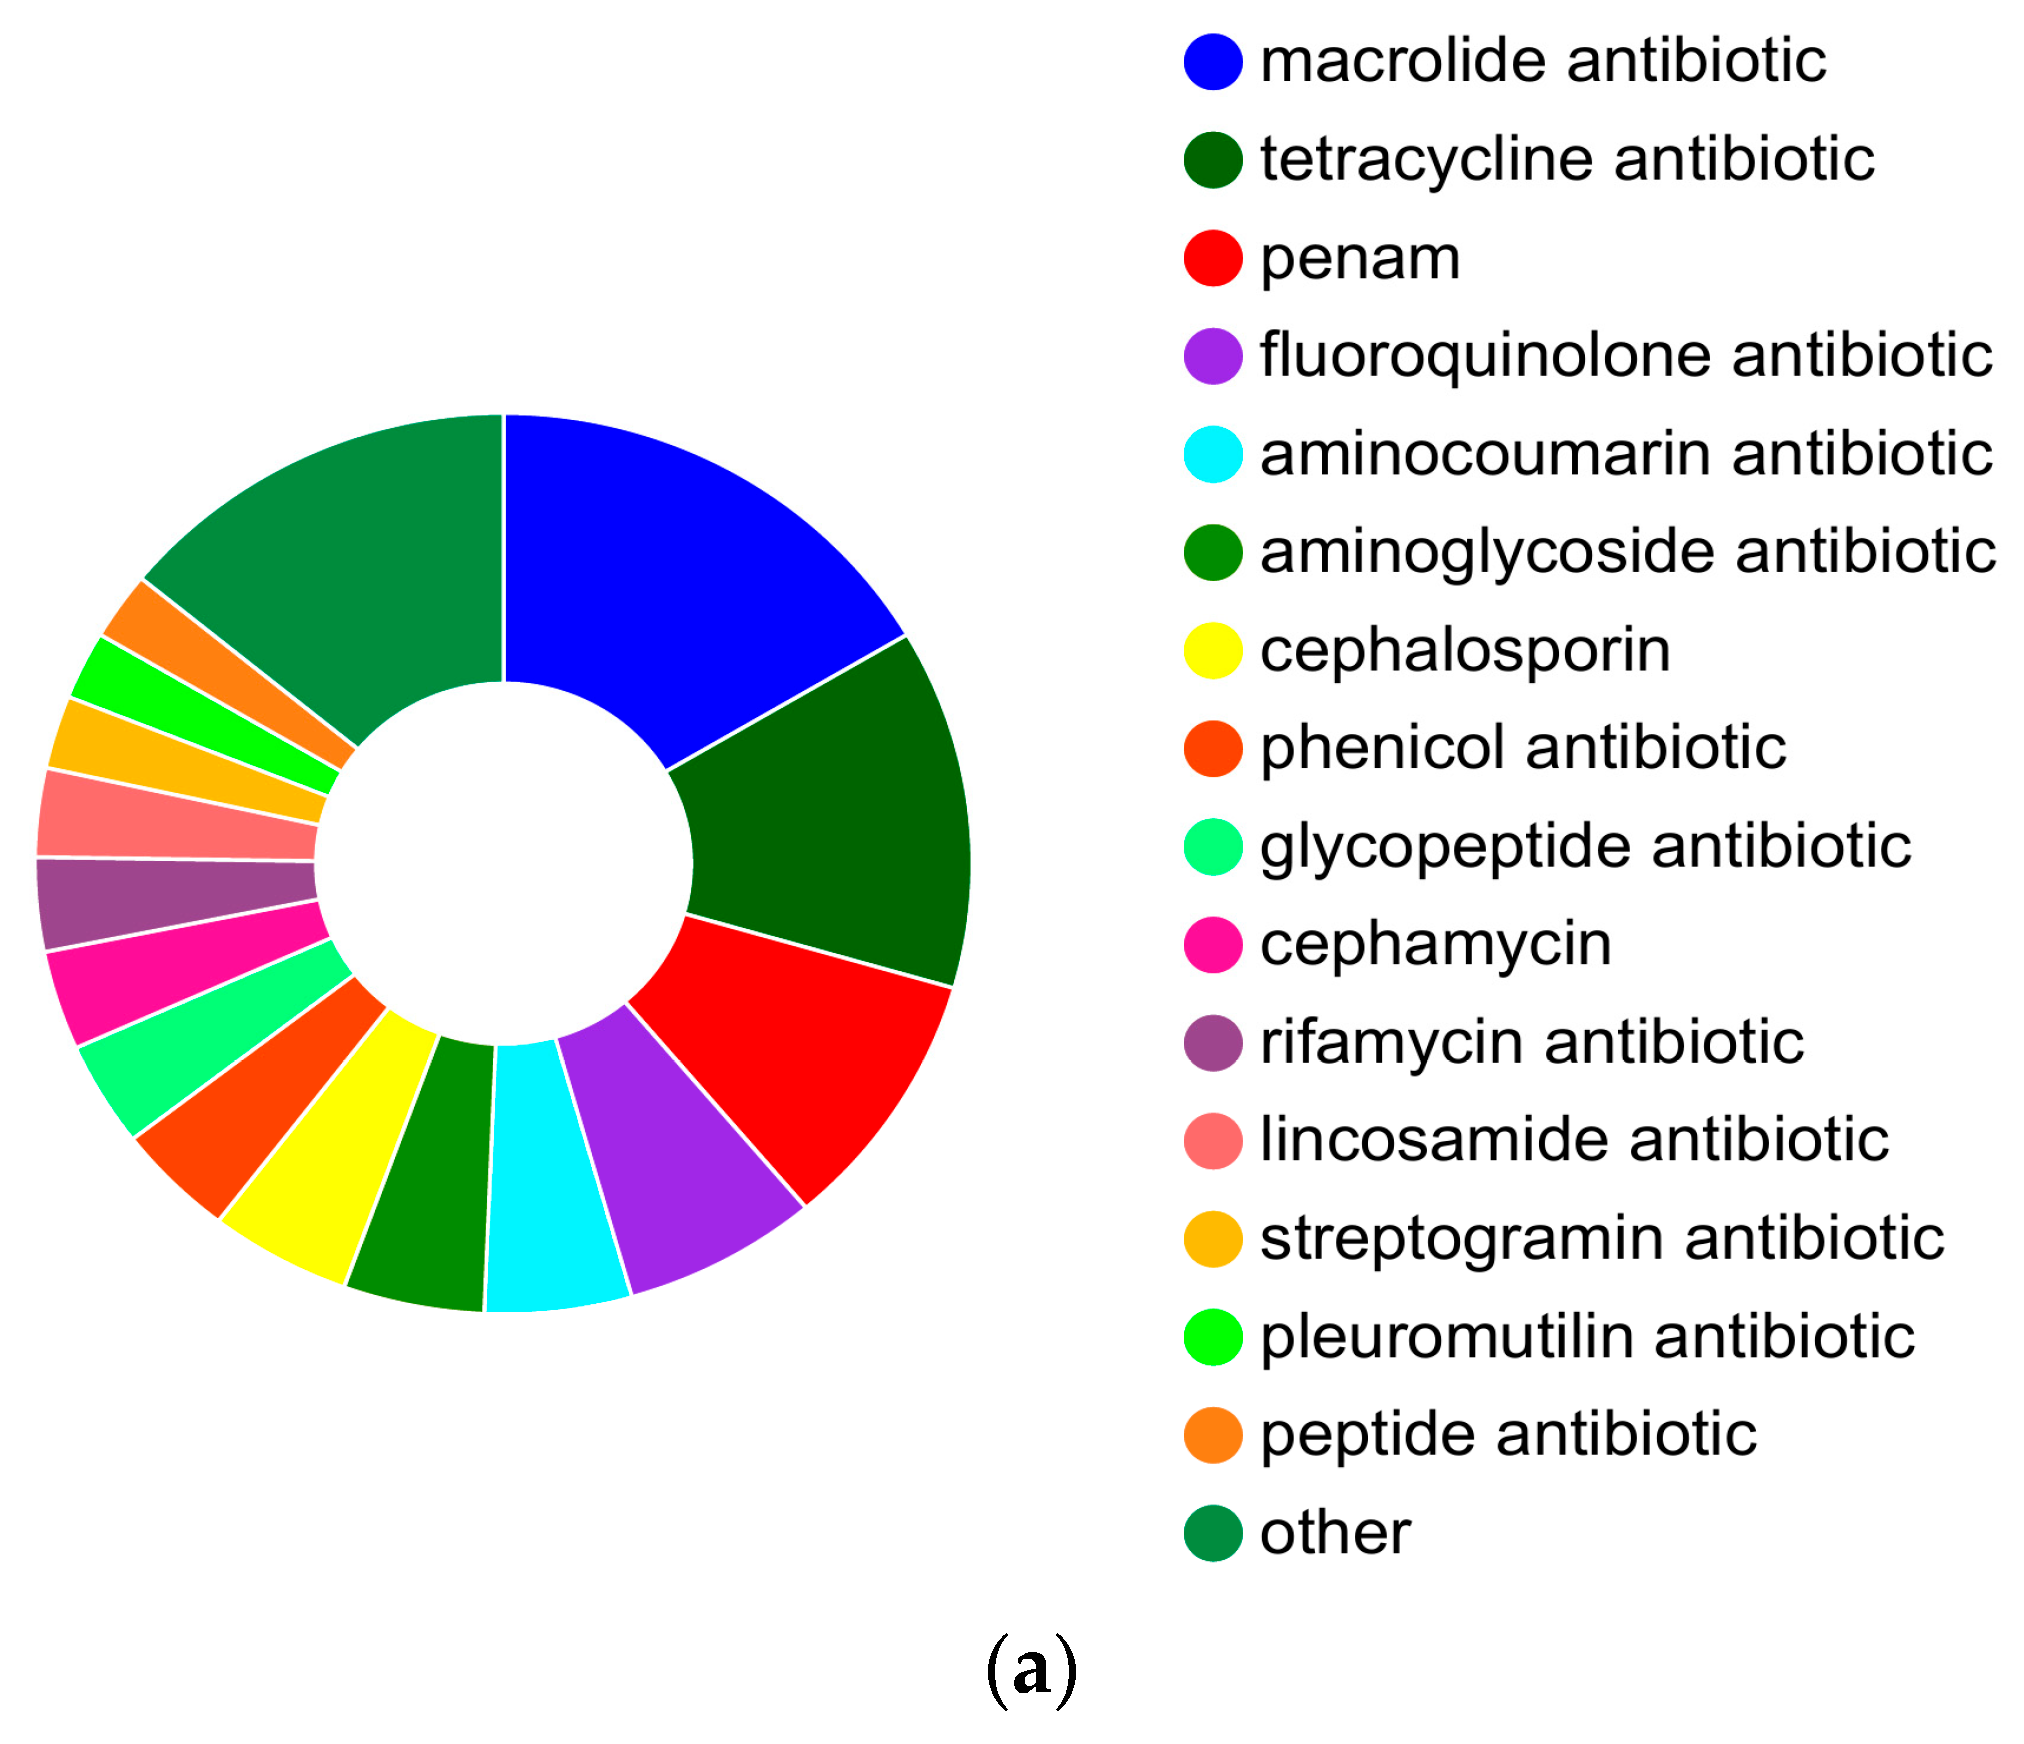
3.4. Prediction of Antibiotic Resistance Genes

The Comprehensive Antibiotic Resistance Database (CARD) hosts an extensive range of reference genes associated with antibiotics across various organisms, genomes, and plasmids. This database serves as a valuable resource for investigating antibiotic resistance mechanisms in environmental, human, and animal microbial communities. The annotation analysis using CARD suggested that Streptomyces fradiae sf106 harbors multiple classes of resistance genes (Figure 5a). Specifically, the strain contains 88 macrolide, 69 tetracycline, and 50 penam resistance genes, along with additional resistance genes against other antibiotics, including 36 against fluoroquinolone, 27 against aminocoumarin, 26 against aminoglycoside, 26 against cephalosporin, and other types of resistance genes.
To corroborate these findings, the ResFinder database, comprising experimentally validated antibiotic resistance genes, was employed. Utilizing ResFinder with a threshold of identity ≥ 80% and a coverage ≥ 60%, three major classes of resistance genes were identified: lincosamide (2), streptogramin B (2), and macrolide (3). The elucidation of these resistance profiles is crucial for understanding the mechanisms underlying drug-resistant mutations and the development of new antibiotics.

3.5. Metabolic System Analysis

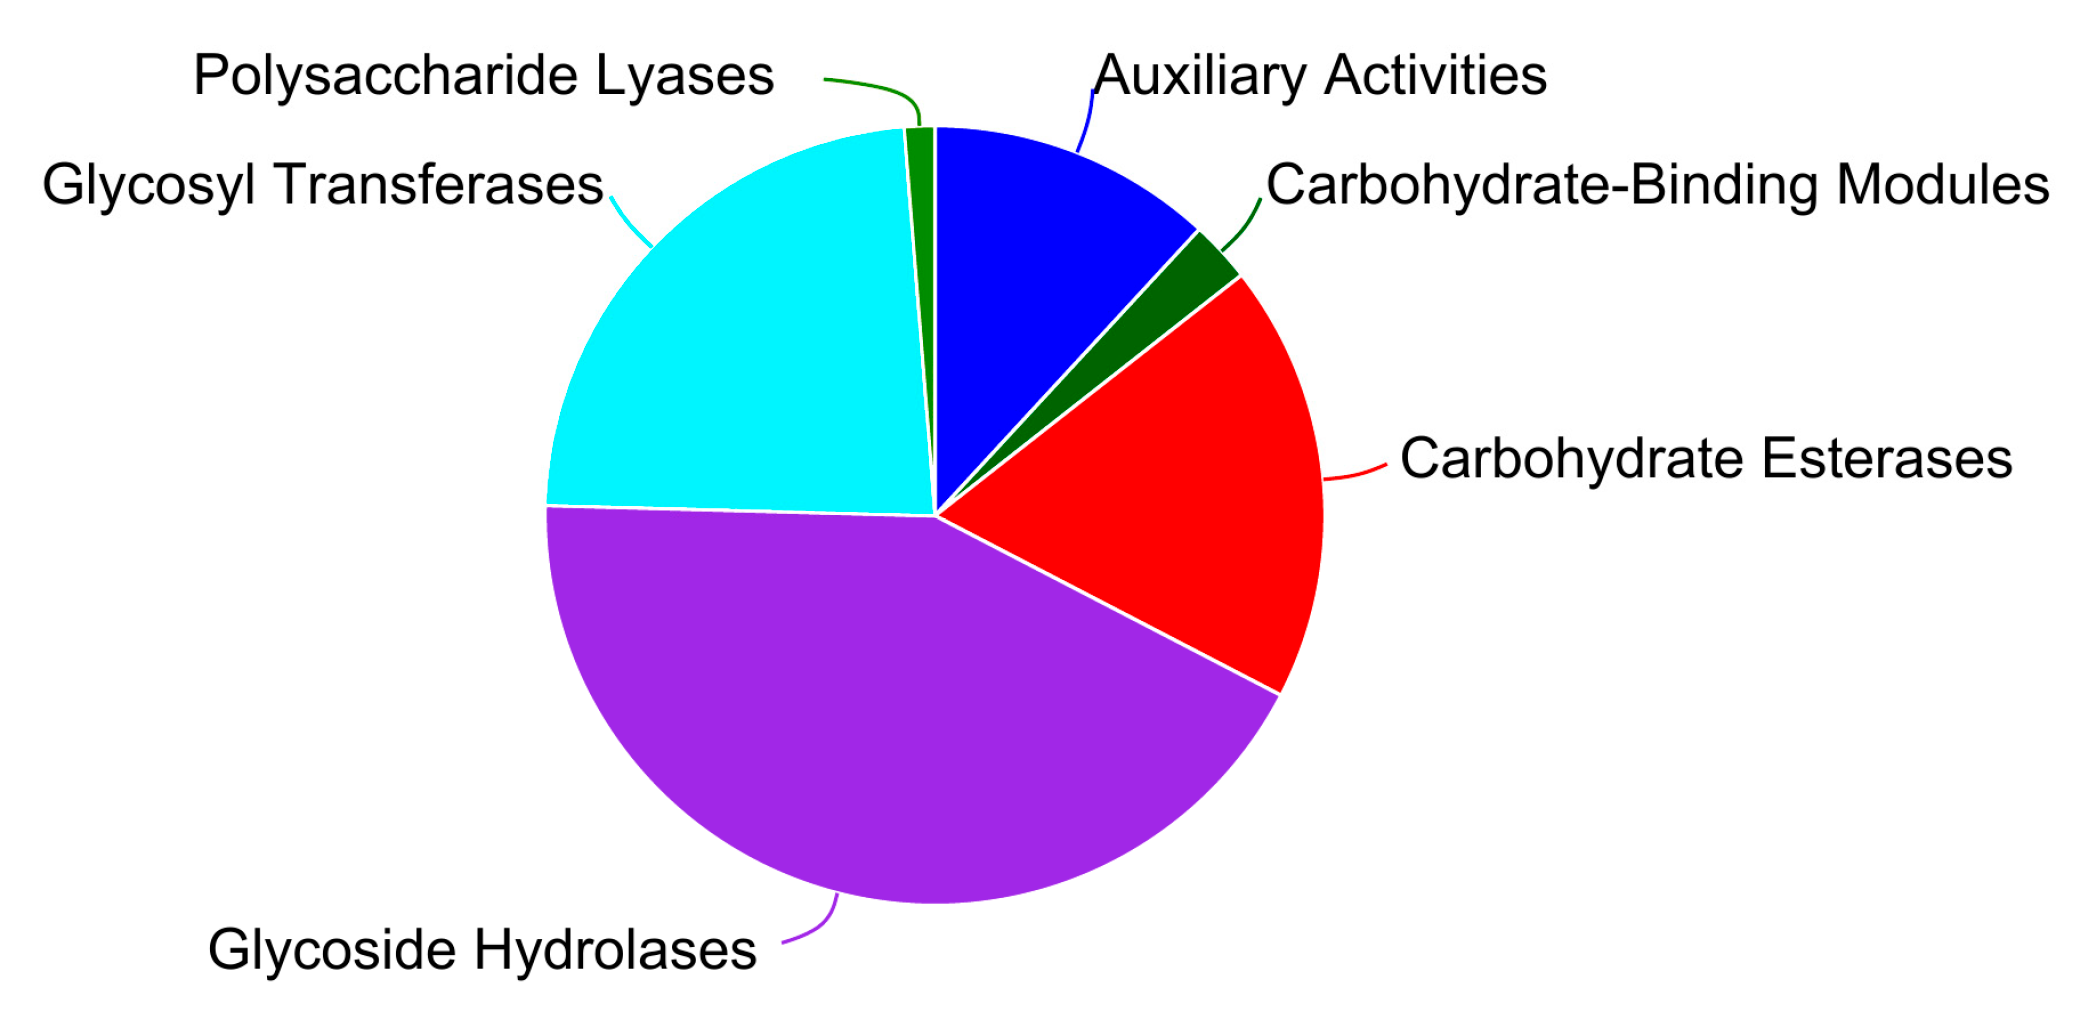
3.5.1. Carbohydrate-Active Enzyme Annotation

The Carbohydrate-Active Enzymes Database (CAZy, http://www.cazy.org/ (accessed on10 January 2021)) is a specialized database for enzymes involved in the synthesis or degradation of complex carbohydrates and glycoconjugates. These enzymes are categorized into six major protein families according to amino acid sequence similarities in their domains: glycoside hydrolases (GHs), glycosyl transferases (GTs), polysaccharide lyases (PLs), carbohydrate esterases (CEs), carbohydrate-binding modules (CBMs), and auxiliary activities (AAs). Figure 6 reveals that the strain sf106 primarily contains genes related to the glycoside hydrolases category, followed by glycosyl transferases.

3.5.2. Secondary Metabolite Analysis

Microorganisms synthesize secondary metabolites, compounds not essential for their basic metabolic processes, when they reach a certain growth stage. These metabolites are often controlled by gene clusters called secondary metabolite biosynthetic gene clusters. The complete genome of sf106 was analyzed using the antiSMASH database (https://antismash.secondarymetabolites.org/#!/start (accessed on 6 October 2021)) with relaxed detection. This analysis predicted a total of 22 secondary metabolite biosynthetic gene clusters (Table 3), encompassing a diverse range of compounds, such as terpenes, NRPS (non-ribosomal peptide synthetase), and PKS (polyketide synthase), among others. NRPS and PKS are two crucial biosynthetic enzymes used for the synthesis of complex natural products. They play a key role in drug development and biotechnology.
We used the MIBiG (Minimum Information about a Biosynthetic Gene Cluster) database (https://mibig.secondarymetabolites.org/ (accessed on 6 October 2021)) to compare each of the predicted clusters against known biosynthetic gene clusters. The comparison analysis was performed using the protocluster-to-region format, resulting in the identification of the 22 known compounds most similar to the predicted gene clusters (Table 3). This provided a basis for the development of similar metabolites in Streptomyces fradiae sf106, and it is worth noting that actinobacteria are still the major source of these metabolites. It was found that the genes in the ninth gene cluster (Figure 7) were highly similar to the synthesis of the antibiotic tylosin, and they were highly similar to the known compound tylactone (Table 4), which is closest to the predicted gene cluster. This comparison identified the closest known compounds to the predicted clusters, providing insight into the metabolic potential of sf106. Importantly, one cluster was found to be highly similar to genes involved in the synthesis of the antibiotic tylosin. This suggests that sf106 has the capacity for tylosin synthesis. This has great value for the excavation and application of tylosin in Streptomyces fradiae sf106.

3.6. Preprocessing of Metabolite Expression Data

The preprocessing parameters for metabolomic data include several key steps: missing value filtering of raw data (applied when the proportion of missing values in each group exceeds 20%), imputation of missing values using the minimum value method, recoding of missing values through simulation, data conversion (log10 transformation was performed to obtain the final data matrix), and data normalization for subsequent analysis, among other steps. Data preprocessing is a commonly used method in metabolomics analysis.
Preprocessing identified a total of 1855 metabolites (Table 5). Of these, 970 metabolites were identified in positive ion mode, and 885 metabolites were identified in negative ion mode. Subsequent annotation was carried out using public databases, including the Human Metabolome Database (HMDB) and Lipidmaps (https://www.lipidmaps.org/ (accessed on 25 August 2022)).

3.7. Metabolites KEGG Compounds Classification

The classification of metabolites in strain sf106 based on the KEGG compound database yielded the following four main categories, as shown in Figure 8. The first category was Compounds with Biological Roles (111); this category is primarily composed of Amino Acids, Phospholipids, Neurotransmitters, and Carboxylic Acids, among others. The second category was Lipids (82); the dominant types of lipids are FA01 Fatty Acids and Conjugates, PR01 Isoprenoids, GP03 Glycerophosphoserines, and ST02 Steroids, among others. The third category was Phytochemical Compounds (65); this category is primarily composed of triterpenoids (C30), diterpenoids (C20), monolignols, and flavonoids, among others. The fourth category was Pesticides (4), i.e., the dominant types of plant growth regulators and insecticides, among others.

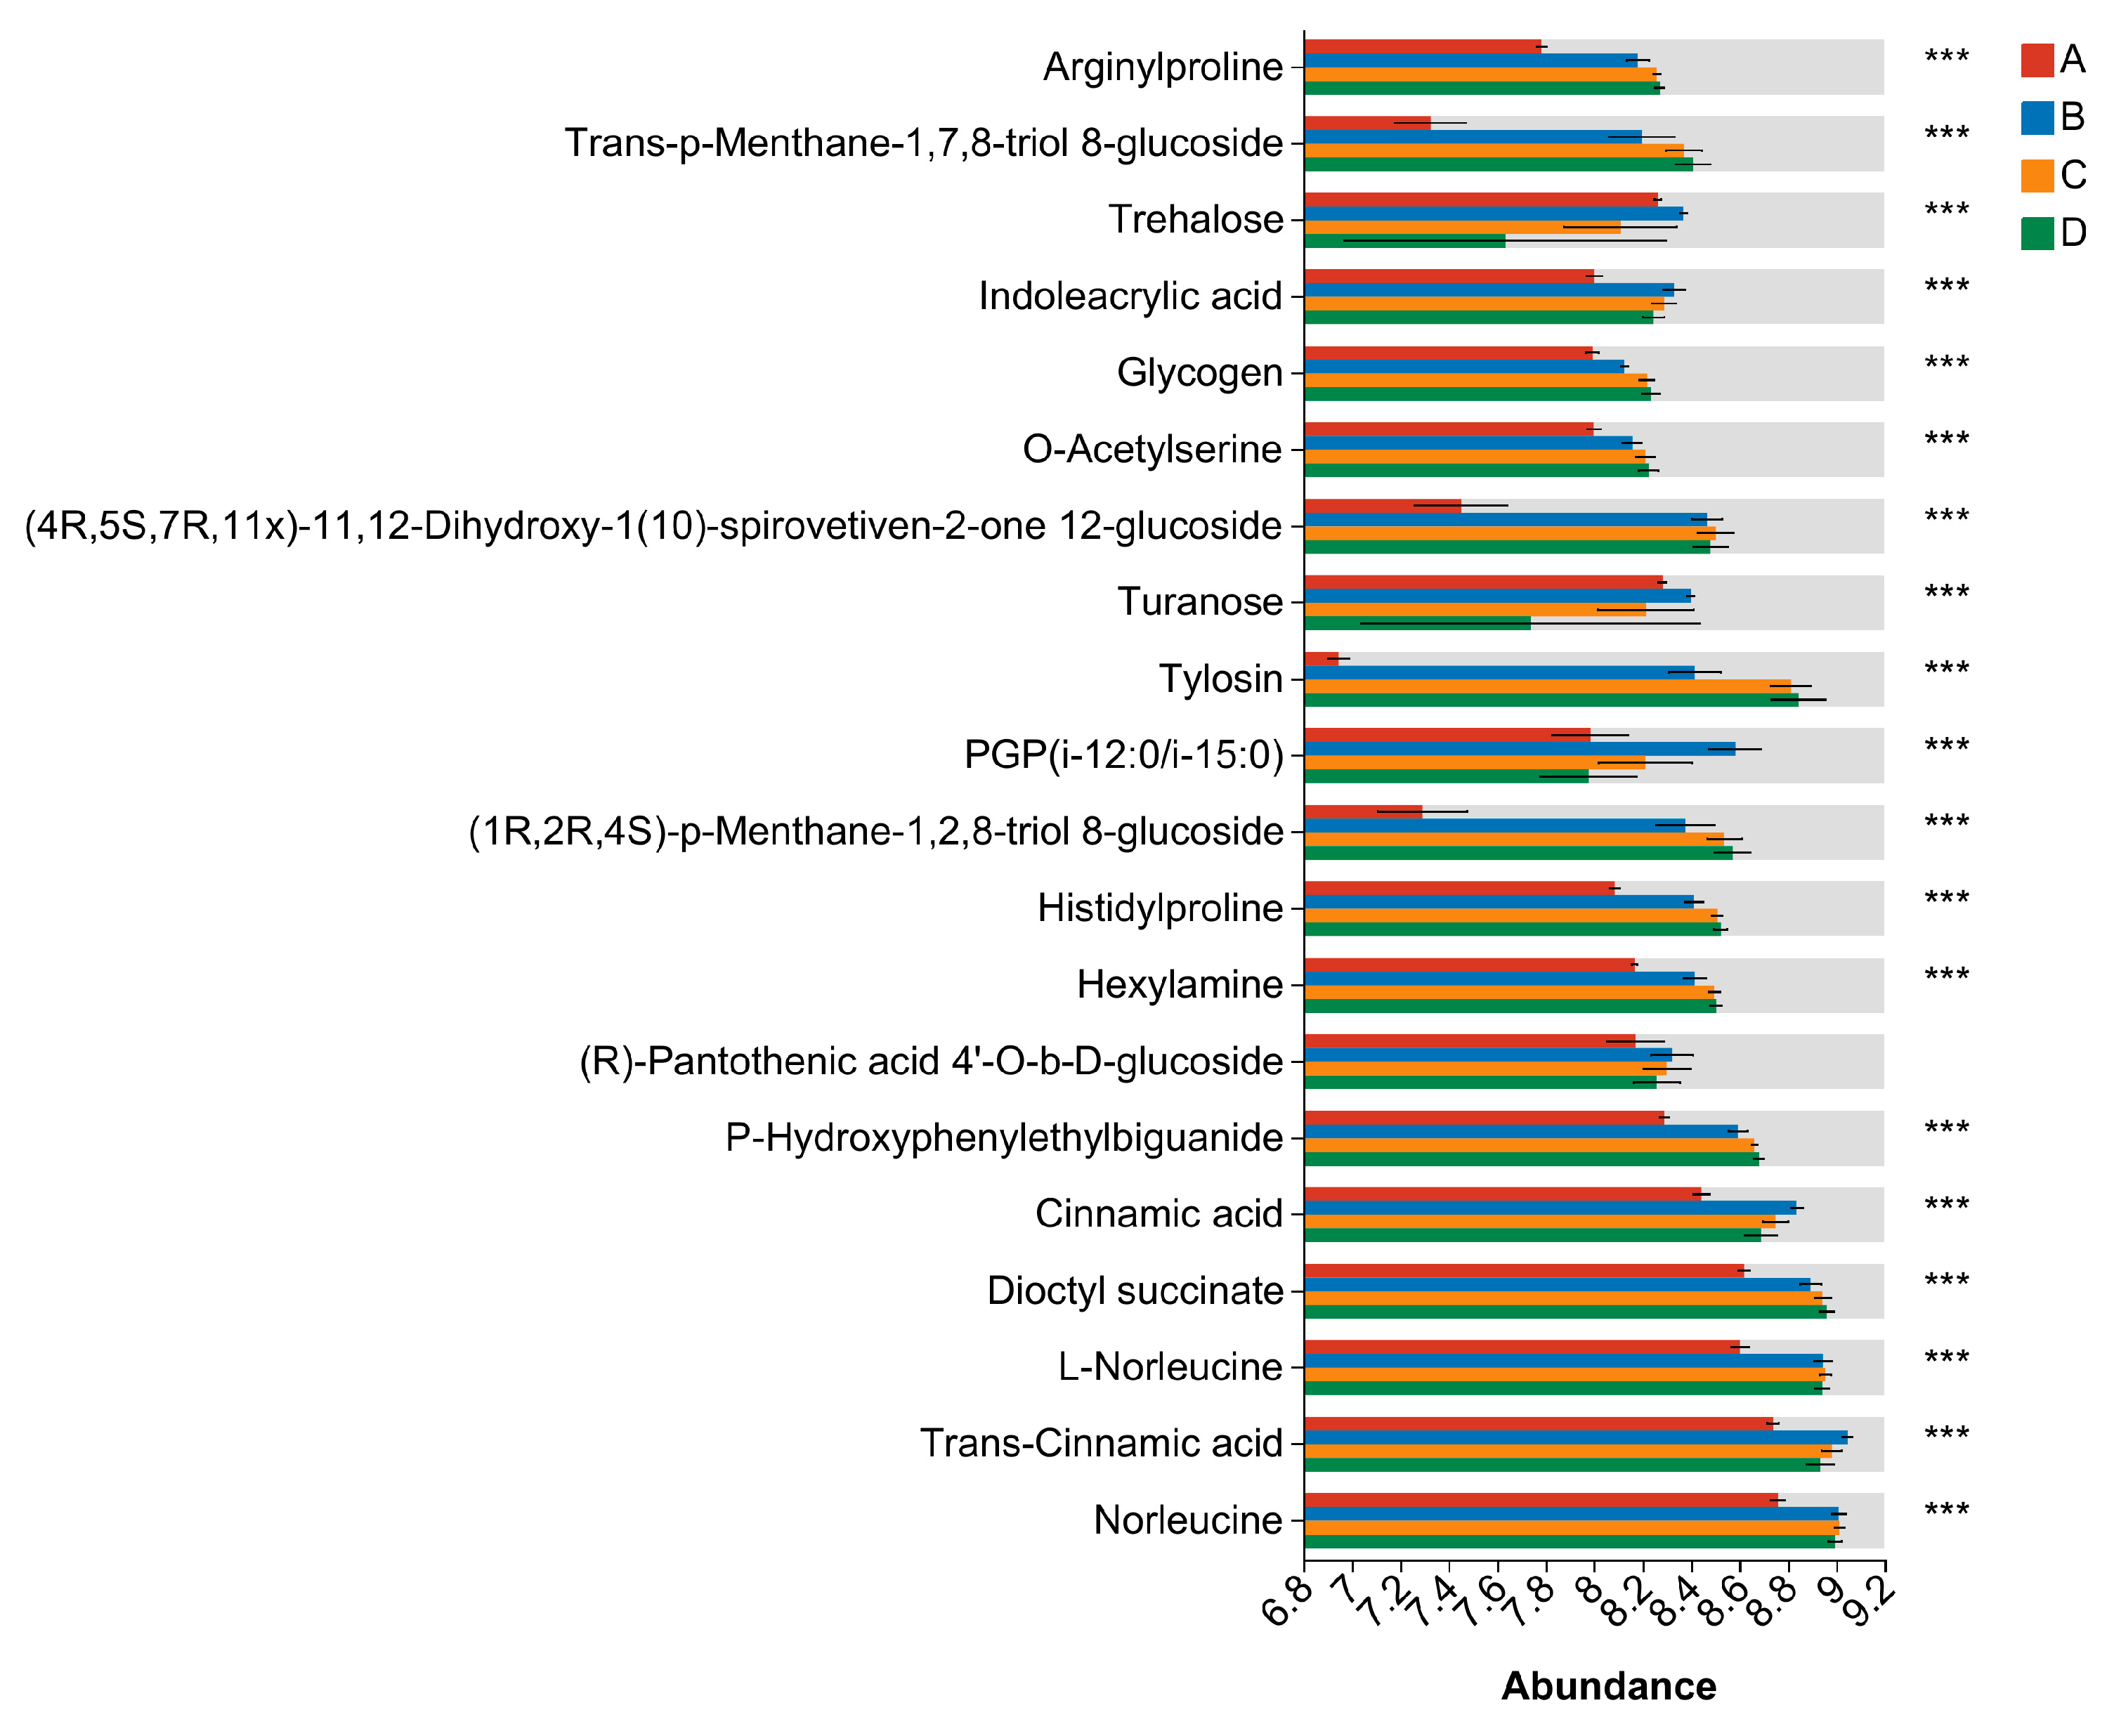
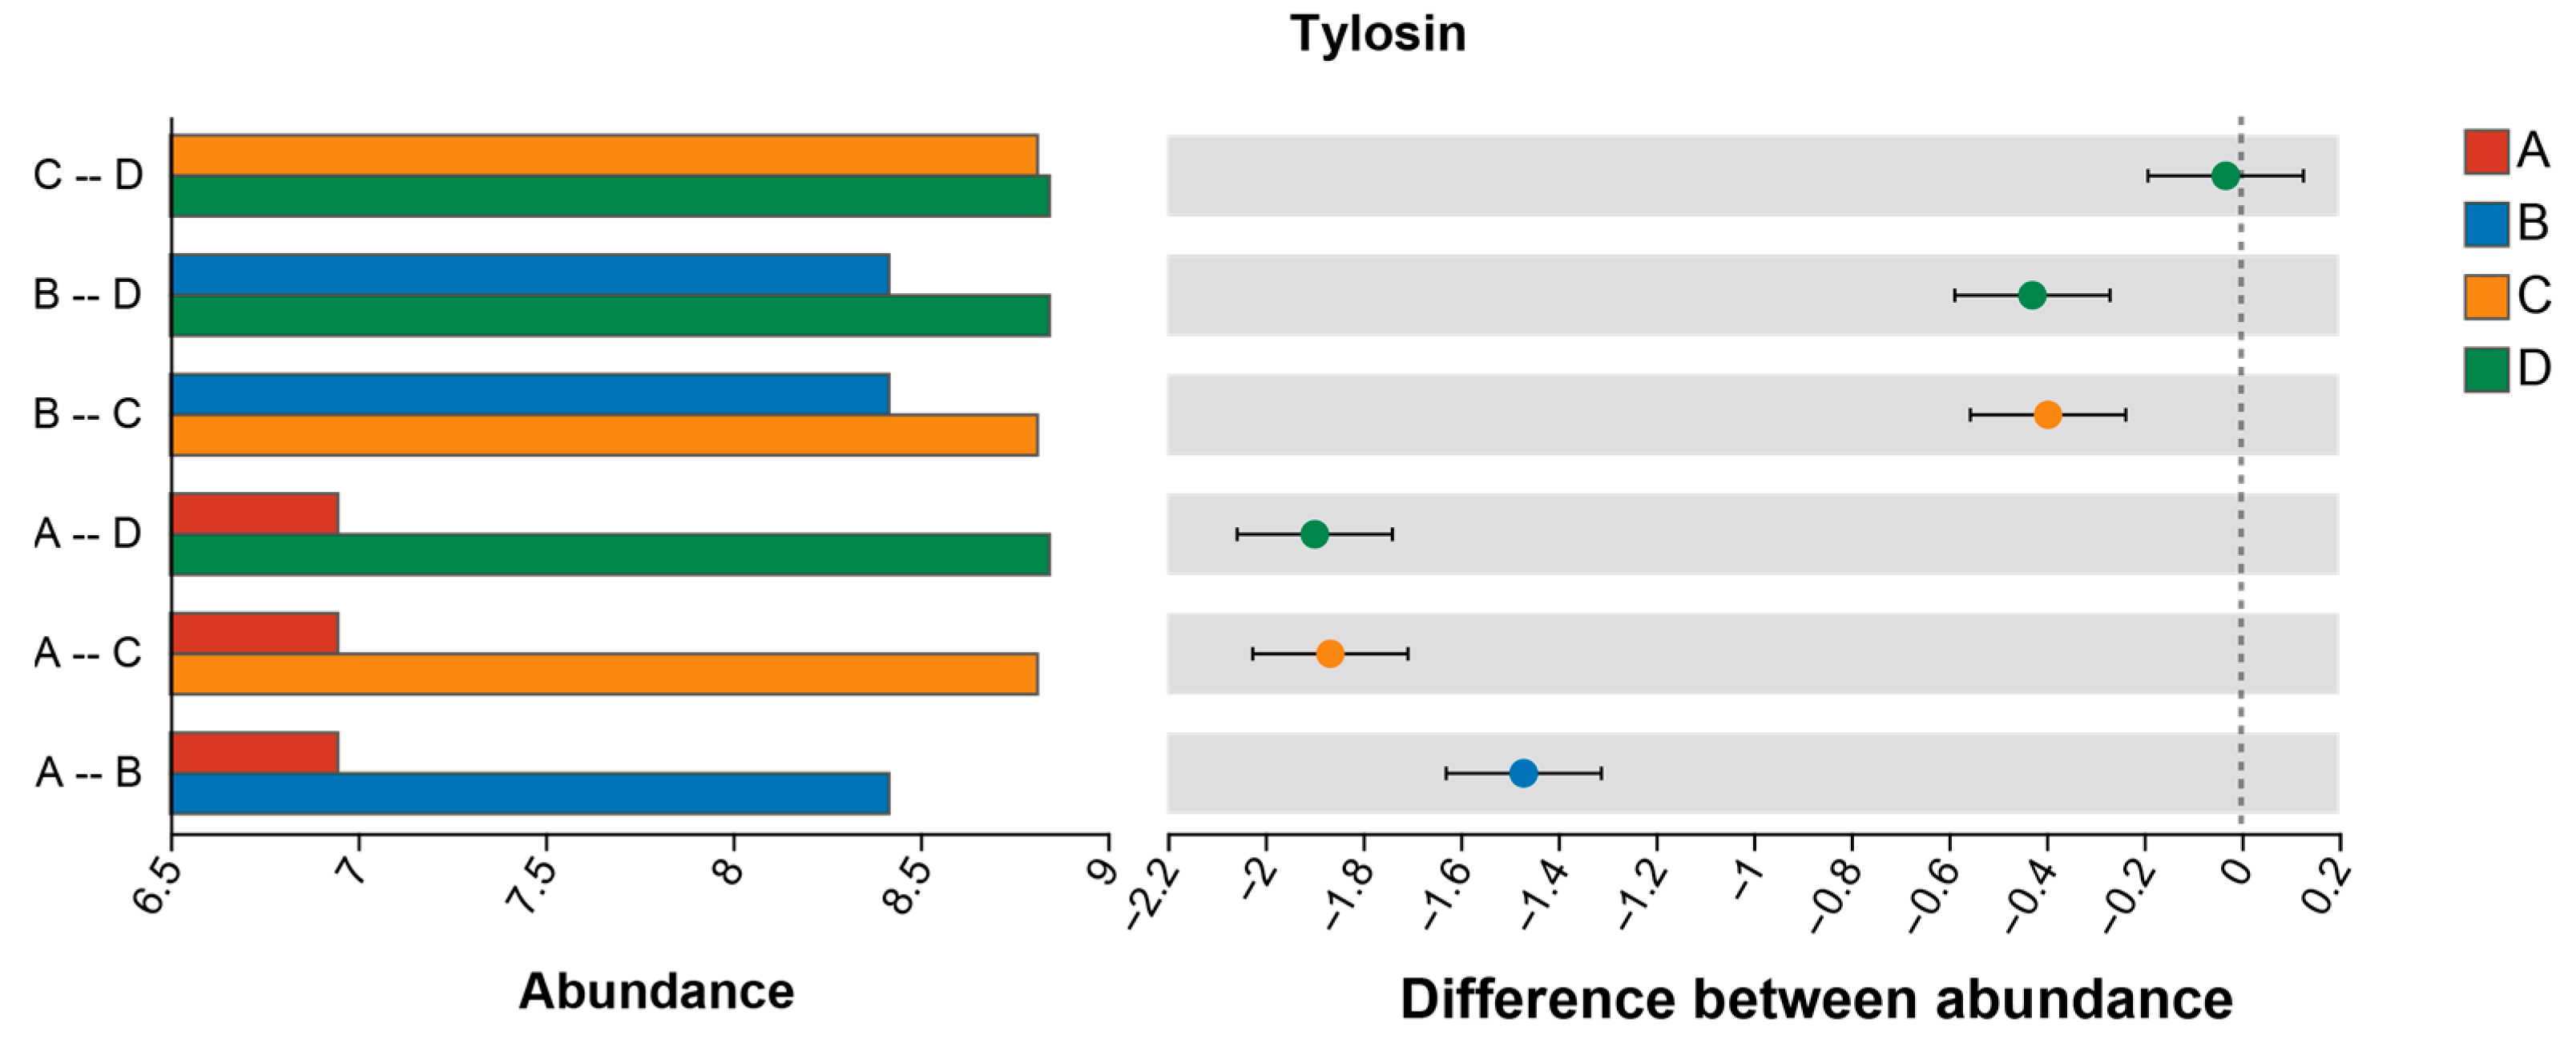
3.8. Differential Metabolite Analysis

For the 1855 identified metabolites, a multi-group ANOVA was conducted using the Kruskal–Wallis rank sum test (Kruskal–Wallis H test). The analysis focused on the top 20 metabolites in terms of abundance that could be matched to known names (Figure 9). The results showed highly significant differences in mean relative abundance between the groups (A, B, C, and D) studied for the majority of these top metabolites.
Further analysis centered on the relative mean abundance of tylosin across the different growth phases (Figure 10). The highest mean abundance of tylosin was observed during the stationary phase. Interestingly, the average relative abundance of tylosin in the late logarithmic growth phase was not significantly different from that in the stationary phase. This suggests that the strain may reach the maximum tylosin biosynthesis toward the end of the logarithmic growth phase and continue to accumulate it during the stationary phase. These insights are valuable for understanding the optimal time for tylosin biosynthesis, which has implications for industrial production.

4. Discussion

The widespread use of antibiotics, such as tetracycline, cephalosporins, and erythromycin, has revolutionized medical treatment and agricultural practices. This underscores the critical role of antibiotics and natural products, making the discovery of new secondary metabolites a research priority [50,51,52]. Despite advances, many metabolites remain undiscovered or underutilized. Leveraging genomic information is now a focal point in natural product research [53,54]. Whole-genome sequencing allows the prediction of potential secondary metabolic gene clusters, significantly aiding in the discovery of novel natural products. [55,56,57]. Streptomyces spp. microorganisms have become important sources for discovering novel lead compounds. Determining the synthesis genes (clusters) of their secondary metabolites and discovering the metabolites of other metabolic pathways has become a mainstream research direction. With the development of compound isolation, structure identification, and fermentation technology, new natural products continue to be discovered and applied. Secondary metabolites are active substances of great value and play a significant role in regulating life activities [58,59]. In our study, the identified bacteria belong to the Streptomyces fradiae species, sharing high nucleotide and amino acid identity with Streptomyces xinghaiensis S187.
Horizontal gene transfer via mobile genetic elements significantly influences bacterial survival [60]. In Streptomyces fradiae sf106, 12 genomic islands, 1 prophage, and 13 CRISPR/Cas systems were identified. These genomic fragments break the boundaries of phylogenetic relationships, increasing microbial diversity and playing a vital role in bacterial adaptation and evolution. Genomic islands are the most important form of horizontal transfer elements that carry genes that can provide selective advantages to bacteria. They contain genes related to various biological functions and can be classified into pathogenicity islands, resistance islands, metabolic islands, and symbiotic islands according to the types of genes they contain. Studying the resistance genes found in genomic islands can further analyze the mechanisms of organism resistance and provide a basis for the development of new antibiotics and resistance targets. Genomic islands are an important source of new functional characteristics of strains. By studying the functional characteristics of genomic islands and their related genes, the mechanism of bacterial pathogenicity and resistance can be greatly promoted, providing us with new ideas for exploring metabolites. Horizontal transfer of mobile genetic elements (MGEs) promotes the functionality and genomic diversity of microbiomes. Some genes encoded by MGEs may help bacteria defend themselves or enhance their ability to compete for resources. These elements contribute to bacterial adaptability and could be crucial in understanding resistance mechanisms.
Carbohydrate-active enzymes (CAZymes) are pivotal in biological functions such as glycosidic bond formation and breakdown. Our study identified six protein families involved in carbohydrate activities in Streptomyces fradiae sf106. Glycoside hydrolases accounted for the largest proportion, followed by glycosyl transferases. Carbohydrate-active enzymes are important enzymes involved in the degradation, modification, and generation of glycosidic bonds. In-depth research on CAZymes is of great significance for revealing the metabolic mechanisms of microbial carbohydrates. According to the prediction results of secondary metabolites, Streptomyces fradiae sf106 has 22 secondary metabolite gene clusters [61], indicating a great potential for producing terpenes and clustered natural products. Moreover, the MIBiG comparison showed that Streptomyces spp. is still one of the major sources of natural products. Exploring these secondary metabolite gene clusters can help us identify and characterize more important natural compounds from unexplored microorganisms [62], providing an important method for the targeted exploration or discovery of novel natural products and greatly reducing the possibility of discovering duplicate compounds. In addition, our research group has long focused on tylosin, an antibiotic used in animal husbandry. We found multiple genes capable of producing tylosin in the ninth gene cluster predicted in sf106, which can guide us to further determine the tylosin content of this strain. Although there is increasing controversy regarding the use of antibiotics as feed additives, tylosin is widely used due to its high efficiency, low residual, and specific application to livestock and poultry. With the development of animal husbandry, there will be broader possibilities for its use. Therefore, it is necessary to further improve the production capacity of this strain. With the continuous maturity of gene editing technology, targeted genetic modification of certain metabolites through genetic editing has made it possible to discover various natural products, making it possible to explore and improve the production of secondary metabolites and enhance the activities of active components.
Non-targeted metabolome sequencing identified a total of 1855 metabolites that could be matched to names, of which 972 metabolites were identified in positive ion mode and 888 metabolites in negative ion mode; moreover, the large number of metabolites that were not matched to names also indicate that this strain has the ability to produce unknown natural products. The categorization of metabolites with consistent expression trends will help us further search for metabolites with similar expression trends or similar functions, which can greatly facilitate the discovery of unknown natural compounds and their derivatives. In addition, differential metabolite analysis showed that the average relative abundance of most metabolites differed significantly among groups, for example, the differential metabolites were largest in pre-logarithmic (A) and mid-logarithmic (B) growth and then decreased in the late stage of strain growth, which implies that the synthesis patterns of different metabolites in different periods can be found. This further clarifies the metabolic trends of the strains and biosynthesis patterns of the target metabolites and has a significant influence on the further clarification of the metabolic trends of the strain and the biosynthesis pattern of target metabolites.
The potential for tylosin production was identified in sf106, which is noteworthy given tylosin’s widespread use in animal husbandry. The need for optimizing this strain for higher tylosin yields is evident. Differential metabolite analysis revealed significant differences in metabolite abundance between growth phases, providing insights into metabolic trends and biosynthesis patterns. These data contribute to uncovering the origin and evolution of life and provide sufficient research foundations for more in-depth studies on the biosynthesis of tylosin and other secondary metabolites in Streptomyces fradiae sf106. These findings lay the groundwork for further genetic manipulation at the genomic level of Streptomyces fradiae sf106.

5. Conclusions

Whole-genome sequencing confirmed the high rates of similarity between Streptomyces fradiae sf106 and Streptomyces xinghaiensis S187, establishing sf106 as a metabolically versatile strain. This has positive implications for industrial production. Guided by whole-genome and metabolome information, this confirmed the ability of the strain to produce tylosin. Additionally, the strain harbors abundant exogenous functional genes, such as resistance genes. Analysis of mobile genetic elements enhances our understanding of the genetic diversity of this strain and highlights the importance of further research on them. This study serves as a foundational step for future research aimed at enhancing natural product yields, understanding resistance mechanisms, and exploring microbial diversity.

Supplementary Materials

The following supporting information can be downloaded at: https://www.mdpi.com/article/10.3390/fermentation9100866/s1. Table S1: DNA sample detection results of Streptomyces fradiae sf106. Figure S1: Growth of Streptomyces fradiae sf106 on different media.

Author Contributions

Data curation and writing—original draft preparation, C.J.; visualization and review, X.M. and Y.J.; validation, S.C.; project administration and funding acquisition, S.Y. and J.S., conceptualization and supervision, J.S. All authors have read and agreed to the published version of the manuscript.

Funding

This research was funded by the Key Research and Development Plan Project of the Ningxia Hui Autonomous Region, grant number: 2021BEG02003.

Institutional Review Board Statement

Not applicable.

Informed Consent Statement

Not applicable.

Data Availability Statement

Data are available upon request from the corresponding author.

Conflicts of Interest

The authors declare that the research was conducted in the absence of any commercial or financial relationships that could be construed as a potential conflict of interest.

References

  1. Zhang, H.; Wang, Y.; Pfeifer, B.A. Bacterial hosts for natural product production. Mol. Pharm. 2008, 5, 212–225. [Google Scholar] [CrossRef] [PubMed]
  2. Aigle, B.; Lautru, S.; Spiteller, D.; Dickschat, J.S.; Challis, G.L.; Leblond, P.; Pernodet, J.L. Genome mining of Streptomyces ambofaciens. J. Ind. Microbiol. Biotechnol. 2014, 41, 251–263. [Google Scholar] [CrossRef]
  3. Alam, K.; Mazumder, A.; Sikdar, S.; Zhao, Y.M.; Hao, J.; Song, C.; Wang, Y.; Sarkar, R.; Islam, S.; Zhang, Y.; et al. Streptomyces: The biofactory of secondary metabolites. Front. Microbiol. 2022, 13, 968053. [Google Scholar] [CrossRef] [PubMed]
  4. Weber, J.M.; Wierman, C.K.; Hutchinson, C.R. Genetic analysis of erythromycin production in Streptomyces erythreus. J. Bacteriol. 1985, 164, 425–433. [Google Scholar] [CrossRef]
  5. Yin, S.; Wang, W.; Wang, X.; Zhu, Y.; Jia, X.; Li, S.; Yuan, F.; Zhang, Y.; Yang, K. Identification of a cluster-situated activator of oxytetracycline biosynthesis and manipulation of its expression for improved oxytetracycline production in Streptomyces rimosus. Microb. Cell Factories 2015, 14, 46. [Google Scholar] [CrossRef] [PubMed]
  6. Paulus, C.; Zapp, J.; Luzhetskyy, A. New Scabimycins A-C Isolated from Streptomyces acidiscabies (Lu19992). Molecules 2021, 26, 5922. [Google Scholar] [CrossRef]
  7. Charousová, I.; Medo, J.; Hleba, L.; Javoreková, S. Streptomyces globosus DK15 and Streptomyces ederensis ST13 as new producers of factumycin and tetrangomycin antibiotics. Braz. J. Microbiol. 2018, 49, 816–822. [Google Scholar] [CrossRef]
  8. Chakraborty, P. Gene cluster from plant to microbes: Their role in genome architecture, organism’s development, specialized metabolism and drug discovery. Biochimie 2022, 193, 1–15. [Google Scholar] [CrossRef]
  9. Zhao, J.; Grant, S.F. Advances in whole genome sequencing technology. Curr. Pharm. Biotechnol. 2011, 12, 293–305. [Google Scholar] [CrossRef]
  10. Baltz, R.H. Natural product drug discovery in the genomic era: Realities, conjectures, misconceptions, and opportunities. J. Ind. Microbiol. Biotechnol. 2019, 46, 281–299. [Google Scholar] [CrossRef]
  11. Daubin, V.; Szöllősi, G.J. Horizontal Gene Transfer and the History of Life. Cold Spring Harb. Perspect. Biol. 2016, 8, a018036. [Google Scholar] [CrossRef] [PubMed]
  12. Bertelli, C.; Laird, M.R.; Williams, K.P.; Lau, B.Y.; Hoad, G.; Winsor, G.L.; Brinkman, F.S.L. IslandViewer 4: Expanded prediction of genomic islands for larger-scale datasets. Nucleic Acids Res. 2017, 45, W30–W35. [Google Scholar] [CrossRef] [PubMed]
  13. Fouts, D.E. Phage_Finder: Automated identification and classification of prophage regions in complete bacterial genome sequences. Nucleic Acids Res. 2006, 34, 5839–5851. [Google Scholar] [CrossRef] [PubMed]
  14. Bland, C.; Ramsey, T.L.; Sabree, F.; Lowe, M.; Brown, K.; Kyrpides, N.C.; Hugenholtz, P. CRISPR recognition tool (CRT): A tool for automatic detection of clustered regularly interspaced palindromic repeats. BMC Bioinform. 2007, 8, 209. [Google Scholar] [CrossRef] [PubMed]
  15. Siguier, P.; Gourbeyre, E.; Chandler, M. Bacterial insertion sequences: Their genomic impact and diversity. FEMS Microbiol. Rev. 2014, 38, 865–891. [Google Scholar] [CrossRef]
  16. Zhao, L.; Beyer, N.J.; Borisova, S.A.; Liu, H.W. Beta-glucosylation as a part of self-resistance mechanism in methymycin/pikromycin producing strain Streptomyces venezuelae. Biochemistry 2003, 42, 14794–14804. [Google Scholar] [CrossRef]
  17. Kang, H.S.; Kim, E.S. Recent advances in heterologous expression of natural product biosynthetic gene clusters in Streptomyces hosts. Curr. Opin. Biotechnol. 2021, 69, 118–127. [Google Scholar] [CrossRef]
  18. Shen, B.; Du, L.; Sanchez, C.; Edwards, D.J.; Chen, M.; Murrell, J.M. Cloning and characterization of the bleomycin biosynthetic gene cluster from Streptomyces verticillus ATCC15003. J. Nat. Prod. 2002, 65, 422–431. [Google Scholar] [CrossRef]
  19. Gomez-Escribano, J.P.; Bibb, M.J. Engineering Streptomyces coelicolor for heterologous expression of secondary metabolite gene clusters. Microb. Biotechnol. 2011, 4, 207–215. [Google Scholar] [CrossRef]
  20. Peng, Q.; Gao, G.; Lü, J.; Long, Q.; Chen, X.; Zhang, F.; Xu, M.; Liu, K.; Wang, Y.; Deng, Z.; et al. Engineered Streptomyces lividans Strains for Optimal Identification and Expression of Cryptic Biosynthetic Gene Clusters. Front. Microbiol. 2018, 9, 3042. [Google Scholar] [CrossRef]
  21. Yin, S.; Li, Z.; Wang, X.; Wang, H.; Jia, X.; Ai, G.; Bai, Z.; Shi, M.; Yuan, F.; Liu, T.; et al. Heterologous expression of oxytetracycline biosynthetic gene cluster in Streptomyces venezuelae WVR2006 to improve production level and to alter fermentation process. Appl. Microbiol. Biotechnol. 2016, 100, 10563–10572. [Google Scholar] [CrossRef] [PubMed]
  22. Liu, R.; Deng, Z.; Liu, T. Streptomyces species: Ideal chassis for natural product discovery and overproduction. Metab. Eng. 2018, 50, 74–84. [Google Scholar] [CrossRef] [PubMed]
  23. Tao, W.; Yang, A.; Deng, Z.; Sun, Y. CRISPR/Cas9-Based Editing of Streptomyces for Discovery, Characterization, and Production of Natural Products. Front. Microbiol. 2018, 9, 1660. [Google Scholar] [CrossRef]
  24. Makitrynskyy, R.; Tsypik, O.; Bechthold, A. Genetic Engineering of Streptomyces ghanaensis ATCC14672 for Improved Production of Moenomycins. Microorganisms 2021, 10, 30. [Google Scholar] [CrossRef] [PubMed]
  25. Yang, J.; Ye, R.; Zhang, H.; Liu, Y. Amplification of lmbB1 gene in Streptomyces lincolnensis improves quantity and quality of lincomycin A fermentation. Prep. Biochem. Biotechnol. 2020, 50, 529–537. [Google Scholar] [CrossRef]
  26. Laureti, L.; Song, L.; Huang, S.; Corre, C.; Leblond, P.; Challis, G.L.; Aigle, B. Identification of a bioactive 51-membered macrolide complex by activation of a silent polyketide synthase in Streptomyces ambofaciens. Proc. Natl. Acad. Sci. USA 2011, 108, 6258–6263. [Google Scholar] [CrossRef]
  27. An, J.S.; Shin, B.; Kim, T.H.; Hwang, S.; Shin, Y.H.; Cui, J.; Du, Y.E.; Yi, J.; Nam, S.J.; Hong, S.; et al. Dumulmycin, an Antitubercular Bicyclic Macrolide from a Riverine Sediment-Derived Streptomyces sp. Org. Lett. 2021, 23, 3359–3363. [Google Scholar] [CrossRef]
  28. Marchbank, D.H.; Ptycia-Lamky, V.C.; Decken, A.; Haltli, B.A.; Kerr, R.G. Guanahanolide A, a Meroterpenoid with a Sesterterpene Skeleton from Coral-Derived Streptomyces sp. Org. Lett. 2020, 22, 6399–6403. [Google Scholar] [CrossRef]
  29. Sun, J.; Zhao, G.; O’Connor, R.D.; Davison, J.R.; Bewley, C.A. Vertirhodins A-F, C-Linked Pyrrolidine-Iminosugar-Containing Pyranonaphthoquinones from Streptomyces sp. B15-008. Org. Lett. 2021, 23, 682–686. [Google Scholar] [CrossRef]
  30. Zhang, S.Y.; Zhan, Z.J.; Zhang, H.; Qi, H.; Zhang, L.Q.; Chen, S.X.; Gan, L.S.; Wang, J.D.; Ma, L.F. Morindolestatin, Naturally Occurring Dehydromorpholinocarbazole Alkaloid from Soil-Derived Bacterium of the Genus Streptomyces. Org. Lett. 2020, 22, 1113–1116. [Google Scholar] [CrossRef]
  31. Yang, Q.J.; Zhao, J.R.; Hao, J.; Li, B.; Huo, Y.; Han, Y.L.; Wan, L.L.; Li, J.; Huang, J.; Lu, J.; et al. Serum and urine metabolomics study reveals a distinct diagnostic model for cancer cachexia. J. Cachexia Sarcopenia Muscle 2018, 9, 71–85. [Google Scholar] [CrossRef] [PubMed]
  32. Alves, P.C.; Hartmann, D.O.; Núñez, O.; Martins, I.; Gomes, T.L.; Garcia, H.; Galceran, M.T.; Hampson, R.; Becker, J.D.; Silva Pereira, C. Transcriptomic and metabolomic profiling of ionic liquid stimuli unveils enhanced secondary metabolism in Aspergillus nidulans. BMC Genom. 2016, 17, 284. [Google Scholar] [CrossRef] [PubMed]
  33. Zhou, Y.; Lv, J.; Yu, Z.; Wang, Z.; Li, Y.; Li, M.; Deng, Z.; Xu, Q.; Cui, F.; Zhou, W. Integrated metabolomics and transcriptomic analysis of the flavonoid regulatory networks in Sorghum bicolor seeds. BMC Genom. 2022, 23, 619. [Google Scholar] [CrossRef] [PubMed]
  34. Gandecha, A.R.; Large, S.L.; Cundliffe, E. Analysis of four tylosin biosynthetic genes from the tylLM region of the Streptomyces fradiae genome. Gene 1997, 184, 197–203. [Google Scholar] [CrossRef]
  35. Merson-Davies, L.A.; Cundliffe, E. Analysis of five tylosin biosynthetic genes from the tyllBA region of the Streptomyces fradiae genome. Mol. Microbiol. 1994, 13, 349–355. [Google Scholar] [CrossRef] [PubMed]
  36. Baltz, R.H.; Seno, E.T. Genetics of Streptomyces fradiae and tylosin biosynthesis. Annu. Rev. Microbiol. 1988, 42, 547–574. [Google Scholar] [CrossRef]
  37. Baltz, R.H.; Seno, E.T. Properties of Streptomyces fradiae mutants blocked in biosynthesis of the macrolide antibiotic tylosin. Antimicrob. Agents Chemother. 1981, 20, 214–225. [Google Scholar] [CrossRef]
  38. Khaliq, S.; Rashid, N.; Akhtar, K.; Ghauri, M.A. Production of tylosin in solid-state fermentation by Streptomyces fradiae NRRL-2702 and its gamma-irradiated mutant (gamma-1). Lett. Appl. Microbiol. 2009, 49, 635–640. [Google Scholar] [CrossRef]
  39. Fan, J.; Yao, Z.; Yan, C.; Hao, M.; Dai, J.; Zou, W.; Ni, M.; Li, T.; Li, L.; Li, S.; et al. Discovery of a highly efficient TylF methyltransferase via random mutagenesis for improving tylosin production. Comput. Struct. Biotechnol. J. 2023, 21, 2759–2766. [Google Scholar] [CrossRef]
  40. Dai, P.; Qin, Y.; Li, L.; Li, H.; Lv, L.; Xu, D.; Song, Y.; Huang, T.; Lin, S.; Deng, Z.; et al. Enhancing tylosin production by combinatorial overexpression of efflux, SAM biosynthesis, and regulatory genes in hyperproducing Streptomyces xinghaiensis strain. Synth. Syst. Biotechnol. 2023, 8, 486–497. [Google Scholar] [CrossRef]
  41. Yao, Z.; Fan, J.; Dai, J.; Yu, C.; Zeng, H.; Li, Q.; Hu, W.; Yan, C.; Hao, M.; Li, H.; et al. A High-Throughput Method Based on Microculture Technology for Screening of High-Yield Strains of Tylosin-Producing Streptomyces fradiae. J. Microbiol. Biotechnol. 2023, 33, 831–839. [Google Scholar] [CrossRef] [PubMed]
  42. Tian, Y.; Li, D.; Wang, K.; Wei, B.; Zhang, J.; Li, J. An efficient method for targeted cloning of large DNA fragments from Streptomyces. Appl. Microbiol. Biotechnol. 2023, 107, 5749–5760. [Google Scholar] [CrossRef]
  43. Delcher, A.L.; Bratke, K.A.; Powers, E.C.; Salzberg, S.L. Identifying bacterial genes and endosymbiont DNA with Glimmer. Bioinformatics 2007, 23, 673–679. [Google Scholar] [CrossRef] [PubMed]
  44. Borodovsky, M.; Mcininch, J. Genmark: Parallel gene recognition for both DNA strands. Comput. Chem. 1993, 17, 123–133. [Google Scholar] [CrossRef]
  45. Wishart, D.S.; Feunang, Y.D.; Marcu, A.; Guo, A.C.; Liang, K.; Vázquez-Fresno, R.; Sajed, T.; Johnson, D.; Li, C.; Karu, N.; et al. HMDB 4.0: The human metabolome database for 2018. Nucleic Acids Res. 2018, 46, D608–D617. [Google Scholar] [CrossRef]
  46. Montenegro-Burke, J.R.; Guijas, C.; Siuzdak, G. METLIN: A Tandem Mass Spectral Library of Standards. Methods Mol. Biol. 2020, 2104, 149–163. [Google Scholar] [CrossRef]
  47. Vatlin, A.A.; Bekker, O.B.; Lysenkova, L.N.; Shchekotikhin, A.E.; Danilenko, V.N. Bioinformatics analysis of genes of Streptomyces xinghaiensis (fradiae) ATCC 19609 with a focus on mutations conferring resistance to oligomycin A and its derivatives. J. Glob. Antimicrob. Resist. 2020, 22, 47–53. [Google Scholar] [CrossRef]
  48. Bekker, O.B.; Vatlin, A.A.; Zakharevich, N.V.; Lysenkova, L.N.; Shchekotikhin, A.E.; Danilenko, V.N. Draft Genome Sequence of Streptomyces xinghaiensis (fradiae) OlgR, a Strain Resistant to Oligomycin A. Microbiol. Resour. Announc. 2019, 8, e01531-18. [Google Scholar] [CrossRef]
  49. Krzywinski, M.; Schein, J.; Birol, I.; Connors, J.; Gascoyne, R.; Horsman, D.; Jones, S.J.; Marra, M.A. Circos: An information aesthetic for comparative genomics. Genome Res. 2009, 19, 1639–1645. [Google Scholar] [CrossRef]
  50. Alam, K.; Hao, J.; Zhong, L.; Fan, G.; Ouyang, Q.; Islam, M.M.; Islam, S.; Sun, H.; Zhang, Y.; Li, R.; et al. Complete genome sequencing and in silico genome mining reveal the promising metabolic potential in Streptomyces strain CS-7. Front. Microbiol. 2022, 13, 939919. [Google Scholar] [CrossRef]
  51. Chen, Y.Y.; Chen, L.Y.; Chen, P.J.; El-Shazly, M.; Peng, B.R.; Chen, Y.C.; Su, C.H.; Su, J.H.; Sung, P.J.; Yen, P.T.; et al. Probing Anti-Leukemic Metabolites from Marine-Derived Streptomyces sp. LY1209. Metabolites 2022, 12, 320. [Google Scholar] [CrossRef] [PubMed]
  52. Williams, S.E.; Back, C.R.; Best, E.; Mantell, J.; Stach, J.E.M.; Williams, T.A.; Race, P.R.; Curnow, P. Discovery and biosynthetic assessment of ‘Streptomyces ortus’ sp. nov. isolated from a deep-sea sponge. Microb. Genom. 2023, 9, mgen000996. [Google Scholar] [CrossRef] [PubMed]
  53. Van Lanen, S.G.; Shen, B. Microbial genomics for the improvement of natural product discovery. Curr. Opin. Microbiol. 2006, 9, 252–260. [Google Scholar] [CrossRef] [PubMed]
  54. Tsunematsu, Y. Genomics-directed activation of cryptic natural product pathways deciphers codes for biosynthesis and molecular function. J. Nat. Med. 2021, 75, 261–274. [Google Scholar] [CrossRef] [PubMed]
  55. Tang, S.; Zhang, W.; Li, Z.; Li, H.; Geng, C.; Huang, X.; Lu, X. Discovery and Characterization of a PKS-NRPS Hybrid in Aspergillus terreus by Genome Mining. J. Nat. Prod. 2020, 83, 473–480. [Google Scholar] [CrossRef]
  56. Hashimoto, T.; Hashimoto, J.; Kagaya, N.; Nishimura, T.; Suenaga, H.; Nishiyama, M.; Kuzuyama, T.; Shin-Ya, K. A novel oxazole-containing tetraene compound, JBIR-159, produced by heterologous expression of the cryptic trans-AT type polyketide synthase biosynthetic gene cluster. J. Antibiot. 2021, 74, 354–358. [Google Scholar] [CrossRef]
  57. Zhang, Y.; Yao, T.; Jiang, Y.; Li, H.; Yuan, W.; Li, W. Deciphering a Cyclodipeptide Synthase Pathway Encoding Prenylated Indole Alkaloids in Streptomyces leeuwenhoekii. Appl. Environ. Microbiol. 2021, 87, e02525-20. [Google Scholar] [CrossRef]
  58. Craney, A.; Ozimok, C.; Pimentel-Elardo, S.M.; Capretta, A.; Nodwell, J.R. Chemical perturbation of secondary metabolism demonstrates important links to primary metabolism. Chem. Biol. 2012, 19, 1020–1027. [Google Scholar] [CrossRef]
  59. Aharoni, A.; Galili, G. Metabolic engineering of the plant primary-secondary metabolism interface. Curr. Opin. Biotechnol. 2011, 22, 239–244. [Google Scholar] [CrossRef]
  60. de Sousa, L.P. Mobile Genetic Elements in Pseudomonas stutzeri. Curr. Microbiol. 2020, 77, 179–184. [Google Scholar] [CrossRef]
  61. Blin, K.; Shaw, S.; Kloosterman, A.M.; Charlop-Powers, Z.; van Wezel, G.P.; Medema, M.H.; Weber, T. AntiSMASH 6.0: Improving cluster detection and comparison capabilities. Nucleic Acids Res. 2021, 49, W29–W35. [Google Scholar] [CrossRef] [PubMed]
  62. Ziemert, N.; Alanjary, M.; Weber, T. The evolution of genome mining in microbes—A review. Nat. Prod. Rep. 2016, 33, 988–1005. [Google Scholar] [CrossRef] [PubMed]
Figure 1. Tylosin structure.
Fermentation 09 00866 g001
Figure 2. (a) Phylogenetic tree based on 16S rRNA. (b) Phylogenetic tree based on housekeeping genes. Through a comparison with the local database, based on 31 housekeeping genes (dnaG, frr, infC, nusA, pgk, pyrG, rplA, rplB, rplC, rplD, rplE, rplF, rplK, rplL, rplM, rplN, rplP, rplS, rplT, rpmA, rpoB, rpsB, rpsC, rpsE, rpsI, rpsJ, rpsK, rpsM, rpsS, smpB, tsf), the closest 19 strains at the species level were selected, and the NJ (neighbor-joining) method was used to construct the phylogenetic tree with MEGA 6.0 software.
Fermentation 09 00866 g002
Figure 3. (a) Heat map of evolutionary analysis based on ANI analysis. The figure is a strain ANI matrix heat map. The lower and right sides are sample names, and different colored squares indicate nucleotide similarity between samples. (b) Heat map of evolutionary analysis based on AAI analysis. The figure is a strain AAI matrix heat map. The lower and right sides are sample names, and different colored squares indicate amino acid similarity between samples.
Fermentation 09 00866 g003
Figure 4. Circos genome map of Streptomyces fradiae sf106. The outermost circle of the Circos diagram represents the size of the genome. The second and third circles represent the coding sequences (CDS) on the positive and negative strands, with different colors indicating different functional classifications based on COG. The fourth circle represents rRNA and tRNA. The fifth circle represents the GC content, with the outward red region indicating higher GC content compared with the average GC content of the entire genome. The higher the peak, the greater the difference in GC content from the average value. The inward blue region indicates lower GC content compared with the average GC content of the entire genome. The higher the peak, the greater the difference in GC content from the average value. The innermost circle represents the GC skew value, which is calculated as (G − C)/(G + C). It can help determine the leading and lagging strands, with a positive GC skew indicating the leading strand and a negative GC skew indicating the lagging strand. It can also assist in identifying the replication origin (minimum cumulative offset) and terminus (maximum cumulative offset).
Fermentation 09 00866 g004
Figure 5. (a) Categorized statistics of predicted resistance genes. Different colors represent different drug classes, and their areas indicate the relative proportion of genes in that class. (b) Predictive statistical analysis of drug resistance genes based on ResFinder. Different colors represent different drug classes, and their areas indicate the relative proportion of genes in that class. The numbers in the figure represent the number of genes.
Fermentation 09 00866 g005aFermentation 09 00866 g005b
Figure 6. Statistics of carbohydrate-active enzyme annotation. The different colors in the pie chart represent different categories, and the area represents the relative proportion of genes in that category.
Fermentation 09 00866 g006
Figure 7. Linear map of secondary metabolite biosynthetic gene cluster (cluster 9). The map shows all genes in the predicted gene cluster, and the colors of different annotated genes are displayed according to the color of the gene in the COG classification. The functions represented by different colors are detailed in the COG analysis interface, and the gray represents the gene not annotated in COG.
Fermentation 09 00866 g007
Figure 8. KEGG compound classification. The vertical axis represents the classification of KEGG compounds, and the horizontal axis represents the number of compounds annotated to that type. The color of the bar indicates that it belongs to the first-level classification category of compounds.
Fermentation 09 00866 g008
Figure 9. Top 20 metabolites in abundance and matched to names. Y-axis indicates metabolite name, X-axis indicates the average relative abundance of metabolites in different subgroups, and different colored columns indicate different subgroups; p-values are on the far right: ***, p ≤ 0.001. A is the logarithmic pre-growth phase, B is the logarithmic mid-growth phase, C is the logarithmic late-growth phase, and D is the stationary phase.
Fermentation 09 00866 g009
Figure 10. Differences in mean relative abundance of tylosin between groups. The X-axis of the bar chart on the left side indicates the average relative abundance of a metabolite in different subgroups, the vertical coordinate indicates the subgroup category of the two-by-two comparison, and the different colors indicate different subgroups. The middle area is the confidence interval set, and the values corresponding to the dots indicate the difference in the average relative abundance of the metabolite in the two subgroups. The color of the dots shows the color of subgroups whose metabolite abundance accounts for the larger proportion, and the I-type intervals on the dots are the upper and lower limits of the difference.
Fermentation 09 00866 g010
Table 1. Summary of genomic overview and gene annotation.
SampleGenome Size (kb)GC Content (%)CDS No.tRNA NorRNA No.KEGGGOCOGNRPfamSwiss-Prot
Streptomyces fradiae sf10673517367506020230035004950610048603920
Note: (1) Sample Name: name of the sample; (2) genome size: size of the genome; (3) GC content (%): GC content of the chromosome or plasmid; (4) CDS No.: number of predicted coding genes; (5) tRNA: number of predicted tRNAs; (6) rRNA: number of predicted rRNAs; (7–12) number of genes annotated with information obtained from different databases and reference genomes in the sample.
Table 2. Predicted table of mobile genetic elements.
Sample NameGI No.Is No.Prophage No.CRISPR-Cas No.
Streptomyces fradiae sf106125113
Table 3. Prediction of secondary metabolites in Streptomyces fradiae sf106.
RegionTypeFromToMost Similar Known Cluster Similarity
Region 1redox-cofactor11,91234,657Alanylclavam/2-hydroxymethylclavam/2-fomyloxymethyclavam/clavam-2-carboxylateOther: Non-NRP beta- lactam12%
Region 2T3PKS, terpene367,053406,828endophenazine A/endophenazine BOther: Phenazine38%
Region 3NRPS670,555724,534scabichelinNRP20%
Region 4NRPS-like, PKS-like, betalactone, T2PKS, RRE- containing1,232,1011,317,375LL-D49194α1 (LLD)Polyketide39%
Region 5lanthipeptide-class-iii1,980,2212,002,953SapBRiPP: Lanthipeptide100%
Region 6siderophore2,354,6862,365,381
Region 7ectoine2,484,5802,494,984ectoineOther100%
Region 8T3PKS3,482,9333,524,030flaviolinOther50%
Region 9T1PKS3,545,2723,626,176carrimycinPolyketide55%
Region 10NRPS-like, lassopeptide3,657,0763,699,170citrulassin BRiPP100%
Region 11NRPS4,128,3794,201,561isocomplestatinNRP93%
Region 12terpene4,360,7314,379,029
Region 13RiPP-like, NRPS-like4,422,8414,466,244nunapeptin/nunamycinNRP14%
Region 14lanthipeptide-class-i4,599,4494,622,053
Region 15terpene4,728,8014,752,252 Terpene53%
Region 16terpene4,832,7154,849,274
Region 17RRE-containing, LAP, thiopeptide4,936,1674,971,075
Region 18siderophore5,095,3145,106,980desferrioxamineOther83%
Region 19RiPP-like5,186,5665,198,233
Region 20siderophore5,473,8855,488,679ficellomycinNRP3%
Region 21lanthipeptide- class-i5,836,9575,862,133tetrocarcin APolyketide4%
Region 22terpene7,023,5077,049,988isorenierateneTerpene87%
Table 4. Comparison of similar gene clusters from MIBiG comparison.
ReferenceSimilarity ScoreTypeCompound(s)Organism
Cluster1BGC0001156.10.15TerpeneplatencinStreptomyces platensis
Cluster2BGC0000674.10.71Terpene(-)-δ-cadineneStreptomyces clavuligerus ATCC 27064
Cluster3BGC0000426.10.42NRPsevadicinPaenibacillus larvae
Cluster4BGC0000248.11.65PolyketidenaphtocyclinoneStreptomyces arenae
Cluster5BGC0000551.10.47RiPPSapBStreptomyces coelicolor A3(2)
Cluster6BGC0001572.10.34Otherdesferrioxamine EPantoea agglomerans
Cluster7BGC0000853.10.64OtherectoineStreptomyces anulatus
Cluster8BGC0001310.10.46TerpenenaringeninStreptomyces clavuligerus ATCC 27064
Cluster9BGC0000166.10.78PolyketidetylactoneStreptomyces fradiae
Cluster10BGC0001552.11.16RiPPcitrulassin FStreptomyces avermitilis MA-4680 = NBRC 14893
Cluster11BGC0000326.10.41NRPisocomplestatinStreptomyces lavendulae
Cluster12BGC0001910.10.28TerpenecyslabdanStreptomyces cyslabdanicus
Cluster13BGC0000500.10.41RiPPcarnolysin A1, carnolysin A2Carnobacterium maltaromaticum
Cluster14BGC0000544.10.19RiPPplanosporicinPlanomonospora alba
Cluster15BGC0000648.10.34TerpenecarotenoidMyxococcus xanthus
Cluster16BGC0001910.10.34TerpenecyslabdanStreptomyces cyslabdanicus
Cluster17BGC0001146.11.02RiPPcyclothiazomycin CStreptomyces sp. NRRL WC-3908
Cluster18BGC0001478.10.58Otherdesferrioxamine EStreptomyces sp. ID38640
Cluster19No matches found
Cluster 20BGC0001531.10.26Otherbisucaberin BTenacibaculum mesophilum
Cluster21BGC0001727.10.23RiPPpaenilanPaenibacillus polymyxa E681
Cluster22BGC0000664.10.42TerpeneisorenierateneStreptomyces griseus subsp. griseus NBRC 13350
Table 5. Total ion count and identification statistics.
Ion ModeAll PeaksIdentified MetabolitesMetabolites in LibraryMetabolites in KEGG
pos6480970697229
neg8049885790238
Note: (1) Ion mode: the ion mode of the substance detected by the mass spectrometer, mainly: pos (positive ion mode) and neg (negative ion mode); (2) all peaks: the number of peaks extracted by the software; (3) identified metabolites: the number of metabolites finally identified by the first and second levels of mass spectrometry data, searching libraries (self-built library, Metlin, HMDB) through the primary and secondary mass spectrometry data; (4) metabolites in library: the number of metabolites annotated to public databases, such as HMDB and Lipidmaps; (5) metabolites in the KEGG: the number of metabolites annotated to the KEGG database.
Disclaimer/Publisher’s Note: The statements, opinions and data contained in all publications are solely those of the individual author(s) and contributor(s) and not of MDPI and/or the editor(s). MDPI and/or the editor(s) disclaim responsibility for any injury to people or property resulting from any ideas, methods, instructions or products referred to in the content.

