Abstract
Microflora play an important role in the fermentation of blueberry wine, influencing the flavor and nutrient formation. Commercial yeasts give blueberry wines an average flavor profile that does not highlight the specific aroma and origin of the blueberry. In the present study, ITS1-ITS2 region sequencing analysis was performed using Illumina MiSeq high-throughput technology to sequence fermented blueberry wine samples of three Vaccinium ashei varieties, Gardenblue, Powderblue, and Britewell, from the Majiang appellation in Guizhou province to analyze the trends of fungal communities and the diversity of compositional structures in different periods of blueberry wine fermentation. The study’s results revealed that 114 genera from seven phyla were detected in nine samples from different fermentation periods of blueberry wine. The main fungal phyla were Ascomycota, Basidiomycota, Kickxellomycota, Chytridiomycota, and Olpidiomycota. The main fungal genera were Hanseniaspora, Saccharomyces, unidentified, Aureobasidium, Penicillium, Mortierella, Colletotrichum, etc. Hanseniaspora was dominant in the pre-fermentation stage of blueberry wine, accounting for more than 82%; Saccharomyces was the dominant genera in the middle and late fermentation stages of blueberry wine, with Saccharomyces accounting for more than 72% in the middle of fermentation and 93% in the late fermentation stage. This study screened indigenous flora for the natural fermentation of blueberry wine in the Majiang production area of Guizhou, improved the flavor substances of the blueberry wine, highlighted the characteristics of the production area, and made the blueberry wine have the characteristic flavor of the production area.
1. Introduction
Microorganisms are the richest resource of biodiversity on Earth, and exploring microbial diversity is important for the study of microorganisms and human diseases [1]. The blueberry wine fermentation system consists of different species, quantities, and qualities of yeasts, bacteria, and molds, and is a complex and dynamic microbial ecosystem that is constantly evolving and changing [2]. Among them, the growth, metabolism, and apoptosis activities of yeast and lactic acid bacteria convert the sugars in blueberry into alcohol, so it is of great theoretical and practical significance to explore the fungal community characteristics and succession law in the fermentation process of blueberry wine for the optimization of the wine fermentation process. The color, taste, and aroma of blueberry wine are inseparable from the interaction of microorganisms in the parameters of fermentation. Blueberry wine currently has two types of fermentation: natural fermentation and commercial yeast-inoculated fermentation. Commercial yeast inoculation fermentation is used to control the fermentation by adding commercial yeast that has been maturely used in the winemaking industry. This method allows for stable brewing during the fermentation of blueberry wine, but it also produces a single flavor of blueberry wine [3]. The natural fermentation method of blueberry wine can have the characteristics and style of the original production area because the natural fermentation process retains the microflora of the blueberries’ origin [4].
In recent years, high-throughput sequencing technology has been widely used in food research due to its advantages [5]. The existence of complex and variable micro-ecosystems during the fermentation of blueberry mash, which reflects the fermentation status of blueberry mash in real time, plays a crucial role in the flavor and quality of blueberry wine. Most of the studies were mainly on the composition structure of bacterial colonies and fungal colonies on the peel of different blueberry varieties, but there were few studies on the trend and structural variability of fungal colonies in different fermentation stages of different blueberry varieties, and few works of research have been reported for the fermentation process of different blueberry varieties in the Majiang appellation in Guizhou.
There have been very few studies on the changes in the microflora of blueberry wine, and studies on the fungal composition and changes in different varieties of blueberries and various stages of fermentation have not been reported. Therefore, in this study, we used ITS-ITS2 high-throughput sequencing technology to dynamically analyze the fungal communities of different blueberry varieties at different fermentation periods to assess the composition and abundance of fungal communities and provide a basis for further research on the structural changes of blueberry wine flora and its role in the fermentation process in the Majiang region of Guizhou.
2. Materials and Methods
2.1. Experimental Materials
The Vaccinium ashei used in this study came from the ecological blueberry industrial park in Ukapeng of Majiang County Guanghua Agriculture Limited. Ukapeng Ecological Blueberry Industrial Park is centered on the Blue Dream Valley Scenic Area in Republican Village, Longshan Town. The base was built in 1998 and mostly planted with Britewell, Baldwin-T-117, Powderblue, Bluerain, O’Neal, Gardenblue, and other blueberry varieties. The blueberry base is based on blueberry cultivation land and relies on different contractors to cultivate blueberry plants. The area of Uka village is about 9.73 square kilometers, with 818 mu of arable land, except for a few flat lands for rice, corn, and chrysanthemum planting, and a large area of blueberry is neatly planted on the terraces on the hills and mountains, with a slope ranging from 6° to 20°, and the horizontal terraces are more than 2 m wide. The peak growth of Ukapeng eco-blueberries is usually in May and June [6]. The heavy metal content in the soil profile of the Majiang production area in Guizhou exceeded the standard, but, mainly at the bottom of the contour, the growth of blueberries was not significantly affected [7]. Pest control in new blueberry growing areas is mainly applied at safe intervals during the rest period [8].
The blueberries were randomly harvested at the ripening stage of three varieties of blueberries, namely, Gardenblue, Powderblue, and Britewell; hand-harvested from the plants using sterile gloves, the blueberries were preserved in sterile vacuum bags and transferred to the laboratory under refrigeration for blueberry winemaking.
2.2. Experimental Methods
2.2.1. The Fermentation Process of Blueberry Wine
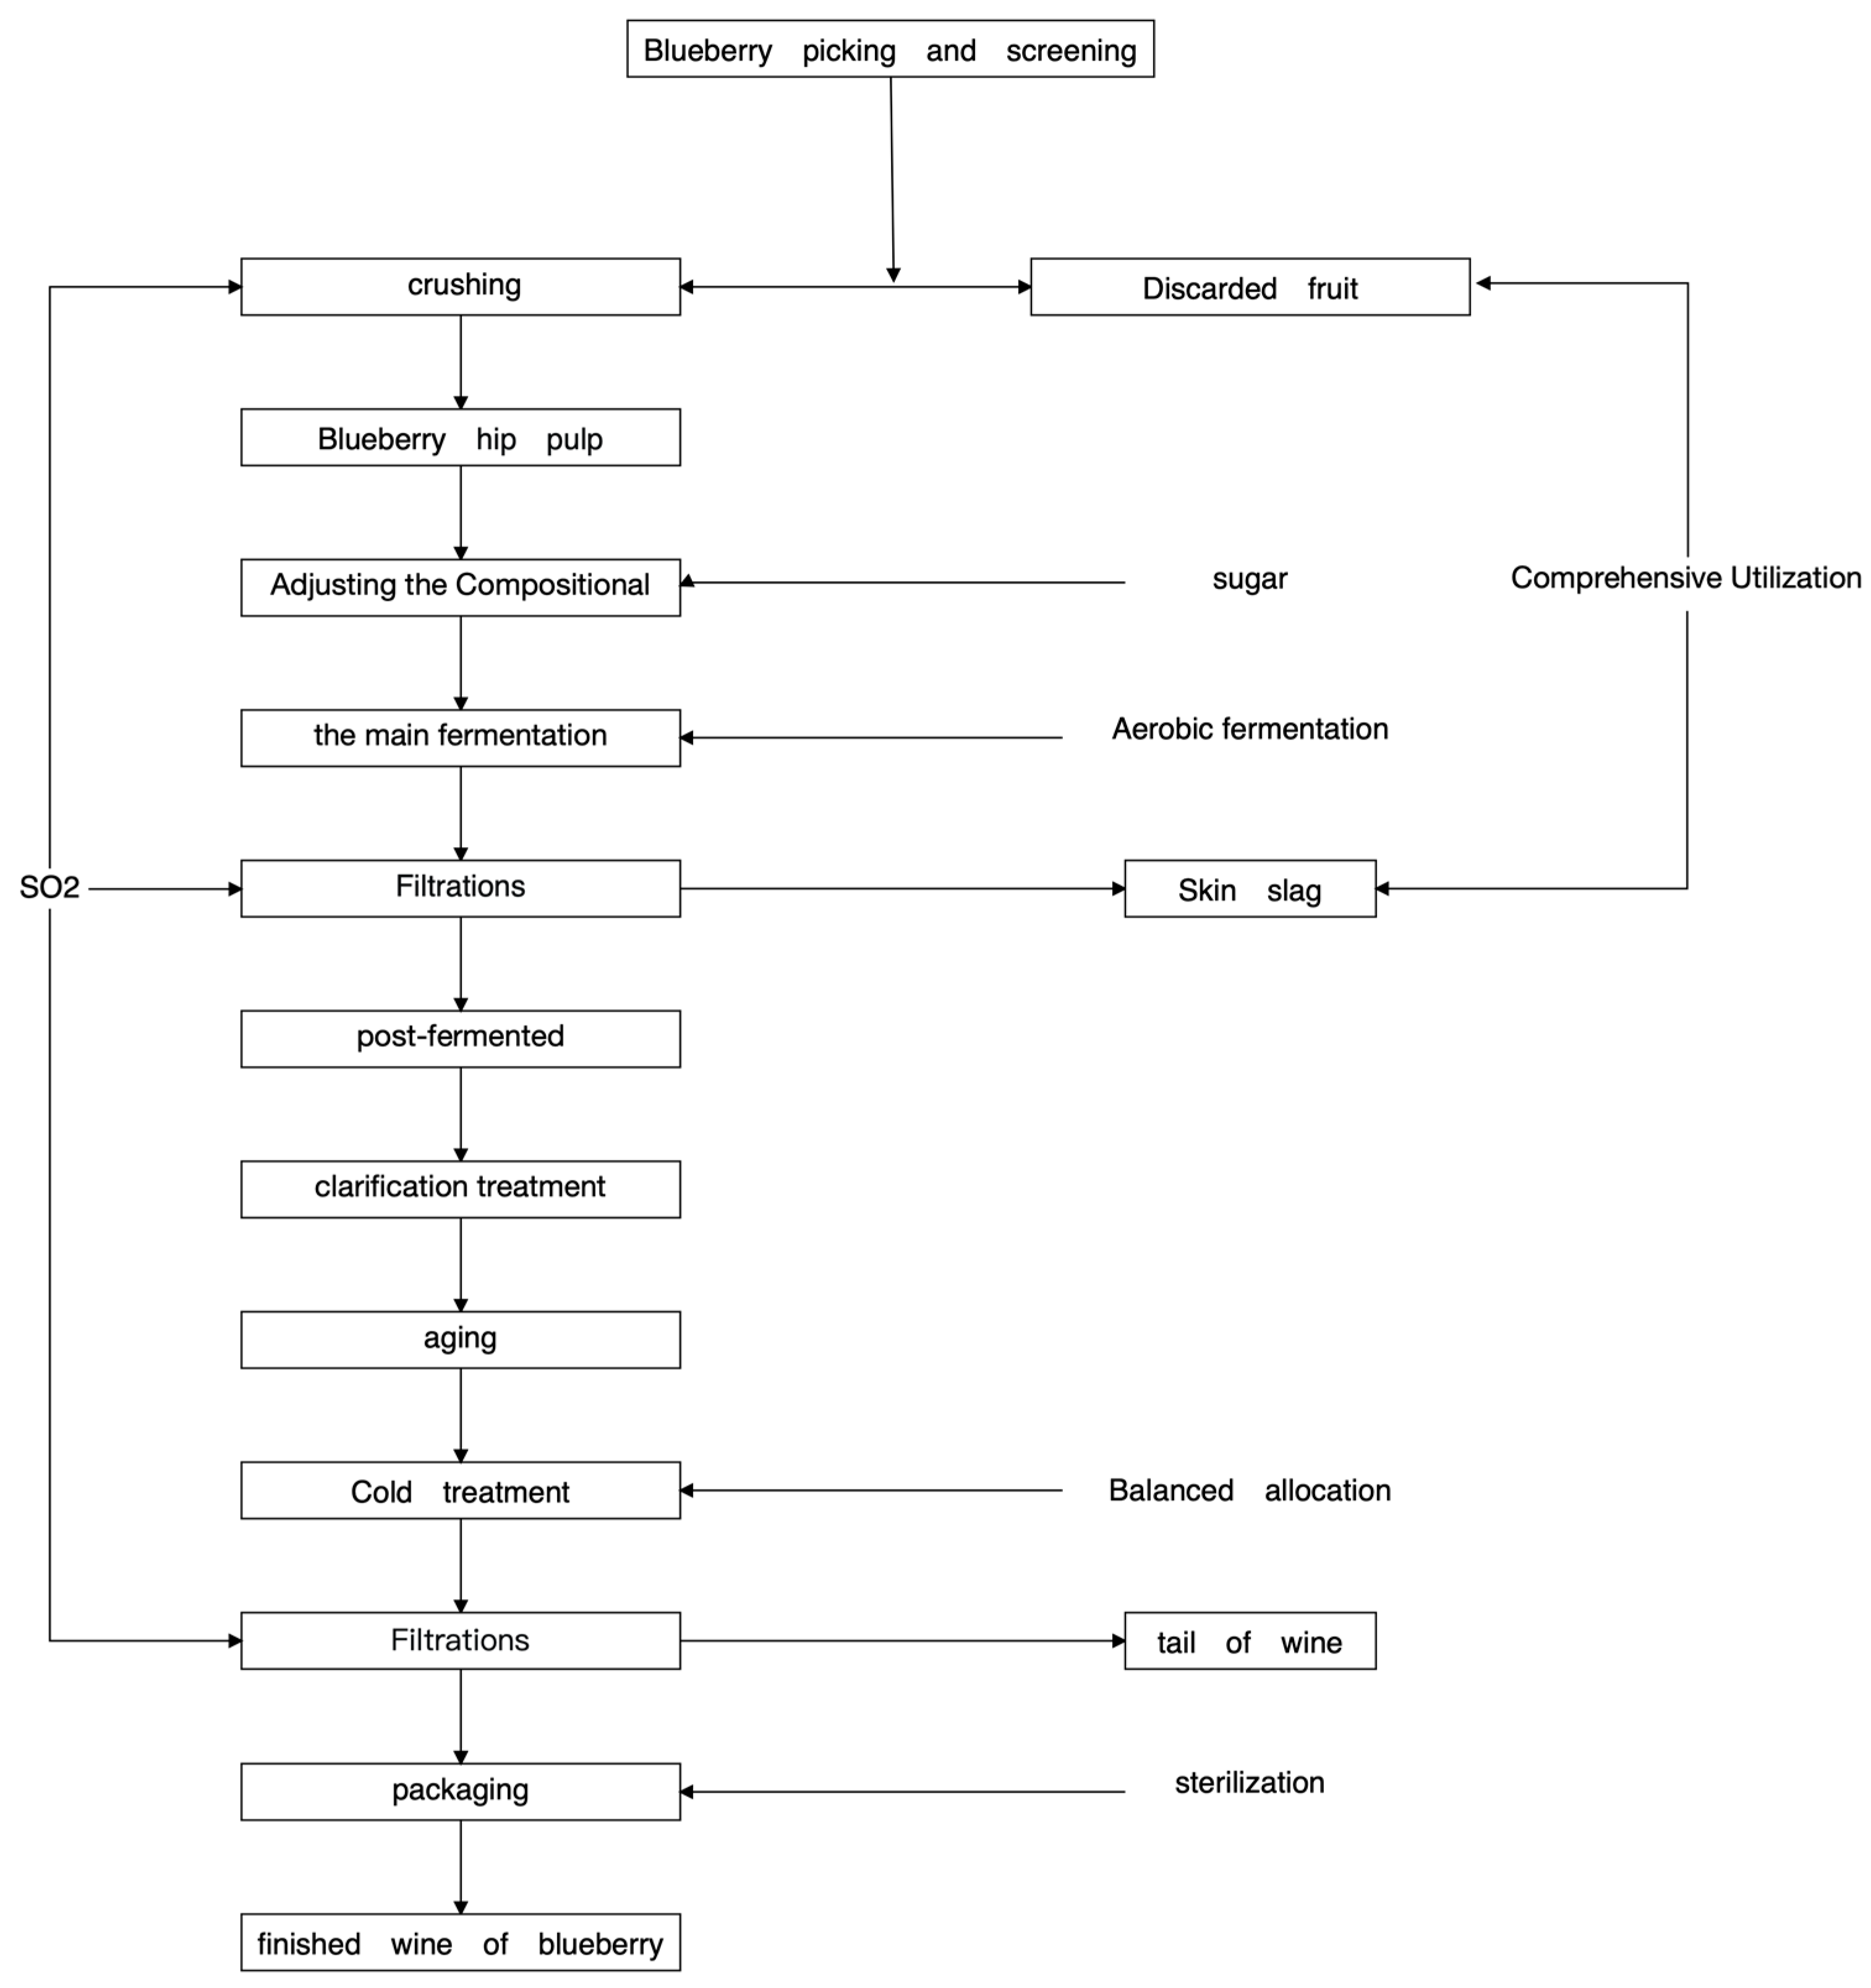
Hu et al. studied the fermentation process of blueberry wine [9] (Figure 1).
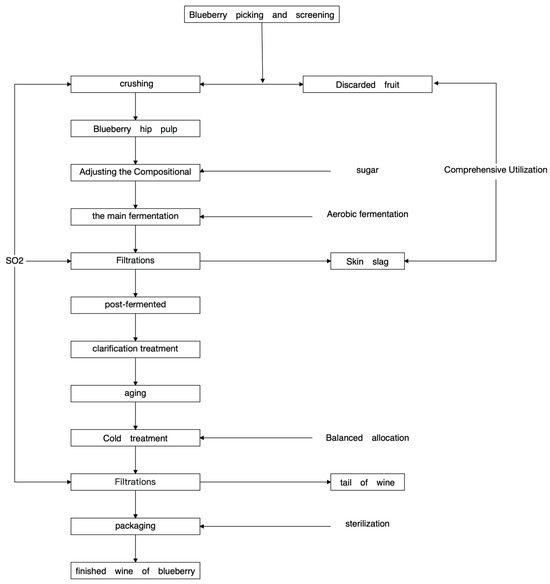
Figure 1.
Blueberry wine brewing technology roadmap.
Fresh blueberry berries were fermented with sterile gloves and hand crushed and pressed. Fermentation of the three blueberry varieties was monitored daily using a densitometer, and 50 mL fermentation broth samples were collected at three different fermentation stages (pre-fermentation, mid-fermentation, and post-fermentation): pre-fermentation (day 2), mid-fermentation (day 4), and post-fermentation (day 6). Thirty mL of blueberry ferment broth samples were drawn into sterile centrifuge tubes under aseptic conditions and stored in an ultra-low temperature refrigerator (−80 °C) for sequencing of the fungi. Another 1 mL of blueberry fermentation broth samples were aspirated into 99 mL of sterile saline under aseptic conditions and homogenized for 30 min for media experiments [10].
2.2.2. Extraction of Genetic DNA from Blueberry Wine Samples
Extraction of genetic DNA was performed using the MOBIO PowerSoil® DNA Isolation Kit (MOBIO, Vancouver, BC, Canada) in the following steps. The main steps include placing 0.25 mL of blueberry wine sample in a 750 μL tube, mixing gently with good tools, adding 60 μL of Reagent ①, mixing upside down, and placing the tube on a vortexer adapter at 3200 RMP for 10 min. Then, we transferred the supernatant to a clean 2 mL collection tube, added reagent ② and reagent ③, and continued to vortex and incubate. Then, we added reagent ④ to allow the DNA to adsorb onto the membrane, and then added reagent ⑤ to elute. Finally, the extracted plasmid DNA was spiked onto a 1% agarose gel, and nucleic acid electrophoresis was performed after sampling to obtain the extracted DNA [11].
2.2.3. PCR Amplification and MiSeq Sequencing of DNA Extracted from Blueberry Wine Fermentation Broth Samples
Primer sequences for the fungal ITS1-ITS2 region were as follows: 5’-CTTGGTCATTTAGAGGAAGTAAA-3’ and 3’-TGCGTTCTTCATCGATGC-5’ (5 μmol/L) 1 μL each, BSA (2 ng/μL) 3 μL, 2 × Taq Plus Master Mix 12.5 μL, and ddH2O 7.5 μL. The amplification process is as follows: 94 °C preproduction for 5 min, decomposition for 94 s at 94 °C, annealing at 55 °C for 30 s, extension at 72 °C for 1 min for 28 cycles, and finally, extension at 72 °C for 10 min, and each sample was repeated three times. Then, we screened for the detection of PCR amplification products by nucleic acid electrophoresis using 1% agarose gel for amplified target band size, which was purified by Agencourt AMPure XP Nucleic Acid Purification Kit (Agencourt, Beverly, MA, USA), which was used for purification. Subsequent library construction and sequencing were entrusted to the Nanjing branch of Beijing Ovison Biotechnology Co.
2.3. Data Processing
MiSeq sequencing was obtained from Pair-End (PE) double-end sequence data using Trimmomatic and Pear to quality control the measured Fastq data to obtain a Fasta sequence; then, using Flash and Pear, the two-end sequence was spliced (merged) according to the overlapping relationship of PE. Finally, to obtain raw-tags, we had to remove the chimeras of Fasta sequences by the chime method according to the known database and by the self-comparison (denovo) method for the unknown database, and remove the short sequences that did not meet the requirements to obtain high-quality sequences of clean-tags [12].
The clean tags were clustered to generate OTUs [13]. The RDP Classifier algorithm was used to compare and analyze the OTU representative sequences and annotate the species information of their communities at the phylum, genus, and species level (phylum, genus, species) to obtain the species’ taxonomic information corresponding to each OTU. Sequence alignment was performed using mafft, fast tree was used for tree building, and species (genus) evolutionary relationships were visualized and displayed according to the Python language. PCA statistical analysis and graphing were performed using the R language.
3. Results
3.1. Blueberry Wine Physical and Chemical Indicators
The alcohol content of the three blueberry wines is constantly changing during different fermentation periods, and there are differences in alcohol content between the different blueberry varieties in Table 1. In the pre-fermentation period, the alcoholic strengths of Gardenblue and Powderblue were closer to each other, and Britewell had a higher alcoholic power. As the fermentation process advances, blueberry wine decreases in alcohol content in the middle of the fermentation period. This is because the yeast has a greater intake of nutrients when its growth rate is at its maximum, and the process of alcohol synthesis is inhibited. Reaching the end of fermentation, the alcohol content increased, and the lower alcohol content of Gardenblue, compared to Powderblue and Britewell, reflected the weaker yeast population of Gardenblue. Britewell was too high in the pre-fermentation period, approaching the alcohol tolerance value of the yeast, which tends to inhibit yeast growth. Initial brix, total sugar, and dry leachate primarily influence the potential for alcohol production during the fermentation of blueberry wines, which can be visualized here using the value of the alcohol strength. Total acid is mainly used for sensory evaluation and has no major influence on the bacterial flora of the wine, while malic acid–lactic acid is an essential component of total acid, which influences the taste and the flavor of the wine. Volatile acid provides an important basis for aroma composition, but too much volatile acid can affect the quality of the wine. Of the three samples, the Powderblue blueberry had the lowest level of volatile acid, which allows the blueberry wine to provide aroma and enhance the wine quality. Its pH was close to the same level, which is necessary for the growth of yeast and helps the yeast’s biochemical reactions, which are ultimately reflected in the alcohol strength. The total SO2 of Gardenblue and Britewell fluctuates greatly during the first, middle, and late stages of fermentation, which may be due to the release of SO2 from the yeast during the cell wall cracking during the fermentation, and the large fluctuation of SO2 can easily inhibit the activity of the yeast and affect the progress of the fermentation. The total SO2 of Powderblue increases gradually during the fermentation process, which ensures that the yeast can adapt to the fermentation process and is not affected by the fluctuation of total SO2 in the early and middle stages of the fermentation. Therefore, overall, the Powderblue blueberry wine samples had good physicochemical indexes, which were favorable for carrying out the following experiments.

Table 1.
Basic physicochemical indexes of blueberry wine.
The letters in the Table 1 indicate the significance of the differences between samples. When the letter markers between two samples are the same, it means that the differences between the two samples are not significant. For example, the differences between the CSL3 and MM2 samples of Alcoholic strength are not significant. On the contrary, the letter markings between the two samples are different, for example, the CGE1 and CGM2 of Initial Brix have different letter markings, indicating significant differences between the two samples.
3.2. Sequence Data and OTUs Analysis
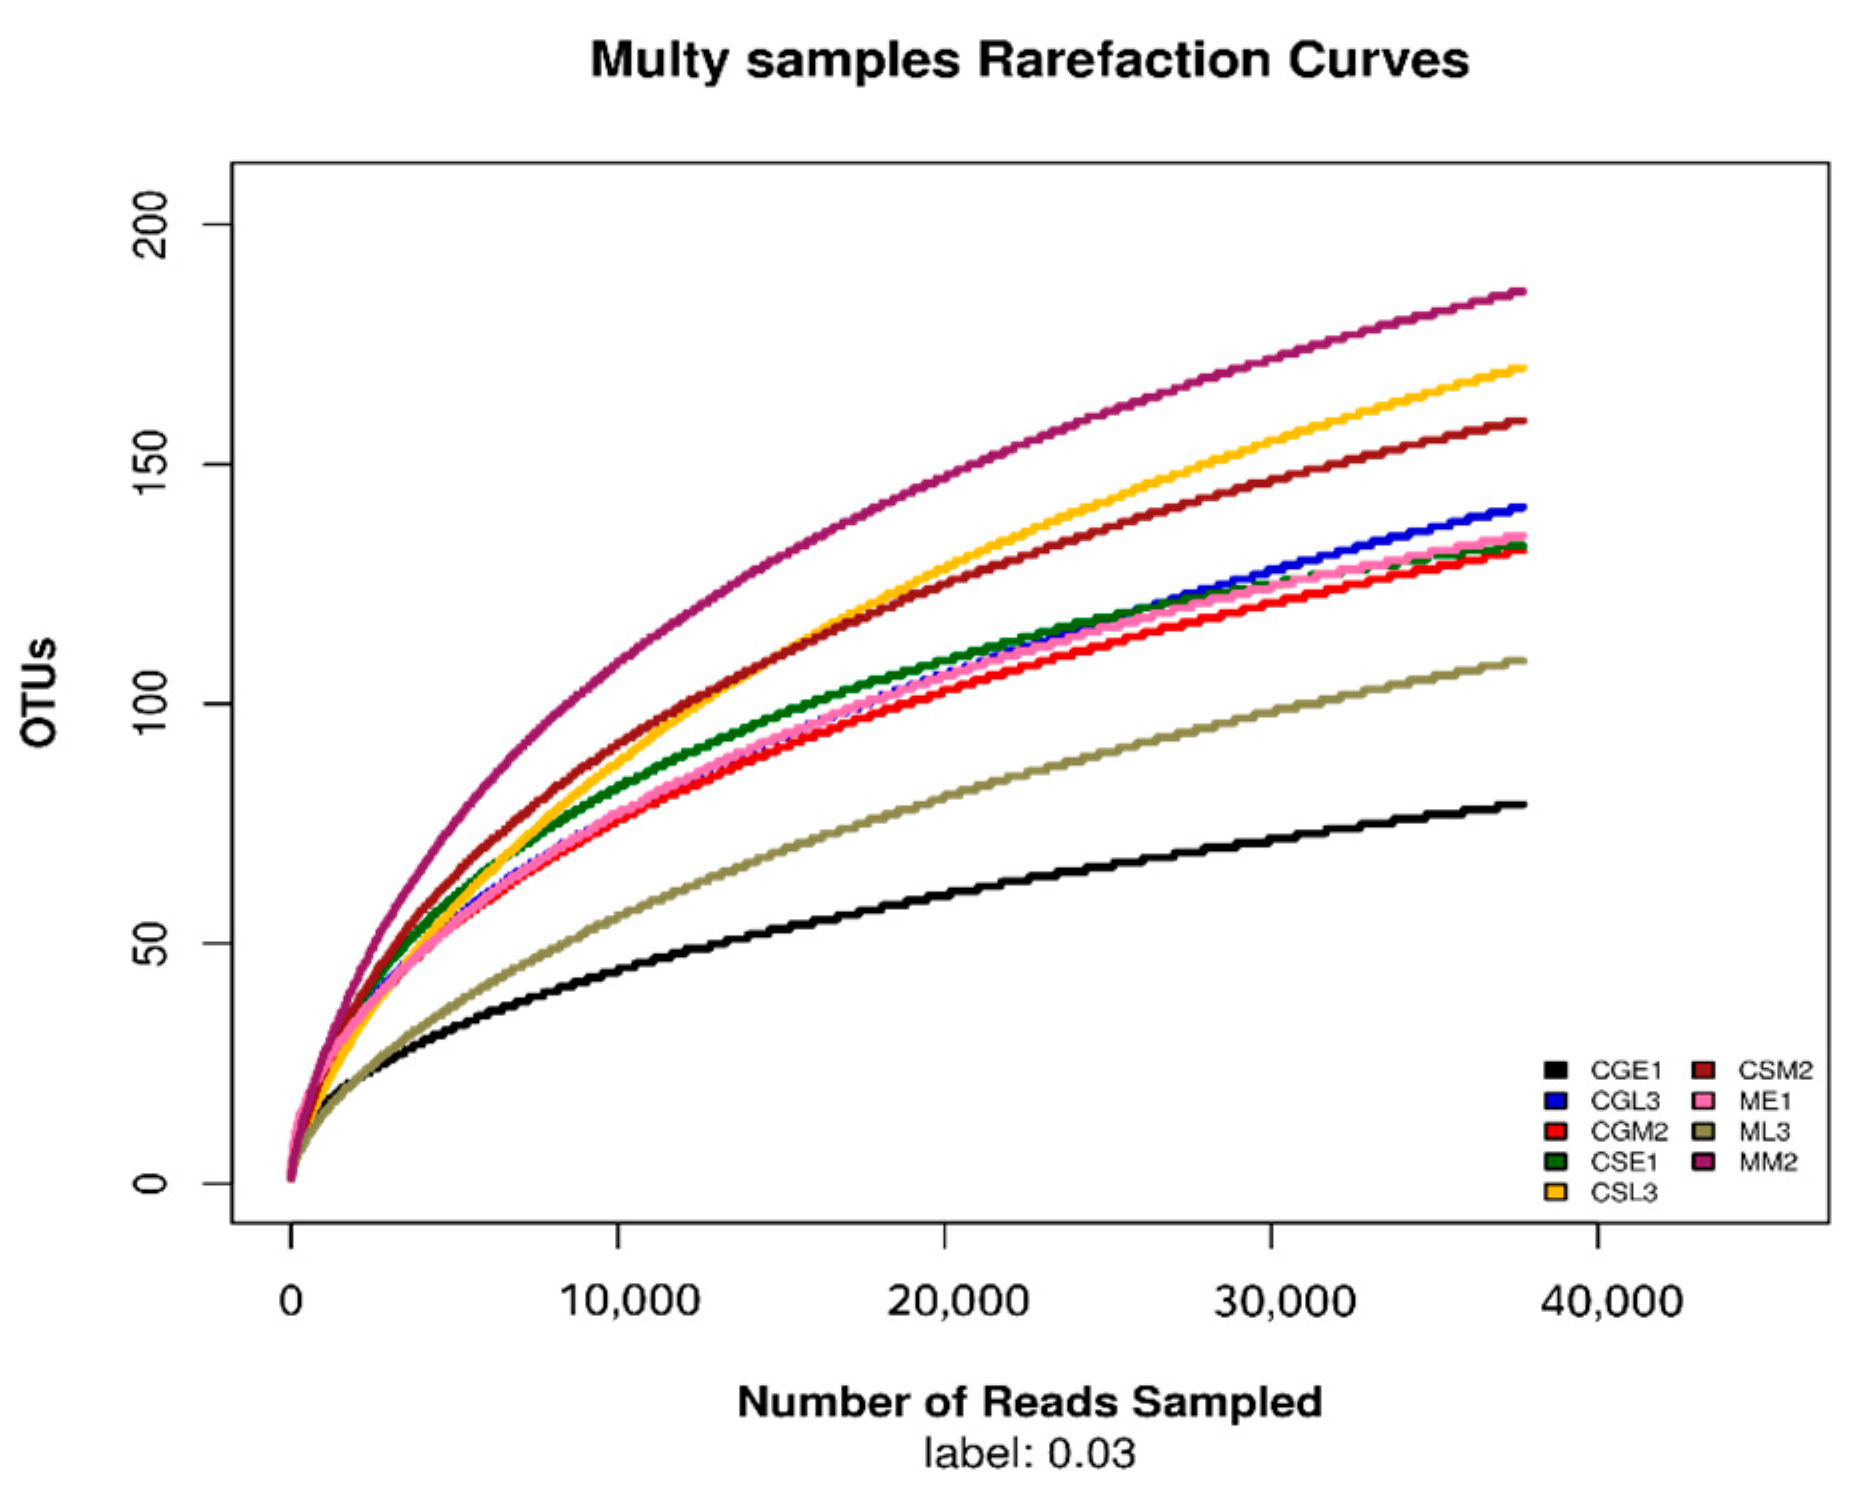
After sequencing samples from different fermentation periods of Gardenblue, Powderblue, and Britewell blueberry wines, the quality sequence distribution statistics were obtained and are shown in Table 2. A total of 482,852 valid sequences were collected from nine blueberry fermentation broth samples, among which the sequence lengths in the range of 420–440 accounted for the majority of the valid sequences. This experimental result indicates that the detection results are excellent and can be applied to the later experimental analysis. The dilatability curves allow the sequencing depth of the samples to be derived [14]. From the dilution curves of the fungal ITS1-ITS2 regions of different varieties of blueberries before, during, and after fermentation under the 97% similarity condition shown in Figure 2, it can be seen that when the number of fungal OTUs reached about 70, the dilution curves of the samples of pre-fermentation Gardenblue and late fermentation Britewell had begun to level off, the sampling depth was sufficient, and the sequencing number could cover all taxa. The remaining seven samples also had sufficient sequencing depth when the number of fungal OTUs reached about 100, and the taxa were covered completely.
Table 2.
Sample sequence length distribution.
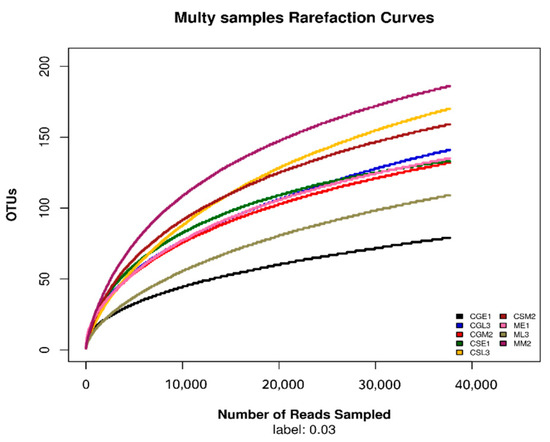
Figure 2.
Dilution curve of different samples. CGE1 is the pre-fermentation Gardenblue blueberry wine sample, CGM2 is the mid-fermentation Gardenblue blueberry wine sample, CGL3 is the late fermentation Gardenblue blueberry wine sample, CSE1 is the pre-fermentation Powderblue blueberry wine sample, CSM2 is the mid-fermentation Powderblue blueberry wine sample, CSL3 is the late fermentation Powderblue blueberry wine sample, ME1 is the pre-fermentation Britewell blueberry wine sample, MM2 is the mid-fermentation Britewell blueberry wine sample, ML3 is the late fermentation Britewell blueberry wine sample.
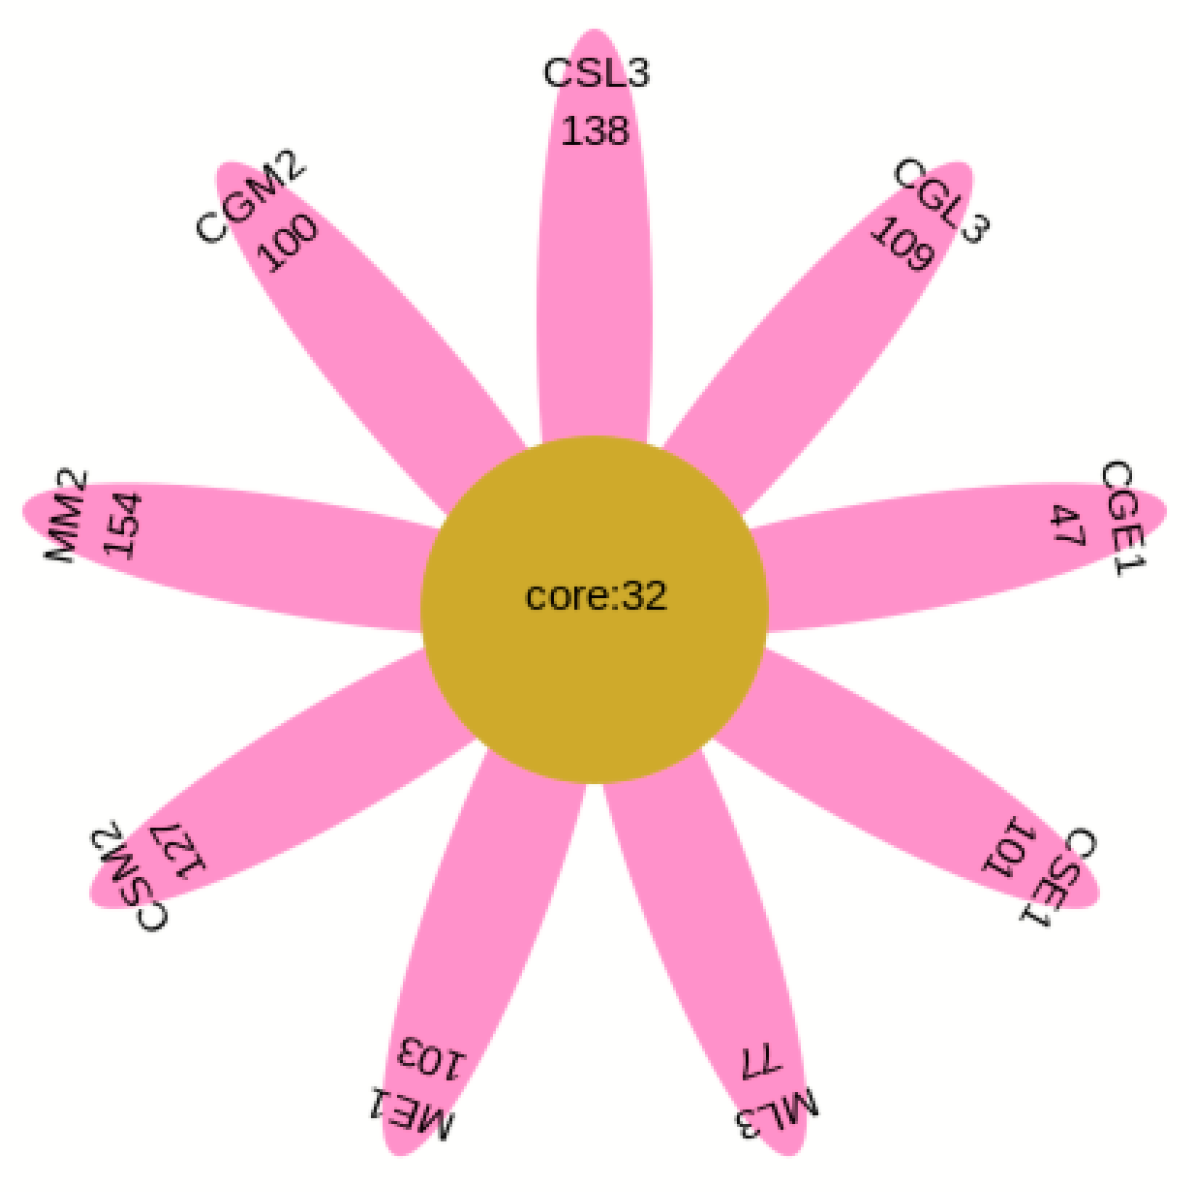
The OTU Venn diagram (Figure 3) labels the number of OTUs in the three varieties of blueberry wine samples, with the main objects being those that are conventional in blueberry wine samples and those that are specific to blueberry wine samples. As can be seen in Figure 3, the samples of the three blueberry varieties have 128 OTUs in common, of which only Gardenblue has 14, only Powderblue has 24, and 38 are specific to Britewell. This shows that the fungal communities of the three blueberry varieties have overlapping parts, and also have their own varieties of unique fungal communities. To better represent the OTU distribution of blueberry wine samples, a petal chart of OTU distribution (Figure 4) shows the number of endemic and overlapping OTUs in the full sample of blueberry wine. As can be seen in Figure 4, the total number of OTUs for all blueberry wine samples was 32, indicating the presence of 32 fungal communities that survived the entire fermentation process of blueberry wine.
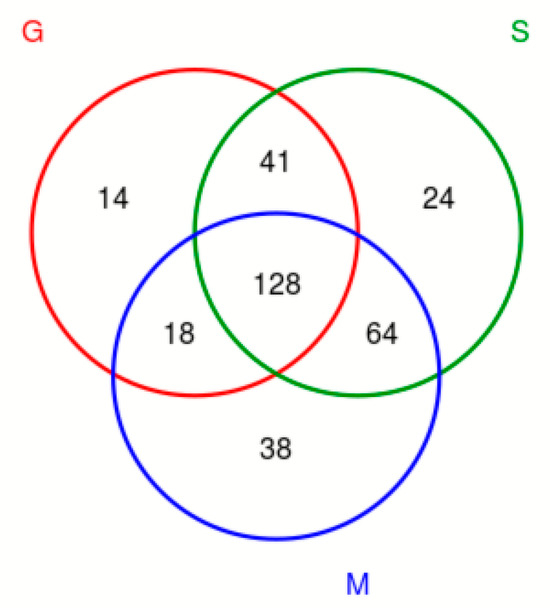
Figure 3.
Venn diagram of OTU distribution. S is a sample of Powderblue, G is a sample of Gardenblue, and M is a sample of Britewell.
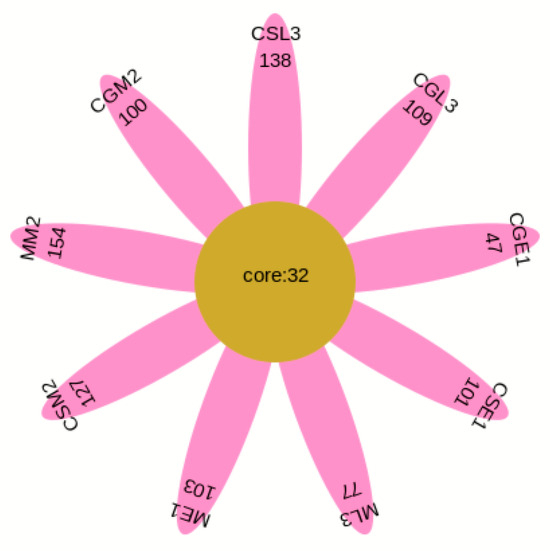
Figure 4.
Flower plot. CGE1 is the pre-fermentation Gardenblue blueberry wine sample, CGM2 is the mid-fermentation Gardenblue blueberry wine sample, CGL3 is the late fermentation Gardenblue blueberry wine sample, CSE1 is the pre-fermentation Powderblue blueberry wine sample, CSM2 is the mid-fermentation Powderblue blueberry wine sample, CSL3 is the late fermentation Powderblue blueberry wine sample, ME1 is the pre-fermentation Britewell blueberry wine sample, MM2 is the mid-fermentation Britewell blueberry wine sample, ML3 is the late fermentation Britewell blueberry wine sample. The core numbers inside the central circle indicate the number of OTU present in all nine blueberry wine samples, and the numbers on the outer petals indicate the number of OTU specific to that sample at different times for different blueberry varieties.
From Figure 4, the total number of OTUs in the nine samples of Gardenblue, Powderblue, and Britewell before, during, and after fermentation was 32. The totals for each variety were 133, 159, and 177 for Gardenblue, 79, 132, and 141 for Powderblue, and 135, 186, and 109 for Britewell before, during, and after fermentation, respectively. This shows that there are both similarities and differences in the bacterial flora of different varieties of blueberries in the same appellation during fermentation.
3.3. Analysis and Discussion of Alpha Diversity Data of Fungal Community Zones during the Fermentation of Blueberry Wine
The alpha diversity index table for fungal detection [15] contains six main indices, namely: the chao1 index, the coverage index, the observed_species index, the PD_whole_tree index, and the Shannon and Simpson indices, by which the experimental results can reflect the richness and diversity of samples of three different blueberry wines at different fermentation stages in the Majiang appellation of Guizhou. The chao1 and observed_species indices are used mainly to estimate the number of species contained in the fungal community in blueberry wine samples. Also, these two indices can represent the OTU estimate and the actual value of the sample community, respectively, which can reflect the abundance of fungal communities at each stage of blueberry wine fermentation. The coverage is a test of microbial coverage in blueberry wine, and the higher the value, the lower the probability that new species are not detected in the samples of different fermentation stages of blueberry wine. The coverage index of all blueberry wine samples was 1.00, indicating that the coverage of blueberry wine samples was 100%, indicating the actual situation of true actual value bacteria in samples of different varieties of blueberry wine at different fermentation stages and reflecting the reliability of the experimental data. As can be seen from Table 3, chao1 reflects the richness and diversity of fungal species in the blueberry wine samples, which is reflected by the number of species in the sample, and the more species in the sample, the richer the sample. Species richness does not consider the relative abundance of each species; it gives the same weight to species with low relative abundance as those with high relative abundance. As shown in Table 3, the largest fungal richness value on the chao1 index for different varieties of blueberries before, during, and after fermentation was for Britewell in the middle of fermentation, and the smallest chao1 index value was for Gardenblue in the pre-fermentation period, indicating that Britewell in the middle of fermentation was the most abundant species among these nine samples, and the abundance of Gardenblue reached the minimum value in the pre-fermentation period. Among them, the PD_whole_tree index responded to the changes of fungal communities in the samples during the fermentation of blueberry wine, and to the diversity, reflecting the trend and variation of fungi in blueberry wine samples. Uniformity reflects the relative abundance of different species. Diversity increases with increasing species richness and evenness. The Shannon and Simpson diversity indices are a composite indicator of species richness and evenness in a sample. Higher Shannon and Simpson values indicate a higher diversity of community species [16,17,18]. From Table 3, it can be seen that Powderblue had the highest fungal community diversity among different varieties in the same fermentation stage, followed by Britewell and then Gardenblue. Among different fermentation stages of the same variety, all had the highest fungal community diversity in the pre-fermentation stage, followed by the middle stage and then by the late fermentation stage.
Table 3.
Statistical table of Alpha Diversity Index of samples.
CGE1 is the pre-fermentation Gardenblue blueberry wine sample, CGM2 is the mid-fermentation Gardenblue blueberry wine sample, CGL3 is the late fermentation Gardenblue blueberry wine sample, CSE1 is the pre-fermentation Powderblue blueberry wine sample, CSM2 is the mid-fermentation Powderblue blueberry wine sample, CSL3 is the late fermentation Powderblue blueberry wine sample, ME1 is the pre-fermentation Britewell blueberry wine sample, MM2 is the mid-fermentation Britewell blueberry wine sample, ML3 is the late fermentation Britewell blueberry wine sample.
3.4. Alpha Diversity Analysis of Fungal Flora during Wine Fermentation
Based on the differentiation of ITS1-ITS2 regions for fungal species, representative sequences of OTUs corresponding to the largest abundance were selected for tree building by genus using the mafft and fast tree methods. From Figure 5, it can be seen that there are mainly 114 genera belonging to seven phyla in the dry red blueberry winemaking habitat, namely: Ascomycota, Kickxellomycota, Chytridiomycota, Olpidiomycota, Basidiomycota, Mortierellomycota, and Glomeromycota, of which 83 genera belong to Ascomycetes, 24 to Basidiomycota, 2 to Glomeromycota, 2 to Chytridiomycota, 1 to Kickxellomycota, 1 to Olpidiomycota, and 1 to Mortierellomycota. This indicates that the fungal diversity in the dry red blueberry winemaking habitat is very rich and that dry red blueberry winemaking is the result of the joint action of many microorganisms, while the Ascomycetes is the dominant phylum.
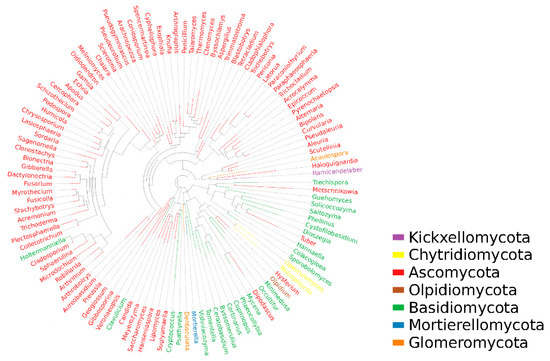
Figure 5.
Phylogenetic tree of fungi in winemaking habitat in Majiang, Guizhou province. In this figure, the first column starting from the left shows the blueberry wine sample information, including the phylum and genus of the fungus. The second column shows the fungal phylum classification corresponding to the fungal genus classification in the blueberry wine sample. In this case, the outermost circle of the phylogenetic tree shows the relative abundance of each fungal number in the blueberry wine sample, with the length of the different blocks of each color representing the corresponding level of relative abundance.
3.5. Analysis of Fungal Species and Abundance
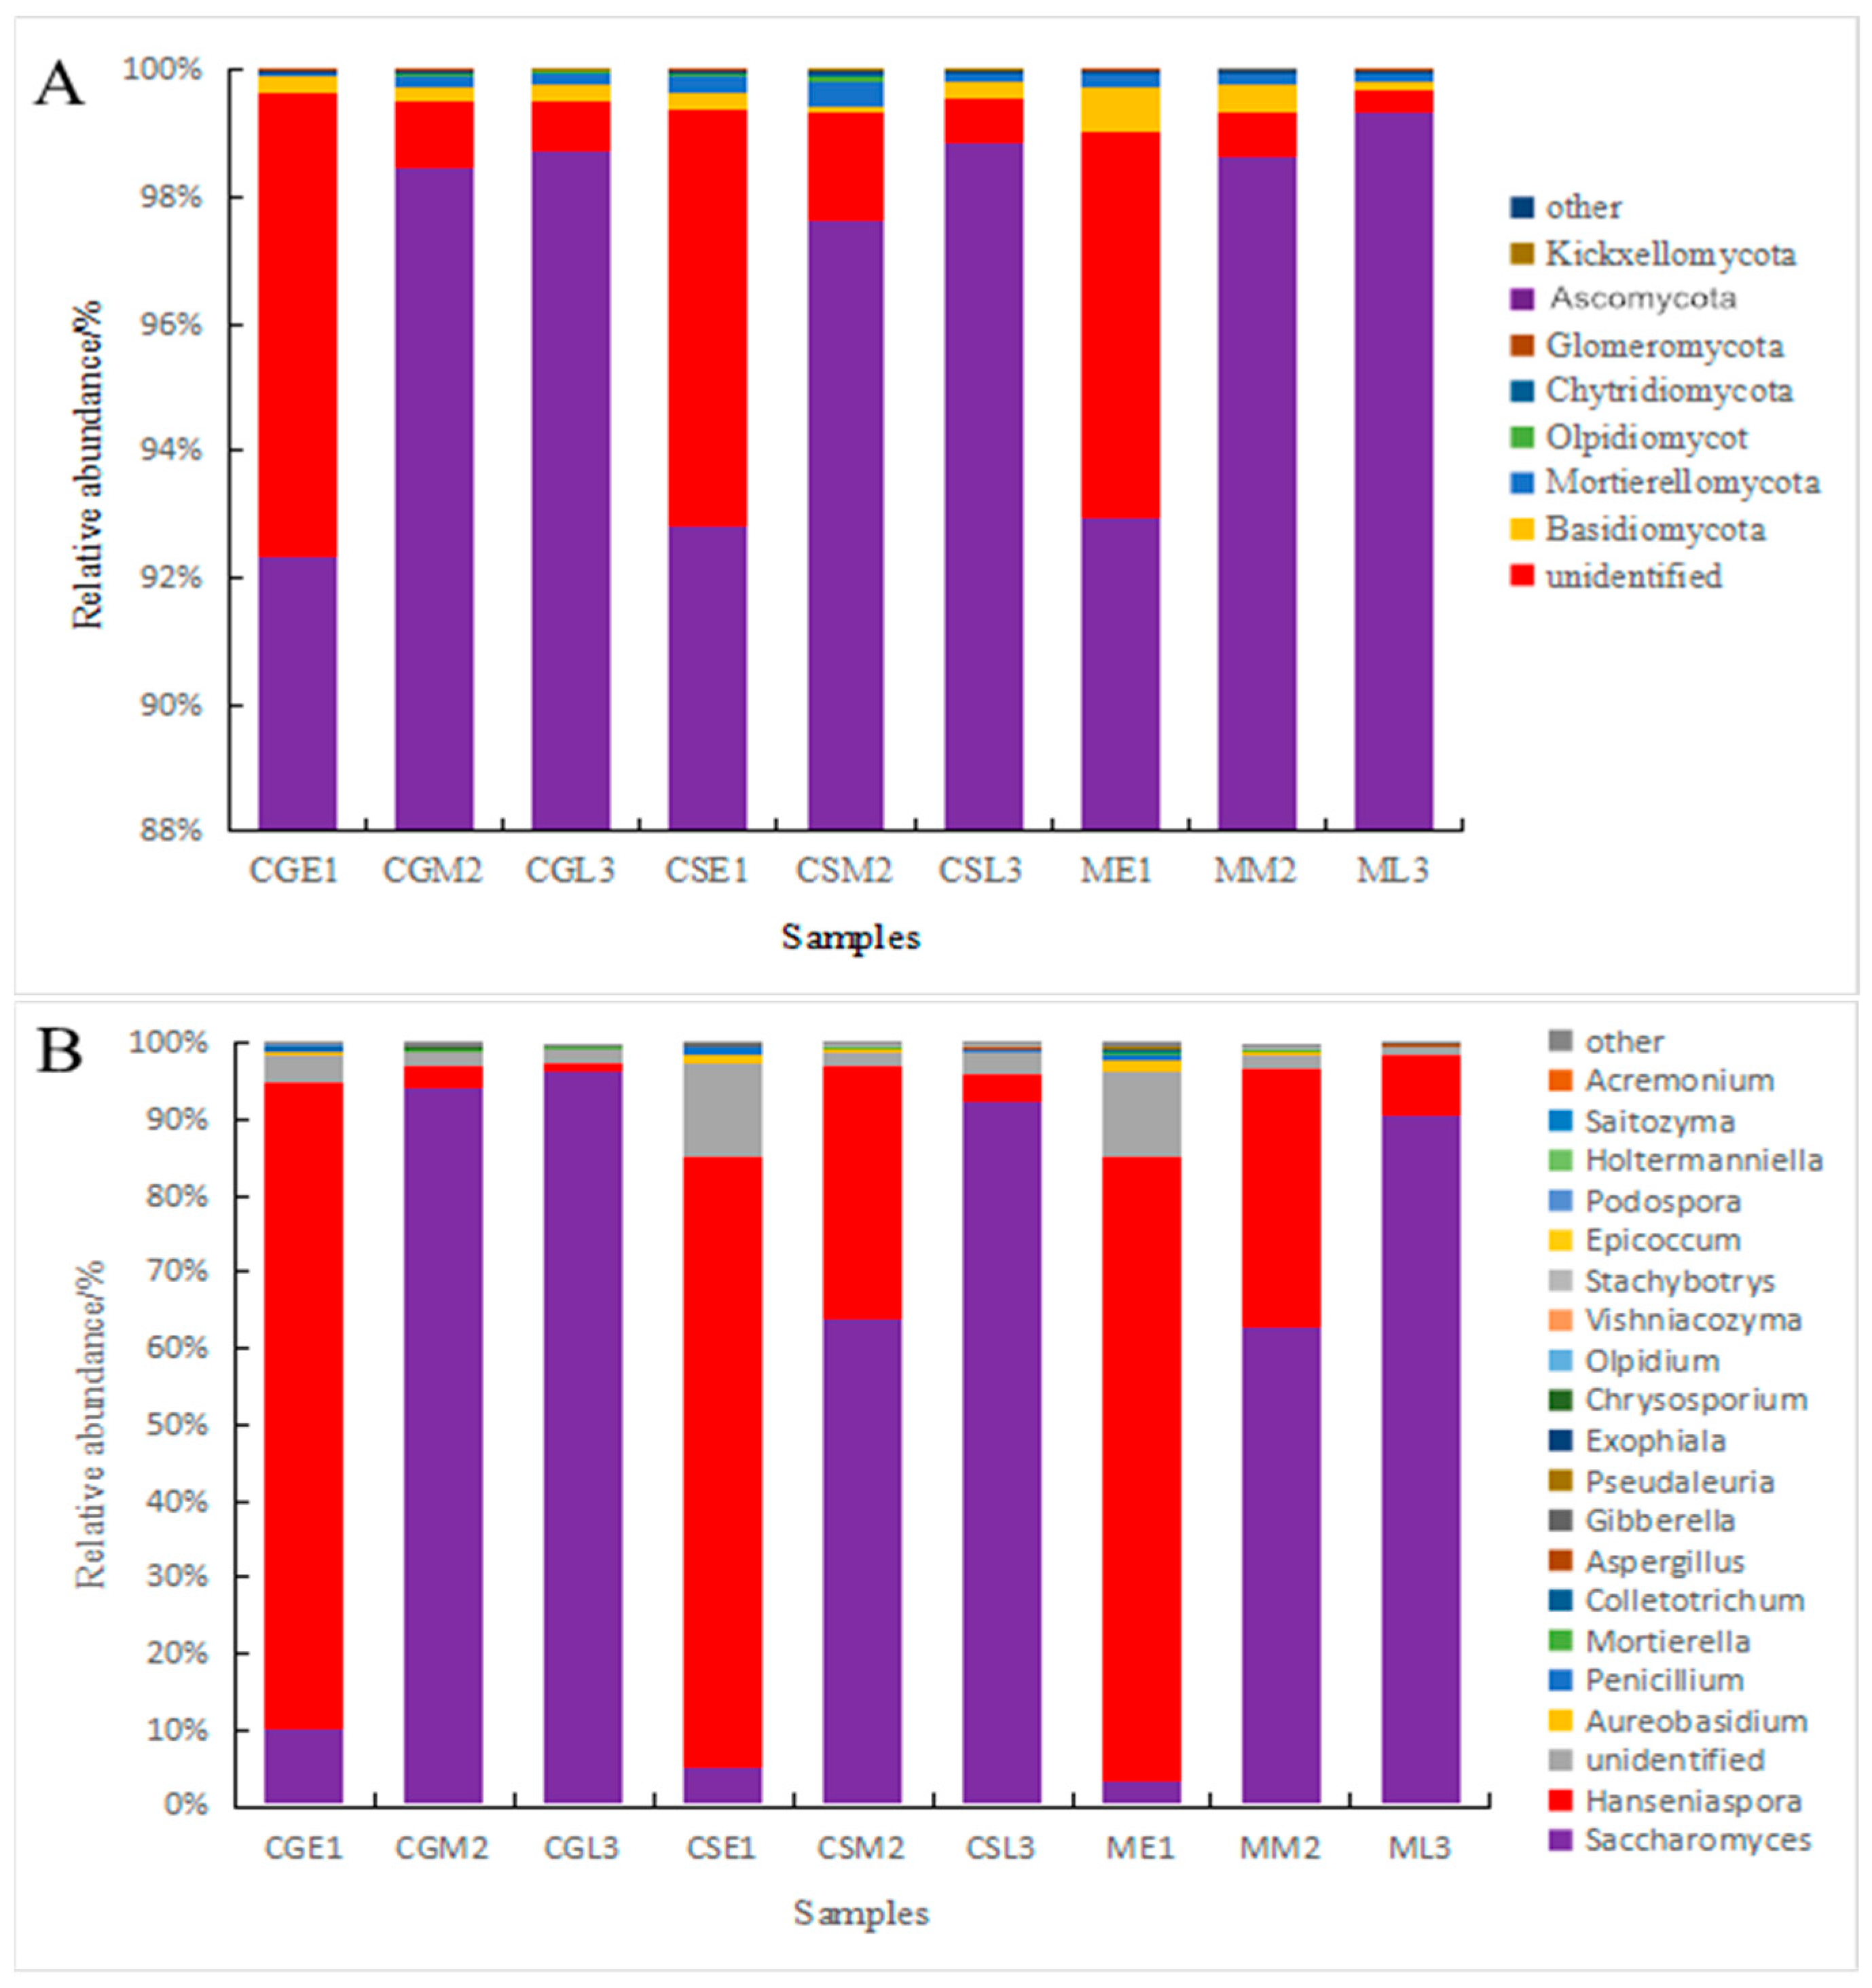
A comparison of fungal communities in pre-, mid-, and late fermentation fungal samples from different varieties of blueberries using visual bar graphs [19] revealed the presence of major phyla and genera in all samples, but with differences in abundance (Figure 6). From the figure, it can be seen that at the level of the fungus phylum, Ascomycetes are present throughout the fermentation process of blueberry wine, with the relative abundance pairs of Ascomycetes in the pre-fermentation fungal communities of Gardenblue, Powderblue, and Britewell being 92.35%, 93.67%, and 92.92%, respectively, and the percentages were still increasing as fermentation progressed. At the late fermentation stages of Gardenblue, Powderblue, and Britewell, the relative abundance pairs of Ascomycetes were 98.85%, 99.06%, and 99.36%, and the percentage of Ascomycetes in the blueberry wine samples of all three blueberry varieties showed an increasing trend as fermentation proceeded. The next most abundant was unidentified phylum, followed by the Basidiomycota. The relative abundance of the Basidiomycota in the fungal communities of Gardenblue, Powderblue, and Britewell at the pre-fermentation stage were 0.28%, 0.28%, and 0.69%, respectively, and these gradually decreased as fermentation proceeded, with the abundance at the late stage of fermentation being only 0.22%, 0.25%, and 0.11% in the fungal communities of Gardenblue, Powderblue, and Britewell, respectively.
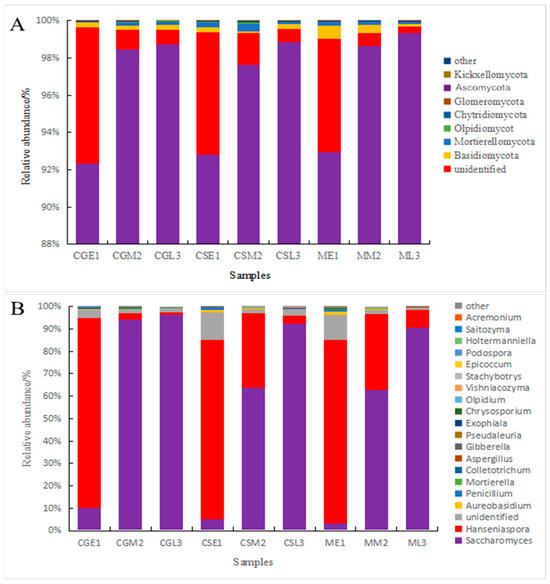
Figure 6.
Differences in fungal communities of different blueberry varieties before, during, and after fermentation at the level of phylum (A) and genus (B). CGE1 is the pre-fermentation Gardenblue blueberry wine sample, CGM2 is the mid-fermentation Gardenblue blueberry wine sample, CGL3 is the late fermentation Gardenblue blueberry wine sample, CSE1 is the pre-fermentation Powderblue blueberry wine sample, CSM2 is the mid-fermentation Powderblue blueberry wine sample, CSL3 is the late fermentation Powderblue blueberry wine sample, ME1 is the pre-fermentation Britewell blueberry wine sample, MM2 is the mid-fermentation Britewell blueberry wine sample, ML3 is the late fermentation Britewell blueberry wine sample.
At the genus level, the fungi in the pre- and mid-fermentation samples of Gardenblue, Powderblue, and Britewell were distributed in seven genera: Hanseniaspora, Saccharomyces, unidentified, Aureobasidium, Penicillium, Mortierella, and Colletotrichum. The relative abundance of Hanseniaspora was the highest in the pre-fermentation samples of Gardenblue, Powderblue, and Britewell, with 84.72%, 80.26%, and 81.50%, respectively, followed by Saccharomyces, with 10.23%, 4.97%, and 3.43%, respectively; the abundance of the remaining genera was very small. The relative abundance of Saccharomyces was the highest in the mid-fermentation Gardenblue, Powderblue, and Britewell samples, with 90.40%, 63.84%, and 62.92%, respectively, followed by Hanseniaspora, with 2.62%, 33.70%, and 33.87%, respectively, while the abundance of the remaining genera was very low. The relative abundance of the Saccharomyces was the highest in the late fermentation samples of Gardenblue, Powderblue, and Britewell, with 96.18%, 92.40%, and 90.62%, respectively, followed by Hanseniaspora, with 1.22%, 3.55%, and 7.87%, respectively, while the abundance of the remaining genera was minimal. From the relative abundance of Saccharomyces on the fourth day, it is clear that the fermentation rate of Gardenblue was faster than that of Powderblue and Britewell, and the Saccharomyces were dominant by the fourth day.
On the whole, the genus Saccharomyces began to exist at the beginning of fermentation, increased rapidly in number in the middle of fermentation, and became absolutely dominant in the middle and late stages of fermentation, while the genus Hanseniaspora was present in large numbers at the beginning of fermentation and was absolutely dominant, but its relative abundance decreased rapidly in the middle stage as fermentation progressed and was lower in the late stage. Thus, it can be seen that in the fermentation process of Majiang appellation Gardenblue, Powderblue, and Britewell blueberry wines that the Hanseniaspora genus was the first to develop in the early stage and gradually gave way to Saccharomyces in the middle and late stages.
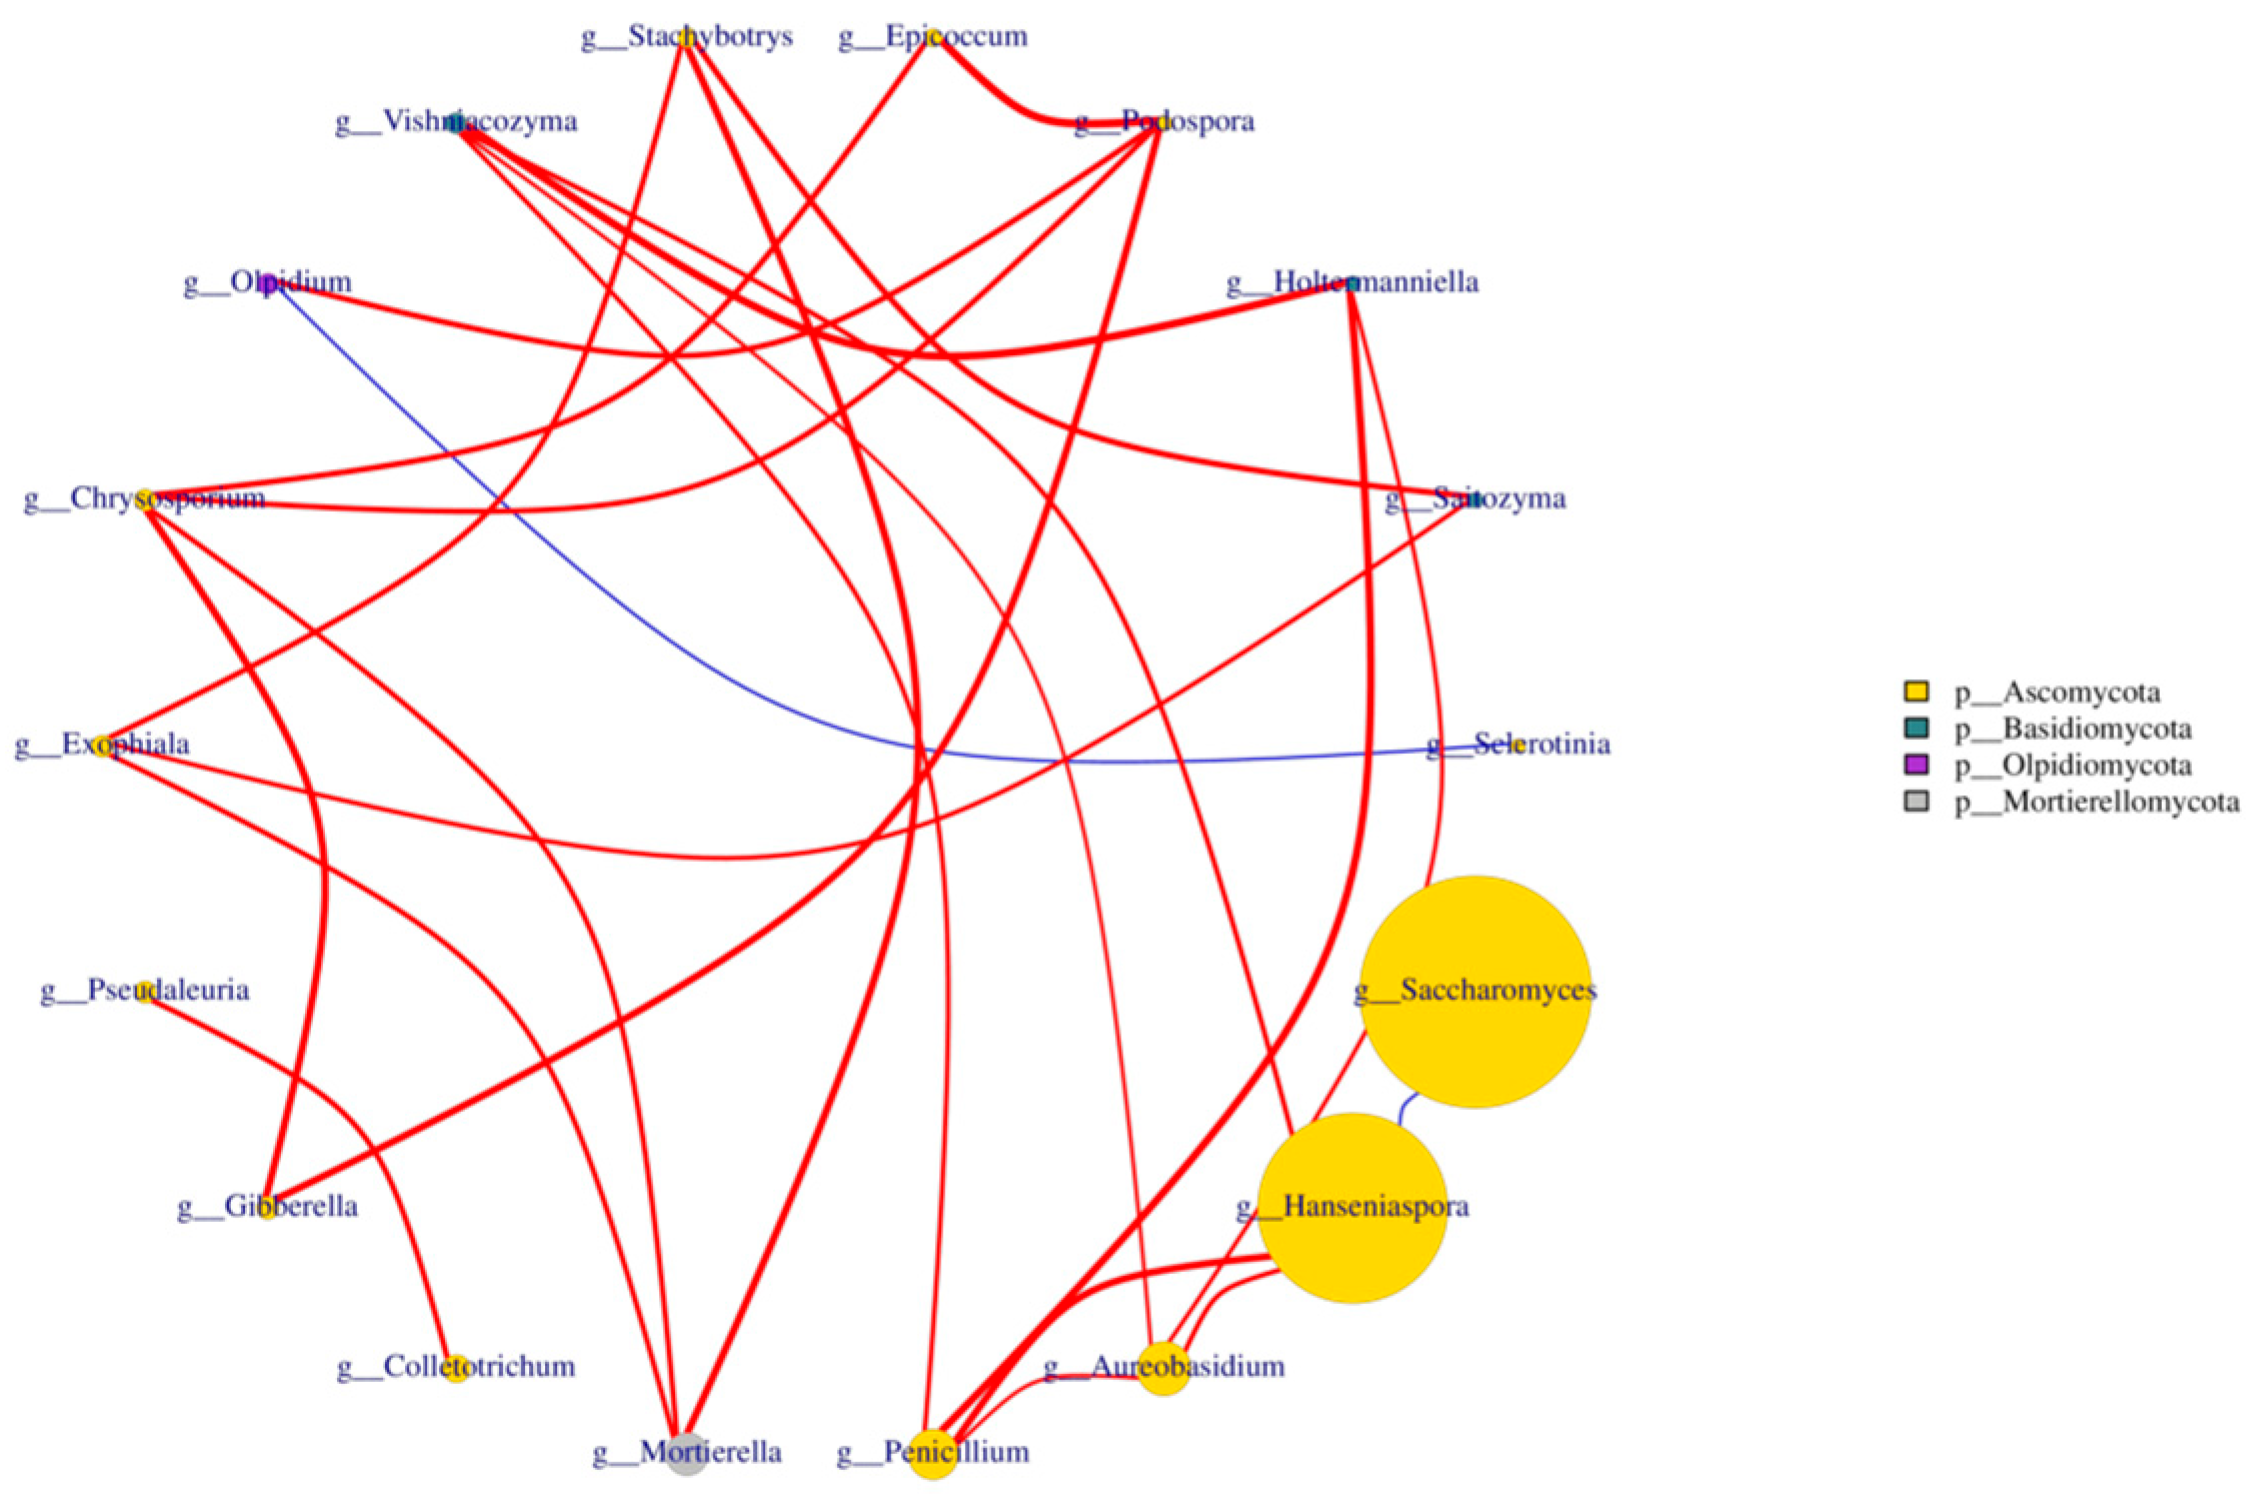
Nine samples from different fermentation periods of three varieties of blueberry wine were analyzed using the Spearman’s test, and the 20 fungal genera with the highest absolute abundance in the blueberry wine samples were extracted for correlation association analysis, while the analysis results were plotted against the fungal phylum as a legend. The data with p-value > 0.05 or correlation value |R|< 0.4 were plotted to obtain Figure 7. It can be seen from the figure that the association status between Hanseniaspora and Saccharomyces during the fermentation of blueberry wine was negatively correlated. The correlation between Aureobasidium and Hanseniaspora was positive during the fermentation of blueberry wine.
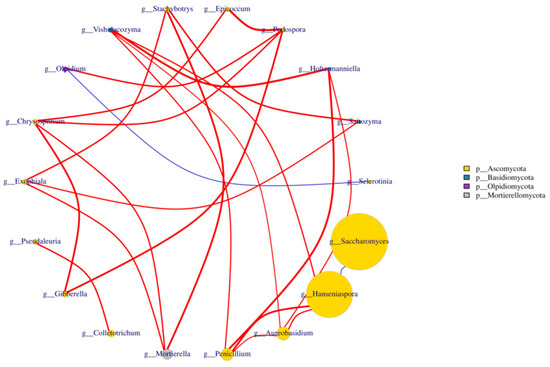
Figure 7.
Analysis of species assemblages at the fungal genus level in blueberry wine samples. The letters at different points in the graph represent the names of different genera, the size of the dots reflects the size of the abundance, the color indicates the dots indicate the gate they belong to, and the right column indicates the information in the graph which gate they belong to; The thickness of the red line in the figure indicates the size of the correlation, while the red line indicates the positive correlation between the samples, and the blue line indicates the negative correlation.
3.6. Dynamic Changes of Fungal Flora
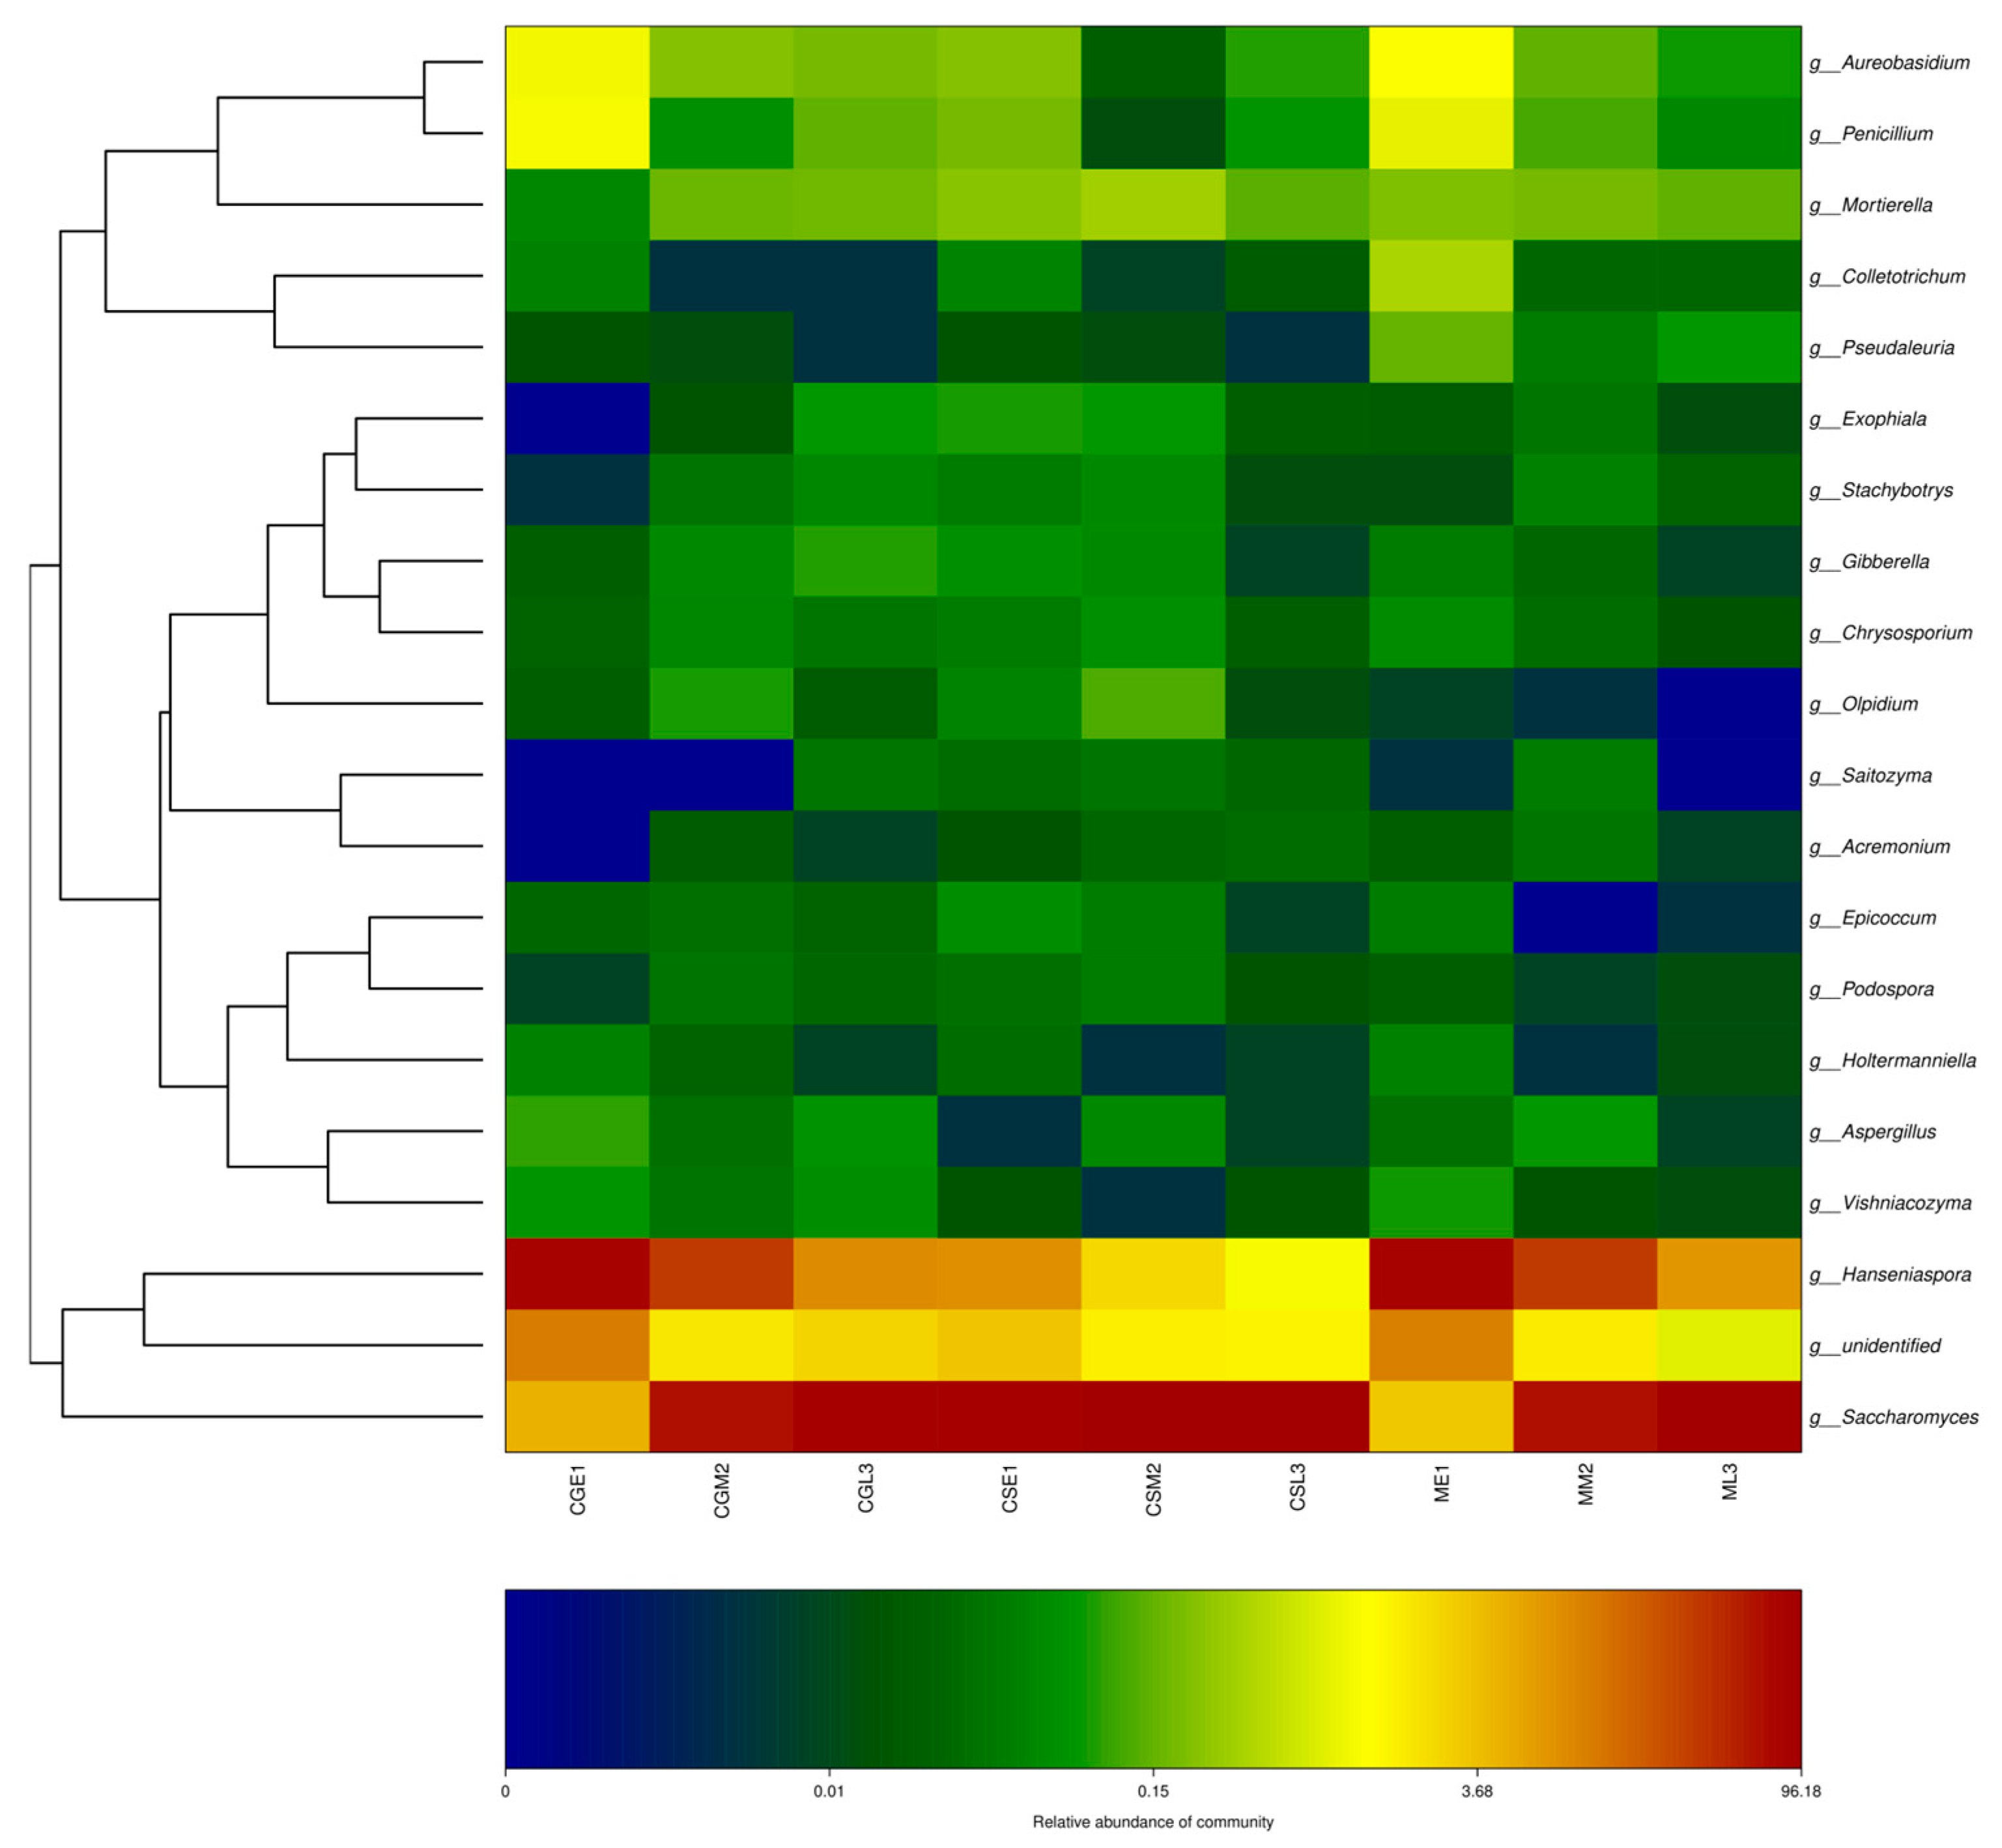
The top 20 genera in terms of relative abundance values were selected and clustered according to their abundance information in samples at different fermentation stages, and the fungal thermogram was used to visually analyze the distribution of fungal communities of the three blueberry varieties Gardenblue, Powderblue, and Britewell at different fermentation stages and different blueberry varieties at the same fermentation stage during the fermentation of blueberry wine. The relative abundance of Saccharomyces, Hanseniaspora, etc., and the dominant fungal community were present in all fermentation stages of the dry red blueberry wine, and its fungal flora showed similar trends in the samples, as can be seen in Figure 8. For example, regarding the abundance of Hanseniaspora, Aureobasidium, and Penicillium in the pre-fermentation samples, Gardenblue was similar to Britewell and higher than in the mid- and late fermentation samples.

Figure 8.
OTU and taxonomic level heatmap. CGE1 is the pre-fermentation Gardenblue blueberry wine sample, CGM2 is the mid-fermentation Gardenblue blueberry wine sample, CGL3 is the late fermentation Gardenblue blueberry wine sample, CSE1 is the pre-fermentation Powderblue blueberry wine sample, CSM2 is the mid-fermentation Powderblue blueberry wine sample, CSL3 is the late fermentation Powderblue blueberry wine sample, ME1 is the pre-fermentation Britewell blueberry wine sample, MM2 is the mid-fermentation Britewell blueberry wine sample, ML3 is the late fermentation Britewell blueberry wine sample. The left side of the graph shows the cluster analysis of the affiliation of the blueberry wine samples, and the bottom of the graph indicates the abundance of the species, with darker colors representing a higher abundance of the species and lighter colors representing a lower abundance of the species.
From Table 4, it can be seen that, of the three groups of bacteria involved in the fermentation process of blueberry wine such as H. uvarum, S. cerevisiae, A. pullulans, M. elongata, etc., Saccharomyces cerevisiae was the most commonly used organism species in fermentation and dominated in the pre-fermentation stage in this experiment. The main product of wild-type S. cerevisiae is ethanol, and traditional S. cerevisiae strains have good fermentation performance, are well tolerated under anaerobic conditions, and can ferment sugars to produce high ethanol yields and production rates [20]. S. cerevisiae has a short growth cycle and an efficient sugar conversion capacity; competes for limited nutrient capacity; is a dominant strain in fermentation; is rich in nutrients such as proteins, amino acids, vitamins, and bioactive substances; and promotes the production of volatile aroma components such as esters, alcohols, terpenoids, and volatile thiol substances using its metabolic activities [21,22]. S. cerevisiae has synergistic effects with other yeasts to improve wine quality and shape rich aromas together with other yeasts [23]. As can be seen from Table 4, the fungal community of blueberries in the process of fermentation into blueberry wine is constantly changing, with S.cerevisiae becoming the dominant flora, accounting for more than 90%.
Table 4.
Proportion distribution of representative strains in different samples.
CGE1 is the pre-fermentation Gardenblue blueberry wine sample, CGM2 is the mid-fermentation Gardenblue blueberry wine sample, CGL3 is the late fermentation Gardenblue blueberry wine sample, CSE1 is the pre-fermentation Powderblue blueberry wine sample, CSM2 is the mid-fermentation Powderblue blueberry wine sample, CSL3 is the late fermentation Powderblue blueberry wine sample, ME1 is the pre-fermentation Britewell blueberry wine sample, MM2 is the mid-fermentation Britewell blueberry wine sample, ML3 is the late fermentation Britewell blueberry wine sample. -indicates relative abundance below 0.0001% or not detected.
3.7. Analysis of Fungal OTUs of Different Blueberry Varieties before, during, and after Fermentation
The 32 shared OTUs were analyzed for abundance, resulting in the top 20 OTUs in terms of abundance, as shown in Table 5, namely: Saccharomyces cerevisiae, Hanseniaspora uvarum, Hanseniaspora osmophila, Hanseniaspora vineae, Pseudaleuria sp., Aureobasidium pullulans, Mortierella alpina, Mortierella elongata, Stachybotrys microspora, and Guehomyces pullulans.
Table 5.
Different samples share OTU.
Saccharomyces cerevisiae is a traditional ethanol-producing strain with good fermentation performance, good growth capacity under anaerobic conditions, the ability to ferment glucose to produce high ethanol yields and production rates, and high tolerance to ethanol and other inhibitors [24,25,26]. S. cerevisiae, as the dominant flora in middle and late fermentation, also promotes the production of volatile aroma substances such as alcohols, esters, terpenoids, and volatile thiols through its own metabolic activities and the release of non-aromatic precursors [27]. Hanseniaspora uvarum is the most abundant non-enological yeast commonly found in vineyards and winemaking environments [28]. The glycosidases secreted by H. uvarum mainly promote the hydrolysis of desmethyl isoprenoids and some terpene glycosides, and less so for C6 compound glycosides, thereby increasing the temperate fruit and floral characteristics of the wine [29]. Hanseniaspora osmophila and others can ferment higher levels of acetate compounds such as phenyl acetate and isopentyl acetate [30]. Zhang et al. [31] found that the mixed fermentation of Hanseniaspora vineae and Saccharomyces cerevisiae had a synergistic effect on the production of ethyl 2-phenylacetate. Ethyl 2-phenylacetate has a peachy aroma and is present in apples, grapes, poplar berries, tea, beer, whiskey, and brandy, and is a desired aroma compound in wine. In this experiment, Hanseniaspora had a high relative abundance (around 80%) in the pre-fermentation period; Saccharomyces dominated in the middle and late stages, with relative abundance up to 96%, and they acted synergistically to play an important role in improving blueberry wine quality and aroma shaping, etc.
Aureobasidium pullulans, a class of yeast-like fungi [32], is the predominant pectinolytic species (pectinolytic strain) in the grape skin flora and is present in dust and pre-fermentation. Although low-temperature maceration for wine production enhances the aroma of the wine, the color and phenolics of the wine are affected. Marin et al. [33] applied A. pullulans to cold maceration and low-temperature fermentation before fermentation and found a significant increase in total anthocyanin content, total polyphenol index, color intensity (CI), and a higher content of polymer pigments at 9 months of storage in the bottle. This indicates that A. pullulans affects the color and stability of the wine and plays an important role in the quality of the wine. In this experiment, the relative abundance of A. pullulans was detected at 1.11%, 0.24%, and 0.19% before and during the middle of the fermentation of Gardenblue, 0.25%, 0.01%, and 0.001% during the three fermentation periods of Powderblue, and 1.30%, 0.15%, and 0.07% during the three fermentation periods of Britewell, respectively. The relative abundance of A. pullulans decreased gradually during the fermentation of different blueberry wine varieties and was the lowest in the Powderblue samples.
Microbial cells usually contain only 2% to 3% of oil, but under specific culture conditions, certain microbial dry bodies can contain up to 80–90% oil [34]. Some molds have a strong lipid production capacity, and the lipids produced also contain varying degrees of γ-linoleic acid (GLA), arachidonic acid, and other beneficial components for humans, so scholars at home and abroad have conducted in-depth studies on them. Mortierella alpina has a strong lipid synthesis capacity, and its lipid accumulation can reach more than 50% of its dry weight, where the production of arachidonic acid can exceed 40% of the total fatty acid content [35], which has been applied to commercial production and has good application value and development prospects. Strains such as Mortierella elongata and Mortierella alpina contain γ-linoleic acid (GLA), and the process of GLA production by Peridiomycetes is mature and can produce several hundred tons per year [36]. It was found that M. elongata, M. alpina, and other mycobacteria also contain EPA and DHA [37]. Although these two species were detected in this experiment, their relative abundance was small. Among the three species, M. alpina was the most abundant in Britewell, with abundances of 0.01%, 0.04%, and 0.02% before, during, and after fermentation, respectively. The abundance of M. elongata in Gardenblue was 0.03%, 0.09%, and 0.07% before, during, and after fermentation, respectively; the relative abundance in Powderblue was 0.10%, 0.14%, and 0.03% during the three fermentation periods, respectively; and the relative abundance was 0.17%, 0.04%, and 0.09% during the three fermentation periods for Britewell, respectively. The relative abundance of M. elongata was greatest during the pre-fermentation period of Britewell and decreased significantly in the middle and late stages, while it increased in the middle of the mash of Powderblue blueberries, and the specific factors influencing this need to be studied in depth. It is worth acknowledging that both types of bacteria have a role in enhancing the nutritional value of blueberry wine.
Stachybotrys microspora is a filamentous fungus with cellulolytic activity. The basic process of cellulose hydrolysis is the production of cellobiose and some cellooligosaccharides by the synergistic action of endoglucanase and exoglucanase, which in turn are hydrolyzed by β-glucosidase to produce glucose [38]. By studying the wild-type strain N1 of S. microspora and its mutant A19, Abdeljalil et al. [39] found that Stachybotrys produced much higher yields of glucanase, β-glucanase, and protease than the current commercial lyase “zymolyase”, in addition to endoglucanase and exoglucanase. In this experiment, the abundance of S. microspora was small, accounting for 0.0027%, 0.027%, and 0.045% in the three stages of fermentation for Gardenblue, 0.03%, 0.05%, and 0.0053% in the three stages of fermentation for Powderblue, and 0.0053%, 0.04%, and 0.01% in the three stages of fermentation for Britewell. As a whole, the abundance of this bacterium increased in the middle of fermentation. As known from previous studies, this bacterium has some roles in blueberry wine, such as the initiation of hydrolysis of cellulose to produce glucose and the promotion of blueberry juice maceration to stabilize the color.
Guehomyces pullulans was found to produce pectinase even at low temperatures (8 °C) [40]. Pectinase has a very important role in juice yield, clarification, and promotion of nutrient leaching in grape juice [41,42,43]. Zhang et al. [44] found G. pullulans to be the dominant bacterium in traditional Korean rice wine distillers. This bacterium was also detected in nine samples of this experiment, but the relative abundance was low and the relative abundance did not change significantly at different fermentation stages, accounting for only about 0.01%.
3.8. Beta Diversity Analysis of Fungal Flora during Blueberry Wine Fermentation
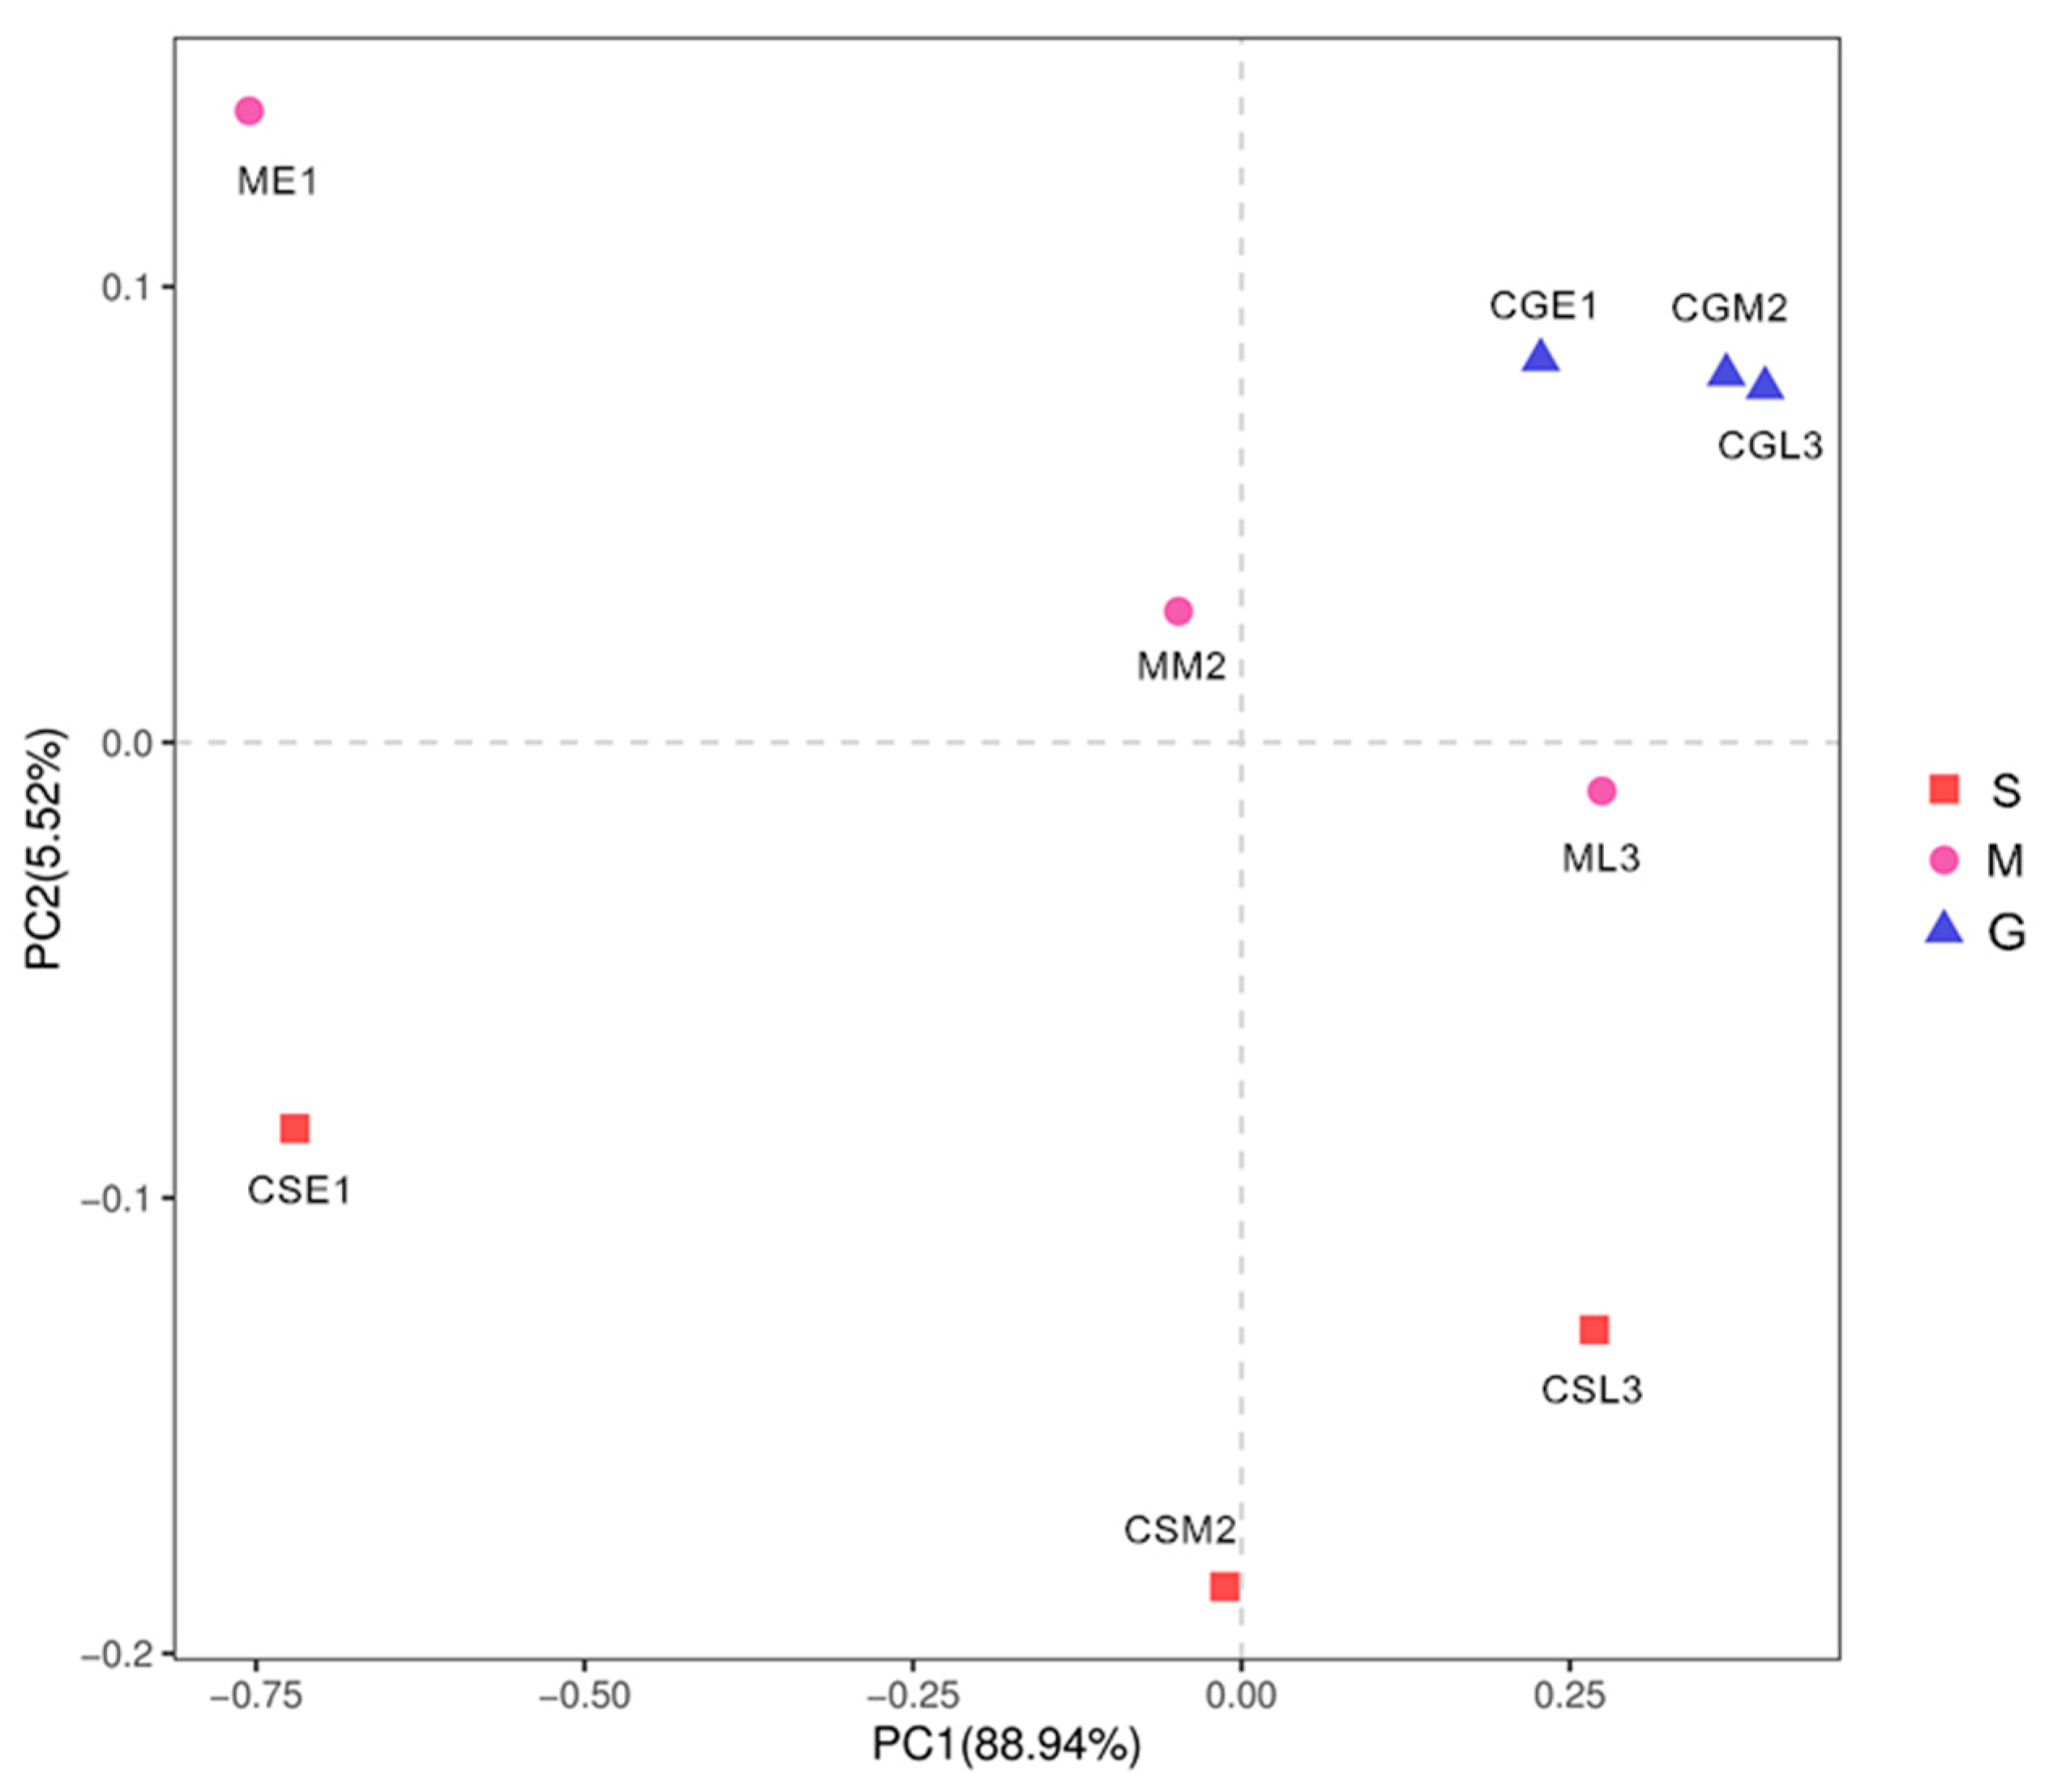
As shown in Figure 9, PC1 and PC2 explained 88.94% and 5.52% of the information about the fungal communities of the samples of different species before and during the middle of the fermentation period, respectively, and the sum of both was greater than 80%, and the results were reliable. There were some distances between the nine samples, indicating that the fungal communities of the nine samples had some differences; in comparison, the three samples of Gardenblue were closer and the differences were not significant, indicating that the fungal communities of Gardenblue samples in different fermentation periods were highly similar; the distance between Powderblue samples in different fermentation periods was larger and the differences were significant, indicating that the distance between Gardenblue samples of different fermentation periods was large and the difference was significant, indicating that the fungal communities of Gardenblue samples of different fermentation periods were very different from those of Powderblue samples of pre-, middle, and late fermentation. Overall, the similarity of fungal communities between Gardenblue samples in different fermentation periods was high, and the difference of fungal communities between Powderblue and Britewell samples was high.
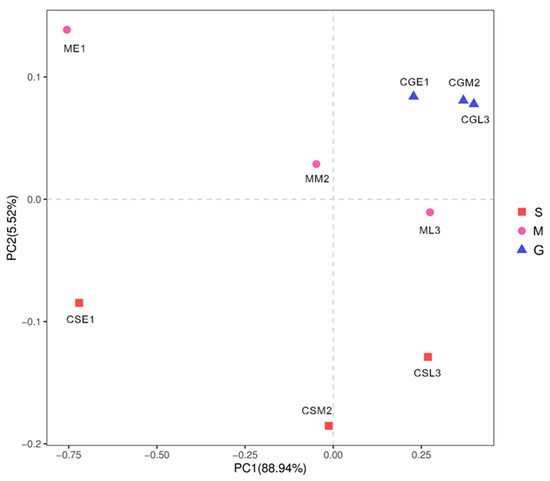
Figure 9.
Principal component analysis diagram of fungal communities in different samples. Discriminant analysis of partial least squares based on OUT. S is Powderblue blueberry wine sample, M is Britewell blueberry wine sample, G is Gardenblue blueberry wine sample. CGE1 is the pre-fermentation Gardenblue blueberry wine sample, CGM2 is the mid-fermentation Gardenblue blueberry wine sample, CGL3 is the late fermentation Gardenblue blueberry wine sample, CSE1 is the pre-fermentation Powderblue blueberry wine sample, CSM2 is the mid-fermentation Powderblue blueberry wine sample, CSL3 is the late fermentation Powderblue blueberry wine sample, ME1 is the pre-fermentation Britewell blueberry wine sample, MM2 is the mid-fermentation Britewell blueberry wine sample, ML3 is the late fermentation Britewell blueberry wine sample.
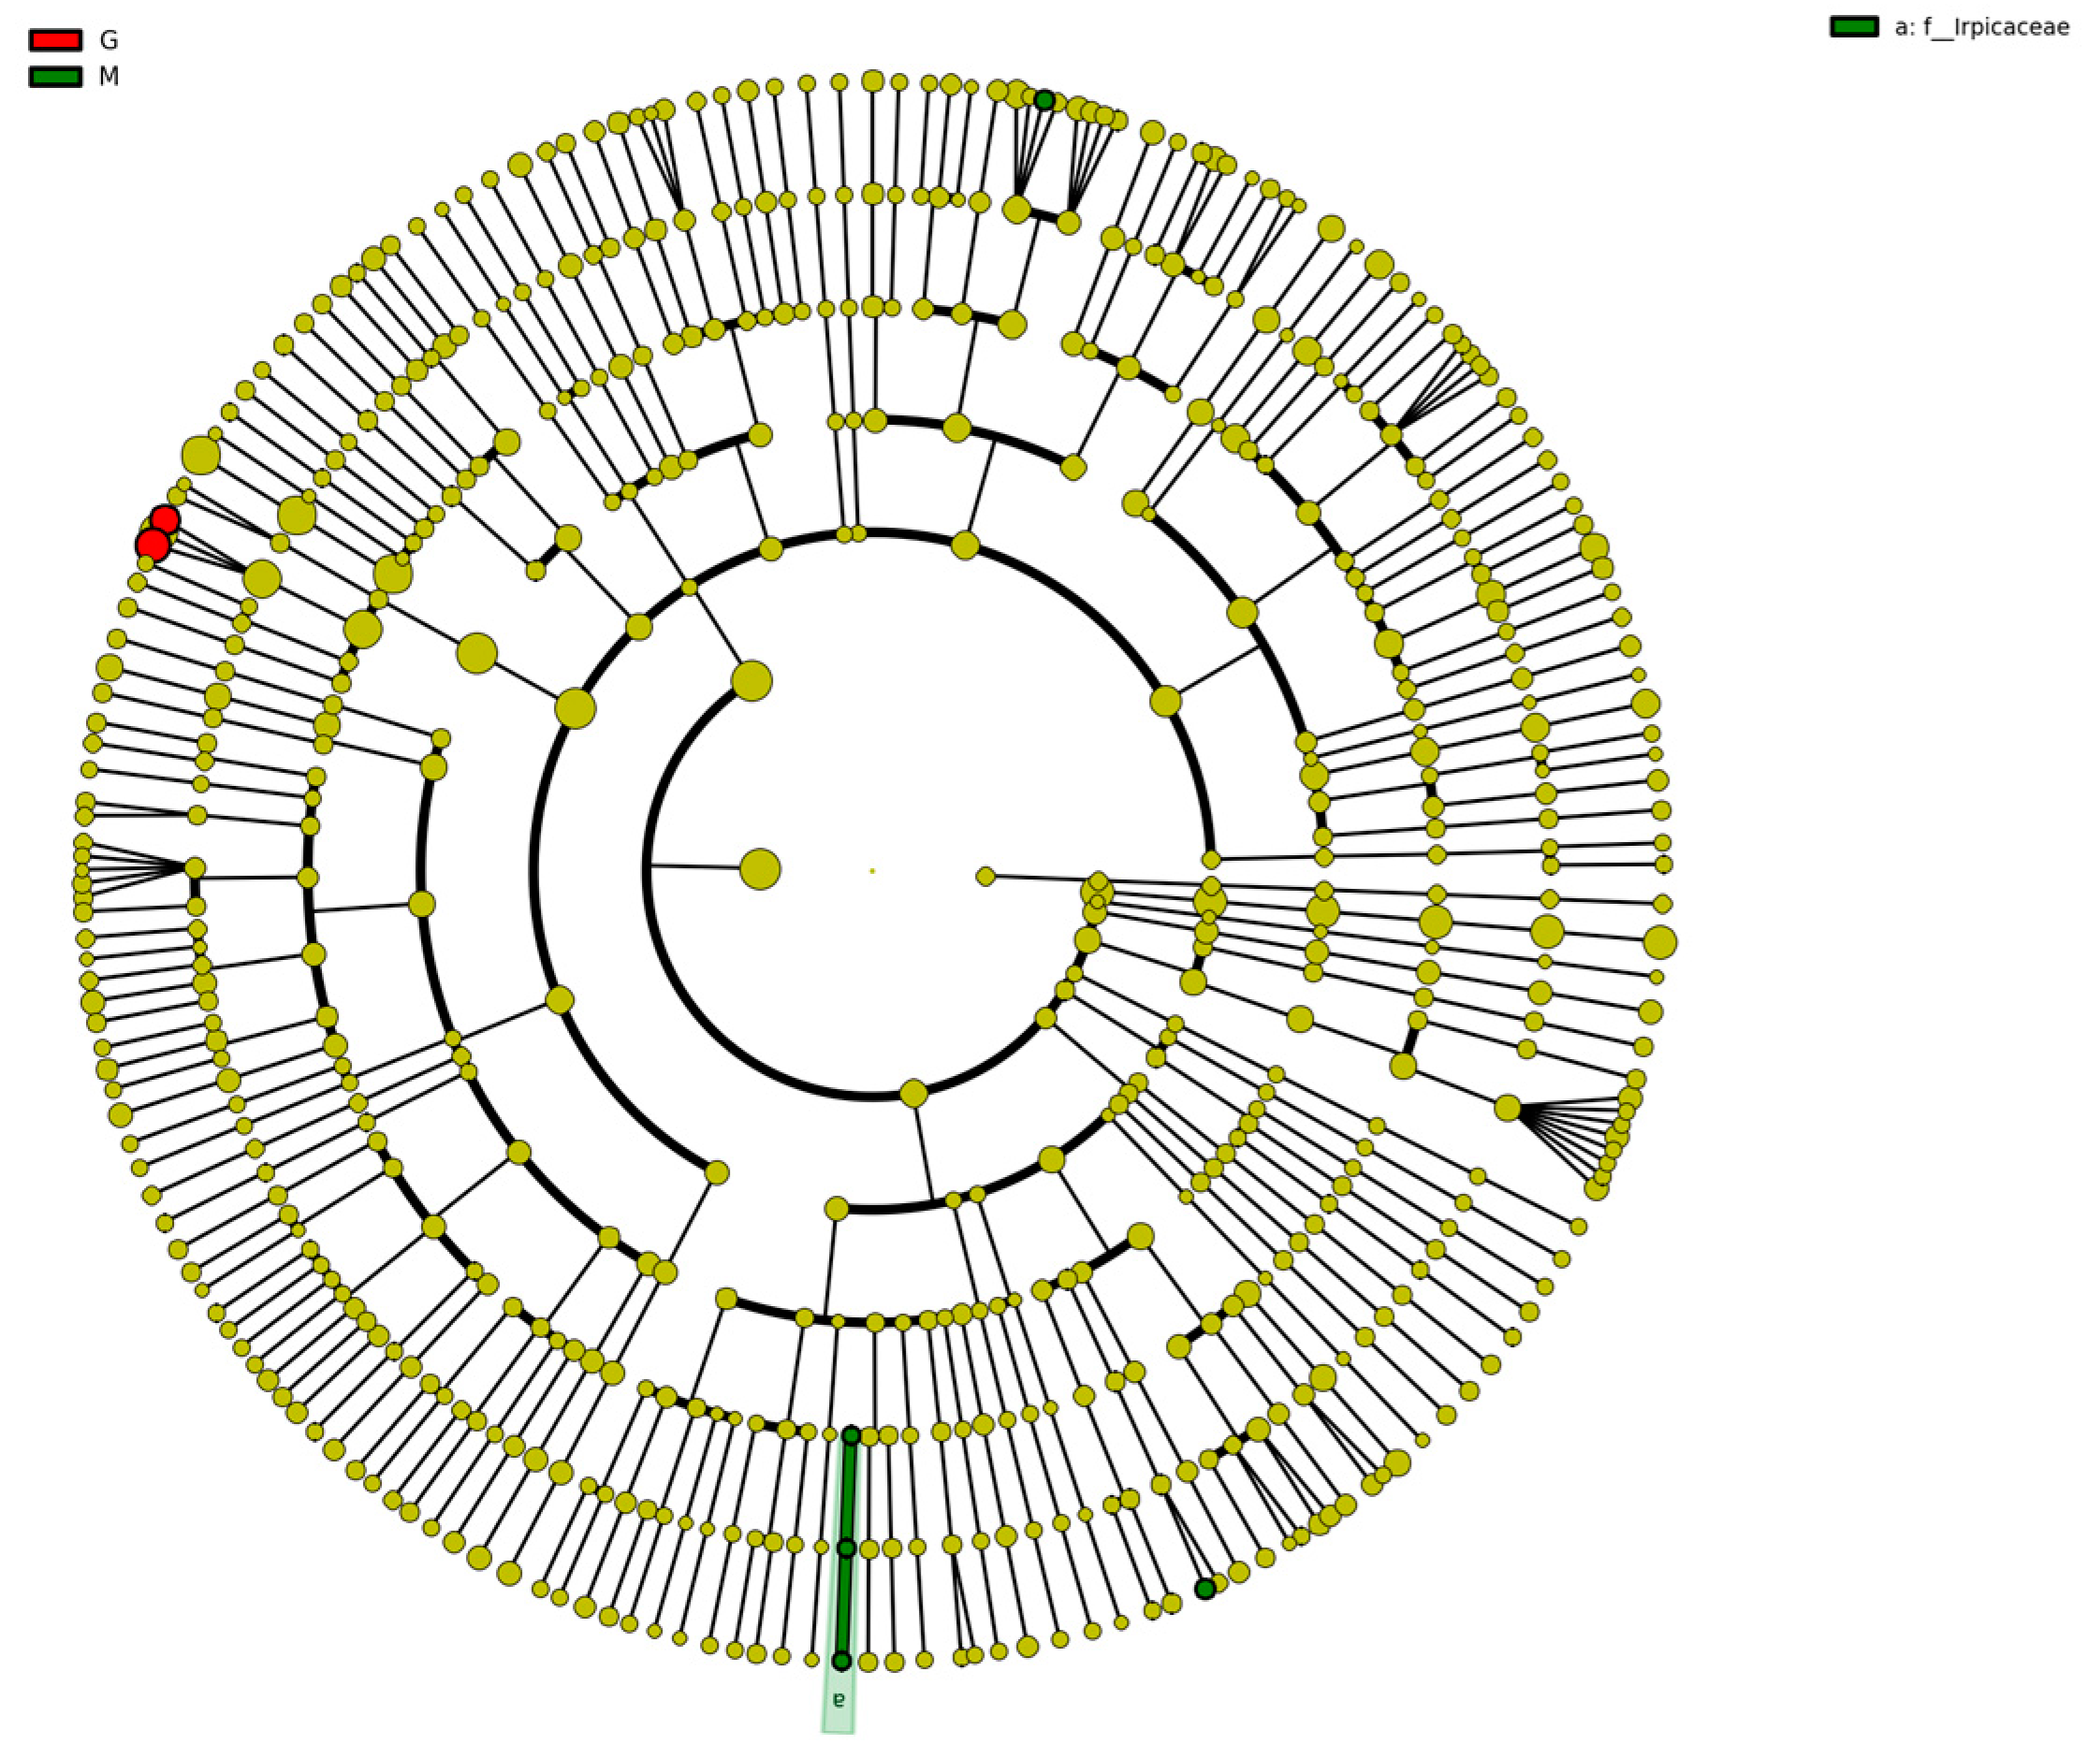
The species clustering tree diagram of the different sample fungal communities is represented by the taxonomic levels from phylum to genus by circles radiating from the inside to the outside. The circles in Figure 10 represent a classification at different levels, and the circle size increases as the relative abundance of species under that classification increases. The circle colors represent the differences between species at different levels; yellow are species with no significant differences, red indicates a class of microbial taxa that can be clearly distinguished in their group, green indicates microbial taxa that can play an important role in the corresponding group, and the other circle colors have the same meaning [45]. As shown in Figure 10, the color of the fungal community species clustering tree of different samples was mostly yellow, indicating that the fungal species in the fermentation process of Gardenblue, Powderblue, and Britewell were mostly the same. However, there were two fungal communities present in Gardenblue which differed from those in Powderblue and Britewell. The results of biomarker follow-group coloring showed that the main fermentation process was stable in Gardenblue, Powderblue, and Britewell samples, and no other different species dominated or disrupted the fermentation process with yeast as the dominant species.
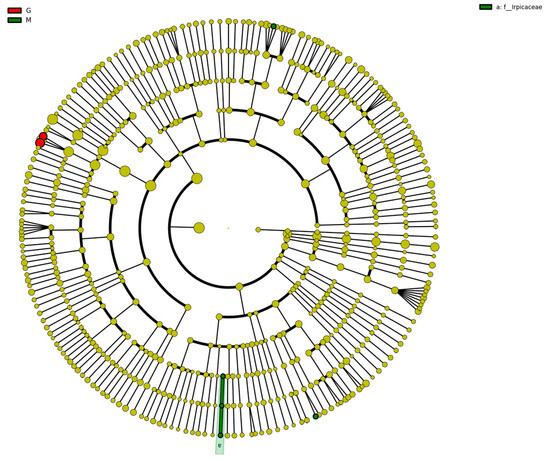
Figure 10.
Clustering tree diagram of fungal community species in different samples. CGE1 is the pre-fermentation Gardenblue blueberry wine sample, CGM2 is the mid-fermentation Gardenblue blueberry wine sample, CGL3 is the late fermentation Gardenblue blueberry wine sample, CSE1 is the pre-fermentation Powderblue blueberry wine sample, CSM2 is the mid-fermentation Powderblue blueberry wine sample, CSL3 is the late fermentation Powderblue blueberry wine sample, ME1 is the pre-fermentation Britewell blueberry wine sample, MM2 is the mid-fermentation Britewell blueberry wine sample, ML3 is the late fermentation Britewell blueberry wine sample.
4. Conclusions
The fungal community structure of the fermentation process of three blueberry varieties in the Majiang appellation was studied by high-throughput sequencing technology, which revealed that Hanseniaspora was the dominant group in the pre-fermentation mash and Saccharomyces was predominant in the middle and late stages of fermentation. Saccharomyces cerevisiae, Hanseniaspora uvarum, Hanseniaspora osmophila, Hanseniaspora vineae, Pseudaleuria sp., Aureobasidium pullulans. Mortierella alpina, Mortierella elongata, Stachybotrys microspora, and Guehomyces pullulans, a relative of Hanseniaspora and Saccharomyces, were studied, and the relative abundance of several other bacteria was small, accounting for only about 0.001% to 1.300%, respectively. The fungal composition of different fermentation stages of the same species differed significantly, except for that in the Gardenblue samples.
Among the three blueberry wines fermented under this colony structure, Powderblue was better than Gardenblue and Britewell in terms of overall sensory quality, especially in terms of persistence and fullness on the palate, good structure and complexity, and strong tannin, which is related to its own varietal characteristics, but also to the richness of the fungal community during fermentation and the significant differences in the community composition at different stages of fermentation. The Gardenblue dry red blueberry wine has good fullness and a pleasant fruit aroma, which is significant during the fermentation process, but it is a little bit bland in terms of taste; whether this is related to the small difference in fungal composition in different fermentation stages needs to be further verified. In addition to the high sugar content of the fruits, Saccharomyces cerevisiae, which was dominant in the middle and late samples, also played an important role. In conclusion, the results of this experiment can provide a theoretical basis for future research on community structure and its influence on blueberry wine style shaping in Majiang region, Guizhou.
Author Contributions
Conceptualization, J.S. and B.H.; methodology, J.S.; software, J.S.; validation, J.S. and M.Z.; formal analysis, S.X.; investigation, J.S.; resources, M.Z.; data curation, S.X.; writing—original draft preparation, J.S.; writing—review and editing, S.X. and B.H.; visualization, J.S.; supervision, M.Z.; project administration, B.H.; funding acquisition, B.H. All authors have read and agreed to the published version of the manuscript.
Funding
This research was funded by National Natural Science Foundation of China (Project No. 31271857).
Institutional Review Board Statement
Not applicable.
Informed Consent Statement
Not applicable.
Data Availability Statement
The data sets generated or analyzed during the current study are available with the corresponding author on reasonable request.
Acknowledgments
We acknowledge financial support by the National Natural Science Foundation of China (Project No. 31271857). The authors would like to acknowledge the work of Jingxi Wenin in Validation, Writing—original draft.
Conflicts of Interest
The authors declare no conflict of interest.
References
- Eldarov, M.A.; Kishkovskaia, S.A.; Tanaschuk, T.N.; Mardanov, A.V. Genomics and biochemistry of Saccharomyces cerevisiae wine yeast strains. Biochemistry 2016, 81, 1650–1668. [Google Scholar] [CrossRef]
- Caridi, A.; Sidari, R.; Pulvirenti, A.; Blaiotta, G. Genetic Improvement of wine yeasts for opposite adsorption activity of phenolics and ochratoxin A during red winemaking. Food Biotechnol. 2020, 34, 352–370. [Google Scholar] [CrossRef]
- Atanacković, M.; Petrović, A.; Jović, S.; Gojković-Bukarica, L.; Bursać, M.; Cvejić, J. Influence of winemaking techniques on the resveratrol content, total phenolic content and antioxidant potential of red wines. Food Chem. 2012, 131, 513–518. [Google Scholar] [CrossRef]
- Bagheri, B.; Bauer, F.F.; Setati, M.E. The impact of Saccharomyces cerevisiae on a wine yeast consortium in natural and inoculated fermentations. Front. Microbiol. 2017, 8, 1988. [Google Scholar] [CrossRef] [PubMed]
- Reuter, J.; Spacek, D.V.; Snyder, M. High-Throughput Sequencing Technologies. Mol. Cell 2015, 58, 586–597. [Google Scholar] [CrossRef]
- Xu, H. Research on planning and designing of special blueberry industry sightseeing park in Majiang County, Guizhou. China Agric. Resour. Zoning 2016, 37, 204–207+211. [Google Scholar]
- Li, C.; Li, Q.; Liu, L.; Wang, H.; Wen, X. Geochemical characterization of rare earth elements in the rock-soil-plant system of the core blueberry production area in Guizhou. Chin. J. Rare Earths 2021, 39, 653–662. [Google Scholar]
- Zhang, Y.; Liu, F.; Wang, B.; Wu, H.; Wu, J.; Liu, J.; Sun, Y.; Cheng, C.; Qiu, D. Identification, characterization and expression analysis of anthocyanin biosynthesis-related bHLH genes in blueberry (Vaccinium corymbosum L.). Int. J. Mol. Sci. 2021, 22, 13274. [Google Scholar] [CrossRef] [PubMed]
- Hu, B.; Gao, J.; Xu, S.; Zhu, J.; Fan, X.; Zhou, X. Quality evaluation of different varieties of dry red wine based on nuclear magnetic resonance metabolomics. Appl. Biol. Chem. 2020, 63, 24. [Google Scholar] [CrossRef]
- Hu, B.; Zhou, M.; Su, J.; Lin, L.; Xu, S. Study of Fungal Communities in Dry Red Wine Fermentation in Linfen Appellation, Shanxi. Fermentation 2022, 8, 475. [Google Scholar] [CrossRef]
- Walch, G.; Knapp, M.; Rainer, G.; Peintner, U. Colony-PCR Is a Rapid Method for DNA Amplification of Hyphomycetes. J. Fungi 2016, 2, 12. [Google Scholar] [CrossRef] [PubMed]
- Ghosh, S.; Namin, S.M.; Jung, C. Differential Bacterial Community of Bee Bread and Bee Pollen Revealed by 16s rRNA High-Throughput Sequencing. Insects 2022, 13, 863. [Google Scholar] [CrossRef] [PubMed]
- Wei, Y.; Li, Y.; Wang, Y.; Luo, X.; Du, F.; Liu, W.; Xie, L.; Chen, J.; Ren, Z.; Hou, S.; et al. The microbial diversity in industrial effluents makes high-throughput sequencing-based source tracking of the effluents possible. Environ. Res. 2022, 212, 113640. [Google Scholar] [CrossRef]
- Amato, K.R.; Yeoman, C.J.; Kent, A.; Righini, N.; Carbonero, F.; Estrada, A.; Gaskins, H.R.; Stumpf, R.M.; Yildirim, S.; Torralba, M.; et al. Habitat degradation impacts black howler monkey (Alouatta pigra) gastrointestinal microbiomes. ISME J. 2013, 7, 1344–1353. [Google Scholar] [CrossRef] [PubMed]
- Gail, M.H.; Wan, Y.; Shi, J. Power of microbiome beta-diversity analyses based on standard reference samples. Am. J. Epidemiol. 2021, 190, 439–447. [Google Scholar] [CrossRef]
- Martínez-Salgado, S.J.; Romero-Arenas, O.; Morales-Mora, L.A.; Luna-Cruz, A.; Rivera-Tapia, J.A.; Silva-Rojas, H.V.; Andrade-Hoyos, P. First Report of Macrophomina phaseolina Causing Charcoal Rot of Peanut (Arachis hypogaea) in Mexico. Plant Dis. 2021, 105, 2722. [Google Scholar] [CrossRef]
- Zhao, Y.; Sun, Y.; Chen, W.; Zhao, Y.; Liu, X.; Bai, Y. The Potential of Mapping Grassland Plant Diversity with the Links among Spectral Diversity, Functional Trait Diversity, and Species Diversity. Remote Sens. 2021, 13, 3034. [Google Scholar] [CrossRef]
- Kelley, K.; Bilson Darku, F.; Chattopadhyay, B. Sequential accuracy in parameter estimation for population correlation coefficients. Psychol. Methods 2019, 24, 492–515. [Google Scholar] [CrossRef]
- Oberauner, L.; Zachow, C.; Lackner, S.; Högenauer, C.; Smolle, K.-H.; Berg, G. The ignored diversity: Complex bacterial communities in intensive care units revealed by 16S pyrosequencing. Sci. Rep. 2013, 3, 1413. [Google Scholar] [CrossRef]
- Ameni, G.; Messele Kebede, A.; Zewude, A.; Girma Abdulla, M.; Asfaw, R.; Gobena, M.M.; Kyalo, M.; Stomeo, F.; Gumi, B.; Sori, T. Equine Histoplasmosis in Ethiopia: Phylogenetic analysis by sequencing of the internal transcribed spacer region of rRNA genes. Front. Cell. Infect. Microbiol. 2022, 12, 789157. [Google Scholar] [CrossRef]
- Vidyasagar, C.; Santhosh Kumar, P.; Vijayakumar, P.; Alekya, S.; Umamahesh, K.; Sarathi Reddy, O.V. Comparative structural and functional analysis of the PGU1 protein from Saccharomyces bayanus with other Saccharomyces species. Bioinformation 2022, 18, 464–469. [Google Scholar] [CrossRef] [PubMed]
- Salvador Lopez, J.M.; Jezierska, S.; Ekim Kocabey, A.; Lee, J.; Schneiter, R.; Van Bogaert, I.N. The oleaginous yeast Starmerella bombicola reveals limitations of Saccharomyces cerevisiae as a model for fatty acid transport studies. FEMS Yeast Res. 2022, 22, foac054. [Google Scholar] [CrossRef] [PubMed]
- Santiago-Urbina, J.A.; Arias-García, J.A.; Ruiz-Terán, F. Yeast species associated with spontaneous fermentation of taberna, a traditional palm wine from the southeast of Mexico. Ann. Microbiol. 2015, 65, 287–296. [Google Scholar] [CrossRef]
- Hu, B.; Cao, Y.; Zhu, J.; Xu, W.; Wu, W. Analysis of metabolites in chardonnay dry white wine with various inactive yeasts by 1H NMR spectroscopy combined with pattern recognition analysis. AMB Express 2019, 9, 140. [Google Scholar] [CrossRef]
- Oh, E.J.; Jin, Y.-S. Engineering of Saccharomyces cerevisiae for efficient fermentation of cellulose. FEMS Yeast Res. 2020, 20, foz089. [Google Scholar] [CrossRef]
- Xu, S.; Zhu, J.; Zhao, Q.; Gao, J.; Zhang, H.; Hu, B. Quality evaluation of Cabernet Sauvignon wines in different vintages by 1H nuclear magnetic resonance-based metabolomics. Open Chem. 2021, 19, 385–399. [Google Scholar] [CrossRef]
- van Wyk, N.; Grossmann, M.; Wendland, J.; von Wallbrunn, C.; Pretorius, I.S. The Whiff of Wine Yeast Innovation: Strategies for Enhancing Aroma Production by Yeast during Wine Fermentation. J. Agric. Food Chem. 2019, 67, 13496–13505. [Google Scholar] [CrossRef]
- Quintero-Blanco, J.; Delodi, E.; Garzón, A.; Jimenez, J. Sexually-Driven Combinatorial Diversity in Native Saccharomyces Wine Yeasts. Fermentation 2022, 8, 569. [Google Scholar] [CrossRef]
- Wang, Z.; Chen, K.; Liu, C.; Ma, L.; Li, J. Effects of glycosidase on glycoside-bound aroma compounds in grape and cherry juice. J. Food Sci. Technol. 2023, 60, 761–771. [Google Scholar] [CrossRef]
- Viana, F.; Gil, J.V.; Vallés, S.; Manzanares, P. Increasing the levels of 2-phenylethyl acetate in wine through the use of a mixed culture of Hanseniaspora osmophila and Saccharomyces cerevisiae. Int. J. Food Microbiol. 2009, 135, 68–74. [Google Scholar] [CrossRef]
- Bza, B.; Dxa, B.; Cda, B.; Gya, B. Synergistic effect enhances 2-phenylethyl acetate production in the mixed fermentation of Hanseniaspora vineae and Saccharomyces cerevisiae. Process Biochem. 2020, 90, 44–49. [Google Scholar]
- Li, T.; Yang, W.; Wu, S.; Selosse, M.-A.; Gao, J. Progress and prospects of Mycorrhizal fungal diversity in orchids. Front. Plant Sci. 2021, 12, 646325. [Google Scholar] [CrossRef]
- Merín, M.G.; de Ambrosini, V.I.M. Application of a grape surface majority pectinolytic species, Aureobasidium pullulans, to low-temperature red winemaking: Development and stability of wine colour. J. Wine Res. 2020, 31, 218–239. [Google Scholar] [CrossRef]
- Yan, Q.; Pfleger, B.F. Revisiting metabolic engineering strategies for microbial synthesis of oleochemicals. Metab. Eng. 2020, 58, 35–46. [Google Scholar] [CrossRef] [PubMed]
- Wang, H.; Zhang, C.; Feng, J.; Liu, Y.; Yang, Q.; Chen, H.; Gu, Z.; Zhang, H.; Chen, W.; Chen, Y.Q. Role of dihydrofolate reductase in tetrahydrobiopterin biosynthesis and lipid metabolism in the oleaginous fungus Mortierella alpina. Microbiology 2016, 162, 1544–1553. [Google Scholar] [CrossRef] [PubMed]
- Zhao, H.; Lv, M.; Liu, Z.; Zhang, M.; Wang, Y.; Ju, X.; Song, Z.; Ren, L.; Jia, B.; Qiao, M.; et al. High-yield oleaginous fungi and high-value microbial lipid resources from Mucoromycota. BioEnergy Res. 2021, 14, 1196–1206. [Google Scholar] [CrossRef]
- Shah, A.M.; Yang, W.; Mohamed, H.; Zhang, Y.; Song, Y. Microbes: A hidden treasure of polyunsaturated fatty acids. Front. Nutr. 2022, 9, 827837. [Google Scholar] [CrossRef]
- Lane, S.; Dong, J.; Jin, Y.-S. Value-added biotransformation of cellulosic sugars by engineered Saccharomyces cerevisiae. Bioresour. Technol. 2018, 260, 380–394. [Google Scholar] [CrossRef]
- Abdeljalil, S.; Ben Hmad, I.; Saibi, W.; Amouri, B.; Maalej, W.; Kaaniche, M.; Koubaa, A.; Gargouri, A. Investigations on Hydrolytic Activities from Stachybotrys microsporaand Their Use as an Alternative in Yeast DNA Extraction. Appl. Biochem. Biotechnol. 2014, 172, 1599–1611. [Google Scholar] [CrossRef]
- Cavello, I.; Albanesi, A.; Fratebianchi, D.; Garmedia, G.; Vero, S.; Cavalitto, S. Pectinolytic yeasts from cold environments: Novel findings of Guehomyces pullulans, Cystofilobasidium infirmominiatum and Cryptococcus adeliensis producing pectinases. Extremophiles 2017, 21, 319–329. [Google Scholar] [CrossRef]
- Liu, P.; Lu, L.; Duan, C.; Yan, G. The contribution of indigenous non-Saccharomyces wine yeast to improved aromatic quality of Cabernet Sauvignon wines by spontaneous fermentation. LWT-Food Sci. Technol. 2016, 71, 356–363. [Google Scholar] [CrossRef]
- Renault, P.; Coulon, J.; de Revel, G.; Barbe, J.; Bely, M. Increase of fruity aroma during mixed T. delbrueckii/S. cerevisiae wine fermentation is linked to specific esters enhancement. Int. J. Food Microbiol. 2015, 207, 40–48. [Google Scholar] [CrossRef] [PubMed]
- Miller, K.V.; Noguera, R.; Beaver, J.; Medina-Plaza, C.; Oberholster, A.; Block, D.E. A Mechanistic Model for the Extraction of Phenolics from Grapes During Red Wine Fermentation. Molecules 2019, 24, 1275. [Google Scholar] [CrossRef] [PubMed]
- Zhang, S.; Chen, X.; Zhong, Q.; Zhuang, X.; Bai, Z. Microbial Community Analyses Associated with Nine Varieties of Wine Grape Carposphere Based on High-Throughput Sequencing. Microorganisms 2019, 7, 668. [Google Scholar] [CrossRef]
- Kioroglou, D.; Mas, A.; Portillo, M.C. High-Throughput Sequencing Approach to Analyze the Effect of Aging Time and Barrel Usage on the Microbial Community Composition of Red Wines. Front. Microbiol. 2020, 11, 562560. [Google Scholar] [CrossRef] [PubMed]


Disclaimer/Publisher’s Note: The statements, opinions and data contained in all publications are solely those of the individual author(s) and contributor(s) and not of MDPI and/or the editor(s). MDPI and/or the editor(s) disclaim responsibility for any injury to people or property resulting from any ideas, methods, instructions or products referred to in the content. |
© 2023 by the authors. Licensee MDPI, Basel, Switzerland. This article is an open access article distributed under the terms and conditions of the Creative Commons Attribution (CC BY) license (https://creativecommons.org/licenses/by/4.0/).