Article

Dietary NDF/Starch Ratio Modulates Colonic Microbiota and Metabolites in Lambs before and after Weaning

1
College of Animal Science and Technology, Gansu Agricultural University, Lanzhou 730070, China
2
Pingliang City Kongtong District Animal Husbandry and Veterinary Center, Pingliang 744000, China
*
Author to whom correspondence should be addressed.
Fermentation 2023, 9(11), 935; https://doi.org/10.3390/fermentation9110935
Submission received: 7 August 2023 / Revised: 12 October 2023 / Accepted: 23 October 2023 / Published: 26 October 2023
(This article belongs to the Section Industrial Fermentation)

Abstract

:
The neutral detergent fiber (NDF)/starch ratio is a key determinant of the carbohydrate composition in ruminant diets, which affects the development of the gastrointestinal tract and animal growth. In this study, we used a combination of 16S amplicon sequencing and metabolomics technologies to reveal changes in the microbiota and their metabolites associated with digestive matter in the colon of lambs between different starter NDF/starch ratios and before and after weaning. A total of 40 male lambs of Hu sheep with a newborn weight of 3.14 ± 0.05 kg were selected for the experiment and fed with breast milk until 10 days of age, and were randomly divided into 2 groups, which were fed ad libitum with a starter of NDF/starch of 0.5 (A) or 1.0 (B) for a period of 56 days, and then weaned off the milk powder at 35 days of age. Six lambs with weights close to the average weight of the group were selected for slaughter in each of the two groups before (35 days of age) and after weaning (56 days of age), and were accordingly named A35, A56, B35 and B56. The results showed that, before weaning, the concentrations of acetic acid, propionic acid, butyric acid and total volatile fatty acids (TVFA) in group B35 were significantly higher than those in group A35 (p < 0.05), while the concentrations of isobutyric acid, valeric acid and isovaleric acid were significantly lower than those in group A35 (p < 0.05). After weaning, the concentrations of all volatile acids and total acids in group B56 were significantly lower than those in group A56 (p < 0.01). At the phylum level, the dominant phyla identified were Firmicutes and Bacteroidetes; the relative abundances of Firmicutes and Desulfobacterota were significantly higher and lower in group B35 than in group A35, respectively (p < 0.05); the relative abundances of Euryarchaeota and Desulfobacterota were significantly higher and lower in group A56 than in group A35 (p < 0.05); and, at the genus level, the relative abundance of Lachnospiraceae_FCS020_group and Eubacterium nodatum group had higher relative abundance in group B35 before weaning (p < 0.05). Metabolomic results showed that feeding 1.0 NDF/starch ratio starter before weaning significantly up-regulated (p < 0.05) the concentrations of several anti-inflammatory-related metabolites such as lithocholic acid, oleanolic acid and LysoP. After weaning, the number of differential microorganisms and anti-inflammatory-related metabolites decreased between the two ratios. In summary, feeding a 1.0 NDF/starch ratio starter may be more effective in regulating microbial fermentation, leading to an increase in beneficial microbiota and metabolites, thus improving colonic environmental homeostasis in lambs before and after weaning.

1. Introduction

Early weaning of lambs is a key technique in intensive sheep farming to increase litter size and reduce production costs. However, during early weaning, the digestive and immune systems of lambs are not fully developed, and changes in diet and environment, among other factors, can bring about a series of social stresses in lambs, which may lead to health problems and poor growth performance [1,2]. Weaning stress can be alleviated by appropriate milk replacer and improved feeding management, early supplementation with starter feeds can improve lambs’ adaptability to forage feeds and can provide the rapid growth needs of young ruminants and supplementation with roughage can provide lambs’ nutrient needs while also effectively promoting their gastrointestinal tract development [3,4]. In a study by Damiano Cavallini et al., a twice-daily feeding of 3 L/day of pasteurized milk from the fourth day of life, supplemented with hay-based Total Mixed Rations (TMR), was able to maintain calf growth rates at normal levels without adverse effects on intake and fecal characteristics [5]. One study reported that early weaning increased bacterial diversity and altered the relative abundance of several dominant taxa in the ileum of lambs on day 42 compared to unweaned lambs, and the effect on the ileum persisted until day 84 [6]. Enhanced rumen fermentation and enzyme activity, reduced flora diversity and abundance and similar dominant flora and function before and after early weaning in Hu sheep lambs [7].
The mature rumen of ruminants contains a high diversity, density and complexity of microbiota [8,9]. However, the hindgut of ruminants, including the cecum and colon, is also dense and diverse in its microbiota composition [10], and there is regional specialization within the intestinal fermentation capacity and immune system [11]. Efficient feeding systems for ruminants in modern feeding systems require the maintenance of optimal rumen and hindgut fermentation. Feeding a high-starch diet will increase the proportion of propionic and valeric acid and reduce the proportion of acetic acid and the ratio of acetic acid to propionic acid in rumen of Hu sheep. Feeding low starch levels of soybean hull to lambs increased final body weight without affecting TVFA concentrations in rumen [12]. High-fiber diets fed to dairy goats can produce high levels of rumen fiber-degrading bacteria. Colonization of the colon by these fiber-degrading bacteria may facilitate higher levels of butyrate production in the colon, thereby protecting the colonic epithelial barrier and promoting energy metabolism [13]. In addition, the number and diversity of colonic bacteria increases with age during animal growth, and there are differences in bacterial composition between ages. The preliminary experimental study by our group showed that the average daily weight gain and average daily feed intake of lambs at 28–56 days of age were significantly higher than those of the 15% group when lambs were supplemented with starter diets with NDF levels of 20% and 25% after early weaning [14]. On the basis of this experiment, the effects of different NDF-to-starch ratios in starters on the gastrointestinal tract of lambs were further investigated in combination with the starch content factor [15]. Due to the weak rumen function in pre-weaned lambs, the fibrous material in the starter was difficult to be degraded and utilized; Gressly et al. showed that hindgut microorganisms could utilize more than 10% of the carbohydrates in the diet and that the hindgut would promote their fermentation to satisfy 10% of the digestive energy requirement of sheep [16]. Therefore, in order to understand the differences in microbial and metabolite profiles between different proportions of starter diets fed and in lambs before and after weaning, the contents of the colon were analyzed in the present study using 16S amplicon sequencing and non-targeted metabolomics techniques.

2. Materials and Methods

2.1. Ethics Statement

The study protocol was reviewed and approved by the Animal Welfare Ethics Committee of Gansu Agricultural University (Approval No. 20180173). And the animal procedures used in this study strictly abide by the Administrative Measures of Gansu Province on Experimental Animals [17].

2.2. Animals, Diets and Sampling Procedures

2.2.1. Animals and Experimental Design

The study lambs were purchased from Lanzhou Tianxin Breeding Livestock Co., Ltd. (Lanzhou, Gansu, China). In total, 40 healthy male lambs with a birth weight of 3.14 ± 0.05 kg were breastfed until the age of 10 days, and then were randomly divided into 2 groups. We started to feed the same milk replacer powder and, at the same time, ad libitum fed starter with an NDF/starch content of 0.5 (Group A) or 1.0 (Group B). The milk replacer was weaned at 35 days of age, and the starter was fed until 56 days of age. Before weaning (35 days of age) and after weaning (56 days of age), six lambs with weights close to the average weight [18] of the group were selected for slaughter in each group and named A35, A56, B35 and B56 (n = 6).

2.2.2. Diets, Feeding Management and Sampling Procedures

The feed was prepared by Gansu Runmu Biological Engineering Co., Ltd. (Jinchang, Gansu, China) by crushing various feed ingredients and then making pellets in a ring mold (temperature 84~86 °C; 8.0 mm, compression ratio 1:5, diameter 4 mm). The contents and nutritional composition of the pelleted feed are shown in Table 1. The lambs were fed a milk replacer provided by Beijing Precision Animal Nutrition Research Centre (Beijing, China) (nutritional level DM: 96.91%, CP: 23.22%, CF: 13.20%; Patent No. ZL02128844.5) daily, at regular intervals from 10 to 35 days of age, at a rate of 1.5% of body weight as a reference. The starters were fed ad libitum for the whole period of the experiment; milk replacer was fed three times per day at 8:00, 14:00 and 20:00, and starters were fed twice per day at 8:00 and 20:00. Lambs were placed in single cages; all lambs had their ears tagged with numbers and were immunized in rigid accordance with the normal management procedures of the sheep farm. The enclosures and pens were disinfected prior to the experiment. Lambs were given free access to water and starter for the whole trial period. After slaughter by neck bleeding before morning feeding, the colonic contents were collected in 5 mL lyophilized tubes and immediately placed in liquid nitrogen, then stored at −80 °C and preserved for 16S rDNA sequencing, volatile acid determination and metabolomics assays.

2.3. Determination of Volatile Acid of Colonic Contents

For the determination of volatile fatty acids (VFA), we used biophosphorylated colonic contents and gas chromatography [20]. After collecting the supernatant of the colonic contents, the supernatant was filtered into brown vials using a 0.45 μm filter, and the VFA was determined using gas chromatography (GC) (Thermo Scientific, Milan, Italy).

2.4. 16srDNA Sequencing of Colon Contents

2.4.1. DNA Extraction, 16S rDNA Amplification and Illumina NovaSeq Sequencing

Total genome DNA from samples was extracted using the CTAB method. DNA concentration and purity were monitored on 1% agarose gels. According to the concentration, DNA was diluted to 1 ng/µL using sterile water. The bacterial V3-V4 region of 16S rRNA genes in the complete DNA were magnified applying the primers 515F and 806R. All PCR responses were executed with 15 µL of Phusion® High-Fidelity PCR Master Mix (New England Biolabs, lnc., 240 County Road, Ipswich, UK), 2 µM of forward and reverse primers and approximately 10 ng template DNA. Thermal cycling comprised initial denaturation at 98 °C for 1 min, adopted by 30 cycles of denaturation at 98 °C for 10 s, annealing at 50 °C for 30 s elongation at 72 °C for 30 s; lastly, it was kept at 72 °C for 5 min. We mixed up the equal volume of 1X loading buffer (contained SYB green) with PCR productions and handle electrophoresis on 2% agarose gel for detection. PCR products were mixed at equal idensity and purified using the Qiagen Gel Extraction Kit (Qiagen, Dusseldorf, Germany). Sequencing libraries were created using TruSeq DNA PCR-Free Sample Preparation Kit (Illumina, San Diego, CA, USA) following up recommendations of the manufacturer, and index codes were added. The library quality was evaluated on the Qubit 2.0 Fluorometer (Thermo Scientific, Shanghai, China) and Agilent Bioanalyzer 2100 system. The library finally was sequenced on an Illumina NovaSeq platform, and 250 bp paired-end reads were generated.

2.4.2. Sequence Filtering, Operational Taxonomic Units (OTU) Clustering and Sequence Analyses

For the raw data given back by the Illumina HiSeq sequencing platform, through double-end, optimised sequences (tags) were obtained splicing (FLASH v1.2.7), filtering (QIIME V1.9.1) and emptying chimeras (UCHIME v4.2). Sequences analyses were performed by Uparse software (Uparse v7.0.1001, http://drive5.com/uparse/, accessed on 21 September 2023) [21]. Sequences with ≥97% similarity were assigned to the same OTUs. A representative sequence for each OTU was screened for further annotation. For each representative sequence, the Silva Database (Silva138, http://www.arb-silva.de/, accessed on 16 December 2019) [22] was used, based on the Mothur algorithm, to annotate taxonomic information. OTUs’ abundance information was normalized using a standard sequence number corresponding to the sample with the fewest sequences. Subsequent analyses of alpha diversity and beta diversity were all performed based on this output-normalized data. Alpha diversity indices (Chao1 and Shannon indices) were calculated using QIIME (Version 1.7.0). For beta diversity, the variations in the microbial composition among groups were investigated using the weighted UniFrac distance method, and this distance was presented using principal coordinate analysis (PCoA) to obtain non-metric multidimensional scaling (NMDs) for analysis. We searched for biomarkers that were statistically different between groups by linear discriminant analysis effect size (LEfSe) analysis of differences between groups, and t-tested the species abundance data between groups using Metastats software to select species that differed between groups based on p-values; 16S functional gene prediction analyses were used to predict gene function and abundance in the samples.

2.5. Untargeted Metabolomic Analysis of Colonic Contents

2.5.1. Metabolite Extraction, Instrument Parameters (Chromatographic Condition Settings, Mass Spectrometry Conditions)

The samples (100 μL) were placed in the EP tubes and resuspended with prechilled 80% methanol by well-vortex. Then, the samples were incubated on ice for 5 min and centrifuged at 15,000× g at 4 °C for 20 min. Some of the supernatant was diluted to a final concentration of 53% methanol by LC–MS-grade water. The samples were subsequently transferred to a fresh Eppendorf tube and then were centrifuged at 15,000× g at 4 °C for 20 min. Finally, the supernatant was injected into the LC–MS/MS system analysis.
In addition, an equal volume of sample from each experiment was mixed for quality control (QC)—Chromatographic column: Hypersil Goldcolumn (C18) (Bellefontr, PA, USA); column temperature: 40 °C; flow rate: 0.2 mL/min; in positive mode, mobile phase A: 0.1% formic acid (Thermo Fisher, Czech Republic, Central Bohemian Region, city of Kolin), blank sample: 53% methanol aqueous solution instead of experimental sample, same pre-treatment as experimental sample, mobile phase B: methanol; in negative mode, mobile phase A: 5 mM ammonium acetate (Thermo Fisher, Czech Republic, Central Bohemian Region, city of Kolin), pH 9.0, mobile phase B: methanol. During the instrumental analysis, QC samples were randomly inserted to monitor the reproducibility and reliability of the experimental data—scan range selection: m/z 100–1500. The ESI source was set to spray voltage: 3.5 kV; sheath gas flow rate: 35 psi; auxiliary gas flow rate: 10 L/min; capillary temperature: 320 °C; S-lens RF level: 60; auxiliary gas heater temperature: 350 °C; polarity: positive, negative; MS/MS Level 2 scanning for data-dependent scans.

2.5.2. Data Pre-Processing and Metabolite Identification

The downstream data were imported into CD 3.1 library hunt application for processing, and elementary screening of parameters like mass-to-charge ratio andretention time was executed for each metabolite. The next stage was putting 0.2 min's retention time deviation and mass deviation of 5 ppm for varying samples' peak alignment for more exactidentification, adopted by setting mass deviation of 5 ppm, signal intensity deviation of 30%, signal-to-noise ratio of 3, minimum signal intensity, summed ions and others. The target ions were then integrated; the molecular ion peaks and fragment ions were used to predict the molecular formulae and compared with the mzCloud (https://www.mzcloud.org/, accessed on 5 April 2023), mz Vault and Masslist databases. The results were normalized to obtain the relative peak areas based on the formula: raw sample quantification/ (sum of sample metabolite quantification values/sum of QC1 sample metabolite quantification values), and compounds with a CV greater than 30% of the relative peak area were removed from the QC samples to obtain the final metabolite identification and relative quantification results.
The KEGG database (https://www.genome.jp/kegg/pathway.html, accessed on 10 February 2018), the HMDB database (https://hmdb.ca/metabolites, accessed on 23 February 2022) and the LIPID Maps database (http://www.lipidmaps.org/, accessed on 5 November 2021) were used to identify metabolites for annotation. In Section 2.6, the data were transformed using the metabolomics data processing software metaX and subjected to principal component analysis (PCA) and partial least squares discriminant analysis (PLS-DA) to obtain VIP values for each metabolite. In the univariate analysis section, statistical significance (p value) was calculated for each metabolite between the two groups based on a t test, and the fold change (FC) was calculated for the metabolite between the two groups. The screening criteria for differential metabolites were VIP > 1, p value < 0.05 and FC > 1.5 or FC < 0.666. The screened differential metabolites were integrated with positive and negative ions. Correlation analysis between differential metabolites (Pearson correlation coefficient) was performed using the R language cor(); statistical significance was achieved by cor.mtest() in R. A p value < 0.05 was considered statistically significant and correlation plots were plotted using the corrplot package in R. Bubble plots were plotted using the R package ggplot2, using the KEGG database to examine metabolite function and metabolic pathways, which were considered enriched when x/n > y/n and significantly enriched when the p-value for the metabolic pathway was <0.05.

2.6. Statistical Analyses

Preliminary experimental data were processed by Excel (Microsoft, Seattle, Washington, DC, USA) and analyzed using the independent samples t test in SPSS22 software (SPSS, Chicago, IL, USA), where 0.05 < p value < 0.10 shows a trend, p value < 0.05 is significant and p value < 0.01 is extremely significant. The non-target metabolomics part used PLS-DA [23] modeling to screen differential substances, and the PLS-DA model was validated by sequencing. By modeling the relationship between metabolite expression and sample category, the model evaluation parameters (R2, Q2) were obtained, and, if R2 and Q2 were closer to 1, this indicated that the model was more stable and reliable. When the R2 data were larger than the Q2 data and the intercept of the Q2 regression line with the Y-axis was less than 0, this indicated that the model was not “overfitted” [24].

3. Results

3.1. Concentration of Volatile Fatty Acids in the Colonic Digesta

As shown in Table 2, before weaning, the concentrations of acetic acid, propionic acid and total acid were extremely significantly higher in group B35 (p < 0.01), the concentrations of isobutyric acid, valeric acid and isovaleric acid were significantly lower, and the concentration of butyric acid was significantly higher than in group A35 (p < 0.05). After weaning, all kinds of volatile acids and total acid concentrations were extremely significantly lower in group B56 than in group A56 (p < 0.01). In addition, compared to the pre-weaning period, the concentrations of all volatile acids in group A56, except isobutyric acid, increased extremely significantly after weaning (p < 0.01), while, in group B56, the concentrations of propionic acid, isobutyric acid, valeric acid and isovaleric acid increased extremely significantly (p < 0.01). TVFA concentration tended to decrease after weaning (p = 0.072).

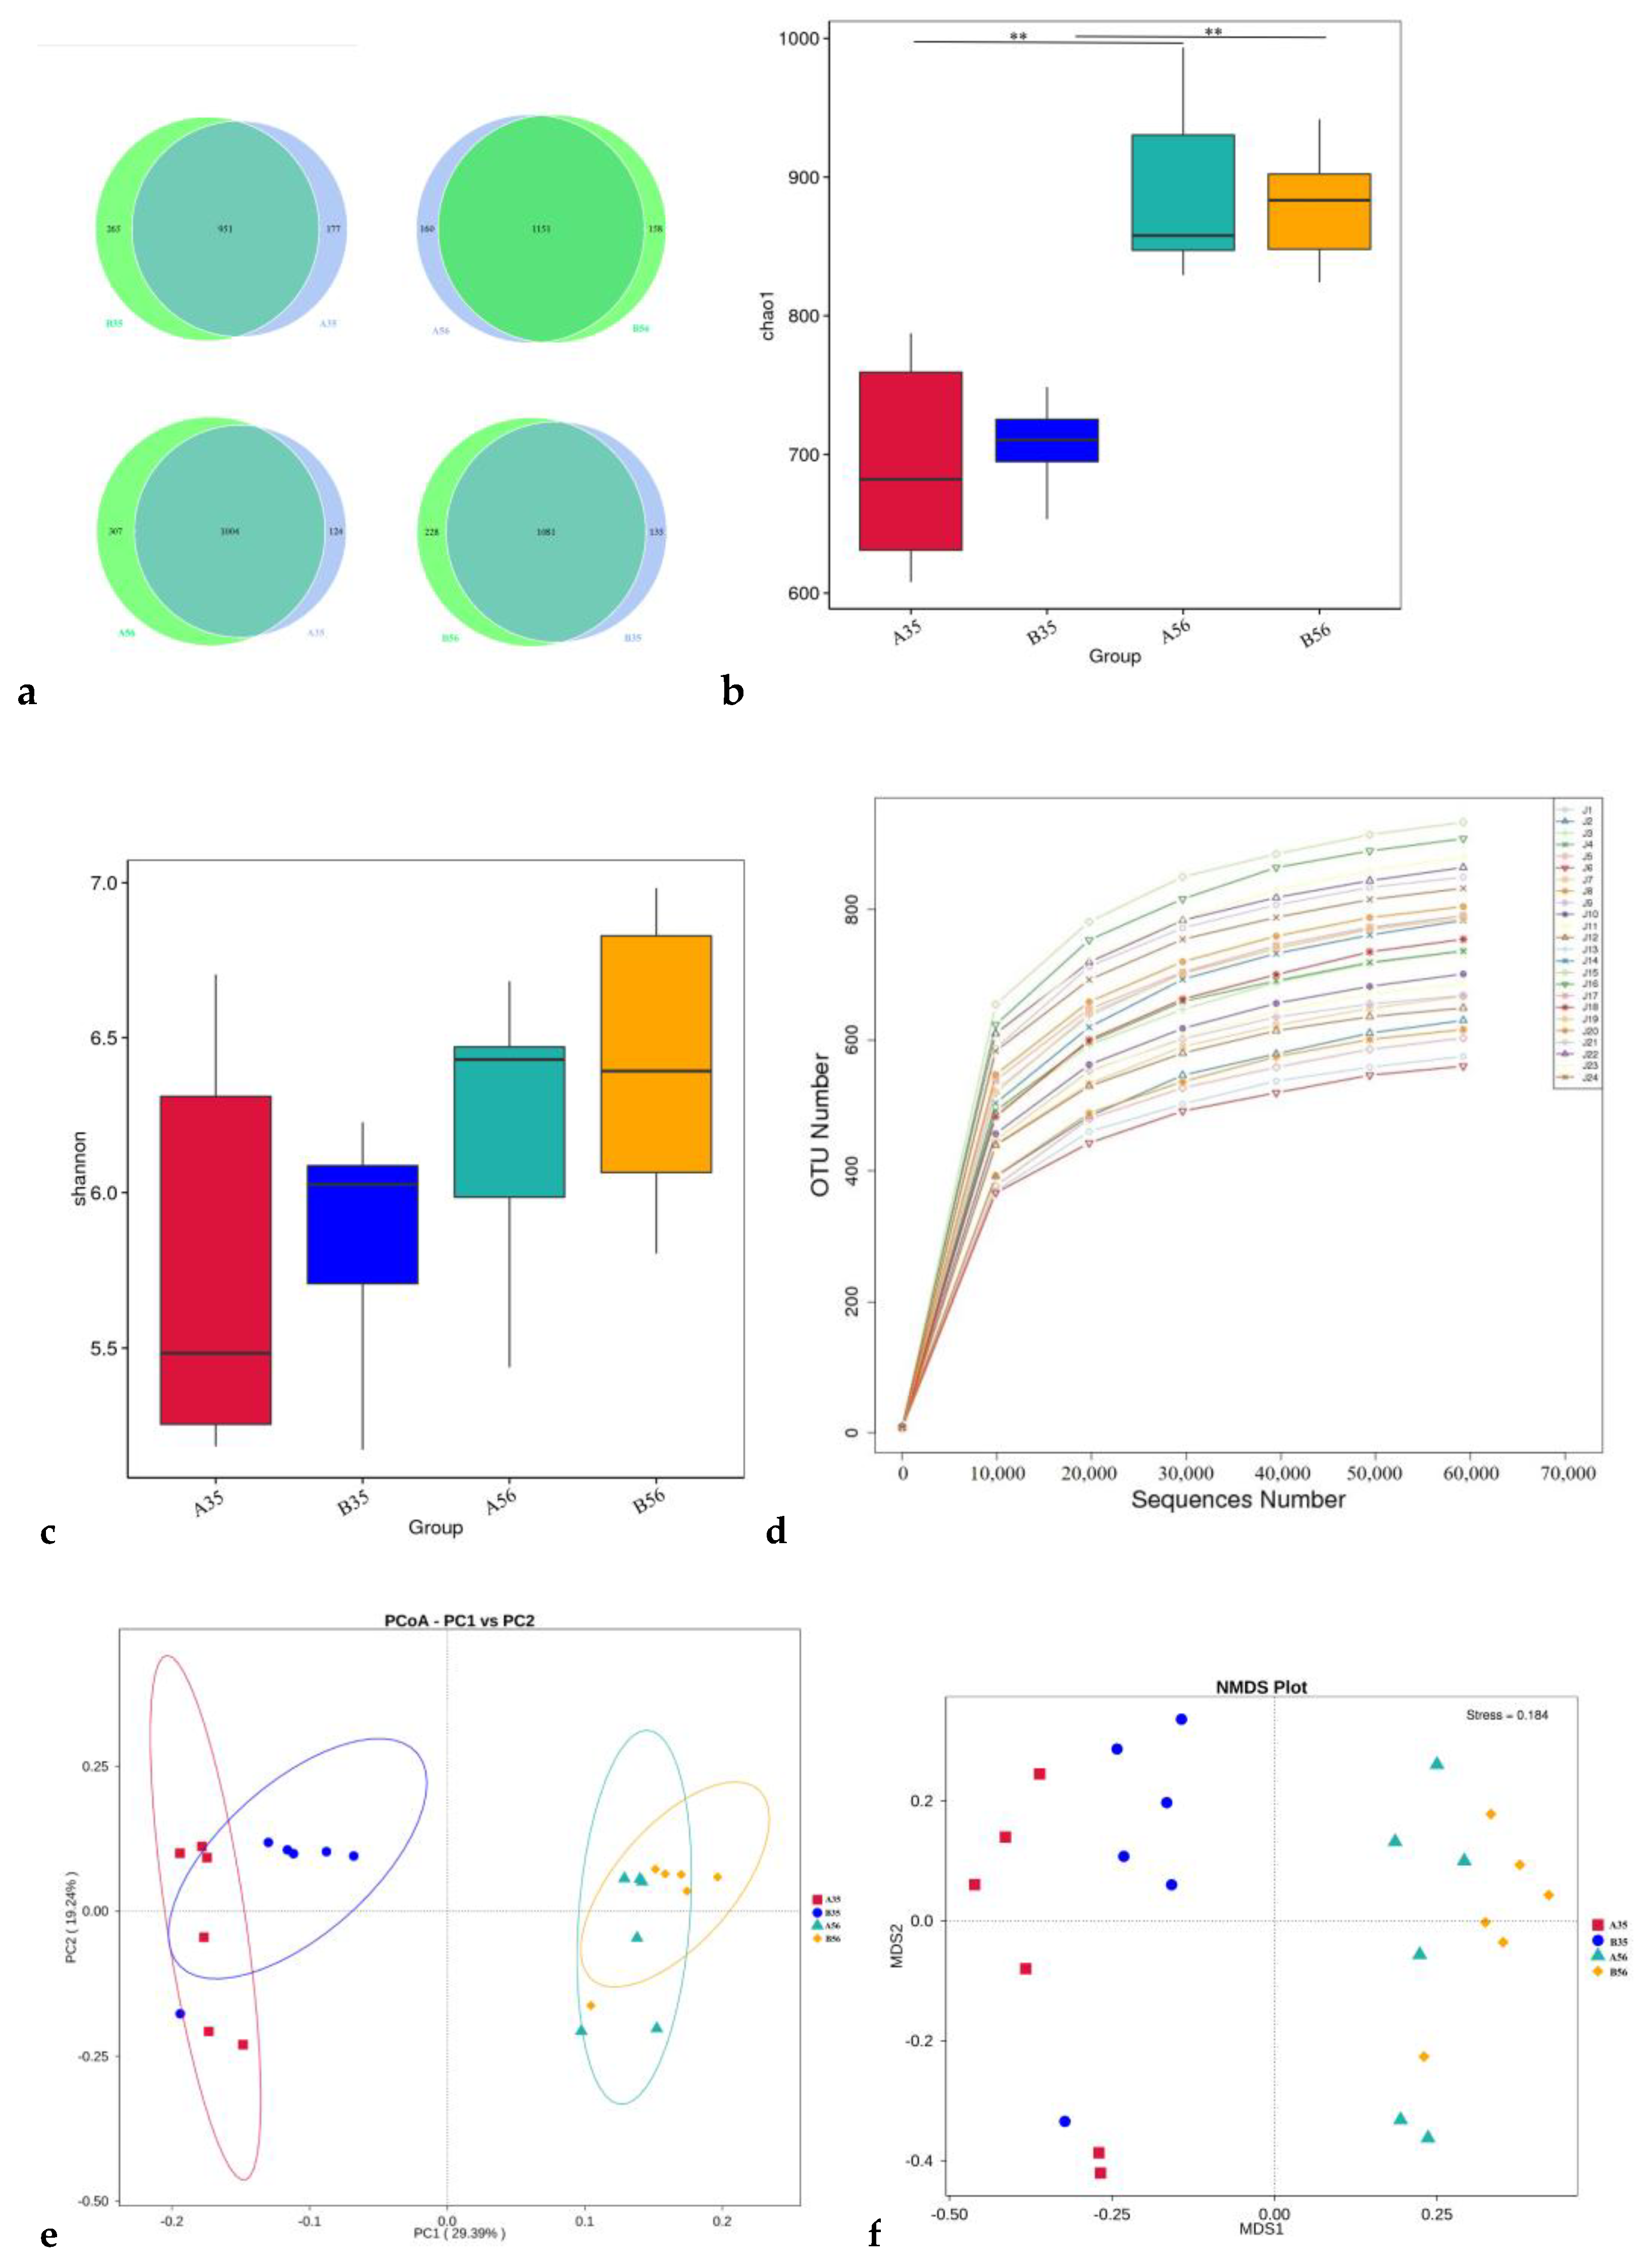
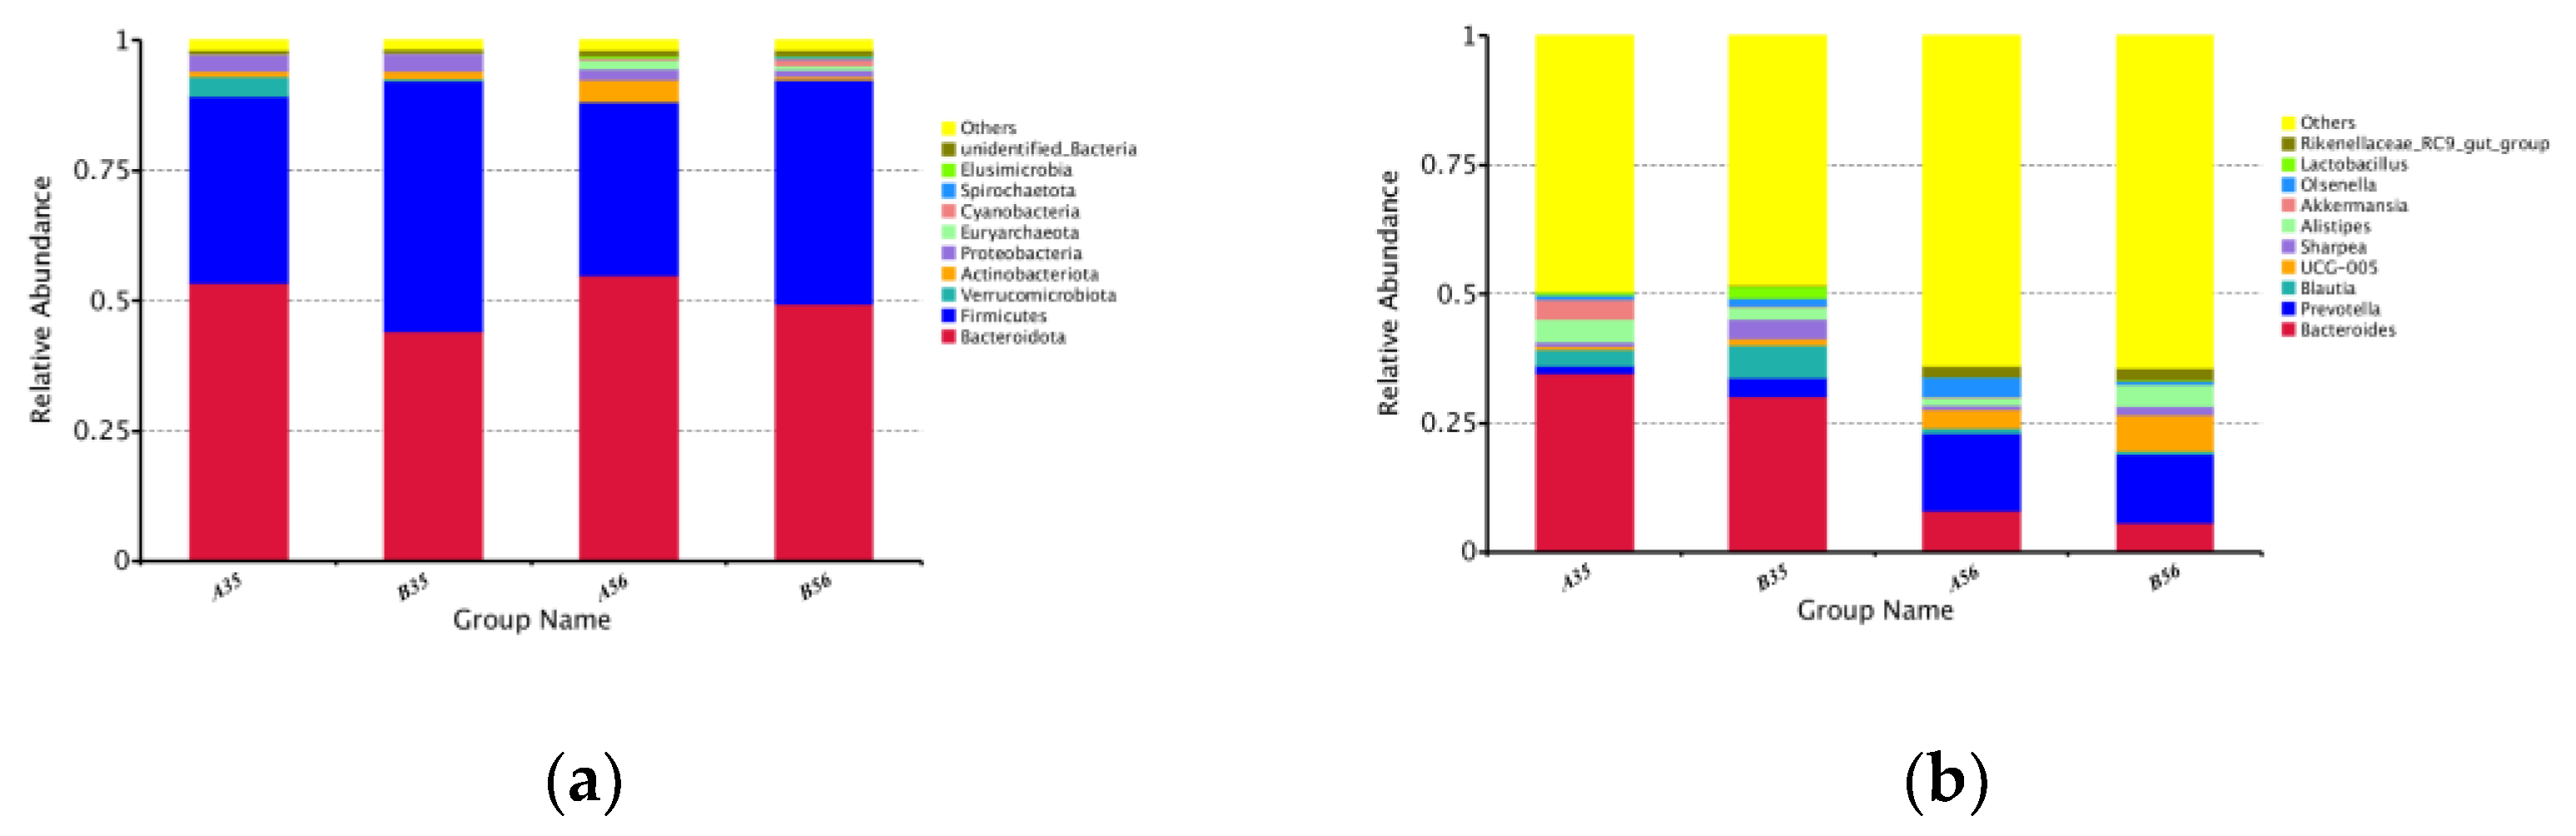
3.2. The Bacterial Community Composition in the Colon

Next, 16S rDNA sequencing was performed for a comprehensive analysis of the microbiota of the colonic contents of 24 lambs. We obtained 2,071,298 valid tags. At least 79,408 reads were yielded for each sample with an average sequence length of 372 bp (Supplementary Table S1). A total of 1614 OTUs were acquired for all samples. The percentages of OTUs annotated at each level were 100.00%, 93.74%, 93.18%, 90.89%, 74.97%, 52.11% and 12.89%, in descending order from the boundary to species. The number of common and endemic OTUs among the groups is shown as a Venn diagram (Figure 1a).

3.2.1. The Composition and Structure of Colonic Content Microorganisms

At the taxonomic level, 179 species from 297 genera in 19 phyla, 38 classes, 89 orders, and 151 families were detected in the microbiota of colonic contents. While the colonic contents’ microorganisms among the samples varied at different ratios, the overall structure was similar. The top 10 species in terms of relative abundance at the genus levels and phylum were chosen to map species relative abundance. At the phylum level, Bacteroidetes and Firmicutes were the most dominant phylum, the sum of which accounted for 89.37% and 92.33% of the total phylum in groups A35 and B35, respectively, and 88.25% and 92.54% in groups A56 and B56, respectively. These were followed by Proteobacteria (2.46%), Actinobacteria (1.89%) and Verrucomicrobiota (1.04%). The relative abundance of Firmicutes was significantly higher in group B35 than in group A35, and the relative abundance of Desulfobacterota was significantly lower than in group A35 (p < 0.05). The relative abundance of Chloroflexi was significantly higher in group B56 than in group A56 (p < 0.05). The relative abundance of Euryarchaeota in group A56 was significantly higher than that in group A35, the relative abundance of Desulfobacterota was significantly lower than that in group A35, the relative abundances of Verrucomicrobiota and Desulfobacterota in group B56 were significantly lower than that in group B35 and the relative abundance of Euryarchaeota, Cyanobacteria, Elusimicrobia and unidentified_Bacteria were significantly more abundant than in the B35 group (p < 0.05) (Supplementary Table S2-1).
At the genus level, Bacteroides, Prevotella and Blautia are the dominant genera (Figure 2b). There were nine differential genera between groups A35 and B35, with the relative abundance of [Eubacterium]_ventriosum_group, Peptococcus, Desulfovibrio and Eisenbergiella being significantly lower in group B35 than in group A35 (p < 0.05). Acetanaerobacterium, [Eubacterium]_nodatum_group, Anaerovorax, Lachnospiraceae_FCS020_group and UCG-009 had significantly higher relative abundance in the B35 group than in the A35 group (p < 0.05). There were seven differential genera between groups A56 and B56, with the relative abundance of Hungatella, Paraeggerthella and Terrisporobacter being significantly lower in group B56 than in group A56. The relative abundances of Oscillibacter, Oscillospira, Hydrogenoanaerobacterium and UCG-009 were significantly higher in group B56 than in group A56 (p < 0.05). There were 60 and 75 differing genera between groups A35 and A56 and B35 and B56, respectively. The main selection of the respective top 10 differential genera analyzed revealed that feeding a 0.5 proportion of starter significantly reduced the relative abundance of [Eubacterium]_hallii_group, Anaerofilum, Phascolarctobacterium, Subdoligranulum and Coprobacter and increased the relative abundance of Clostridioides, Lachnospiraceae_UCG-001, UCG-005 and Ruminococcus. Feeding of 1.0 proportion of starter significantly reduced the relative abundance of Phascolarctobacterium, Prevotellaceae_NK3B31_group, Bacteroides and Desulfovibrio with increasing age and increased the relative abundance of Pseudoramibacter, Schwartzia, Coprococcus, Dubosiella and Megasphaera in relative abundance (Supplementary Table S3). AMOVA analysis showed significant differences in the colonic contents’ microbiota at the phylum and genus levels at different proportions and different ages (Supplementary Table S1). Further LEfSe analysis of microorganisms with significantly different abundance at each level is shown in Figure 3. There were 3 biomarkers between the A35B35 group (Figure 3a), 19 biomarkers between the A35A56 group (Figure 3b), 15 biomarkers between the B35B6 group (Figure 3c) and one biomarker (LDA score > 4) between the A56B56 group (Figure 3d). This was consistent with analysis of molecular variance (AMOVA) analysis. Overall, the two groups differed significantly in the genera of colonic contents before and after weaning, and the differential genera increased with age.

3.2.2. Gene Function Prediction

To research the biological function of the colonic content microbiota between different groups, we performed functional predictions using PICRUSt. Based on the database annotation results, the functional information (top 10 results) of each sample or subgroup in terms of maximum abundance at each annotation level were selected to generate a bar chart of relative functional abundance. As illustrated in the graph, seven gene families were enriched in the samples between groups at KEGG level 1, with ‘Metabolism’ having the highest relative abundance (mean 45.37%), followed by ‘Genetic_Information_Processing’ (mean 24.55%) and ‘Environmental_ In-formation_Processing’ (average 12.18%) (Figure 4a). At KEGG level 2, the majority belonged to ‘Carbohydrate_metabolism’ (average 11.12%), ‘Replication_and_repair’ (average 10.24%), ‘Translation’ (average 9.83%), Membrane_ transport (mean 9.26%) and ‘Amino_acid_metabolism’ (mean 8.73%) (Figure 4b).

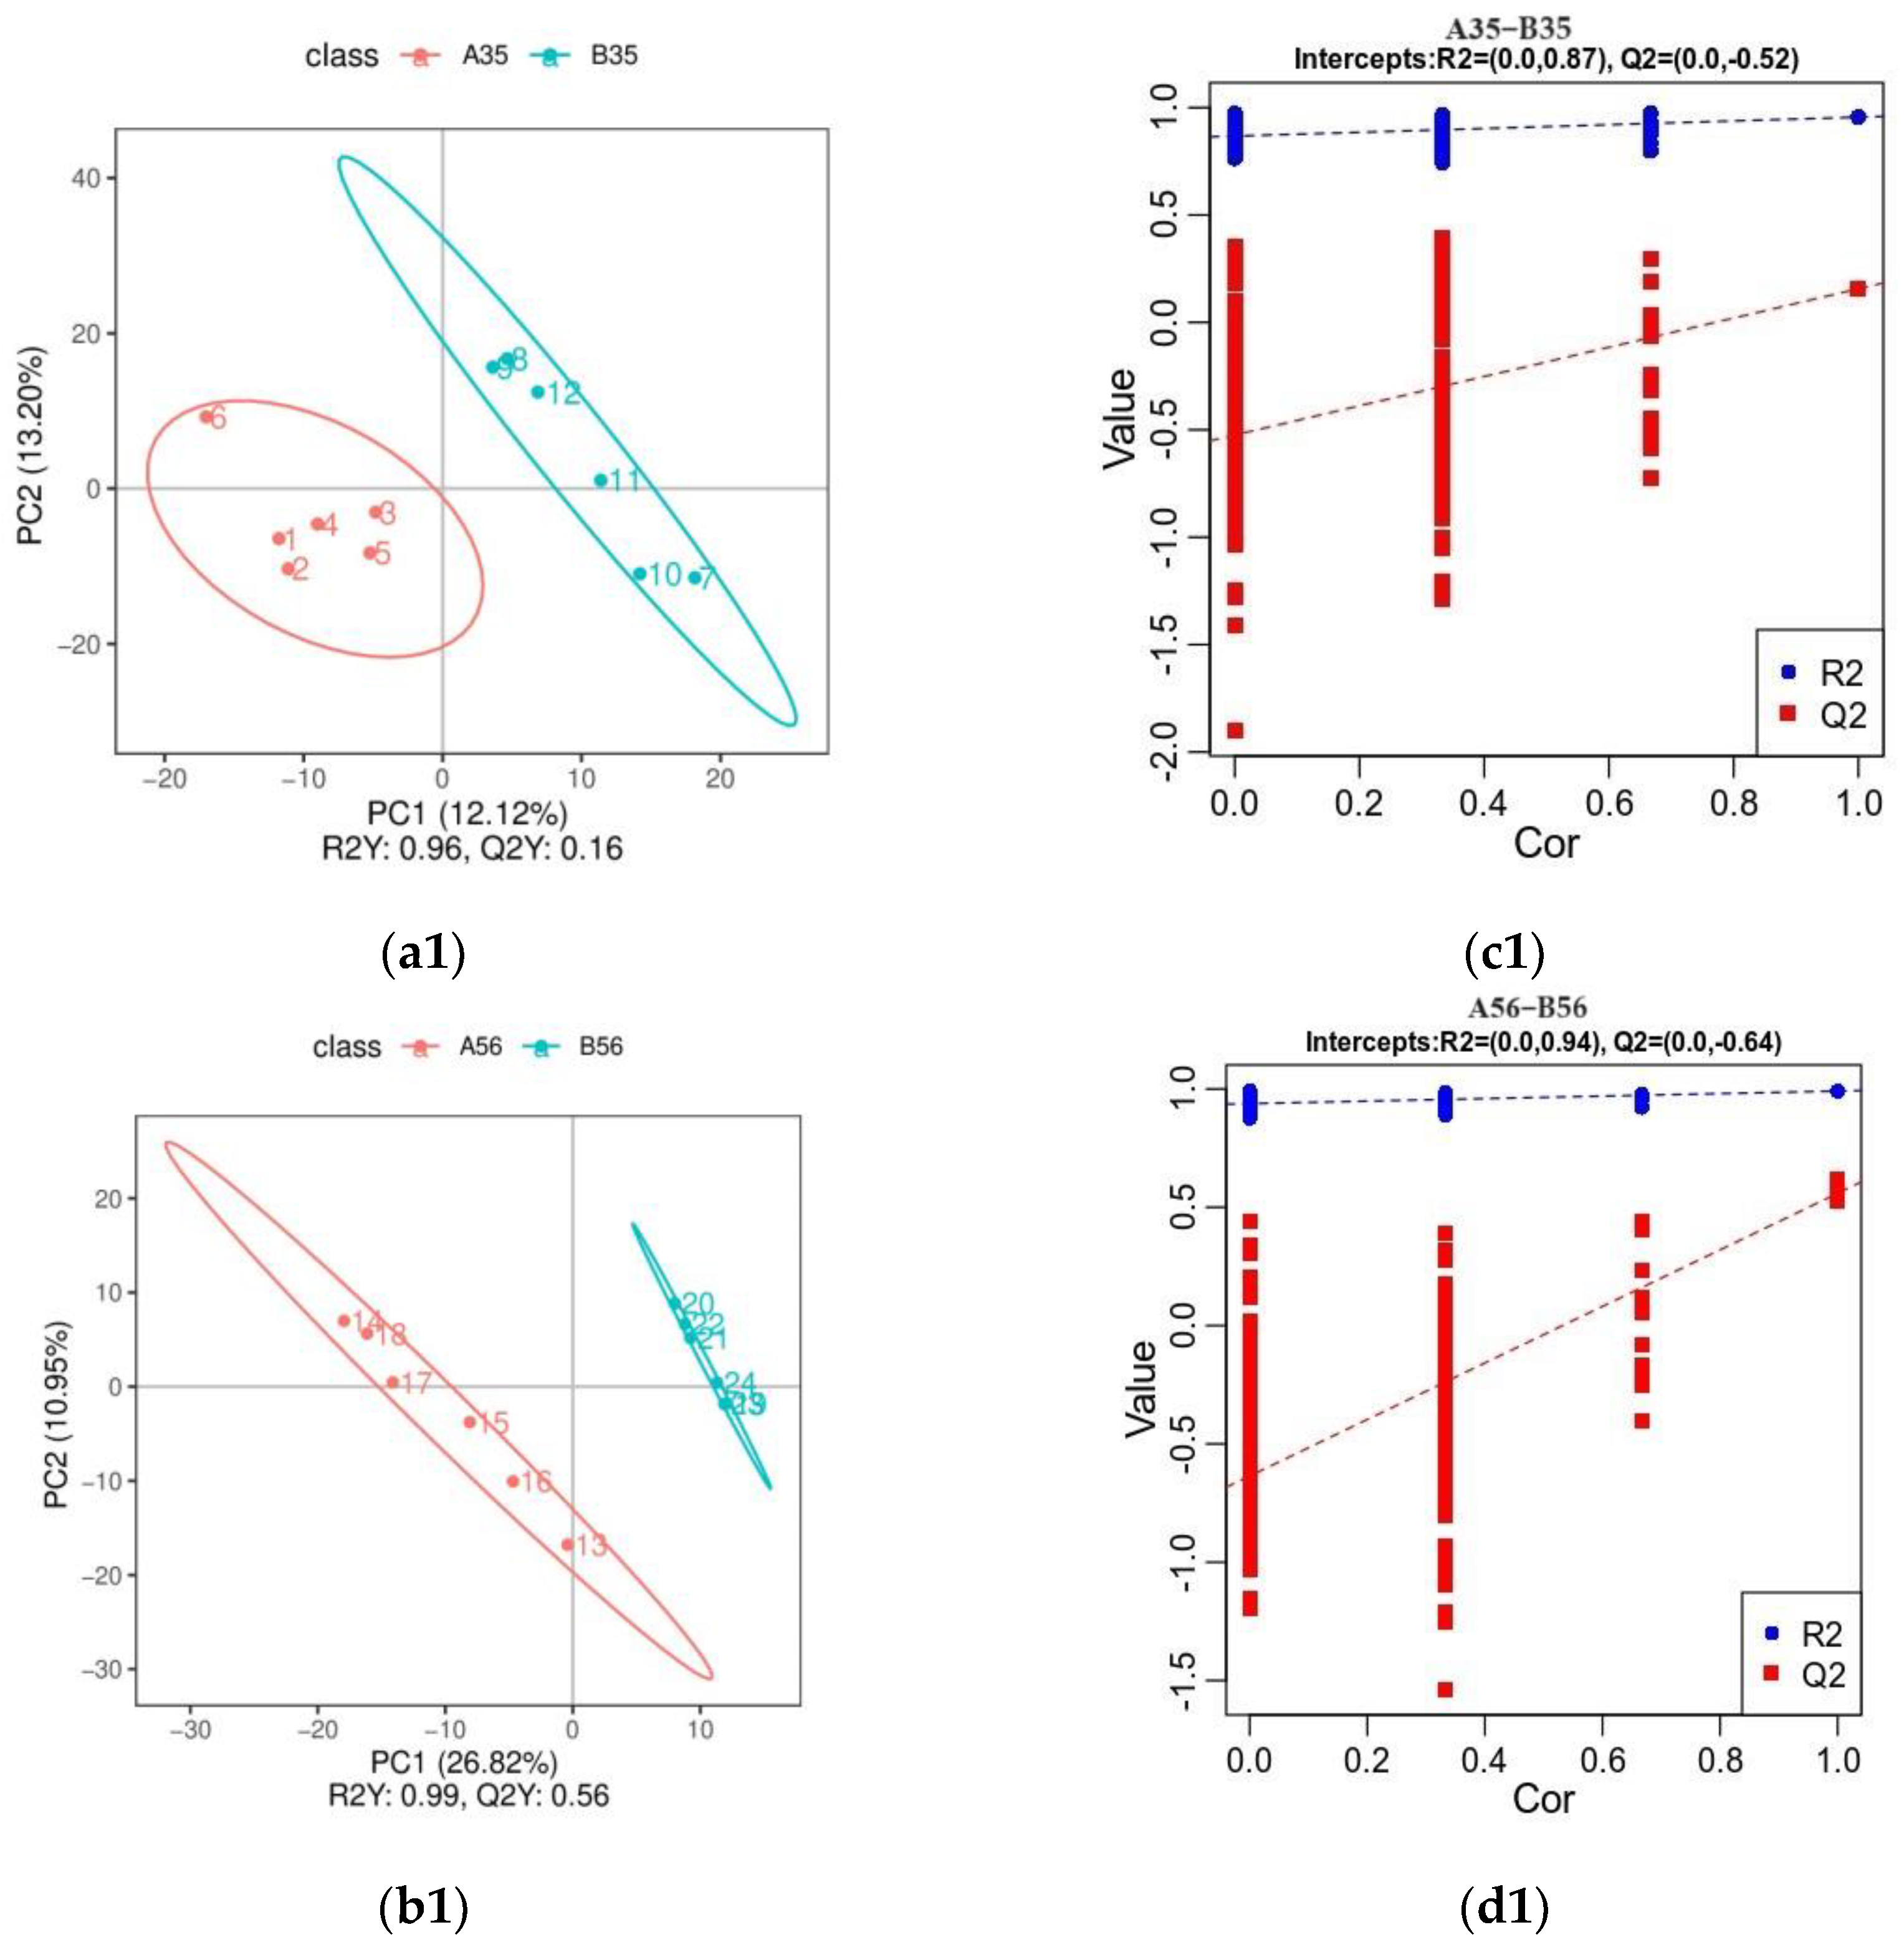
3.3. Untargeted Metabolite Profile of Colonic Contents

3.3.1. Analysis of Orthogonal Partial Least Squares Discriminant Analysis (OPLS-DA)

As can be seen by the OPLS-DA (Positive ions: Figure 5(a1,b1); Negative ions: Figure 5(a2,b2)), all groups of samples were clearly differentiated, indicating that there were significant differences in lamb colonic metabolites between the groups. The results of the permutation tests (Positive ions: Figure 5(c1,d1); Negative ions: Figure 5(c2,d2)) show that both R2, representing the model explanation rate, and Q2, representing the model prediction rate, perform well, indicating that the model explains and predicts well the distinction between the two sample groups.

3.3.2. Identification of Differential Metabolites

A total of 1001 positive ion pattern metabolites and 429 negative ion pattern metabolites were identified in 24 samples in this experiment. VIP > 1, FC > 1.5 or FC < 0.666 with p value < 0.05 were used as selection standards for differential metabolites. The 2 groups identified 64 and 192 differential metabolites at 35 and 56 days of age, respectively (Supplementary Table S4). Furthermore, 25 differential metabolites were screened according to VIP > 2.2 before weaning (Supplementary Table S5). Three of the metabolites belonged to bile acids, alcohols and derivatives, two to fatty acid esters and fatty acids, and one each to conjugates, triterpenoids, purines and purine derivatives, indoles, chalcones and dihydrochalcones, carbonyl compounds and flavones. After weaning, 24 differential metabolites were screened (Supplementary Table S5), with one metabolite each from benzenediols; amino acids, peptides, and analogues; estrane steroids; fatty amides; monoterpenoids; androstane steroids; steroidal alkaloids and carbonyl compounds.

3.3.3. Identification of KEGG Pathway

In this study, at the 35-day-old point, the differential metabolites were significantly enriched in estrogen signaling pathway; morphine addiction; butanoate metabolism; alanine, aspartate and glutamate metabolism; cAMP signaling pathway; endocrine and other factor-regulated calcium reabsorption and other factor-regulated calcium reabsorption (p < 0.05) (Figure 6a). At the 56-day-old point, differential metabolites were mainly enriched in mineral absorption, 2-oxocarboxylic acid metabolism, serotonergic synapse, drug metabolism—cytochrome P450 and taste transduction (Figure 6b).

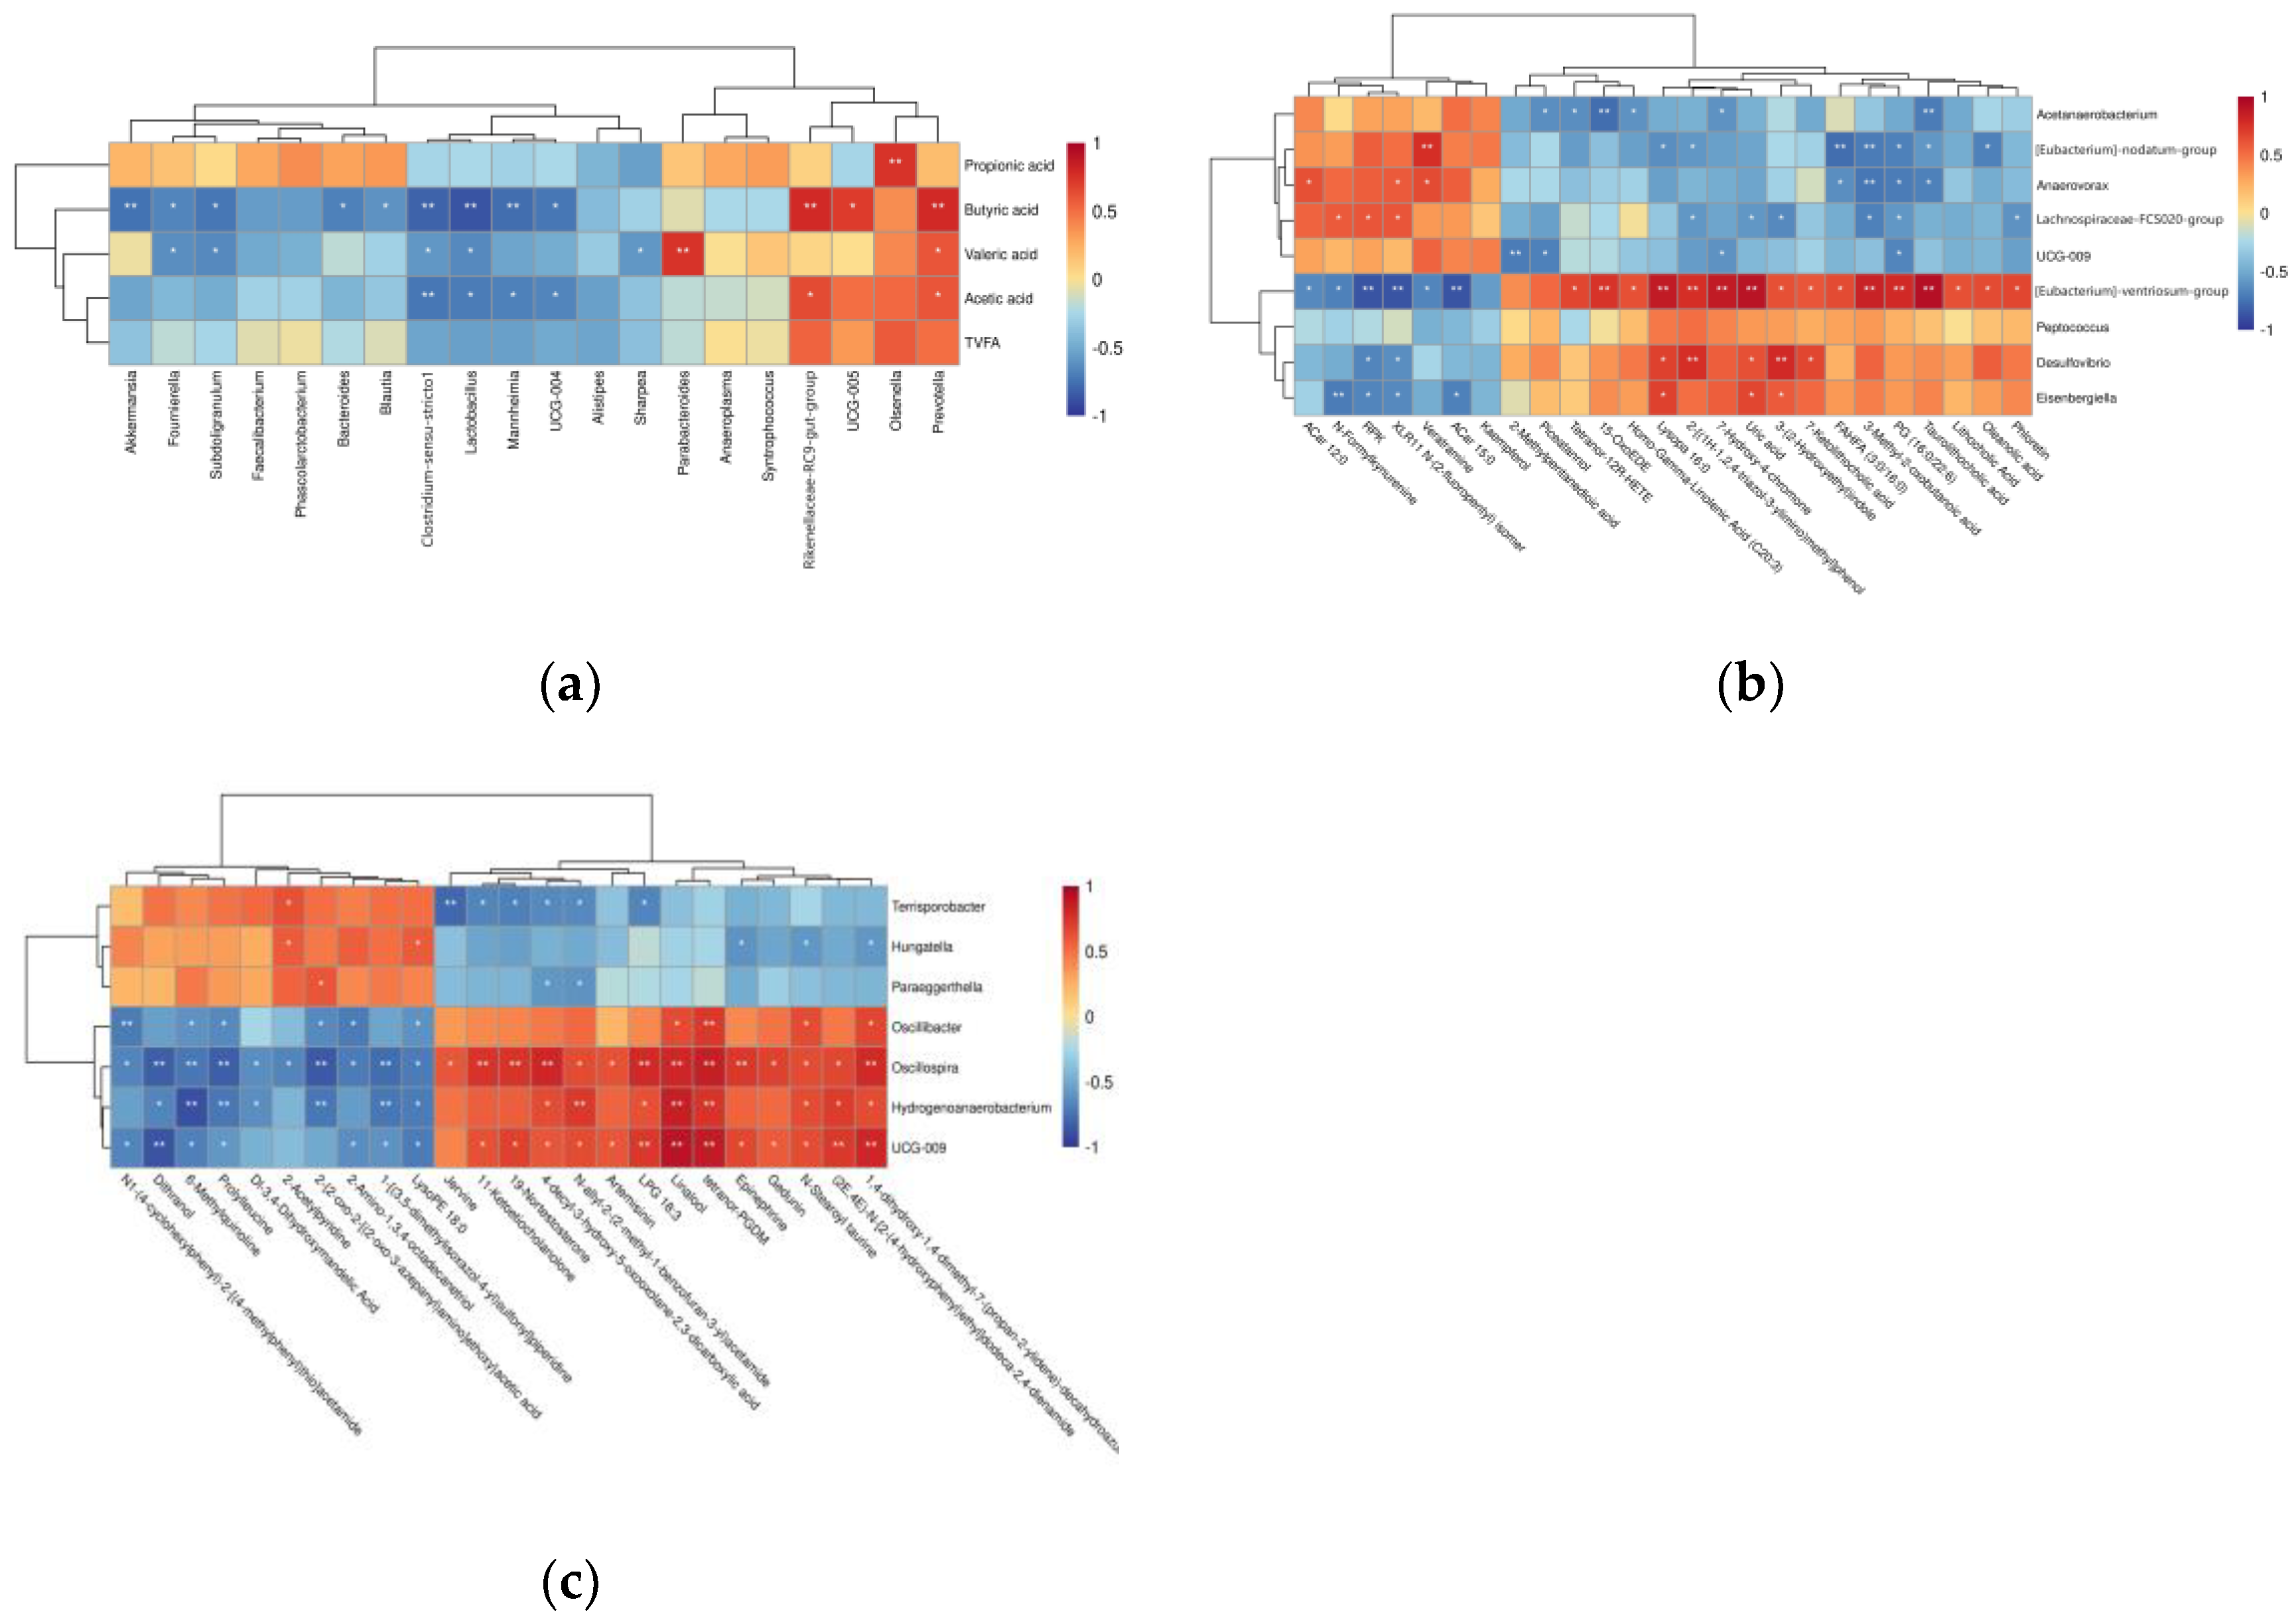
3.4. Correlation Analysis

3.4.1. Correlation Analysis of Bacterial Genera and VFA Concentrations

We performed correlation analysis of colonic microbial genus level top 20 with colonic volatile acids at the genus level (Figure 7a). The results showed that the relative abundances of Subdoligranulum and Fournierella were significantly and negatively correlated with the concentrations of valeric acid and butyric acid; the relative abundances of Bacteroides, Akkermansia and Blautia were significantly and negatively correlated with the concentrations of Butyric acid; the relative abundance of Sharpea was significantly negatively correlated with the concentration of valeric acid; the relative abundance of Clostridium_sensu_stricto_1 and Lactobacillus was significantly negatively correlated with the concentrations of Butyric acid, Valeric acid and Acetic acid and the relative fractions of UCG-004 and Mannheimia were significantly negatively correlated with the concentrations of butyric acid and acetic acid (p < 0.05). The relative abundance of Prevotella was significantly and positively correlated with the concentrations of valeric acid, butyric acid and acetic acid; the relative abundance of UGG_005 was significantly and positively correlated with the concentration of butyric acid; the relative abundance of Rikenellaceae_RC9_gut_group was significantly and positively correlated with the concentrations of butyric acid and acetic acid; Olsenella relative abundance was significantly and positively correlated with propionic acid concentration and Parabacteroides relative abundance was significantly and positively correlated with valeric acid concentration (p < 0.05).

3.4.2. Correlation Analysis of Differential Microorganisms and Differential Metabolites

At the 35-day-old point, the concentrations of up-regulated metabolites included 3-(2-Hydroxyethyl)indole, 7-Ketolithocholic acid, FAHFA (3:0/16:0), Homo-Gamma-Linolenic Acid (C20:3), Lithocholic Acid Oleanolic acid, Phloretin, Tetranor-12R-HETE, 15-OxoEDE, 2-[(1H-1,2,4-triazol-3-ylimino)methyl]phenol, 3-Methyl-2-oxobutanoic acid, 7-Hydroxy-4-chromone, Lysopa 16:0, PG (16:0/22:6), Taurolithocholic acid and Uric acid, which were positively correlated with the relative abundance of [Eubacterium]_ventriosum_group, Peptococcus Desulfovibrio and Eisenbergiella and negatively correlated with the relative abundance of Acetanaerobacterium, [Eubacterium]_nodatum_group, Anaerovorax, Lachnospiraceae_FCS020_group and UCG-009 (p < 0.05). Down-regulated metabolites included Veratramine, ACar 12:0, ACar 15:0, RPK, XLR11 N-(2-fluoropentyl) isomer, N-Formylkynurenine and Kaempferol, which were negatively correlated with the relative abundance of [Eubacterium]_ventriosum_ group, Peptococcus, Desulfovibrio and Eisenbergiella and positively correlated with the relative abundance of Acetanaerobacterium, [Eubacterium]_nodatum_group, Anaerovorax, Lachnospiraceae_FCS020_group and UCG-009 (p < 0.05) (Figure 7b).
At the 35-day-old point, up-regulated metabolites included Gedunin, (2E,4E)-N-[2-(4-hydroxyphenyl)ethyl]dodeca-2,4-dienamide, N-Stearoyl taurine, N-allyl-2-(2-methyl-1-benzofuran-3-yl)acetamide, Artemisinin, Jervine, tetranor-PGDM, Linalool, 4-decyl-3-hydroxy-5-oxooxolane-2, 3-dicarboxylic acid, LPG 18:3, 1,4-dihydroxy-1,4-dimethyl-7-(propan-2-ylidene)-decahydroazulen-6-one, 11-Ketoetiocholanolone, 19-Nortestosterone and Epinephrine, which were positively correlated with the relative abundance of Oscillibacter, Oscillospira, Hydrogenoanaerobacterium and UCG-009 and negatively correlated with the relative abundance of Hungatella, Paraeggerthella and Terrisporobacter (p < 0.05). Down-regulated metabolites included 2-Amino-1,3,4-octadecanetriol, LysoPE 18:0, 2-Acetylpyridine, N1-(4-cyclohexylphenyl)-2-[(4-methylphenyl)thio]acetamide, Dl-3,4-Dihydroxymandelic Acid, 2-{2-oxo-2-[(2-oxo-3-azepanyl)amino]ethoxy}acetic acid, Prolylleucine, Dithranol, 1-[(3,5-dimethylisoxazol-4-yl)sulfonyl]piperidine and 6-Methylquinoline, which were negatively correlated with the relative abundance of Oscillibacter, Oscillospira, Hydrogenoanaerobacterium and UCG-009 and positively correlated with the relative abundance of Hungatella, Paraeggerthella and Terrisporobacter (p < 0.05) (Figure 7c).

4. Discussion

Microbiota in the colon produce SCFAs by fermenting incompletely degraded carbohydrates. SCFAs are used as a source of energy for colon cells [25] and microbiota [26], but also have potent immunological properties. SCFAs can affect cytokine production by epithelial cells and can also influence the T cell response [27,28,29]. For instance, the concentration of acetic acid is crucial, and acetic acid increases the proliferation of intestinal-like tissue [30]. Propionate promotes the migration of intestinal epithelial cells [31]. Butyric acid provides energy to the intestinal epithelium and maintains the integrity of the intestinal mucosa [32]. Jiao et al. found that intestinal contents in the goat cecum and colon had a greater potential to digest fiber than those in the jejunum and ileum under the same substrate (NDF) and cellulose conditions [33]. In this study, feeding lambs a 1.0 NDF/starch ratio before weaning was more conducive to volatile acid production, probably because high NDF levels facilitated early rumen development. Previous studies by our group have also shown that there is an upward trend in feed intake at the 1.0 ratio. In addition, it was also found that the low nutrient digestibility of 1.0 ratio, and, thus, more nutrients entering the back end of the digestive tract (colon), caused a significant increase in TVFA production [18]. However, after weaning, the concentration of volatile acid in the 1.0 ratio basically stabilized, and even the total acid was lower than before weaning, probably because the rumen function in the 1.0 ratio group was established faster and better developed, which was more conducive to the degradation and utilization of fibrous material in the rumen, so the amount of fibrous material entering the hindgut was reduced, the substrate available to the colonic microorganisms was reduced and the production of volatile acid was lower. We further analyzed the correlation between the top 20 microorganisms at the genus level and fermentation parameters and found that 15 of these genera were associated with volatile acids, which also suggests that changes in the colonic flora of lambs are closely related to colonic fermentation parameters.
In order to obtain the composition of the colonic digestive microbiota and its metabolites at different NDF/starch ratios, we used a combination of deep sequencing of the 16SrDNA gene and metabolomics techniques and found that the dominant phylum identified by feeding different ratios of NDF/starch starter was Bacteroidetes and Firmicutes, which is consistent with previous studies [34,35]. Firmicutes mainly functions through the many genes they carry that encode enzymes related to energy metabolism, further producing many digestive enzymes that break down various substances and can facilitate the digestion and use of fiber by the host [36,37]. Bacteroidetes are mainly responsible for the degradation of carbohydrates and proteins. Before and after weaning, the sum of the dominant phyla in the 1.0 group was higher than in the 0.5 group, indicating that feeding the 1.0 ratio of open feed was more beneficial to the digestion and utilization of fiber in the starter by the lambs. Feeding diets with different non-structural carbohydrates/crude proteins (NSC/CP) caused changes in the structure of the water buffalo gut microbiota. Among them, Anabaena phylum, thick-walled phylum and Aspergillus phylum were the most abundant phyla in all gut sites; this result was particularly evident in the large intestine. This suggests that diet can strongly influence the microbiota at different gut sites [38]. In addition, we observed a high relative abundance of Blautia, a member of the thick-walled bacterium family Trichodermaceae, which converts undigested carbohydrates and proteins into acetic acid, which then produces energy for the organism, with anti-inflammatory effects and the ability to improve the host intestinal environment and lipid metabolism [39]. In this experiment, it is possible that the influence of the composition of the diet allowed undegraded fiber-like material to act as part of the hindgut substrate, promoting Blautia multiplication. Desulfobacterota is often considered to be a sulfate-reducing bacterium with the potential to utilize sulfate mucin and is positively associated with the degradation of dietary fiber [40]. The relative abundance of Desulfobacterota decreased in both groups after weaning compared to the pre-weaning period, probably due to the maturing rumen of lambs and the increased utilization of fiber in the feed, resulting in a lower concentration of substrate available to hindgut SCFA-producing bacteria and a relative decrease in the number of SCFA-producing bacteria. The relative abundance was lower in the 1.0 group before weaning, probably due to an increase in the number of fibro-degrading bacteria such as Blautia, which competed for the same substrate and inhibited Desulfobacterota multiplication. The Lachnospiraceae_FCS020_group and the Eubacterium nodatum group are mainly responsible for the degradation of indigestible carbohydrates in the diet, the production of SCFAs and the maintenance of normal physiological functions in the animal’s intestine. It has been shown that 5% addition of by-products (soybean hull and beet pulp) promotes digestibility and results in positive changes in hindgut fermentation and bacteria, as evidenced by a linear increase in the proportion of propionate and the relative abundance of the phyla Bacteroidetes, Lachnospiraceae, and unclassified _f_ Lachnospiraceae in the feces of dairy cows with an increase in by-products added to the ration, which is in agreement with the results in the present study [41]. Reduced colonization of the gut with SCFA-producing bacteria may further lead to lower SCFAs production in the lamb colon. The higher relative abundance of Lachnospiraceae_FCS020_group and Eubacterium nodatum group in the 1.0 group before weaning coincided with the higher volatile acid concentration in the 1.0 group of lambs before weaning. Phascolarctobacterium belongs to the Firmicutes and is found to be a large producer of acetic or propionic acid [42,43]. Subdoligranulum is virtually absent in obese and diabetic patients and is significantly reduced in intestinal microorganisms in patients with inflammatory bowel disease, whereas it is systematically present in healthy individuals [44,45]. In this study, it was found that the relative abundance of Phascolarctobacterium decreased in both groups after weaning, which may be one of the reasons for the decrease in propionic acid concentration. The relative abundance of Subdoligranulum was reduced in the 0.5 group. The above reduction in bacterial counts may reflect some possible adverse effects on the colonic environment of lambs fed the 0.5 NDF/starch ratio starter as the age increases, but further analysis of the specific effects is required.
The metabolomics data showed an effect on lamb colonic metabolite concentrations after feeding lambs with different NDF/starch ratios of starter, suggesting that changes in colonic metabolites may be related to the activity of colonic microbes and that changes in the relative abundance of microbes cause changes in metabolites. In the present trial, prior to weaning, lambs fed a 1.0 NDF/starch ratio starter were more enriched in colonic metabolites to metabolic pathways such as Butanoate metabolism, alanine, aspartate and glutamate metabolism and cAMP signaling pathway. We performed a differential metabolite screen using VIP > 2.2 as a criterion and found that, before weaning, up-regulated anti-inflammatory-related metabolites such as those belonging to bile acids, alcohols and derivatives and fatty acid esters in the B35 group, compared to A35, were positively correlated with lower relative abundance of genera such as [Eubacterium]_ventriosum_group and Desulfovibrio. After weaning, the higher relative abundance of genera in the B56 group was positively correlated with the down-regulation of anti-inflammatory-related metabolites belonging to benzenoid, lipids and lipid-like molecules in B56. Lithocholic acid is a classical secondary bile acid formed by the metabolism of the intestinal microbiota. Lithocholic acid and taurocholic acid activate the transmembrane G protein-coupled receptor 5 [46], which inhibits the production of a number of cytokines and may be involved in the regulation of the immune response in the intestine [47]. Microbial dysbiosis triggers a decrease in the production of bile acids, which, in turn, leads to a loss of anti-inflammatory effects on intestinal epithelial cells [48]. Oleanolic acid and phloretin improve intestinal inflammation, modulate colonic inflammatory cytokines, restore intestinal barrier integrity and maintain immune homeostasis [49,50,51]. The main effects of LysoPA are to stimulate cell growth, prevent apoptosis, regulate the actin cytoskeleton and modulate cell shape [52]. In this study, the above metabolites showed higher concentrations in the B35 group before weaning, indicating that feeding 1.0 ratio of starter was more effective in maintaining intestinal homeostasis and improving intestinal health. 2-amino-1,3,4-octadecanetriol is involved in many important cellular responses, including apoptosis, differentiation and migration [53,54]. lysoPE may play a pathological role in the induction of fatty liver disease [55]. The above two anti-inflammatory-related metabolites were found in higher concentrations in the 1.0 ratio group after weaning. Gedunin, linalool, artemisinin and jervine have been found to have various biological activities such as anti-microbial, anti-inflammatory and cytotoxic effects [56,57,58]. In the present study, the concentrations of the above metabolites increased in the 0.5 proportion group after weaning. It can be seen that, after weaning, only a small amount of metabolite concentrations related to anti-inflammation increased in the top 20 VIP values between the two groups, and there was not much difference between the two groups. Moreover, after reaching 56 days of age, feed intake and daily weight gain tended to non-significant levels between the two groups, probably because the differences between the two groups become smaller or even non-existent as the age increases and the rumen function improves, but further research is needed. Traditional feeding practices suggest that lamb starters are generally high concentrate diets; however, appropriate roughage can promote early development of lambs both physically and chemically, allowing lambs to achieve early weaning faster, improving feed intake and performance, which is conducive to lamb growth and development. At the same time, the addition of appropriate roughage can reduce the cost of production. However, more in-depth studies are needed to investigate the effects of metabolites and the presence or absence of inflammation in lambs.

5. Conclusions

Microbiomic and metabolomic results suggest that feeding starter rations containing a 1.0 ratio may be more effective in regulating microbial fermentation, leading to an increase in beneficial microbiota and metabolites, thus improving colonic environmental homeostasis in pre- and post-weaning lambs. This is characterized by an increase in pre-weaning volatile acid concentrations, an increase in the proportion of dominant bacteria, an enrichment in SCFA-producing bacteria and an up-regulation of several anti-inflammatory-related metabolites such as lithocholic acid, oleanolic acid and LysoPA. After weaning, the number of differential microorganisms and anti-inflammatory-related metabolites decreased between the two ratios, and production performance tended to be the same between the two groups. Appropriately adjusting the carbohydrate composition of the starter, thus regulating microbial fermentation and increasing the beneficial microbiota and metabolites, is more conducive to the healthy growth of the lamb’s intestinal tract.

Supplementary Materials

The following supporting information can be downloaded at: https://www.mdpi.com/article/10.3390/fermentation9110935/s1, Table S1: QC stat and AMOVA analysis(16S); Table S2: Differences in microorganisms at the Phylum level (between groups); Table S3: Differences in microorganisms at the Genus level (between groups); Table S4: Identification of differential metabolites (between groups A56 and B56, and between groups A35 and B35); Table S5: Identification results of differential metabolites (between groups A56 and B56, and between groups A35 and B35) (VIP > 2.2).

Author Contributions

X.W. and X.H. designed the study. H.Z., G.L., F.L. and X.P. performed the experiments and collected the samples. X.H. and F.Y. analyzed the data, X.W. and X.H. wrote the manuscript. All authors have read and agreed to the published version of the manuscript.

Funding

This research was funded by National Natural Science Foundation of China (31760682); Discipline Team Project of Gansu Agricultural University under Grant (No. GAU-XKTD-2022-24).

Institutional Review Board Statement

The animal study was reviewed and approved by Livestock Care Committee of Gansu Agricultural University (Approval No.GAU-LC-2020-27).

Informed Consent Statement

Not applicable.

Data Availability Statement

The data presented in this study are available on request from the corresponding author.

Conflicts of Interest

The authors declare no conflict of interest.

References

  1. Ekanayake, L.J.; Corner-Thomas, R.; Cranston, L.; Kenyon, P.; Morris, S. A comparison of live weight gain of lambs weaned early onto a herb-clover mixed sward and weaned conventionally onto a ryegrass-clover pasture. Asian-Australas. J. Anim. Sci. 2018, 32, 201–208. [Google Scholar] [CrossRef]
  2. Ekiz, B.; Kocak, O.; Yalcintan, H.; Yilmaz, A. Effects of suckling duration on growth, slaughtering and carcass quality characteristics of Kivircik lambs. Trop. Anim. Health Prod. 2015, 48, 395–401. [Google Scholar] [CrossRef] [PubMed]
  3. Chai, J.; Diao, Q.; Wang, H.; Tu, Y.; Tao, X.; Zhang, N. Effects of weaning age on growth, nutrient digestibility and metabolism, and serum parameters in Hu lambs. Anim. Nutr. 2015, 1, 344–348. [Google Scholar] [CrossRef] [PubMed]
  4. Montoro, C.; Miller-Cushon, E.K.; DeVries, T.J.; Bach, A. Effect of physical form of forage on performance, feeding behavior, and digestibility of Holstein calves. J. Dairy Sci. 2013, 96, 1117–1124. [Google Scholar] [CrossRef] [PubMed]
  5. Cavallini, D.; Raspa, F.; Marliani, G.; Nannoni, E.; Martelli, G.; Sardi, L.; Valle, E.; Pollesel, M.; Tassinari, M.; Buonaiuto, G. Growth Performance and Feed Intake Assessment of Italian Holstein Calves Fed a Hay-Based Total Mixed Ration: Preliminary Steps towards a Prediction Model. Vet. Sci. 2023, 10, 554. [Google Scholar] [CrossRef]
  6. Li, C.; Wang, W.; Liu, T.; Zhang, Q.; Wang, G.; Li, F.; Li, F.; Yue, X.; Li, T. Effect of early weaning on the intestinal microbiota and expression of genes related to barrier function in lambs. Front. Microbiol. 2018, 9, 1431. [Google Scholar] [CrossRef]
  7. Liu, P.; Li, Y.; Zhang, C.; Cai, X.; Li, C.; Guo, Y. Changes in rumen fermentation and microbiota before and after early weaning of lake sheep lambs. China Anim. Husb. Vet. Med. 2021, 48, 144–153. [Google Scholar]
  8. Kim, M.; Morrison, M.; Yu, Z. Status of the phylogenetic diversity census of ruminal microbiomes. FEMS Microbiol. Ecol. 2011, 76, 49–63. [Google Scholar] [CrossRef]
  9. Creevey, C.J.; Kelly, W.J.; Henderson, G.; Leahy, S.C. Determining the culturability of the rumen bacterial microbiome. Microb. Biotechnol. 2014, 7, 467–479. [Google Scholar] [CrossRef]
  10. Jiao, J.; Lu, Q.; Tan, Z.; Guan, L.; Zhou, C.; Tang, S.; Han, X. In vitro evaluation of effects of gut region and fiber structure on the intestinal dominant bacterial diversity and functional bacterial species. Anaerobe 2014, 28, 168–177. [Google Scholar] [CrossRef] [PubMed]
  11. Mowat, A.M.; Agace, W.W. Regional specialization within the intestinal immune system. Nat. Rev. Immunol. 2014, 14, 667–685. [Google Scholar] [CrossRef]
  12. Guo, T.; Wang, Z.L.; Guo, L.; Li, F.; Li, F. Effects of supplementation of nonforage fiber source in diets with different starch levels on growth performance, rumen fermentation, nutrient digestion, and microbial flora of Hu lambs. Transl. Anim. Sci. 2021, 5, txab065. [Google Scholar] [CrossRef] [PubMed]
  13. Chen, X.; Yan, F.; Liu, T.; Zhang, Y.; Li, X.; Wang, M.; Zhang, C.; Xu, X.; Deng, L.; Yao, J.; et al. Ruminal Microbiota Determines the High-Fiber Utilization of Ruminants: Evidence from the Ruminal Microbiota Transplant. Microbiol. Spectr. 2022, 10, e0044622. [Google Scholar] [CrossRef] [PubMed]
  14. Pang, X.; Lv, F.; Wang, X.; Liu, G.; Li, C.; Zhao, H. Effects of feeding different neutral detergent fibre levels of open diet on growth performance and nutrient apparent digestibility of lambs from 7 to 56 days of age. J. Anim. Nutr. 2021, 33, 4175–4182. [Google Scholar]
  15. Zhao, H.; Lv, F.; Liu, G.; Pang, X.; Han, X.; Wang, X. Effects of starters with different NDF/starch ratio on rumen fermentation parameters and rumen microorganisms in lambs. Front. Vet. Sci. 2023, 26, 1064774. [Google Scholar] [CrossRef]
  16. Gressley, T.F.; Hall, M.B.; Armentano, L.E. Ruminant Nutrition Symposium: Productivity, digestion, and health responses to hindgut acidosis in ruminants. J. Anim. Sci. 2011, 89, 1120–1130. [Google Scholar] [CrossRef]
  17. Cheng, Y.; Dong, P.; Li, R. Interpretation on the 2018 version of Gansu Provincial Measures for the Management of Laboratory Animals (for Trial Implementation). In Proceedings of the 17th Western China Laboratory Animal Management and Academic Symposium, Lanzhou, China, 18 January 2018. [Google Scholar]
  18. Liu, G.H. Effects of Different Ratio of Starch and NDF on Productivity and Digestive Traction Development of Lambs; Gansu Agricultural University: Lanzhou, China, 2021. [Google Scholar]
  19. Xiong, B.; Pang, Z.; Luo, Q. A note on the development of China’s feed composition and nutritional value tables (21st edition, 2010). China Feed. 2010, 21, 33. [Google Scholar]
  20. Zhang, Y.K.; Zhang, X.X.; Li, F.D.; Li, C.; Li, G.Z.; Zhang, D.Y.; Song, Q.Z.; Li, X.L.; Zhao, Y.; Wang, W.M. Characterization of the rumen microbiota and its relationship with residual feed intake in sheep. Animal 2021, 15, 100161. [Google Scholar] [CrossRef]
  21. Edgar, R.C. UPARSE: Highly accurate OTU sequences from microbial amplicon reads. Nat. Methods 2013, 10, 996–998. [Google Scholar] [CrossRef]
  22. Quast, C.; Pruesse, E.; Yilmaz, P.; Gerken, J.; Schweer, T.; Yarza, P.; Peplies, J.; Glöckner, F.O. The SILVA ribosomal RNA gene database project: Improved data processing and web-based tools. Nucl. Acids Res. 2012, 41, D590–D596. [Google Scholar] [CrossRef]
  23. Boulesteix, A.L.; Strimmer, K. Partial least squares: A versatile tool for the analysis of high-dimensional genomic data. Brief. Bioinform. 2007, 8, 32–44. [Google Scholar] [CrossRef] [PubMed]
  24. Wang, J.B.; Pu, S.B.; Sun, Y.; Li, Z.F.; Niu, M.; Yan, X.Z.; Zhao, Y.L.; Wang, L.F.; Qin, X.M.; Ma, Z.J.; et al. Metabolomic Profiling of Autoimmune Hepatitis: The Diagnostic Utility of Nuclear Magnetic Resonance Spectroscopy. J. Proteome Res. 2014, 13, 3792–3801. [Google Scholar] [CrossRef] [PubMed]
  25. Rivière, A.; Selak, M.; Lantin, D.; Leroy, F.; De Vuyst, L. Bifidobacteria and Butyrate-Producing Colon Bacteria: Importance and Strategies for Their Stimulation in the Human Gut. Front. Microbiol. 2016, 28, 979. [Google Scholar] [CrossRef] [PubMed]
  26. Donohoe, D.R.; Garge, N.; Zhang, X.; Sun, W.; O’Connell, T.M.; Bunger, M.K.; Bultman, S.J. The Microbiome and Butyrate Regulate Energy Metabolism and Autophagy in the Mammalian Colon. Cell Metab. 2011, 13, 517–526. [Google Scholar] [CrossRef]
  27. Iraporda, C.; Errea, A.; Romanin, D.E.; Cayet, D.; Pereyra, E.; Pignataro, O.; Sirard, J.C.; Garrote, G.L.; Abraham, A.G.; Rumbo, M. Lactate and Short Chain Fatty Acids Produced by Microbial Fermentation Downregulate Proinflammatory Responses in Intestinal Epithelial Cells and Myeloid Cells. Immunobiology 2015, 220, 1161–1169. [Google Scholar] [CrossRef] [PubMed]
  28. Macia, L.; Tan, J.; Vieira, A.T.; Leach, K.; Stanley, D.; Luong, S.; Maruya, M.; McKenzie, C.I.; Hijikata, A.; Wong, C. Metabolite-Sensing Receptors GPR43 and GPR109A Facilitate Dietary Fibre-Induced Gut Homeostasis through Regulation of the Inflamma-some. Nat. Commun. 2015, 6, 6734. [Google Scholar] [CrossRef]
  29. Park, J.; Kim, M.; Kang, S.G.; Jannasch, A.H.; Cooper, B.; Patterson, J.; Kim, C.H. Short-Chain Fatty Acids Induce Both Effector and Regulatory T Cells by Suppression of Histone Deacetylases and Regulation of the MTOR–S6K Pathway. Mucosal Immunol. 2015, 8, 80–93. [Google Scholar] [CrossRef]
  30. Pearce, S.C.; Weber, G.J.; van Sambeek, D.M.; Soares, J.W.; Racicot, K.; Breault, D.T. Intestinal enteroids recapitulate the effects of short-chain fatty acids on the intestinal epithelium. PLoS ONE 2020, 15, e0230231. [Google Scholar] [CrossRef]
  31. Bilotta, A.J.; Ma, C.; Yang, W.; Yu, Y.; Yu, Y.; Zhao, X.; Zhou, Z.; Yao, S.; Dann, S.M.; Cong, Y. Propionate Enhances Cell Speed and Persistence to Promote Intestinal Epithelial Turnover and Repair. Cell Mol. Gastroenterol. Hepatol. 2021, 11, 1023–1044. [Google Scholar] [CrossRef]
  32. Saleri, R.; Borghetti, P.; Ravanetti, F.; Cavalli, V.; Ferrari, L.; De Angelis, E.; Andrani, M.; Martelli, P. Effects of different short-chain fatty acids (SCFA) on gene expression of proteins involved in barrier function in IPEC-J2. Porcine Health Manag. 2022, 8, 21. [Google Scholar] [CrossRef]
  33. Jiao, J.; Wang, P.; He, Z.; Tang, S.; Zhou, C.; Han, X.; Wang, M.; Wu, D.; Kang, J.; Tan, Z. In vitro evaluation on neutral detergent fiber and cellulose digestion by post-ruminal microorganisms in goats. J. Sci. Food Agric. 2014, 94, 1745–1752. [Google Scholar] [CrossRef]
  34. Wang, L.; Jin, L.; Xue, B.; Wang, Z.; Peng, Q. Characterizing the bacterial community across the gastrointestinal tract of goats: Composition and potential function. Microbiologyopen 2019, 8, e00820. [Google Scholar] [CrossRef] [PubMed]
  35. Zeng, Y.; Zeng, D.; Zhang, Y.; Ni, X.; Tang, Y.; Zhu, H.; Wang, H.; Yin, Z.; Pan, K.; Jing, B. Characterization of the cellulolytic bacteria communities along the gastrointestinal tract of Chinese Mongolian sheep by using PCR-DGGE and real-time PCR analysis. World J. Microbiol. Biotechnol. 2015, 31, 1103–1113. [Google Scholar] [CrossRef] [PubMed]
  36. Kaakoush, N.O. Insights into the Role of Erysipelotrichaceae in the Human Host. Front. Cell. Infect. Mi. 2015, 5, 84. [Google Scholar] [CrossRef]
  37. Wang, J.; Fan, H.; Han, Y.; Zhao, J.; Zhou, Z. Characterization of the microbial communities along the gastrointestinal tract of sheep by 454 pyrosequencing analysis. Asian-Australas. J. Anim. Sci. 2017, 30, 100–110. [Google Scholar] [CrossRef]
  38. Paradiso, R.; Borriello, G.; Bolletti Censi, S.; Salzano, A.; Cimmino, R.; Galiero, G.; Fusco, G.; De Carlo, E.; Campanile, G. Different Non-Structural Carbohydrates/Crude Proteins (NCS/CP) Ratios in Diet Shape the Gastrointestinal Microbiota of Water Buffalo. Vet. Sci. 2021, 8, 96. [Google Scholar] [CrossRef]
  39. Hosomi, K.; Saito, M.; Park, J.; Murakami, H.; Shibata, N.; Ando, M.; Nagatake, T.; Konishi, K.; Ohno, H.; Tanisawa, K.; et al. Oral administration of Blautia wexlerae ameliorates obesity and type 2 diabetes via metabolic remodeling of the gut microbiota. Nat. Commun. 2022, 13, 4477. [Google Scholar] [CrossRef]
  40. Li, N.; Huang, S.; Jiang, L.; Dai, Z.; Li, T.; Han, D.; Wang, J. Characterization of the Early LifeMicrobiota Development and Predominant Lactobacillus Species at Distinct Gut Segments of Low- and Normal-Birth-Weight Piglets. Front. Microbiol. 2019, 10, 797. [Google Scholar]
  41. Lyu, J.; Yang, Z.; Wang, E.; Liu, G.; Wang, Y.; Wang, W.; Li, S. Possibility of Using By-Products with High NDF Content to Alter the Fecal Short Chain Fatty Acid Profiles, Bacterial Community, and Digestibility of Lactating Dairy Cows. Microorganisms 2022, 10, 1731. [Google Scholar] [CrossRef]
  42. Watanabe, Y.; Nagai, F.; Morotomi, M. Characterization of Phascolarctobacterium succinatutens sp. nov., an asaccharolytic, succinate-utilizing bacterium isolated from human feces. Appl. Environ. Microbiol. 2012, 78, 511–518. [Google Scholar] [CrossRef]
  43. Wu, F.; Guo, X.; Zhang, J.; Zhang, M.; Ou, Z.; Peng, Y. Phascolarctobacterium faecium abundant colonization in human gastrointestinal tract. Exp. Ther. Med. 2017, 14, 3122–3126. [Google Scholar] [CrossRef]
  44. Le Roy, T.; Moens de Hase, E.; Van Hul, M.; Paquot, A.; Pelicaen, R.; Régnier, M.; Depommier, C.; Druart, C.; Everard, A.; Maiter, D.; et al. Dysosmobacter welbionis is a newly isolated human commensal bacterium preventing diet-induced obesity and metabolic disorders in mice. Gut 2022, 71, 534–543. [Google Scholar] [CrossRef] [PubMed]
  45. Lloyd-Price, J.; Arze, C.; Ananthakrishnan, A.N.; Schirmer, M.; Avila-Pacheco, J.; Poon, T.W.; Andrews, E.; Ajami, N.J.; Bonham, K.S.; Brislawn, C.J.; et al. Multi-omics of the gut microbial ecosystem in inflammatory bowel diseases. Nature 2019, 569, 655–662. [Google Scholar] [CrossRef] [PubMed]
  46. Maruyama, T.; Miyamoto, Y.; Nakamura, T.; Tamai, Y.; Okada, H.; Sugiyama, E.; Nakamura, T.; Itadani, H.; Tanaka, K. Identification of membrane-type receptor for bile acids (M-BAR). Biochem. Biophys. Res. Commun. 2002, 298, 714–719. [Google Scholar] [CrossRef] [PubMed]
  47. Yoneno, K.; Hisamatsu, T.; Shimamura, K.; Kamada, N.; Ichikawa, R.; Kitazume, M.T.; Mori, M.; Uo, M.; Namikawa, Y.; Matsuoka, K.; et al. Hibi T: TGR5 signalling inhibits the production of pro-inflammatory cytokines by in vitro differentiated inflammatory and intestinal macrophages in Crohn’s disease. Immunology 2013, 139, 19–29. [Google Scholar] [CrossRef]
  48. Li, Y.; Tang, R.; Leung, P.S.C.; Gershwin, M.E.; Ma, X. Bile acids and intestinal microbiota in autoimmune cholestatic liver diseases. Autoimmun. Rev. 2017, 16, 885–896. [Google Scholar] [CrossRef]
  49. Pollier, J.; Goossens, A. Oleanolic acid. Phytochemistry 2012, 77, 10–15. [Google Scholar] [CrossRef] [PubMed]
  50. Castellano, J.M.; Ramos-Romero, S.; Perona, J.S. Oleanolic Acid: Extraction, Characterization and Biological Activity. Nutrients 2022, 14, 623. [Google Scholar] [CrossRef]
  51. Wu, M.; Li, P.; An, Y.; Ren, J.; Yan, D.; Cui, J.; Li, D.; Li, M.; Wang, M.; Zhong, G. Phloretin ameliorates dextran sulfate sodium-induced ulcerative colitis in mice by regulating the gut microbiota. Pharmacol. Res. 2019, 150, 104489. [Google Scholar] [CrossRef] [PubMed]
  52. Qin, J.; Yang, Y.; Du, W.; Li, G.; Wu, Y.; Luo, R.; Liu, S.; Fan, J. The potential value of LC-MS non-targeted metabonomics in the diagnosis of follicular thyroid carcinoma. Front. Oncol. 2022, 12, 1076548. [Google Scholar] [CrossRef]
  53. Jang, E.J.; Shin, Y.; Park, H.J.; Kim, D.; Jung, C.; Hong, J.Y.; Kim, S.; Lee, S.K. Anti-melanogenic activity of phytosphingosine via the modulation of the microphthalmia-associated transcription factor signaling pathway. J. Dermatol. Sci. 2017, 87, 19–28. [Google Scholar] [CrossRef]
  54. Hu, Y.; Wu, Q.; Qiao, Y.; Zhang, P.; Dai, W.; Tao, H.; Chen, S. Disturbances in Metabolic Pathways and the Identification of a Potential Biomarker Panel for Early Cartilage Degeneration in a Rabbit Anterior Cruciate Ligament Transection Model. Cartilage 2021, 13, 1376S–1387S. [Google Scholar] [CrossRef] [PubMed]
  55. Yamamoto, Y.; Sakurai, T.; Chen, Z.; Inoue, N.; Chiba, H.; Hui, S.P. Lysophosphatidylethanolamine Affects Lipid Accumulation and Metabolism in a Human Liver-Derived Cell Line. Nutrients 2022, 14, 579. [Google Scholar] [CrossRef] [PubMed]
  56. Ferraris, F.K.; Moret, K.H.; Figueiredo, A.B.; Penido, C.; Maria das Graças, M.O. Gedunin, a natural tetranortriterpenoid, modulates T lymphocyte responses and ameliorates allergic inflammation. Int. Immunopharmacol. 2012, 14, 82–93. [Google Scholar] [CrossRef]
  57. Conte, F.P.; Ferraris, F.K.; Costa, T.E.; Pacheco, P.; Seito, L.N.; Verri, W.A., Jr.; Cunha, F.Q.; Penido, C.; Henriques, M.G. Effect of gedunin on acute articular inflammation and hypernociception in mice. Molecules 2015, 20, 2636–2657. [Google Scholar] [CrossRef]
  58. Khanfar, M.A.; El Sayed, K.A. The Veratrum alkaloids jervine, veratramine, and their analogues as prostate cancer migration and proliferation inhibitors: Biological evaluation and pharmacophore modeling. Med. Chem. Res. 2013, 10, 4775–4786. [Google Scholar] [CrossRef]
Figure 1. Sequencing results: (a) Venn diagram showing common and specific operational taxonomic units between groups; (b,c) Chao1 and Shannon Index; (d) Sequencing depth analysis; (e) Principal Coordinate Analysis; (f) Non-metric multidimensional scaling analysis. ** p < 0.01 indicate a significant difference.
Fermentation 09 00935 g001
Figure 2. (a) Bacterial taxonomic profile of the colonic content microbiota at the phylum level; (b) Bacterial taxonomic profile of the colonic content microbiota at the generic level.
Fermentation 09 00935 g002
Figure 3. Linear Discriminant Analysis (LDA) value distribution histogram. Species with LDA Score greater than the set value of 4, which are statistically different Biomarker between groups, are shown in the LDA Value Distribution histogram. species with significant differences in abundance between groups are shown, with the length of the histogram representing the magnitude of the effect of the differing species (which is LDA Score). (a) Biomarkers with statistically significant differences between groups A35 and B35; (b) Biomarkers with statistically significant differences between groups A56 and B56; (c) Biomarkers with statistically significant differences between groups A35 and A56; (d) Biomarkers with statistically significant differences between groups B35 and B56.
Fermentation 09 00935 g003
Figure 4. (a) Relative abundance of the dominant pathways annotated to KEGG level 1; (b) Relative abundance of the dominant pathways annotated to KEGG level 2.
Fermentation 09 00935 g004
Figure 5. Inter-group OPLS-DA model score plot and validation plot (positive ions: (a1d1)). Inter-group OPLS-DA model score plot and validation plot (negative ions: (a2d2)). Scatterplot of OPLS-DA scores: horizontal coordinates are the scores of the samples on the first principal component; vertical coordinates are the scores of the samples on the second principal component; R2Y denotes the explanatory rate of the model, Q2Y is used to evaluate the predictive ability of the OPLS-DA model, and the model is well-built when R2Y is larger than Q2Y, the scatters of different colours denote the samples in different experimental subgroups, and the ellipses are the 95% confidence intervals (a1,b1,a2,b2); Sorting validation plot: horizontal coordinates represent the correlation of randomly grouped Y with the original grouped Y. Vertical coordinates represent the scores of R2 and Q2 (c1,d1,c2,b2).
Fermentation 09 00935 g005aFermentation 09 00935 g005b
Figure 6. Bubble plots of the top 20 KEGG pathways for differential metabolite enrichment before (a) and after weaning (b).
Fermentation 09 00935 g006
Figure 7. (a) Pearson correlation coefficients between genus-level colonic microbiota composition (TOP20) and fermentation parameters. The associations between colonic differential microorganisms and differential metabolites before (b) and after weaning (c) are shown by heat maps. Rows and columns indicate fermentation parameters, microorganisms and metabolites. R values are indicated by color, as shown in the legend on the right. * p < 0.05, ** p < 0.01 indicate a significant correlation between microbial genera, fermentation parameters and metabolites.
Fermentation 09 00935 g007
Table 1. Composition and nutrient levels of starter (air-dry basis).
ItemsStarter
AB
Ingredients, %
Alfalfa 11.5027.00
Mixed energy feed 57.0043.00
Mixed protein feed25.5024.70
Malt root 3.503.50
Limes 1.200.50
Premix1.001.00
NaCl 0.300.30
Total 100100
Nutrient levels
Dry matter (%)89.990.82
Crude protein (%)21.0719.89
Digestible energy (MJ/kg) 13.5813.05
Energy and CP ratio 0.640.66
Starch (%)31.6623.13
NDF (%) 15.8122.19
NDF/Starch 0.501.00
Ca (%) 0.880.84
P (%) 0.330.35
Note: (1) The premix provided the following per kg of starter: VA 940IU, VD 111IU, VB12 0.02 mg, VE 20IU, Cu 8 mg, Fe 25 mg, Mn 40 mg, Zn 40 mg, I 0.3 mg, Se 0.20 mg, S 200 mg and Co 0.1 mg. DM, CP, Ca P and NDF were measured values; digestible energy was calculated according to Table of Feed Composition and Nutritional Value in China (21st edition, 2010) [19]. Mixed energy feed ingredients: corn grain, expanded corn, wheat bran; mixed protein feed: soybean meal, expanded soya bean, corn protein powder.
Table 2. Effect of different ratios of NDF-to-starch starters on the fermentation parameters of lamb colonic contents.
ItemsGroupp Value
A35B35A56B56A35B35A35A56A56B56B35B56
Acetic acid/(mmol/L)12.84720.07927.57519.8830.001<0.0010.0010.835
Propionic acid/(mmol/L)4.6386.0946.6343.6500.001<0.001<0.001<0.001
Butyric acid/(mmol/L)1.7992.0483.0082.2130.023<0.001<0.0010.059
Isobutyric acid/(mmol/L)0.3180.2910.3010.1450.1340.3950.0030.002
Valeric acid/(mmol/L)0.2380.1500.3130.2110.0050.005<0.0010.003
Isovaleric acid/(mmol/L)0.3930.3120.2200.1010.002<0.0010.001<0.001
TVFA/(mmol/L)23.11331.85440.93029.0830.001<0.001<0.0010.072
Disclaimer/Publisher’s Note: The statements, opinions and data contained in all publications are solely those of the individual author(s) and contributor(s) and not of MDPI and/or the editor(s). MDPI and/or the editor(s) disclaim responsibility for any injury to people or property resulting from any ideas, methods, instructions or products referred to in the content.

