Article

Roe Deer Produce Less Methane and Harbor Distinct Gut Microbiota

1
College of Animal Science and Technology, Jilin Agricultural University, Changchun 130118, China
2
Institute of Animal Nutrition and Feed, Jilin Academy of Agricultural Sciences, Changchun 136100, China
3
Jilin Provincial Engineering Research Center for Efficient Breeding and Product Development of Sika Deer, Jilin Agricultural University, Changchun 130118, China
4
Key Laboratory of Animal Production, Product Quality and Security, Ministry of Education, Jilin Agricultural University, Changchun 130118, China
*
Authors to whom correspondence should be addressed.
These authors contributed equally to this work.
Fermentation 2023, 9(2), 186; https://doi.org/10.3390/fermentation9020186
Submission received: 26 January 2023 / Revised: 8 February 2023 / Accepted: 13 February 2023 / Published: 17 February 2023
(This article belongs to the Section Microbial Metabolism, Physiology & Genetics)

Abstract

:
Enteric methane (CH4) is an important greenhouse gas emitted by ruminants. Cervidae produces less CH4 than other ruminants, but the underlying mechanism remains unclear. Here, we measured and compared the gas production, nutrient digestibility, gut microbiota composition, and fermentation characteristics of roe deer (n = 4) and goats (n = 4). After the animals had adapted to the same total mixed ration for 21 days, the gas yield was measured using respiration chambers, and fecal samples were collected. The CH4 yield (g/kg DMI) was significantly lower in roe deer than in goats (p < 0.001), while the difference in carbon dioxide yield was not significant (p > 0.05). Roe deer showed lower digestibility of dry matter (p = 0.005), crude protein (p < 0.001), and neutral detergent fiber (p = 0.02) than goats. Principal coordinate analysis revealed that the bacterial and methanogen communities were significantly different between roe deer and goats, indicating a potential role of host genetics. Roe deer and goats showed enrichment of specific key bacterial and methanogen taxa. The relative abundances of Bifidobacterium, Ruminococcus, Succinivibrio, Treponema, Prevotella, Lachnoclostridium, Christensenellaceae R7, and members of the family Lachnospiraceae were higher in roe deer than in goats (p < 0.05). Methanocorpusculum and Methanobrevibacter were dominant methanogens in the guts of roe deer and goats, respectively, but their species compositions differed significantly between the host species. The predicted metabolic pathways, including those for butyrate and propionate, were significantly more abundant in roe deer than in goats (p < 0.05). The molar proportions of propionate and branched volatile fatty acids were significantly higher in roe deer and goats (p < 0.01), respectively. The variation in CH4 yield was characterized by correlations between digestibility, bacteria and methanogens between roe deer and goats, particularly for members within the taxa Lachnospiraceae and Methanosphaera. In summary, our results revealed that gut bacteria and methanogens differ significantly between high- and low-CH4 emitters and identified microbial taxa potentially involved in the mitigation of CH4 production in ruminants.

1. Introduction

Ruminant livestock shares a long history with human society because of their capacity to provide humans with food, mainly milk and meat [1]. It is estimated that global milk production will increase by 63% by 2050 due to the growing global population [2]. With increases in population size and livestock productivity, the global anthropogenic emissions of methane (CH4), one of the most potent greenhouse gases, increased 1.9-fold from 1961 to 2017, accounting for 50–55% of the total gas emissions since 2000 [3]. Importantly, enteric CH4 emissions from ruminant livestock account for approximately 5.8% of anthropogenic CH4 emissions [4]. The global warming potential of CH4 is 28 times greater than that of carbon dioxide (CO2), and the gas has an atmospheric half-life of approximately 12.4 years [3]. Ruminant enteric CH4 production is also associated with feed conversion since 2–12% of the gross dietary energy can be lost due to CH4 production [5,6]. Therefore, reducing CH4 emissions will not only have important environmental implications but also improve the efficiency of ruminant livestock production.
Enteric CH4 from ruminants is a natural byproduct arising from the microbial fermentation of high-fiber plant biomass in the gastrointestinal tract (GIT) [7]. Methanogenic archaea (i.e., methanogens) in the GIT are the keystone species for CH4 formation [8], consuming the substrates (H2, CO2, formate, methylated compounds, and acetate) released by bacteria, protozoa, and fungi to meet their energy needs [6]. The formation of CH4 is also particularly important for maintaining a low partial pressure of H2, facilitating optimal fermentation activity in the GIT [9]. Poulsen et al. (2013) found that the RCC clade (Methanomassiliicoccales) has a high potential as a target for mitigating CH4 emissions from the bovine rumen [10]. Shi et al. (2014) reported elevated relative abundances of Methanosphaera spp. and Methanobrevibacter gottschalkii in the rumen of low- and high-CH4-yield sheep, respectively [11]. Further analysis revealed the enrichment of lactate-producing Sharpea spp. communities, characterized by the utilization and production of lactate, in the low-CH4-yield sheep [12]. These results suggested the possible modification of metabolic cascades by bacteria and methanogens during CH4 production. Indeed, a large-scale study of 1000 cows identified the specific bacteria strongly associated with CH4 production, including members of the family Succinivibrionaceae, Prevotella spp., and the order Bacteroidales [13]. These results showed that the association between GIT bacteria, methanogens, and CH4 emissions differed between low- and high-CH4 emitters.
Host genetics and dietary composition are two main factors affecting the GIT microbiota. It has been reported that individual variations in CH4 production in cows are independently influenced by host genotype and the GIT microbiota (bacteria and methanogens), contributing 21 and 13%, respectively [14]. Recent evidence showed that host phylogeny better explained the archaeal diversity than diet, and the phylogenetic signal was significant and strongest for herbivores [15]. Although strategies directly targeting the methanogen community and methanogenesis pathway by supplementation with structural analogs can reduce CH4 emissions [1], the effect is transient, presumably owing to microbial adaptation [16] and resilience [17]. These results suggested that CH4 emissions are likely affected by ruminant species. It has been reported that deer produce relatively small amounts of CH4 per ingested food unit compared with cattle [18]. Interestingly, roe deer (Capreolus pygargus), a member of the family Cervidae, emits significantly less CH4 than other ruminants [19], providing a unique and native ruminant model for understanding reduced CH4 formation. However, the dietary differences between these ruminant species were not considered, highlighting the importance of evaluating and comparing CH4 emissions and GIT bacteria and methanogens between roe deer and other ruminants under the same dietary conditions. Importantly, a recent study demonstrated that fecal methanogen profiles may be a useful proxy in predicting the daily CH4 and CO2 emissions of beef cattle [20]. Therefore, it is hypothesized that CH4 emissions, fecal bacteria, methanogens, and their relationships are likely distinct between roe deer and other ruminants under the same dietary conditions.
In this study, we analyzed and compared the determinants of CH4 emission between roe deer and goats and were able to show the following: (i) roe deer produced significantly less CH4 than goats; (ii) roe deer and goats enriched specific key bacterial and methanogenic taxa in the GIT, shifting the function toward propionate production in low-methane emitters; and (iii) the difference in CH4 emissions was characterized by a correlation between the microbiota and digestibility.

2. Materials and Methods

2.1. Experimental Animals and Study Design

Body weight (BW) affects methane production [18]. In this study, a total of eight male, two-year-old animals were used (BW = 31.4 ± 1.3 kg), including roe deer (n = 4, BW = 32.13 ± 0.31 kg) and goats (n = 4, BW = 31.73 ± 0.30 kg). Each animal was maintained in an individual open-circuit respiration chamber (length × width × height = 1.70 × 0.83 × 1.40 m3, Figure 1A). The animals were offered a total mixed ration (TMR, concentrate to alfalfa hay ratio = 30:70, dry matter (DM) basis, Table S1) twice daily (at 7:00 a.m. and 16:00 p.m.) and had free access to drinking water. Approximately 10% feed refusal was observed. All animal-specific procedures were approved and authorized by the Animal Ethics Committee of Jilin Agricultural University. After 3 weeks of adaptation to the diet, a formal experiment was conducted from d 22 to d 24 in a respiratory chamber.

2.2. Measurement of Gas Production, Sample Collection, and Analyses

The respiratory chamber was maintained within fixed temperature (22 to 24 °C) and humidity (50 to 70%) ranges by using an air conditioner and a heater installed inside the chamber. The CH4 and CO2 production of roe deer and goats in each respiration chamber was measured daily for 24 h, and recorded at approximately 21 min intervals by an analyzer for a duration of 3 min with residual air flushed before each measurement. The CH4 and CO2 levels were measured with a nondispersive infrared sensor (AGM 10; Sensors Europe GmbH, Erkrath, Germany) at a flow rate of 0.3 L/min. The stainless-steel floor in the respiration chamber included a tray that was used to collect feces for 3 consecutive days before morning feeding. The respiration chamber and plastic screen were cleaned every day. Approximately 5 g of feces from roe deer and goats were collected immediately after defecation each day from d 22 to d 24 and frozen in liquid nitrogen and stored at −80 °C for further analysis. The retained feces were fixed in 10% H2SO4 and then stored in a sealed container at −20 °C for the digestibility trial.
The diet and fecal samples were thawed and dried at 65 °C for 48 h and then ground through a 1 mm sieve before further analysis. Samples were analyzed in duplicate to determine the DM (method No. 934.01), crude protein (CP, method No. 954.01), and ether extract (EE, method No. 920.39), according to AOAC [21]. The levels of neutral detergent fiber (NDF) and acid detergent fiber (ADF) were determined based on the method described by [22]. The volatile fatty acid (VFA) concentrations in feces were measured using gas chromatography (GC) with a flame ionization detector and a DB-FFAP column (30 m × 0.25 μm × 0.25 μm; Agilent Technologies 6890GC, Valencia, CA, USA) according to a previously described method [23].

2.3. DNA Extraction, 16S Ribosomal RNA (16S rRNA) Gene Amplification, and Sequencing

The fecal samples (~200 mg) were used to extract genomic DNA using the MoBio PowerFecal kit (QIAGEN, Valencia, CA, USA) with bead beating using FastPrep-24 (MP Biomedicals, Illkrich, France). The DNA integrity and quantity were determined using 1.0% agarose gel electrophoresis and a NanoDrop ND-1000 instrument (Thermo Scientific, Wilmington, NC, USA). The DNA was stored at −80 °C for later analysis. The bacterial 16S rRNA gene V3-V4 region was amplified using the primers 341F (5′-CCTACGGGAGGCAGCAG-3′) and 806R (5′-GGACTACHVGGGTWTCTAAT-3′) [24]. The primer sets met86F and met1340R were used to amplify the full-length 16S rRNA gene of methanogens from the genomic DNA for each sample [25], where both the forward and reverse 16S primers were tailed with an eight-base barcode sequence to each sample. The resulting amplicons were purified using a QIAquick PCR Purification Kit (QIAGEN, Valencia, CA, USA), and the purified amplicons were quantified by Qubit 3.0, and then pooled in equimolar concentrations. For the bacterial 16S rRNA gene, the purified PCR amplicons were then used to construct the Illumina paired-end library and then were sequenced on an Illumina MiSeq platform to produce 250 bp paired-end reads. For the methanogen 16S rRNA gene, SMRTbell libraries were prepared from the amplified DNA by blunt ligation according to the manufacturer’s instructions (Pacific Biosciences, New York, NY, USA). The purified SMRTbell libraries were sequenced on PacBio with sequencing 2.0 chemistry. The circular consensus sequences (ccs) were generated from raw PacBio sequencing data using the SMRT Link Analysis software version 9.0 with a minimum predicted accuracy = 0.99 and a minimum number of passes = 3.

2.4. Bioinformatics and Statistical Analyses

For the bacterial 16S rRNA sequences, the paired-end sequences were assembled into contigs using FLASH [26], which were applied to quality control using Trimmomatic software v0.39 [27] according to the following criteria: sequences with an average quality < 25 over a 50 bp sliding window were rejected; the minimum quality score was 25; the maximum number of errors in the barcode was 0; the maximum length of homopolymer run was 6; the number of mismatches in the primer was 0; ambiguous and unassigned characters were excluded. The obtained sequences were then analyzed using QIIME v1.9.1 [28]. Briefly, the bacterial 16S rRNA sequences and methanogen ccs sequences were clustered into operational taxonomic units (OTUs) using UPARSE at 97 and 98.65% sequence similarity, respectively [29], and the possible chimeric sequences were removed using UCHIME [30]. The representative sequences of each OTU were assigned against the SILVA database (SSU138.1), using the RDP classifier with a confidence threshold of 0.8 [31]. The alpha diversity indices including Shannon, Simpson, Chao1, and Good’s coverage were also calculated using QIIME v1.9.1. The phylogenetic investigation of communities by reconstruction of unobserved states (PICRUSt) was applied to predict the potential functions [32], and summarized according to the Kyoto Encyclopedia of Genes and Genomes (KEGG) pathways.
Principal coordinate analysis (PCoA) was used to compare the bacterial and methanogen communities of roe deer and goat feces based on unweighted UniFrac distance, weighted UniFrac distance, and Bray–Curtis dissimilarity matrix. Analysis of similarities (ANOSIM) was applied to calculate group similarity. Adonis was used to analyze the strengths and significance of microbial communities between roe deer and goats. The p-values were determined by 999 permutations.
The gas yields, apparent digestibility, diversity indices, relative abundances of bacteria or methanogens, and KEGG pathways in roe deer and goats were analyzed using the Mann–Whitney test in SPSS 26.0 (IBM, Armonk, NY, USA). Significance was determined based on the Benjamini–Hochberg corrected p-value (false discovery rate < 0.05). The values are expressed as the mean ± standard error (SE) unless otherwise stated.

2.5. Co-occurrence Network of the Fecal Microbiota, Digestibility, and Gas Yields

To identify taxa significantly associated with the digestibility of DM, NDF, and CP and with the CH4 and CO2 yields in roe deer and goats, we calculated the point biserial correlation coefficient with the r.g function and set the significance criteria to p < 0.05 and R > 0.7. Cytoscape (version 3.9.1) was used to visualize association networks with the Radial [33] radial layout algorithm, whereby taxa, digestibility, and gas production were represented as nodes, and edges were weighted on the basis of positive or negative associations between the nodes. CentiScaPe 2.2 was used to analyze the network parameters, including average distance, betweenness, and degree [34]. Then, molecular complex detection (MCODE) was applied to detect densely connected networks in the interaction networks [35].

3. Results

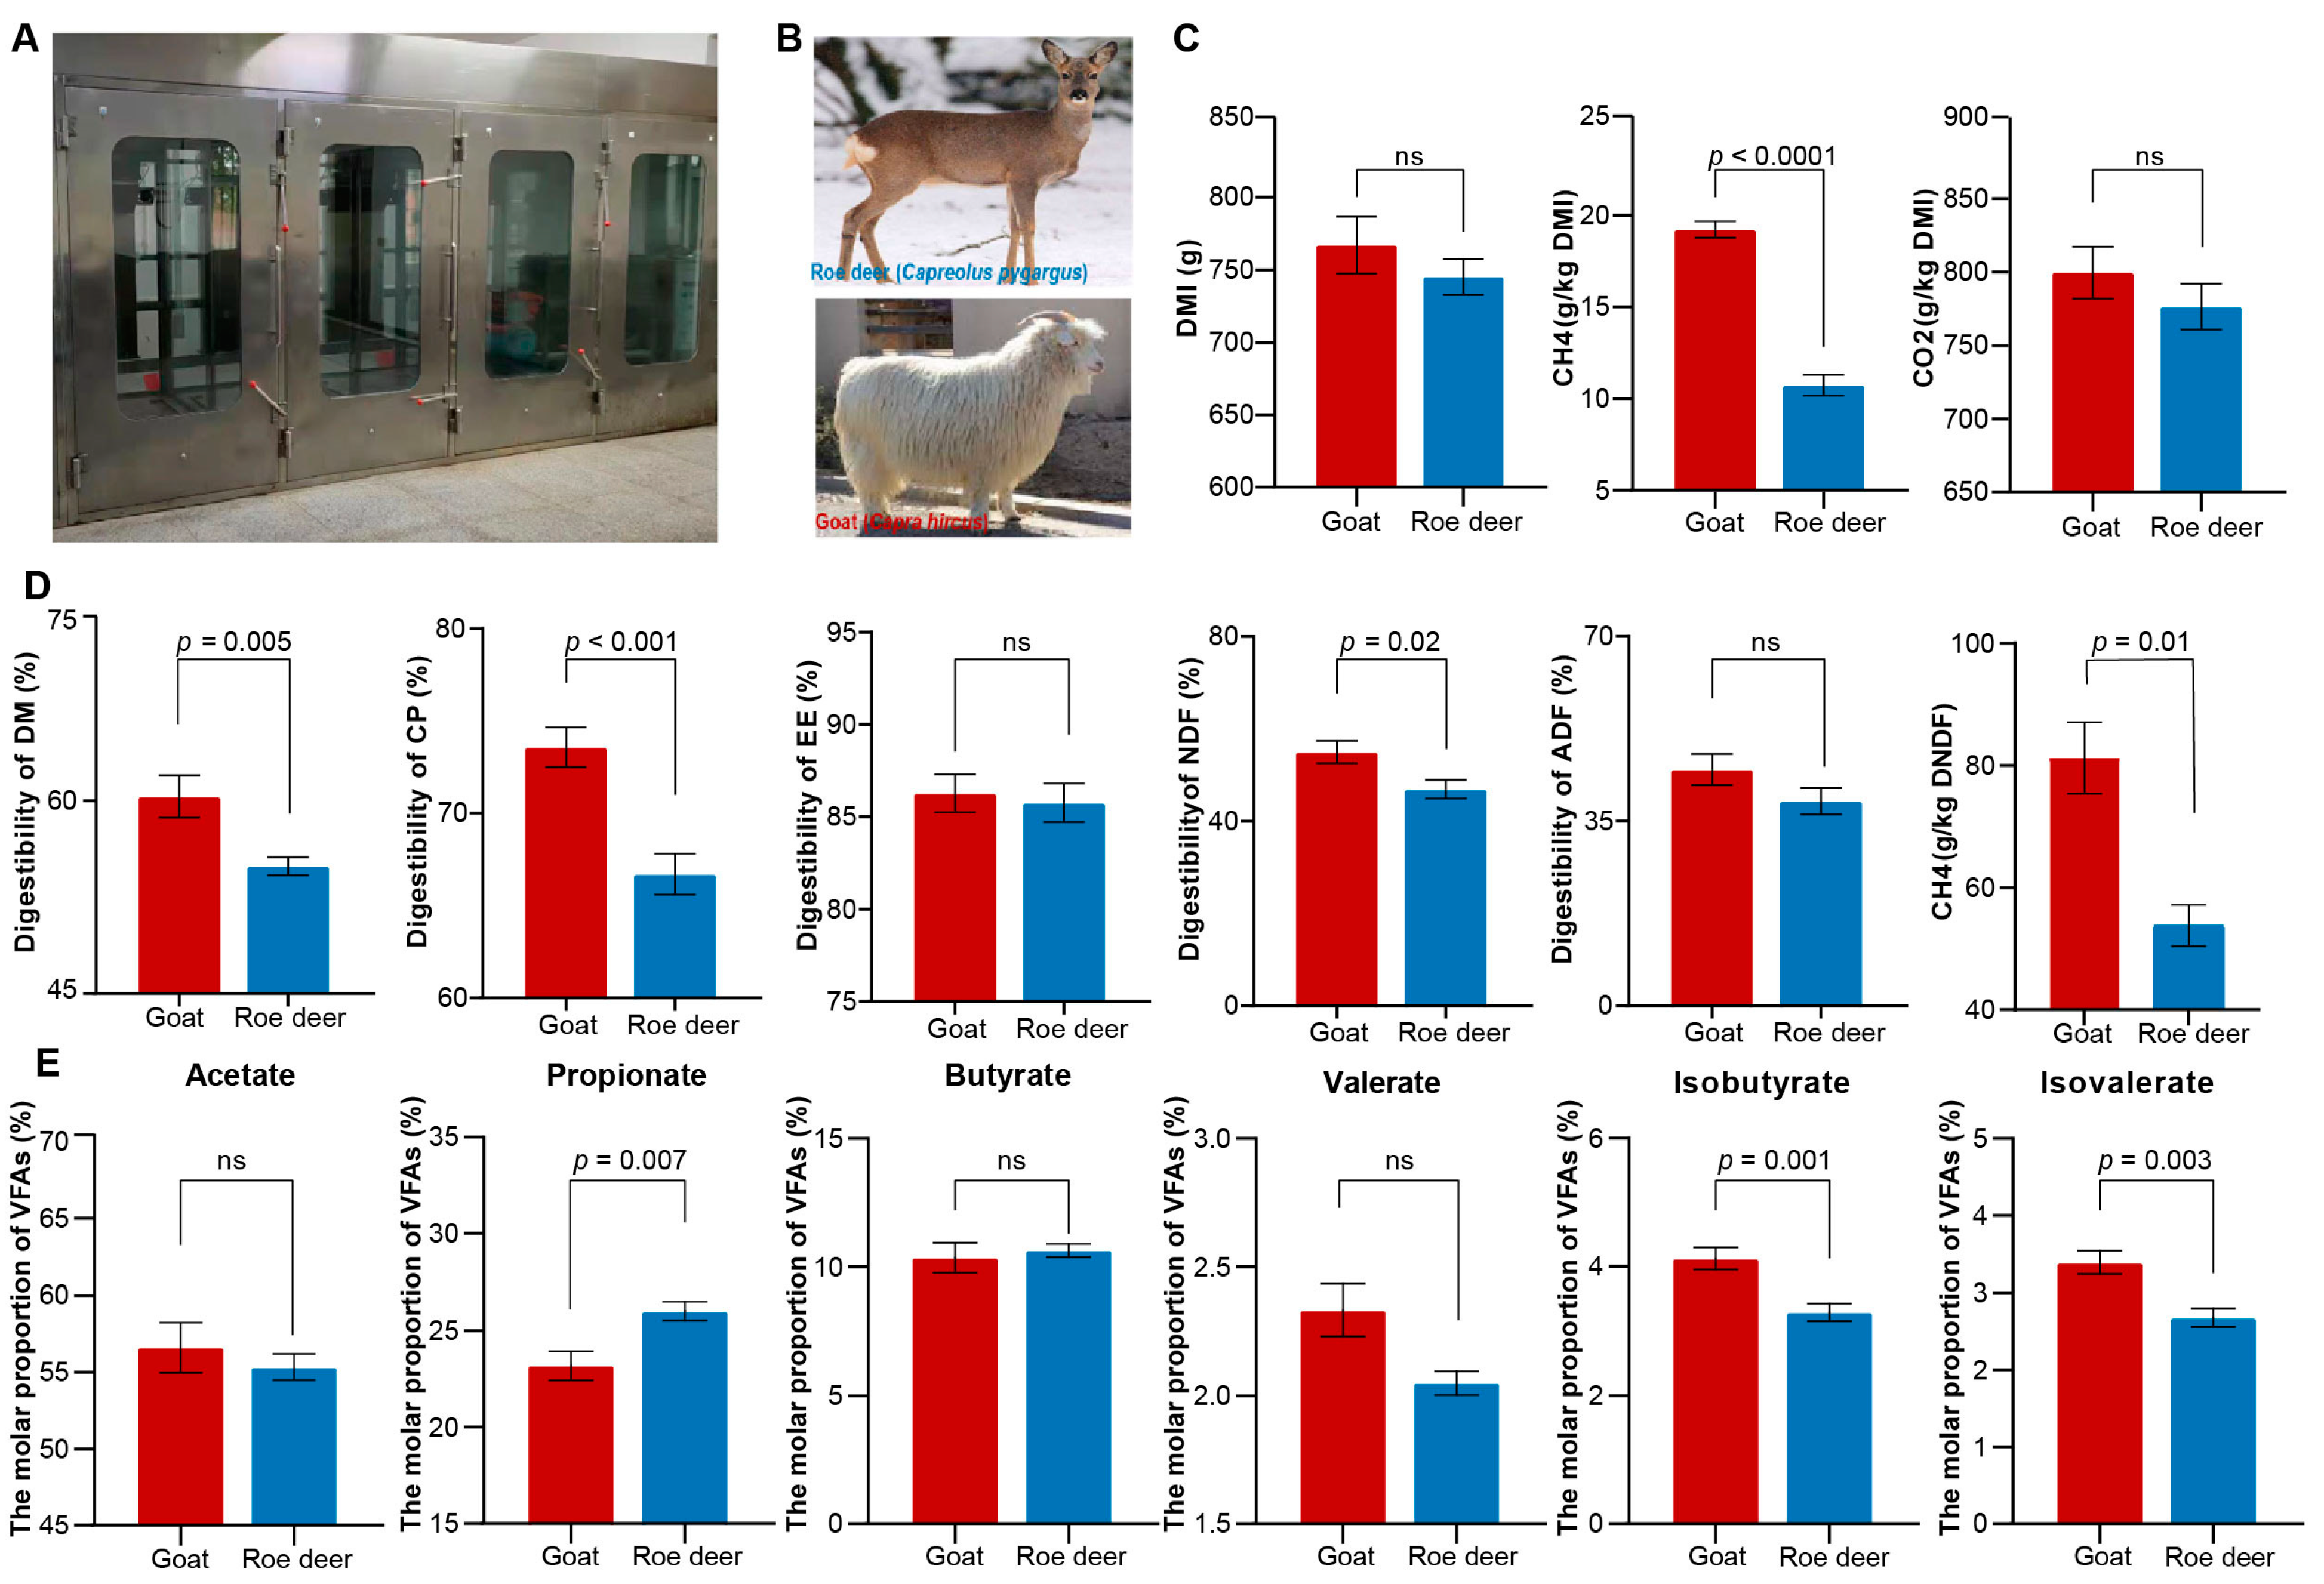
3.1. Variation in Gas Yields, Digestibility, and VFAs between Roe Deer and Goats

Open-circuit respiration chambers (Figure 1A) were used to measure the gas yield from roe deer and goats (Figure 1B) fed a TMR diet. The dry matter intake levels (DMI, roe deer = 745.18 g/d, goats = 767.11 g/d, p > 0.05) and the CO2 yield (roe deer = 776.54 g/kg DMI, goats= 799.73 g/kg DMI, p > 0.05) were not significantly different, while the CH4 yield from roe deer (10.76 g/kg DMI) was significantly lower than that from goats (19.25 g/kg DMI, p < 0.001, Mann–Whitney test, Figure 1C). Moreover, goats exhibited a higher digestibility of DM (p = 0.005), CP (p < 0.001), and NDF (p = 0.02) than roe deer, whereas the digestibility of EE (p > 0.05) and ADF (p > 0.05) was not significantly different between the two animals (Figure 1D). The methane production per kilogram of digested NDF was significantly lower in roe deer than in goats (p = 0.01). The VFA analysis results revealed that the molar proportion of propionate in roe deer was significantly higher than that in goats (p = 0.007), while the proportions of isobutyrate (p = 0.001) and isovalerate (p = 0.003) were lower than those in goats (Figure 1E).

3.2. Bacterial Community Composition and Differences between Roe Deer and Goats

A total of 574,355 and 509,342 high-quality 16S rRNA gene sequences were generated from the roe deer and goat feces, with an average of 47,862 and 42,445 sequences, respectively. A total of 3198 operational taxonomic units were identified from roe deer and goat fecal samples based on 97% sequence similarity. The Good’s coverage ranged from 98.3 to 98.9%.
We then examined the bacterial community composition, and a total of 18 phyla were identified in roe deer and goat feces (Figure 2A). The phylum Firmicutes was the dominant bacterial taxon in the feces of roe deer (60.29 ± 2.19%) and goats (63.08 ± 1.27%), followed by the phylum Bacteroidota (roe deer = 23.42 ± 1.34%, goats = 28.40 ± 1.08%). Moreover, the phyla Spirochaetota (4.81 ± 0.65%), Actinobacteriota (4.10 ± 1.21%), and Proteobacteria (3.00 ± 1.15%) accounted for more than 3% of the bacteria in roe deer feces, while the phylum Verrucomicrobia (3.72 ± 1.49%) was abundant in goat feces. Furthermore, a total of 278 bacterial genera were identified from the feces of roe deer and goats (Figure 2B).
The genera UCG 005 and UCG 010 within the family Oscillospiraceae, Rikenellaceae RC9, and Christensenellaceae R7 were the abundant bacteria in roe deer feces (12.51 ± 2.68%, 5.07 ± 0.75%, 6.65 ± 0.84%, and 8.75 ± 1.26%, respectively) and goat feces (11.24 ± 0.65%, 8.8 ± 0.94%, 7.78 ± 0.73%, and 4.81 ± 0.50%, respectively). In addition, Treponema spp. (4.73 ± 1.82%) and Ruminococcus spp. (4.37 ± 0.84%) were also prevalent in roe deer feces. In goat feces, Bacteroides spp. (6.03 ± 0.92%), Alistipes spp. (4.18 ± 0.31%) and the Eubacterium coprostanoligenes group (4.02 ± 0.66%) also showed relatively high abundances.
We then determined the difference in the fecal bacterial community between roe deer and goats. A total of 2171 OTUs were shared between roe deer and goats, while 676 and 351 unique OTUs were present in roe deer and goat feces, respectively (Figure 2C). Comparisons of diversity indices revealed that the number of OTUs and Chao 1 index were significantly higher in roe deer than in goats (p < 0.01, Figure 2D). However, the Shannon and Simpson indices were not significantly different between the two animals (p > 0.05). The PCoA results showed that the fecal bacterial community and its composition were significantly different between roe deer and goats based on the Bray–Curtis dissimilarity matrix, unweighted UniFrac distance, and weighted UniFrac distance (Figure 2E).
We thus examined the significantly different taxa between roe deer and goats using the Mann–Whitney test (p < 0.05). The relative abundances of the phyla Spirochaetota, Actinobacteriota, Proteobacteria, Fibrobacterota, Campylobacterota, and Desulfobacterota in the feces of roe deer were significantly higher than those in the feces of goats, while the relative abundances of Bacteroidota and Verrucomicrobiota in the feces of roe deer were lower than those in the feces of goats (Table S2). A further comparison revealed that a total of 96 genera were also significantly different between roe deer and goats (p < 0.05, Figure 3 and Table S3). For instance, the relative abundances of Agathobacter, Bifidobacterium, Corynebacterium, Lachnoclostridium, Prevotella, Ruminococcus, Succinivibrio, Treponema, unclassified Bacteroidales RF16, unclassified Bradymonadales, Christensenellaceae R7, unclassified Clostridia UCG 014, Lachnospiraceae AC2044, Lachnospiraceae NK4B4, NK4A214 (Oscillospiraceae), Prevotellaceae UCG 001, Prevotellaceae UCG 003, the E. ruminantium group, and the E. siraeum group in roe deer were significantly higher than those in goats. However, the proportions of Akkermansia, Alistipes, Bacteroides, Blautia, Butyrivibrio, Coprococcus, Mailhella, Monoglobus, Negativibacillus, Romboutsia, Roseburia, Phascolarctobacterium, the E. brachy group, the E. coprostanoligenes group, and the E. nodatum group were higher in roe deer than in goats (Figure 3).
We then predicted potential functions using PICRUSt and compared the relative abundances of KEGG level 3 pathways. The relative abundances of 22 pathways were significantly different between roe deer feces and goat feces (p < 0.05, Table S4). The relative abundances of fatty acid metabolism, benzoate degradation, butyrate metabolism, and propionate metabolism in the feces of roe deer were significantly higher than those in the feces of goats, while the relative abundances of fructose and mannose metabolism, galactose metabolism, and pentose phosphate pathway were significantly lower in the feces of roe deer than in the feces of goats.

3.3. Methanogen Community Composition and Differences between Roe Deer and Goats

A total of 275,062 high-quality, full-length methanogen 16S rRNA gene sequences were obtained, with an average of 11,059 and 11,862 sequences for roe deer and goats, respectively. A total of 5766 OTUs were identified. The Good’s coverage ranged from 93.7 to 99.1%. We then examined the methanogen community composition and identified three phyla: Euryarchaeota (roe deer = 28.92 ± 8.44%, goats = 90.5 ± 4.45%), Halobacterota (roe deer = 57.00 ± 2.59%, goats = 2.50 ± 2.22%), and Thermoplasmatota (roe deer = 13.98 ± 0.91%, goats = 1.57 ± 1.08%, Figure 4A). Furthermore, a total of 16 methanogen genera were identified from the feces of roe deer and goats (Figure S1), which were dominated by Methanobrevibacter (roe deer = 27.96 ± 2.53%, goats = 88.72 ± 4.36%), Methanocorpusculum (roe deer = 57.00 ± 2.58%, goats = 2.50 ± 2.22%), Methanosphaera (roe deer = 0.96 ± 0.20%, goats = 1.73 ± 0.29%), and unclassified members within the family Methanomethylophilaceae (roe deer = 13.06 ± 0.83%, goats = 1.52 ± 1.06%). A total of 23 methanogen species were identified from the feces of roe deer and goats. Mcm. uncultured (Methanocorpusculum spp., roe deer = 56.98 ± 2.59%, goats = 2.49 ± 2.22%) and Mbr. unclassified 2 (Methanobrevibacter spp., roe deer = 20.27 ± 1.94%, goats = 51.88 ± 3.08%) were abundant in the feces of roe deer and goats, respectively (Figure 4B).
We then compared the methanogen community between roe deer and goats. There were 785 shared OTUs between roe deer and goats, while 2154 and 2827 unique OTUs were present in roe deer feces and goat feces, respectively (Figure 4C). Comparisons of the diversity indices showed that the Simpson index was significantly higher in the feces of roe deer than in that of goats (p = 0.008), while the number of OTUs and the Shannon and Chao 1 indices were not significantly different between roe deer feces and goat feces (p > 0.05, Figure 4D). The PCoA results showed that the methanogen community and its composition were significantly different between the roe deer feces and goat feces based on the Bray–Curtis dissimilarity matrix, unweighted UniFrac distance, and weighted UniFrac distance (Figure 4E).
Thus, we further compared the relative abundances of methanogens at the species level. The results showed that the proportions of Mbr. millerae, Mbr. sp. YE315, Mbr. unclassified 1, Mbr. unclassified 2, Mbr. unclassified 3, Msp. unclassified 1, Msp. unclassified 3, and Mbr. ruminantium M1 were higher in the feces of goats than in that of roe deer, whereas the relative abundances of Mcm. uncultured, Mme. unclassified 1, Mme. unclassified 2, RumEn M2 (family Methanomethylophilaceae), Msp. unclassified 4, and Mms. unclassified in goat feces were lower than those in roe deer feces (Figure 5).

3.4. Co-occurrence Network among Bacteria, Methanogens, and Gas Yield

To further explore the possible association of metabolic profiles resulting from the GIT microbiota, we tested for correlation between the bacteria, methanogens, nutrient digestibility, and gas production of roe deer and goats (Figure 6). Analysis of the network parameters showed that the number of edges, clustering coefficient, and network centralization and density was increased in the network of roe deer compared with that of goats (Table S5), indicating a possibly complex and dense association in the gut of roe deer in comparison with that of goats. In the roe deer network, the most abundant bacterial families were Oscillospiraceae (24.17%), Lachnospiraceae (14.75%), Christensenellaceae (8.75%), Rikenellaceae (7.74%), and Prevotellaceae (4.74%). The correlation analysis revealed that the relative abundances of 11 (e.g., Alistipes, Succinivibrio, Bifidobacterium, and Blautia) and 14 (e.g., Alistipes and Blautia) bacterial genera were negatively correlated with CH4 and CO2 yields, respectively. Moreover, the relative abundances of three methanogen species (e.g., Msp. unclassified 4) and three methanogen species (Msp. unclassified 4, Msp. unclassified 2, and Mms. unclassified) were also correlated with CH4 and CO2 yields, respectively (Figure 6A). We also identified the taxa whose abundances were correlated with DM digestibility (four bacterial genera and one methanogen species), NDF digestibility (nine bacterial genera and four methanogen species), and CP digestibility (nine bacterial genera and one methanogen species).
In the association network of goats, the most abundant bacterial families were Oscillospiraceae (27.39%), Lachnospiraceae (13.62%), Rikenellaceae (11.97%), Prevotellaceae (6.70%), and Bacteroidaceae (6.03%). However, only the relative abundance of Romboutsia spp. was negatively correlated with the CH4 yield, and the relative abundance of Candidatus Soleaferrea was positively correlated with the CO2 yield (Figure 6B). We also found that four and five bacterial genera whose abundances were correlated with DM digestibility and NDF digestibility, respectively, and one bacterial genus whose abundance was correlated with CP digestibility (Figure 6B).
To identify the strong associations in the roe deer and goat networks, we applied MCODE analysis. The results showed that CO2, NDF digestibility, nine bacterial genera, and seven methanogen species formed a subnetwork (Figure 6C). In this network, the relative abundances of Christensenellaceae R7, the E. nodatum group, the E. ruminantium group, NK4A214 (Oscillospiraceae), and Mbr. unclassified 2 were positively correlated with NDF digestibility, which was negatively correlated with the relative abundances of Prevotellaceae UCG 001, Succinivibrio, and Mcm. uncultured. The CO2 yields were negatively correlated with the relative abundances of Blautia, Negativibacillus, and Msp. unclassified 4. CH4, CP digestibility, eight bacterial genera, and two methanogen species formed another subnetwork (Figure 6D). The production of CH4 was positively correlated with the relative abundances of Lachnospiraceae NK4B4, Lachnospiraceae NK4A136, and Treponema but negatively correlated with the relative abundance of Bifidobacterium.
In the goat subnetwork, nine bacterial genera and Mbr. ruminantium M1 formed a connected subnetwork, which was positively correlated with the relative abundances of Blautia, Treponema, and uncultured Barnesiellaceae but negatively correlated with the relative abundances of Ruminococcus, Lachnoclostridium, and Rikenellaceae RC9 (Figure 6E). Moreover, the relative abundances of Lachnospiraceae FCS020, Lachnospiraceae AC2044, and Prevotella were positively correlated with the relative abundance of Succinivibrio, which was negatively correlated with DM digestibility and NDF digestibility (Figure 6F).

4. Discussion

Ruminants can be classified into three overlapping morphophysiological feeding types: concentrate selectors (e.g., roe deer, moose, bushbuck), grass and roughage eaters (e.g., sheep, cattle, yak, buffalo), and intermediate, opportunistic, mixed feeders (e.g., goat, red deer, sika deer) [36]. In this study, we first used respiration chambers to evaluate the gas yield of roe deer, a small ruminant species classified as a concentrate selector. The results showed that the CH4 yield of roe deer was significantly lower than that of goats, although the DMI was maintained at a similar level. Consistent with our findings, previous results indicated that roe deer are relatively weak CH4 emitters [19]. Moreover, the CH4 yield per kilogram of DMI of roe deer was significantly lower than that of growing male sika deer (25.4–26.1 g/kg DMI) with different feeding levels (1.5 to 2.5% of body weight) [37], castrated red deer fed ensiled Lucerne chaff (15.8–17.1 g/kg DMI) [38], and Holstein and Jersey’s cows fed a high- (forage: concentrate ratio = 39:61) or low-concentrate diet (forage: concentrate = 68:32, 14.1–21.4 g/kg DMI) [39]. These results demonstrated that concentrate selectors produced less CH4 than intermediate mixed feeders. The mechanism determining high/low CH4 yield in ruminants is complex, but the explanations include differences in passage rates due to differences in rumen size and the resulting digestibility and GIT microbiota [11,12,40]. A previous study demonstrated that low-CH4-yield sheep had a smaller rumen volume and thus a shorter mean retention time of particulate and liquid digest [40]. The physiological difference likely contributes to the difference in CH4 emissions. We also found that the DM digestibility was lower in roe deer than in goats, which was mainly attributed to CP and NDF. Consistent with our findings, Olijhoek et al. (2018) reported that a higher NDF digestibility produced more CH4 per kilogram of DMI [39], because the fermentation of NDF leads to the production of H2 that can subsequently be used to produce CH4. Moreover, the production of CH4 was reduced with a decrease in the rate of protein degradation [41]. CO2 is the main substrate for CH4 formation in ruminants via the removal of metabolic H2 [6]. However, the CO2 yield was not significantly different between roe deer and goats, indicating that H2 disposal is mediated by roe deer. Reductive acetogenesis by acetogens represents an alternative pathway to methanogenesis for removing metabolic H2. Although the molar proportion of acetate was not significant (p = 0.28) between the two groups, there was a decreasing trend in the proportion of acetate in goats (57.21%) compared to roe deer (55.53%). We previously demonstrated that roe deer harbor potentially novel acetogenins from Clostridium spp. [42], suggesting that the GIT microbiota is a main factor affecting CH4 emission. Together, these results suggested that nutrient digestibility and H2 utilization were affected in roe deer during the adaptation of GIT physiology, resulting in variations in CH4 emissions.
We also observed that the molar proportions of propionate and branched VFAs (isobutyrate and isovalerate) in roe deer were increased and decreased significantly, respectively, compared with those in goats. Fermentation leading to acetate and propionate production is typically associated with increased and decreased H2 release, respectively [43], potentially affecting CH4 production. Consistent with our findings, the proportion of propionate was higher in low-CH4-emitting sheep [44], and the molar concentration of propionate and the ratio of (acetate + butyrate) and propionate were lower in low-CH4-emitting dairy cows [45]. These results suggested that the metabolic pathway and fermentation type differed between the two species.
To further elucidate the contribution of the GIT microbiota to CH4 yield, we examined GIT bacteria and methanogens. Members of the phyla Firmicutes and Bacteroidota were the dominant bacteria in the GIT of roe deer and goats, consistent with our previous observations in Bovidae and Cervidae [46]. Our study showed that the weaker CH4 emitter, roe deer, harbored significantly higher relative abundances of Bifidobacterium, Ruminococcus, Succinivibrio, Treponema, Prevotella, Lachnoclostridium, Christensenellaceae R7, Lachnospiraceae AC2044, Lachnospiraceae NK4B4, Prevotellaceae UCG 001, and Prevotellaceae UCG 003. Similarly, the fecal microbiota was also significantly changed when CH4 emissions were suppressed by cashew nut shells [47]. Previous studies have also revealed associations between bacterial genera, including Prevotella, Treponema, and Ruminococcus, and CH4 emission [48,49]. These results suggested that the fecal microbiota likely represents an alternative proxy with which to evaluate CH4 yield, introducing the possibility of breeding animals for a particular microbiome. However, a longitudinal study with large sample size and different dietary conditions is needed to elucidate the role of fecal methanogens in predicting CH4 emissions. Bifidobacterium spp. are important bacteria for dietary carbohydrate degradation and produce lactate, which is further metabolized to either propionate or acetate [49]. Increased lactate production is associated with decreased CH4 yield in sheep [12]. Members of Succinivibrionaceae have also been found in wallabies and are suggested to explain their lower CH4 production per unit of digestible energy intake [50]. The relative abundance of the family Succinivibrionaceae was higher in low-CH4-emitting dairy cows than in high-CH4-emitting dairy cows [45]. A correlation between weak CH4 emitters and Succinivibrionaceae abundance was observed in the cow rumen [13,51]. Members within the family Succinivibrionaceae produce succinate, an intermediate product in propionate production, and in turn inhibit bacterial NADH-H hydrogenase and methanogen activity, leading to lower production of CH4 [52]. Ruminococcus spp. are cellulolytic bacteria that can break down cellulose, a major component of the typical plant-based ruminant diet, as represented by Ruminococcus albus producing ethanol acetate, formate, and H2 during cellulose metabolism and Ruminococcus flavefaciens producing succinate instead of ethanol [53]. Christensenella minuta is a member of Christensenellaceae R7 that can produce acetate and butyrate from glucose [54]. It is known to be a strong driver of the ability of different Prevotella species to utilize certain substrates, a nutritional adaptation that confers an advantage in the rumen environment with different components available through carbohydrate- and protein-rich feeds [55]. Accordingly, the molar proportion of propionate and the abundance of the predicted pathway of propionate metabolism in the feces of roe deer were significantly higher than those in the feces of goats. These results suggested that the increased production of propionate resulting from the changed fecal bacterial community contributed to the lower CH4 emissions of roe deer.
This study demonstrated that Methanocorpusculum and Methanobrevibacter were the most abundant methanogens in the feces of roe deer and goats, respectively. Methanobrevibacter species are the predominant archaea in the GIT of various ruminants and nonruminants [56]. Interestingly, we also previously showed the dominance of Methanocorpusculum in the cecum of juvenile sika deer, suggesting a possible role of host genetics in methanogen composition [57]. Difford et al. (2018) revealed a stronger effect of host genetics than other factors on rumen methanogens [14]. Moreover, a large-scale analysis of fecal archaea from 110 vertebrate species spanning five taxonomic classes also revealed that host–archaea coevolution was strongest for herbivorous mammals, and members of Methanocorpusculum were associated with camel species, while members of Methanobrevibacter and Methanosphaera were associated with Artiodactyla species [15]. Considering that the roe deer and goats were fed the same diets, these results suggested a clear effect of host genetics on GIT methanogens. A recent study that assessed archaeal diversity in great ape feces indicated a potentially diet-associated loss of archaeal taxa during primate evolution [58]. Together, these results revealed that the coadaptation between the diet and gut morphology of roe deer could explain the host-determined GIT methanogen compositions [40,59] and again highlighted that different strategies may be needed to effectively mitigate enteric CH4 emissions from ruminants.
The number of methanogens is not as important as the metabolic activity of the individual methanogenic species with regard to the level of CH4 production [11]. Roe deer specifically showed significantly higher relative abundances of Mcm. uncultured (Methanocorpusculum) and Mme. unclassified 1 (Methanomethylophilaceae), while goats had a higher proportion of Methanobrevibacter (Mbr. millerae, Mbr. sp. YE315, Mbr. unclassified 1, and Mbr. unclassified 2). Methanobrevibacter and Methanocorpusculum were classified as class I and class II methanogens based on 16S rRNA sequences, both of which commonly reduce CO2 using H2 and formate for methanogenesis [59,60]. Comparisons of methanogenesis between Methanobrevibacter and Methanosphaera have indicated that the former genus produces one mole of CH4 for each mole of CO2 [61]. Previous studies have also indicated the relative abundance of the Mbr. gottschalkii clade was linked with higher CH4 production in cows [45] and sheep [11]. Moreover, Methanobrevibacter was divided into two groups, namely, the SGMT clade (Mbr. smithii, Mbr. gottschalkii, Mbr. millerae, and Mbr. thaueri) and the RO clade (Mbr. ruminantium, and Mbr. olleyae) [62], and cows with a higher proportion of SGMT exhibited relatively high CH4 emissions [63]. These significantly enriched methanogen species within Methanobrevibacter were likely responsible for the increased CH4 yield of goats. However, Liu et al. (2018) found that the relative abundance of Methanocorpusculum significantly increased with increasing CH4 production during cow manure storage [64]. Thus, the underlying mechanism and contribution of Methanocorpusculum spp. require further investigation.
These variations in CH4 yield may reflect the different substrate-production capacities of bacteria. Thus, we further explored the correlations among gas emissions, digestibility, methanogens, and bacteria in roe deer and goats. The CH4 and CO2 yields were correlated with the relative abundances of only Romboutsia and Candidatus Soleaferrea in goats but with the relative abundances of several bacteria and methanogens in roe deer. This was unexpected because Methanobrevibacter has been identified as being associated with higher CH4 emissions in cattle [51]. However, the observation in the present study is consistent with our previous finding that the predicted CH4 yield was not associated with any identified microorganisms in ruminant species with the highest CH4 production [65]. The lack of association in this study was likely due to differences in absolute versus relative abundances [48]. Moreover, this study showed that the relative abundances of Alistipes and Blautia were negatively correlated with CH4 and CO2 yields, and the relative abundances of Bifidobacterium and Treponema were negatively and positively correlated, respectively, with the CH4 yield in roe deer. A study of the human gut showed that weak CH4 emitters were mainly defined by the presence of Bacteroides, Butyricicoccus, and Blautia, driving nutrient breakdown toward C1-C3 compounds [66]. Alistipes spp. belong to the Rikenellaceae family, members of which can produce propionate, acetate, and/or succinate as fermentation end product [54]. Blautia spp. are considered hydrogenotrophic acetogens that mediate the conversion of H2/CO2 to acetate using [FeFe]-hydrogenases, and the transcript level of an alternative H2 sink (AcsB) was significantly upregulated in low-CH4-yield sheep, indicating that these species may therefore be more active than methanogens and significantly limit the substrate supply for methanogenesis [67]. As mentioned above, Bifidobacterium spp. produce lactate as a major end product of carbohydrate fermentation. These results suggested that the GIT microbiota could facilitate the trapping of metabolites in the cycle until they are taken up by the host or used for microbial biomass production under low-CH4 conditions. A previous study revealed that dairy cows producing higher CH4 emissions had lower abundances of Succinivibrionaceae and Methanosphaera spp. [68]. Kittelmann et al. (2014) reported that the relative abundance of Methanosphaera was negatively and significantly correlated with CH4 yield [44], in agreement with the CH4 yield. Consistent with these findings, we also found that the relative abundance of Methanosphaera was negatively correlated with the CH4 and CO2 yields. These results suggested that Methanosphaera are likely to be common targets in the GIT for reducing CH4 emissions from ruminants. In the current study, however, several genera belonging to the family Lachnospiraceae formed two closely connected networks in goats. The family Lachnospiraceae was linked to high CH4 yield in sheep [44] and was represented among species that were more abundant in the microbiomes of inefficient cows’ microbiomes [69]. Members of the family Lachnospiraceae, playing an essential role in fiber digestion, were more frequently detected in high-CH4-yield sheep and showed strong interactions among themselves [70]. Thus, interventions targeting Lachnospiraceae members involved in metabolic interactions would be helpful for the mitigation of CH4 production in the future.

5. Conclusions

In this study, we first demonstrated that roe deer produced significantly less CH4 than goats under the same dietary conditions. Roe deer feces exhibited significantly different bacterial and methanogen compositions in comparison with goat feces, which accordingly affected the metabolic pathway and production of propionate. The co-occurrence network analysis revealed that the correlations between gas yields, bacteria, and methanogens were also different between roe deer and goats. The identified microorganisms that significantly changed and showed strong associations with CH4 yield could be targeted for intervention.

Supplementary Materials

The following supporting information can be downloaded at: https://www.mdpi.com/article/10.3390/fermentation9020186/s1, Table S1: Ingredient and nutrition composition of diet in this study; Table S2: The significantly different bacterial phyla between roe deer and goats; Table S3: The significantly different bacterial genera between roe deer and goats; Table S4: The significantly changed relative abundance of KEGG level 3 pathways between roe deer and goats; Table S5: Comparing parameters of co-occurrence networks between roe deer and goats; Figure S1: Methanogen community composition in feces of roe deer and goats at the species level.

Author Contributions

Conceptualization, H.S. and Z.L.; methodology, Y.H., S.L., F.Z. and X.Y.; software, Y.H., H.S. and Z.L.; formal analysis, Y.H., H.S., S.L. and R.M.; writing—original draft preparation, Y.H. and S.L.; writing—review and editing, H.S. and Z.L.; funding acquisition, H.S. and Z.L. All authors have read and agreed to the published version of the manuscript.

Funding

This work was supported by the National Natural Science Foundation of China (32122083), Science and Technology Research Project from Jilin Province (20220304003YY) to Z.L. Science and Technology Research Project of Jilin Provincial Department of Education (JJKH20220363KJ) to H.S.

Institutional Review Board Statement

The animal study protocol was approved by the Animal Care and Use Committee of Jilin Agricultural University in China (Approval ID: 20210314001).

Informed Consent Statement

Informed consent was obtained from all subjects involved in the study.

Data Availability Statement

Sequence files associated with each sample have been submitted to the NCBI Sequence Read Archive. This data can be found here: https://www.ncbi.nlm.nih.gov/sra. (accessed on 1 January 2023. PRJNA832930).

Conflicts of Interest

The authors declare that the research was conducted in the absence of any commercial or financial relationships that could be construed as a potential conflict of interest.

References

  1. Mizrahi, I.; Wallace, R.J.; Moraïs, S. The rumen microbiome: Balancing food security and environmental impacts. Nat. Rev. Microbiol. 2021, 19, 553–566. [Google Scholar] [CrossRef]
  2. Nikos, A.; Jelle, B. World Agriculture towards 2030/2050: The 2012 Revision; Agricultural Development Economics Division, Food and Agriculture Organization of the United Nations: Rome, Italy, 2012; pp. 1–47. [Google Scholar]
  3. Hill, J.; McSweeney, C.; Wright, A.D.G.; Bishop-Hurley, G.; Kalantar-zadeh, K. Measuring methane production from ruminants. Trends Biotech. 2016, 34, 26–35. [Google Scholar] [CrossRef]
  4. Gerber, P.J.; Steinfeld, H.; Henderson, B.; Mottet, A.; Opio, C.; Dijkman, J.; Alessandra, F.; Tempio, G. Tackling Climate Change through Livestock: A Global Assessment of Emissions and Mitigation Opportunities; Food and Agriculture Organization of the United Nations (FAO): Rome, Italy, 2013. [Google Scholar]
  5. Johnson, K.A.; Johnson, D.E. Methane emissions from cattle. J. Anim. Sci. 1995, 73, 2483–2492. [Google Scholar] [CrossRef]
  6. Morgavi, D.P.; Forano, E.; Martin, C.; Newbold, C.J. Microbial ecosystem and methanogenesis in ruminants. Animal 2010, 4, 1024–1036. [Google Scholar] [CrossRef] [PubMed] [Green Version]
  7. Murray, R.M.; Bryant, A.M.; Leng, R.A. Rates of production of methane in the rumen and large intestine of sheep. Br. J. Nutr. 1976, 36, 1–14. [Google Scholar] [CrossRef] [PubMed] [Green Version]
  8. St-Pierre, B.; Wright, A.D.G. Diversity of gut methanogens in herbivorous animals. Animal 2013, 7, 49–56. [Google Scholar] [CrossRef] [PubMed] [Green Version]
  9. Borrel, G.; Brugère, J.-F.; Gribaldo, S.; Schmitz, R.A.; Moissl-Eichinger, C. The host-associated archaeome. Nat. Rev. Microbiol. 2020, 18, 622–636. [Google Scholar] [CrossRef] [PubMed]
  10. Poulsen, M.; Schwab, C.; Jensen, B.B.; Engberg, R.M.; Spang, A.; Canibe, N.; Højberg, O.; Milinovich, G.; Fragner, L.; Schleper, C.; et al. Methylotrophic methanogenic Thermoplasmata implicated in reduced methane emissions from bovine rumen. Nat. Commun. 2013, 4, 1428. [Google Scholar] [CrossRef] [PubMed] [Green Version]
  11. Shi, W.; Moon, C.D.; Leahy, S.C.; Kang, D.; Froula, J.; Kittelmann, S.; Fan, C.; Deutsch, S.; Gagic, D.; Seedorf, H.; et al. Methane yield phenotypes linked to differential gene expression in the sheep rumen microbiome. Genome Res. 2014, 24, 1517–1525. [Google Scholar] [CrossRef] [PubMed] [Green Version]
  12. Kamke, J.; Kittelmann, S.; Soni, P.; Li, Y.; Tavendale, M.; Ganesh, S.; Janssen, P.H.; Shi, W.; Shi, W.; Froula, J.; et al. Rumen metagenome and metatranscriptome analyses of low methane yield sheep reveals a Sharpea-enriched microbiome characterised by lactic acid formation and utilisation. Microbiome 2016, 4, 56. [Google Scholar] [CrossRef] [Green Version]
  13. Wallace, R.J.; Sasson, G.; Garnsworthy, P.C.; Tapio, I.; Gregson, E.; Bani, P.; Huhtanen, P.; Bayat, A.R.; Strozzi, F.; Biscarini, F.; et al. A heritable subset of the core rumen microbiome dictates dairy cow productivity and emissions. Sci. Adv. 2019, 5, eaav8391. [Google Scholar] [CrossRef] [PubMed] [Green Version]
  14. Difford, G.F.; Plichta, D.R.; Løvendahl, P.; Lassen, J.; Noel, S.J.; Højberg, O.; Wright, A.G.; Zhu, Z.; Kristensen, L.; Nielsen, H.B.; et al. Host genetics and the rumen microbiome jointly associate with methane emissions in dairy cows. PLoS Genet. 2018, 14, e1007580. [Google Scholar] [CrossRef] [PubMed] [Green Version]
  15. Youngblut, N.D.; Reischer, G.H.; Dauser, S.; Maisch, S.; Walzer, C.; Stalder, G.; Farnleitner, A.H.; Ley, R.E. Vertebrate host phylogeny influences gut archaeal diversity. Nat. Microbiol. 2021, 6, 1443–1454. [Google Scholar] [CrossRef] [PubMed]
  16. Knight, T.; Ronimus, R.S.; Dey, D.; Tootill, C.; Naylor, G.; Evans, P.; Molano, G.; Smith, A.; Tavendale, M.; Pinares-Panino, C.; et al. Chloroform decreases rumen methanogenesis and methanogen populations without altering rumen function in cattle. Anim. Feed Sci. Tech. 2011, 166–167, 101–112. [Google Scholar] [CrossRef]
  17. Weimer, P.J.; Stevenson, D.M.; Mantovani, H.C.; Man, S.L.C. Host specificity of the ruminal bacterial community in the dairy cow following near-total exchange of ruminal contents1. J. Dairy Sci. 2010, 93, 5902–5912. [Google Scholar] [CrossRef]
  18. Pérez-Barbería, F.J. Scaling methane emissions in ruminants and global estimates in wild populations. Sci. Total Environ. 2017, 579, 1572–1580. [Google Scholar] [CrossRef]
  19. Crutzen, P.J.; Aselmann, I.; Seile, R.W. Methane production by domestic animals, wild ruminants, other herbivorous fauna, and humans. Tellus B 1986, 38B, 271–284. [Google Scholar] [CrossRef]
  20. Manafiazar, G.; Fitzsimmons, C.; Zhou, M.; Basarab, J.A.; Baron, V.S.; McKeown, L.; Guan, L.L. Association between fecal methanogen species with methane production and grazed forage intake of beef heifers classified for residual feed intake under drylot conditions. Animal 2021, 15, 100304. [Google Scholar] [CrossRef]
  21. AOAC. Official Methods of Analysis of the Association of Official’s Analytical Chemists; AOAC: Arlington, Virginia, 2003. [Google Scholar]
  22. Van Soest, P.J.; Robertson, J.B.; Lewis, B.A. Methods for Dietary Fiber, Neutral Detergent Fiber, and Nonstarch Polysaccharides in Relation to Animal Nutrition. J. Dairy Sci. 1991, 74, 3583–3597. [Google Scholar] [CrossRef]
  23. Liu, J.H.; Xu, T.T.; Zhu, W.Y.; Mao, S.Y. High-grain feeding alters caecal bacterial microbiota composition and fermentation and results in caecal mucosal injury in goats. Br. J. Nutr. 2014, 112, 416–427. [Google Scholar] [CrossRef] [Green Version]
  24. The Human Microbiome Project Consortium. Structure, function and diversity of the healthy human microbiome. Nature 2012, 486, 207–214. [Google Scholar] [CrossRef] [PubMed] [Green Version]
  25. Klindworth, A.; Pruesse, E.; Schweer, T.; Peplies, J.; Quast, C.; Horn, M.; Glockner, F.O. Evaluation of general 16S ribosomal RNA gene PCR primers for classical and next-generation sequencing-based diversity studies. Nucleic Acids Res. 2012, 41, e1. [Google Scholar] [CrossRef] [PubMed]
  26. Magoč, T.; Salzberg, S.L. FLASH: Fast length adjustment of short reads to improve genome assemblies. Bioinformatics 2011, 27, 2957–2963. [Google Scholar] [CrossRef] [PubMed] [Green Version]
  27. Bolger, A.M.; Lohse, M.; Usadel, B. Trimmomatic: A flexible trimmer for Illumina sequence data. Bioinformatics 2014, 30, 2114–2120. [Google Scholar] [CrossRef] [PubMed] [Green Version]
  28. Caporaso, J.G.; Kuczynski, J.; Stombaugh, J.; Bittinger, K.; Bushman, F.D.; Costello, E.K.; Fierer, N.; Peña, A.G.; Goodrich, J.K.; Gordon, J.I.; et al. QIIME allows analysis of high-throughput community sequencing data. Nat. Methods 2010, 7, 335–336. [Google Scholar] [CrossRef] [Green Version]
  29. Edgar, R.C. UPARSE: Highly accurate OTU sequences from microbial amplicon reads. Nat. Methods 2013, 10, 996–998. [Google Scholar] [CrossRef]
  30. Edgar, R.C.; Haas, B.J.; Clemente, J.C.; Quince, C.; Knight, R. UCHIME improves sensitivity and speed of chimera detection. Bioinformatics 2011, 27, 2194–2200. [Google Scholar] [CrossRef] [Green Version]
  31. Wang, Q.; Garrity, G.M.; Tiedje, J.M.; Cole, J.R. Naïve bayesian classifier for rapid assignment of rRNA sequences into the new bacterial taxonomy. Appl. Environ. Microbiol. 2007, 73, 5261–5267. [Google Scholar] [CrossRef] [Green Version]
  32. Langille, M.G.I.; Zaneveld, J.; Caporaso, J.G.; McDonald, D.; Knights, D.; Reyes, J.A.; Clemente, J.C.; Burkepile, D.E.; Vega Thurber, R.L.; Knight, R.; et al. Predictive functional profiling of microbial communities using 16S rRNA marker gene sequences. Nat. Biotech. 2013, 31, 814–821. [Google Scholar] [CrossRef]
  33. Shannon, P.; Markiel, A.; Ozier, O.; Baliga, N.S.; Wang, J.T.; Ramage, D.; Amin, N.; Schwikowski, B.; Ideker, T. Cytoscape: A software environment for integrated models of biomolecular interaction networks. Genome Res. 2003, 13, 2498–2504. [Google Scholar] [CrossRef]
  34. Scardoni, G.; Petterlini, M.; Laudanna, C. Analyzing biological network parameters with CentiScaPe. Bioinformatics 2009, 25, 2857–2859. [Google Scholar] [CrossRef] [PubMed] [Green Version]
  35. Bader, G.D.; Hogue, C.W.V. An automated method for finding molecular complexes in large protein interaction networks. BMC Bioinform. 2003, 4, 2. [Google Scholar] [CrossRef] [PubMed] [Green Version]
  36. Hofmann, R.R. Evolutionary steps of ecophysiological adaptation and diversification of ruminants: A comparative view of their digestive system. Oecologia 1989, 78, 443–457. [Google Scholar] [CrossRef] [PubMed]
  37. Na, Y.Y.; Li, D.H.; Choi, Y.J.; Kim, K.H.; Lee, S.R. Effects of feeding level on nutrient digestibility and enteric methane production in growing goats (Capra hircus hircus) and Sika deer (Cervus nippon hortulorum). Asian Austral. J. Anim. Sci. 2018, 31, 1238–1243. [Google Scholar] [CrossRef]
  38. Swainson, N.M.; Hoskin, S.O.; Clark, H.; Pinares-Patino, C.S.; Brookes, I.M. Comparative methane emissions from cattle, red deer and sheep. Proceed. N. Zeal. Soc. Anim. Prod. 2008, 68, 59–62. [Google Scholar]
  39. Olijhoek, D.W.; Løvendahl, P.; Lassen, J.; Hellwing, A.L.F.; Höglund, J.K.; Weisbjerg, M.R.; Noel, S.J.; McLean, F.; Højberg, O.; Lund, P. Methane production, rumen fermentation, and diet digestibility of Holstein and Jersey dairy cows being divergent in residual feed intake and fed at 2 forage-to-concentrate ratios. J. Dairy Sci. 2018, 101, 9926–9940. [Google Scholar] [CrossRef] [Green Version]
  40. Goopy, J.P.; Donaldson, A.; Hegarty, R.; Vercoe, P.E.; Haynes, F.; Barnett, M.; Oddy, V.H. Low-methane yield sheep have smaller rumens and shorter rumen retention time. Br. J. Nutr. 2014, 111, 578–585. [Google Scholar] [CrossRef] [Green Version]
  41. Tavendale, M.H.; Meagher, L.P.; Pacheco, D.; Walker, N.; Attwood, G.T.; Sivakumaran, S. Methane production from in vitro rumen incubations with Lotus pedunculatus and Medicago sativa, and effects of extractable condensed tannin fractions on methanogenesis. Anim. Feed Sci. Tech. 2005, 123, 403–419. [Google Scholar] [CrossRef]
  42. Li, Z.P.; Henderson, G.; Yang, Y.H.; Li, G.Y. Diversity of formyltetrahydrofolate synthetase genes in the rumens of roe deer (Capreolus pygargus) and sika deer (Cervus nippon) fed different diets. Can. J. Microbiol. 2017, 63, 11–19. [Google Scholar] [CrossRef] [Green Version]
  43. Moss, A.R.; Jouany, J.P.; Newbold, J. Methane production by ruminants: Its contribution to global warming. Annal. Zootech. 2000, 49, 231–253. [Google Scholar] [CrossRef] [Green Version]
  44. Kittelmann, S.; Pinares-Patiño, C.S.; Seedorf, H.; Kirk, M.R.; Ganesh, S.; McEwan, J.C.; Janssen, P.H. Two different bacterial community types are linked with the low-methane emission trait in sheep. PLoS ONE 2014, 9, e103171. [Google Scholar] [CrossRef] [PubMed]
  45. Danielsson, R.; Dicksved, J.; Sun, L.; Gonda, H.; Müller, B.; Schnürer, A.; Bertilsson, J. Methane Production in Dairy Cows Correlates with Rumen Methanogenic and Bacterial Community Structure. Front. Microbiol. 2017, 8, 226. [Google Scholar] [CrossRef] [PubMed] [Green Version]
  46. Xie, F.; Jin, W.; Si, H.Z.; Yuan, Y.; Tao, Y.; Liu, J.; Wang, X.; Yang, C.; Li, Q.; Yan, X.; et al. An integrated gene catalog and over 10,000 metagenome-assembled genomes from the gastrointestinal microbiome of ruminants. Microbiome 2021, 9, 137. [Google Scholar] [CrossRef] [PubMed]
  47. Narabe, C.; Kamiyama, S.; Saito, M.; Boonsaen, P.; Khongpradit, A.; Sawanon, S.; Suzuki, Y.; Koike, S.; Kobayashi, Y. Cashew nut shell liquid potentially mitigates methane emission from the feces of Thai native ruminant livestock by modifying fecal microbiota. Anim. Sci. J. 2021, 92, e13614. [Google Scholar] [CrossRef]
  48. Cunha, C.S.; Veloso, C.M.; Marcondes, M.I.; Mantovani, H.C.; Tomich, T.R.; Pereira, L.G.R.; Ferreira, M.F.L.; Dill-McFarland, K.A.; Suen, G. Assessing the impact of rumen microbial communities on methane emissions and production traits in Holstein cows in a tropical climate. Syst. Appl. Microbiol. 2017, 40, 492–499. [Google Scholar] [CrossRef] [PubMed]
  49. Lyons, T.; Bielak, A.; Doyle, E.; Kuhla, B. Variations in methane yield and microbial community profiles in the rumen of dairy cows as they pass through stages of first lactation. J. Dairy Sci. 2018, 101, 5102–5114. [Google Scholar] [CrossRef] [PubMed] [Green Version]
  50. Pope, P.B.; Smith, W.; Denman, S.E.; Tringe, S.G.; Barry, K.; Hugenholtz, P.; McSweeney, C.S.; McHardy, A.C.; Morrison, M. Isolation of Succinivibrionaceae implicated in low methane emissions from Tammar wallabies. Science 2011, 333, 646–648. [Google Scholar] [CrossRef]
  51. Wallace, R.J.; Rooke, J.A.; McKain, N.; Duthie, C.A.; Hyslop, J.J.; Ross, D.W.; Waterhouse, A.; Watson, M.; Roehe, R. The rumen microbial metagenome associated with high methane production in cattle. BMC Genom. 2015, 16, 839. [Google Scholar] [CrossRef] [Green Version]
  52. Stackebrandt, E.; Hespell, R. The family succinivibrionaceae. In The Prokaryotes; Dworkin, M., Falkow, S., Rosenberg, E., Schleifer, K.-H., Stackebrandt, E., Eds.; Springer: New York, NY, USA, 2006; pp. 419–429. [Google Scholar]
  53. Russell, J.B.; Muck, R.E.; Weimer, P.J. Quantitative analysis of cellulose degradation and growth of cellulolytic bacteria in the rumen. FEMS Microbiol. Ecol. 2009, 67, 183–197. [Google Scholar] [CrossRef]
  54. Holman, D.B.; Gzyl, K.E. A meta-analysis of the bovine gastrointestinal tract microbiota. FEMS Microbiol. Ecol. 2019, 95, fiz072. [Google Scholar] [CrossRef]
  55. Stevenson, D.M.; Weimer, P.J. Dominance of Prevotella and low abundance of classical ruminal bacterial species in the bovine rumen revealed by relative quantification real-time PCR. Appl. Microbiol. Biotech. 2007, 75, 165–174. [Google Scholar] [CrossRef]
  56. Moissl-Eichinger, C.; Pausan, M.; Taffner, J.; Berg, G.; Bang, C.; Schmitz, R.A. Archaea are interactive components of complex microbiomes. Trends Microbiol. 2018, 26, 70–85. [Google Scholar] [CrossRef]
  57. Li, Z.P.; Wang, X.X.; Zhang, T.; Si, H.Z.; Xu, C.; Wright, A.D.G.; Li, G. Heterogeneous development of methanogens and the correlation with bacteria in the rumen and cecum of sika deer (Cervus nippon) during early life suggest different ecology relevance. BMC Microbiol. 2019, 19, 129. [Google Scholar] [CrossRef] [PubMed]
  58. Raymann, K.; Moeller, A.H.; Goodman, A.L.; Ochman, H.; Tringe, S.G. Unexplored archaeal diversity in the great ape gut microbiome. mSphere 2017, 2, e00026-17. [Google Scholar] [CrossRef] [PubMed] [Green Version]
  59. Bapteste, É.; Brochier, C.; Boucher, Y. Higher-level classification of the Archaea: Evolution of methanogenesis and methanogens. Archaea 2005, 1, 353–363. [Google Scholar] [CrossRef] [PubMed] [Green Version]
  60. Browne, P.; Tamaki, H.; Kyrpides, N.; Woyke, T.; Goodwin, L.; Imachi, H.; Bräuer, H.; Yavitt, J.B.; Liu, W.T.; Zinder, S.; et al. Genomic composition and dynamics among Methanomicrobiales predict adaptation to contrasting environments. ISME J. 2017, 11, 87–99. [Google Scholar] [CrossRef] [PubMed] [Green Version]
  61. Hook, S.E.; Wright, A.D.G.; McBride, B.W. Methanogens: Methane producers of the rumen and mitigation strategies. Archaea 2010, 2010, 945785. [Google Scholar] [CrossRef] [Green Version]
  62. King, E.E.; Smith, R.P.; St-Pierre, B.; Wright, A.D.G. Differences in the rumen methanogen populations of lactating Jersey and Holstein dairy cows under the same diet regimen. Appl. Environ. Microbiol. 2011, 77, 5682–5687. [Google Scholar] [CrossRef] [Green Version]
  63. Danielsson, R.; Schnurer, A.; Arthurson, V.; Bertilsson, J. Methanogenic population and CH4 production in swedish dairy cows fed different levels of forage. Appl. Environ. Microbiol. 2012, 78, 6172–6179. [Google Scholar] [CrossRef] [Green Version]
  64. Liu, C.; Guo, T.J.; Chen, Y.X.; Meng, Q.H.; Zhu, C.X.; Huang, H.K. Physicochemical characteristics of stored cattle manure affect methane emissions by inducing divergence of methanogens that have different interactions with bacteria. Agri. Ecosys. Environ. 2018, 253, 38–47. [Google Scholar] [CrossRef]
  65. Li, Z.P.; Wang, X.X.; Alberdi, A.; Deng, J.B.; Zhong, Z.Y.; Si, H.Z.; Zheng, C.; Zhou, H.; Wang, J.; Yang, Y.; et al. Comparative microbiome analysis reveals the ecological relationships between rumen methanogens, acetogens, and their hosts. Front. Microbiol. 2020, 11, 1311. [Google Scholar] [CrossRef]
  66. Kumpitsch, C.; Fischmeister, F.P.S.; Mahnert, A.; Lackner, S.; Wilding, M.; Sturm, C.; Springer, A.; Madl, T.; Madl, T.; Högenauer, C.; et al. Reduced B12 uptake and increased gastrointestinal formate are associated with archaeome-mediated breath methane emission in humans. Microbiome 2021, 9, 193. [Google Scholar] [CrossRef] [PubMed]
  67. Greening, C.; Geier, R.; Wang, C.; Woods, L.C.; Morales, S.E.; McDonald, M.J.; Rushton-Green, R.; Morgan, X.C.; Koike, S.; Leahy, S.C.; et al. Diverse hydrogen production and consumption pathways influence methane production in ruminants. ISME J. 2019, 13, 2617–2632. [Google Scholar] [CrossRef] [PubMed]
  68. Ramayo-Caldas, Y.; Zingaretti, L.; Popova, M.; Estellé, J.; Bernard, A.; Pons, N.; Bellot, P.; Mach, N.; Rau, A.; Roume, H.; et al. Identification of rumen microbial biomarkers linked to methane emission in Holstein dairy cows. J. Anim. Breed. Genet. 2020, 137, 49–59. [Google Scholar] [CrossRef] [Green Version]
  69. Shabat, S.K.B.; Sasson, G.; Doron-Faigenboim, A.; Durman, T.; Yaacoby, S.; Berg Miller, M.E.; White, B.A.; Shterzer, N.; Mizrahi, I. Specific microbiome-dependent mechanisms underlie the energy harvest efficiency of ruminants. ISME J. 2016, 10, 2958–2972. [Google Scholar] [CrossRef] [PubMed] [Green Version]
  70. Maman, L.G.; Palizban, F.; Atanaki, F.F.; Ghiasi, N.E.; Ariaeenejad, S.; Ghaffari, M.R.; Salekdeh, G.H.; Kavousi, K. Co-abundance analysis reveals hidden players associated with high methane yield phenotype in sheep rumen microbiome. Sci. Rep. 2020, 10, 4995. [Google Scholar] [CrossRef] [Green Version]
Figure 1. The measurement and comparison of gas yields, digestibility, and VFAs between roe deer and goats. (A) CH4 and CO2 yields from the roe deer and goats were measured using open-circuit respiration chambers; (B) roe deer and goats were used in the present study; (C) comparisons of dry matter intake (DMI), CH4, and CO2 (g/kg DMI) from roe deer and goats; (D) comparing digestibility of nutrients and methane production per kilogram of digested NDF between roe deer and goats; (E) the molar proportion of VFAs in feces of roe deer and goats. The p-value indicates the statistical significance of the differences. The significances were determined using the Mann–Whitney test based on the Benjamini–Hochberg corrected p-values; ns means no significant differences.
Fermentation 09 00186 g001
Figure 2. Bacteria community and composition in feces of roe deer and goats. (A) Clustering the bacterial composition in the feces of roe deer and goats at the phylum level; (B) bacterial community composition in feces of roe deer and goats at the genus level; (C) the shared and unique bacterial OTUs between roe deer and goats; (D) comparing the diversity indices in feces between roe deer and goats; ns means no significant differences; (E) PCoA shows the change of bacterial community based on the Bray–Curtis dissimilarity matrix, unweighted UniFrac distance, and weighted UniFrac distance at the OTU level. ANOSIM and Adonis analyses were used for statistical testing of group similarities and differences. The proportion of variation explained for each axis is given after the colon. Samples from roe deer and goats were clustered into blue and red ellipses.
Fermentation 09 00186 g002
Figure 3. Heatmap showing the significantly changed bacteria in the feces of roe deer and goats at the genus level. Colors indicate the normalized relative abundance of each genus from minimum (blue) to maximum (yellow). The genera with relative abundances greater than 0.2% are presented in the heatmap. Samples from roe deer and goats are indicated by light blue and red bars at top of the heatmap.
Fermentation 09 00186 g003
Figure 4. Methanogen community composition in feces of roe deer and goats. (A) Clustering the methanogen in the feces of roe deer and goats at the phylum level; (B) the methanogen composition in feces of roe deer and goats at the species level; (C) the shared and unique OTUs of methanogens between roe deer and goats; (D) comparing the methanogen diversity indices in feces between roe deer and goats; ns means no significant differences; (E) PCoA results are based on the Bray–Curtis dissimilarity matrix, unweighted UniFrac distance, and weighted UniFrac distance at the OTU level. ANOSIM and Adonis analyses were used for statistical testing of group similarities and differences. The proportion of variation explained for each axis is given after the colon. Samples from roe deer and goats were clustered into blue and red ellipses.
Fermentation 09 00186 g004
Figure 5. The significantly different methanogen species in feces between roe deer and goats. The significances were determined using the Mann–Whitney test based on the Benjamini–Hochberg corrected p-values.
Fermentation 09 00186 g005
Figure 6. Differences in co-occurrence association networks between roe deer and goats. The association network of bacteria (genus), methanogens (species), digestibility, and gas yields between roe deer (A) and goats (B). The association network was calculated with the r.g function and was visualized in Cytoscape with the Radial layout algorithm layout. The densely connected networks in roe deer (C,D) and goats (E,F). The networks were identified by MCODE. The ellipse, rectangle, octagon, and diamond shapes represent bacteria, methanogens, digestibility, and gas yields, respectively. The shape size means the average relative abundance of taxa or the average amount of digestibility and gas yields. The colored ellipse and rectangle indicate bacteria and methanogens, respectively. The gray and pink edge lines represent negative and positive correlations, respectively. Edge width indicates the correlation coefficient, with bold lines for a greater coefficient, and thick lines for a weaker coefficient.
Fermentation 09 00186 g006
Disclaimer/Publisher’s Note: The statements, opinions and data contained in all publications are solely those of the individual author(s) and contributor(s) and not of MDPI and/or the editor(s). MDPI and/or the editor(s) disclaim responsibility for any injury to people or property resulting from any ideas, methods, instructions or products referred to in the content.

