Article

Changes in Bio-Functional Compounds, ACE Inhibition, and Antioxidant Capacity after Mixed Fermentation of Eight Whole Grains

Department of Food Science, National Chiayi University, #300 Xue-fu, Chiayi City 600, Taiwan
*
Author to whom correspondence should be addressed.
Fermentation 2023, 9(3), 209; https://doi.org/10.3390/fermentation9030209
Submission received: 6 February 2023 / Revised: 20 February 2023 / Accepted: 22 February 2023 / Published: 23 February 2023
(This article belongs to the Section Fermentation for Food and Beverages)

Abstract

:
Whole grains are rich in nutrients and antioxidants and can be fermented to increase their biological functions. This study used two fermentation steps to ferment eight whole grains. The bio-functional compounds, ACE inhibition, and antioxidant capacity were measured during the second fermentation step. The results indicate that the total phenols content increased by 2605%, total flavonoid content increased by 1707%, ABTS radical scavenging capacity increased by 239%, DPPH radical scavenging capacity increased by 325%, GABA increased by 4810%, glucuronic acid increased by 4278%, ACE inhibition increased by 69.28%, and total amino acids increased by 2197.72% after 13 weeks of fermentation. These results showed that a fermentation beverage with eight whole grains could be considered a drink with health benefits.

1. Introduction

Grains are an essential source of nutrition and energy [1]. Whole grains are rich in nutrients: dietary fiber, protein, and phytochemicals, including phenols, flavonoids, vitamins, and minerals, which are essential to human health [2]. Consuming whole grains has been associated with lower inflammation-related chronic diseases, including cardiovascular diseases, type-2 diabetes, and cancer [3]. Whole grains are rich in glutamic acid, which catalyzes the synthesis of γ-aminobutyric acid (GABA) and acts as a major inhibitory neurotransmitter in the mammalian central nervous system [4].
Microbial fermentation has been used to improve the nutritional and functional properties of grains in the cereal industry. Lactic acid bacteria fermentation is a cheap and effective value-added processing method for edible substances [5]. The microbial activity involved in the fermentation process alters the ratio of various nutrients and anti-nutrients, affects the product’s sensory properties, and increases nutrients’ bioaccessibility and bioavailability [6]. When oligopeptides in whole grains are released through microbial fermentation, they positively affect healthy functioning, such as increasing angiotensin converting enzyme’s (ACE) inhibition activity [7]. In addition, research has determined that many organic acids and GABA are produced during the microbial fermentation process [8].
No previous studies have been conducted on whole multigrains to quantify the metabolites’ bio-functional components and antioxidant capacity by using two-step fermentation. Unlike traditional fermentation that uses sugar as the starter, this research method uses the fermentation broth of eight whole grains saccharified by microorganisms as the fermentation starter (EGS). This study aimed to produce an eight-whole-grain fermentation beverage (EGB) using eight selected whole grains, including millet, wheat, sorghum, black rice, buckwheat, pear rice, black glutinous rice, and red quinoa. The EGB was evaluated in terms of GABA, glucuronic acid, amino acids, total flavonoid content, total phenols content, and the ability of DPPH radical scavenging, ABTS radical scavenging, and ACE inhibition during fermentation.

2. Materials and Methods

2.1. Chemicals and Reagents

NaCl (Sodium chloride) was purchased from Sigma Aldrich (Saint Louis, MO, USA). Quercetin was obtained from the Tokyo Chemical Industry Co. (Osaka, Japan). Methanol was purchased from Macron Fine Chemicals (Center Valley, PA, USA). Vitamin C (L-ascorbic acid) was obtained from Riedel-de Haën (Seelze, Germany). Gallic acid was purchased from Alfa Aesar (Santa Ana, CA, USA). NaOH (Sodium hydroxide), Acetonitrile, and Ortho phosphoric acid were obtained from Honeywell (Muskegon, MI, USA). All reagents were of the highest commercially available purity.

2.2. Materials

The eight whole grains used to ferment EGS and EGB in this study included the following: millet, wheat, sorghum, black rice, buckwheat, pear rice, black glutinous rice, and red quinoa. The grains were purchased at the Xing Yuan Xing store in Chiayi, Taiwan. The grains were crushed to a particle size of less than 5 mm and then filtered through a 10-mesh sieve to collect larger particles.

2.3. EGS and EGB Preparation

The EGS preparation involved mixing grains with a total of 5000 g (each grain weight was 625 g) with 20 L of reverse osmosis (RO) water and placed into a 69-liter jar. The jars of grain/water were stirred with a hand-held iron rod twice a day and maintained at 30 °C. After four months of fermentation, the mixtures were filtered and stored at room temperature for further analysis.
The total amount of grains for EGB was 1543 g (each kernel weighs 192 g), mixed with reverse osmosis water (6000 mL) and EGS (2000 mL). The fermentation process was conducted in three identical glass jars (10 L) for 13 weeks. Each jar was stirred twice a day and maintained at 30 °C. After stirring each jar for 15 min, a 120 mL sample was collected, filtered, and stored at 4 °C for subsequent analysis once a week.

2.4. Culture of Lactic Acid Bacteria and Identification

Identification of LAB viable cells (CFU/mL) was carried out by plating ten-fold dilutions of the EGB samples on MRS agar. Plates were incubated at anaerobically 37 °C for 48 h. Counting was performed in triplicate.
A single colony was selected and cultured for one day. The colony PCR was performed with 16S primers (16F: GTATTACCGCTGCTG/16R: AGAGTTTGATCCTGGCTCAG). DNA fragments were amplified as follows: initial denaturation at 95 °C for 5 min, followed by 35 cycles consisting of denaturation at 94 °C for 1 min, annealing at 36 °C for 1 min, extension at 72 °C for 1 min, and a 5 min final extension step at 72 °C. The PCR products were sequenced in The National Cheng Kung University Center for Genomics Medicine.

2.5. Total Phenolic Content (TPC) Assay

The total concentration of phenolic in the crude extract was determined by modifying the method of Taga et al. [9]. Test solutions of 25 μL were added to 1.0 mL of 2% Na2CO3. After 2 min, 250 μL of 50% Folin-Ciocalteau reagent was added and allowed to stand at 25 °C for 30 min. Absorbance was measured at 750 nm with a spectrophotometer (Metertech SP-830 Plus, Taipei, Taiwan). The blank sample consisted of all reagents and solvents without test compounds or standards. The standard was gallic acid prepared from 0.001 mg/mL to 1.0 mg/mL. The final TPC value was expressed as µg gallic acid equivalence (GAE) per gram (µg GAE/g) according to a gallic acid standard curve.

2.6. Total Flavonoid Content (TFC) Assay

The TFC of the extracts was determined using the modified method of Samsonowicz et al. [10]. This method involved mixing 0.2 mL of the appropriately diluted sample with 0.8 mL methanol, 400 µL 10% aluminum chloride, 400 µL 1 M potassium acetate, and 200 mL redistilled water. The sample was allowed to stand at 25 °C for 40 min. The absorbance of the reaction mixture was subsequently measured with a spectrophotometer (Metertech SP-830 Plus, Taipei, Taiwan) at 415 nm.

2.7. ABTS Radical Scavenging Assay

The ABTS radical inhibition was determined using the modified method of Samsonowicz et al. [10]. The stock solution of ABTS was prepared by dissolving 14 mM of ABTS salt and 4.9 mM K2S2O8 in 20 mL of deionized water. The prepared ABTS+ solution was diluted with deionized water and kept in darkness for 16 h.
After incubation, the radical solution was detected by spectrophotometry (Metertech SP-830 Plus, Taipei, Taiwan) until the initial absorbance value of 0.7 ± 0.005 at 734 nm was reached.
To determine the radical scavenging ability, 0.05 mL of the sample was added to 1.95 mL of diluted ABTS solution. Absorbance was measured after 6 min at 734 nm against water as blank. The inhibition of absorbance at 734 nm was calculated and plotted as a function of the antioxidants and Trolox concentrations for standard reference data.

2.8. DPPH Radical Scavenging Assay

The ability of tested infusion samples to quench the stable DPPH radical was determined by measuring the absorbance using a spectrophotometer (Metertech SP-830 Plus, Taipei, Taiwan). For the DPPH radical scavenging assay, 0.4 mL of the sample was added to 1 mL of a methanolic solution of DPPH (absorbance is approx. 1.2). The samples were incubated in the dark at room temperature for 50 min. Absorbance was measured at λ = 517 nm with water as the reference [10].

2.9. pH and Total Titratable Acidity (TTA) Determination

The pH of grain fermentation broth was measured using a pH meter (pH 2–11, Hanna, Padova, Italy). TTA analysis was carried out following the method outlined by Barbosa et al. [11]. Briefly, each sample (1 mL) mixed with distilled water (20 mL) was titrated with 0.1 M NaOH solution and used 1% phenolphthalein as an indicator. Then, the mass was stirred constantly while waiting for the first noticeable pink change. The results were expressed as the sample’s lactic acid concentration.

2.10. Analysis of Organic Acid, Carbohydrates, and Ethanol

EGB was filtered through a 0.22 μm sterile microfilter, and 10 μL of the filtrate was injected into the HPLC system (Shimadzu sci–10a, Kyoto, Japan). A C-18 column (4.6 mm × 250 mm, 5 μm; Hitachi High-Tech Fielding Corporation, Tokyo, Japan) employing a UV detector (210 nm) was used for the analysis. Moreover, the HPLC system was controlled with a flow rate of 0.6 mL/min and a running time of 40 min at 30 °C. We used 0.05 M H3PO4 to separate the three organic acids in the grain fermentation broth. The standards of lactic acid, acetic acid, and glucuronic acid were used in comparative analyses with the fermentation broth samples.
The analysis of glucose, fructose, and ethanol content was performed using an Agilent Hi-Plex H ion exchange column (300 mm × 7.7 mm) employing an RI detector. The HPLC system was controlled with a flow rate of 0.6 mL/min and a running time of 40 min at 30 °C.

2.11. GABA Measurements

GABA stock standard solutions (1000 ppm) were prepared by dissolving standards in separate 10 mL volumetric flasks and kept in a dark room. Working solutions of 1000, 500, 250, 125, and 62.5 ppm for each measure were prepared by diluting them with water. Each working solution (1 mL) was treated with 1 mL of 2-hydroxynaphthaldehyde (0.3% w/v) in methanol, followed by the addition of 0.5 mL of boric acid-NaOH buffer (pH 8.5) in a 5 mL volumetric flask. The resultant mixture was heated at 85 °C for 15 min in a water bath, and the solution was allowed to cool at room temperature. The volumes were adjusted to 5 mL with methanol and were kept at 4 °C until analysis, following the procedures conducted by [12,13]. The samples were filtered through a 0.22 μm sterile microfilter, and 10 μL of the filtrate was injected into the HPLC system (Shimadzu sci–10a, Japan).

2.12. ACE Inhibition Activities Assay

The samples’ ACE inhibition activity was determined by modifying the previous method [14]. For each assay, 9 μL of 0.1 M a potassium phosphate buffer (containing 0.3 M NaCl, pH 8.2) was mixed with 15 μL of Hippuryl-Histidyl-Leucine (4 mmol/L Hip-His-Leu in 0.1 M potassium phosphate buffer), along with 6 μL of the sample and 30 μL of ACE to a total volume of 60 μL. The solution was immersed in a water bath at 37 °C for 1 h. Next, 50 μL of HCl (1 N) was added to stop the reaction. Then, 100 μL of the coloring agent Pyridine and 50 μL of BSC were added. The mixture was shaken and quickly cooled to room temperature using an ice bath. Finally, 200 μL was transferred to a 96-well plate and measured at 410 nm with an absorbance spectrophotometer (BMG LABTECH, SPECTROstar Nano, Offenburg, Germany).

2.13. Amino Acid Analysis

Crude protein was calculated from the total nitrogen content determined using the Kjeldahl method with a nitrogen-to-protein conversion factor of 6.25 [15]. The samples were centrifuged at 15,000 rpm for 2 min, and the supernatant was appropriately diluted with 0.02 M HCl. An amino acid analyzer (L-8500 Amino Acid Analyzer, Hitachi co., Ltd., Tokyo, Japan) was used to perform the analysis for free amino acids, including Aspartic acid (Asp), Threonine (Thr), Serine (Ser), Proline (Pro), Glycine (Gly), Glutamic acid (Glu), Alanine (Ala), Cysteine (Cys), Valine (Val), Methionine (Met), Isoleucine (Ile), Leucine (Leu), Threonine (Tyr), Phenylalanine (Phe), Lysine (Lys), Histidine (His), and Arginine (Arg).

2.14. Statistical Analysis

All data were expressed as mean ± standard deviation (SD). Statistical significance was determined using an analysis of variance (one-way ANOVA) followed by IBM SPSS 10.0. The values were considered significantly different when p < 0.05. Duncan’s multiple range tests were used to rank the very different groups. All analyses were performed with Sigma Plot 10.

3. Results

3.1. Variable Bacteria Counts and Lactic Acid Bacteria Identification after Fermentation

The lactic acid bacteria concentration reached its highest value of 8.17 ± 0.08 log CFU/mL during the first week (Table 1). Three types of lactic acid bacteria were isolated, sequenced, and identified throughout the fermentation process: Limosilactobacillus fermentum LYC 1694, Levilactobacillus brevis LYC 1720, and Lactiplantibacillus plantarum LYC1721. All three strains are acid-resistant probiotics that produce a variety of organic acids and inhibit miscellaneous bacteria. Lactic acid bacteria species, such as L. fermentum, L. acidophilus, and L. plantarum, are widely used as probiotics in the food industry [6]. Limosilactobacillus fermentum can have the highest combined GABA and ACEi levels in milk containing from 8% to 12% skimmed solids and from 0.6% to 1% MSG at 37 °C [16]; it tolerates a pH between 3.4 and 8.8. Levilactobacillus brevis has the potential to produce GABA, provide numerous health benefits, and enhance food flavor [17].
In the first week, the lactic acid bacteria increased significantly. The amount of glucose rapidly rose to 3290.32 ± 70.86 ppm with an increase of 1229.91%. This is likely due to starch hydrolysis in the early fermentation stage. Raw materials, grains, and EGS are carbon sources for lactic acid bacteria. Their hydrolytic enzymes converted the substrates into free fructose and glucose. Fructose is an energy source for bacterial growth, and glucose is the primary precursor for synthesizing the final product. Lactic acid bacteria have high starch decomposition and proteolytic activity, promoting saccharification and protein degradation [18]. The lactic acid bacteria species caused the highest acidity value of 2.14% and the lowest pH value of 3.5 during the second week. Both lactic acid and acetic acid showed a significant increase and were positively correlated with the number of bacteria in the first week. The fermentation process likely provided abundant nutrients and an optimal environment for lactic acid bacterial growth, resulting in increased lactic acid and acetic acid production.
The increase in acetic acid and lactic acid leading to a decreased pH value may be primarily produced by the three lactic acid bacteria—Limosilactobacillus fermentum LYC1694, Levilactobacillus brevis LYC1720, and Lactiplantibacillus plantarum LYC1721 [19,20]. After the bacteria increased to a maximum in the first week, since the food source was depleted and acidity increased, the number of bacteria dropped rapidly to a low concentration in the second week. The second reduction in the number of bacteria occurred during week 7; lactic acid bacteria decreased to 6.61 ± 0.23 log CFU/mL, and fructose dropped to 46.48 ± 2.70 mg/L. This explains the rapid reduction in food source—fructose—and the worse environment, i.e., reduced pH value. During weeks 8 to 13, the number of bacteria showed an upward growth trend; however, the acidity slowly decreased in the last three weeks, and the pH increased to 3.88.
From weeks 1 to 8 of fermentation, the fructose was reduced by 97.78%, and glucose was decreased by 66.5% (Table 1). This indicates that the fermenting bacteria fully utilized fructose. The three bacteria could be monitored during the entire fermentation process, showing that they survived in an environment as low as pH 3.5 ± 0.04 and an acidity level of 2.14 ± 0.08%. These three acid-tolerant bacteria were dominant strains during the fermentation process. They produced lactic acid and acetic acid, propionic acid, phenyl lactic acid (PLA), formic acid, and succinic acid, which can all lower the pH value of an environment, thereby inhibiting the growth of several microorganisms [21].

3.2. Performance of Functional Compounds

Table 2 shows that the TPC increased by 422% in the first week and continued to increase until the 12th week, with a total increase of 2740.91%. Fermentation increases yield and the ability to change the profile of phenolic compounds. This is due to the degradation of cell wall structure by microbial enzymes produced during fermentation, combined with the release of phenolic compounds [22]. Polyphenolic compounds are secondary metabolites with health-promoting, tangible benefits, including antioxidant and anti-cancer activity [23]. TFC reached its peak in the 5th week, with a maximum of 83.33%.
After 13 weeks of fermentation, glucuronic acid increased from 2.05 ppm in week 0 to 8770.93 ppm in week 13 (Table 2). This study’s findings established the health benefits of using microorganisms to oxidize glucose to produce glucuronic acid directly. Microbial fermentation catalyzed the conversion of the C-6 hydroxyl group of glucose into a carboxyl group to form uronic acid. Glucuronic acid is well-known for its detoxifying effects through conjugation in liver metabolism [24].
Lactic acid bacteria can produce GABA, especially strains of Levilactobacillus brevis, that can accumulate high levels of GABA [25]. Throughout the 13 weeks of fermentation in this study, the concentration of GABA increased significantly, especially between the 2nd and 3rd weeks (Table 2). GABA increased from 36.16 to 1775.61 ppm, an increase of 4810.43% after fermentation. The increase in GABA is due to glutamate decarboxylase (GAD, EC 4.1.1.15), which catalyzes the irreversible α-decarboxylation of glutamate to produce GABA [26] through lactic acid bacteria. The primary function of GABA acts as an inhibitory neurotransmitter in the central nervous system; it has been shown to produce potential therapeutic effects on blood pressure, stress, cancer, depression, and inflammatory diseases [27,28]. Synthetic GABA, however, may exhibit undesirable side effects, such as drowsiness and dizziness, whereas natural GABA has fewer side effects [29].

3.3. Effect on Antioxidant Capacity

Free radical reactions, especially with the participation of oxidative stress, result in damage to lipids, proteins, cell membranes, and nucleic acids, thereby causing various diseases [30]. The DPPH and ABTS (free radical scavengers) antioxidant capacity increased over 13 weeks to 1680% and 239%, respectively. This increase is possibly due to the enhanced extractability of the polyphenols and the microbial metabolism of polyphenols into more redox forms (e.g., flavonoid aglycones and phenolic acid) [31]. Although TFC began to decline slowly in the 6th week, the overall DPPH and ABTS continued to increase to the end of fermentation; the TPC continued to grow throughout the fermentation process. This study revealed that whole grain fermentation has a strong/potent free radical scavenging capacity.

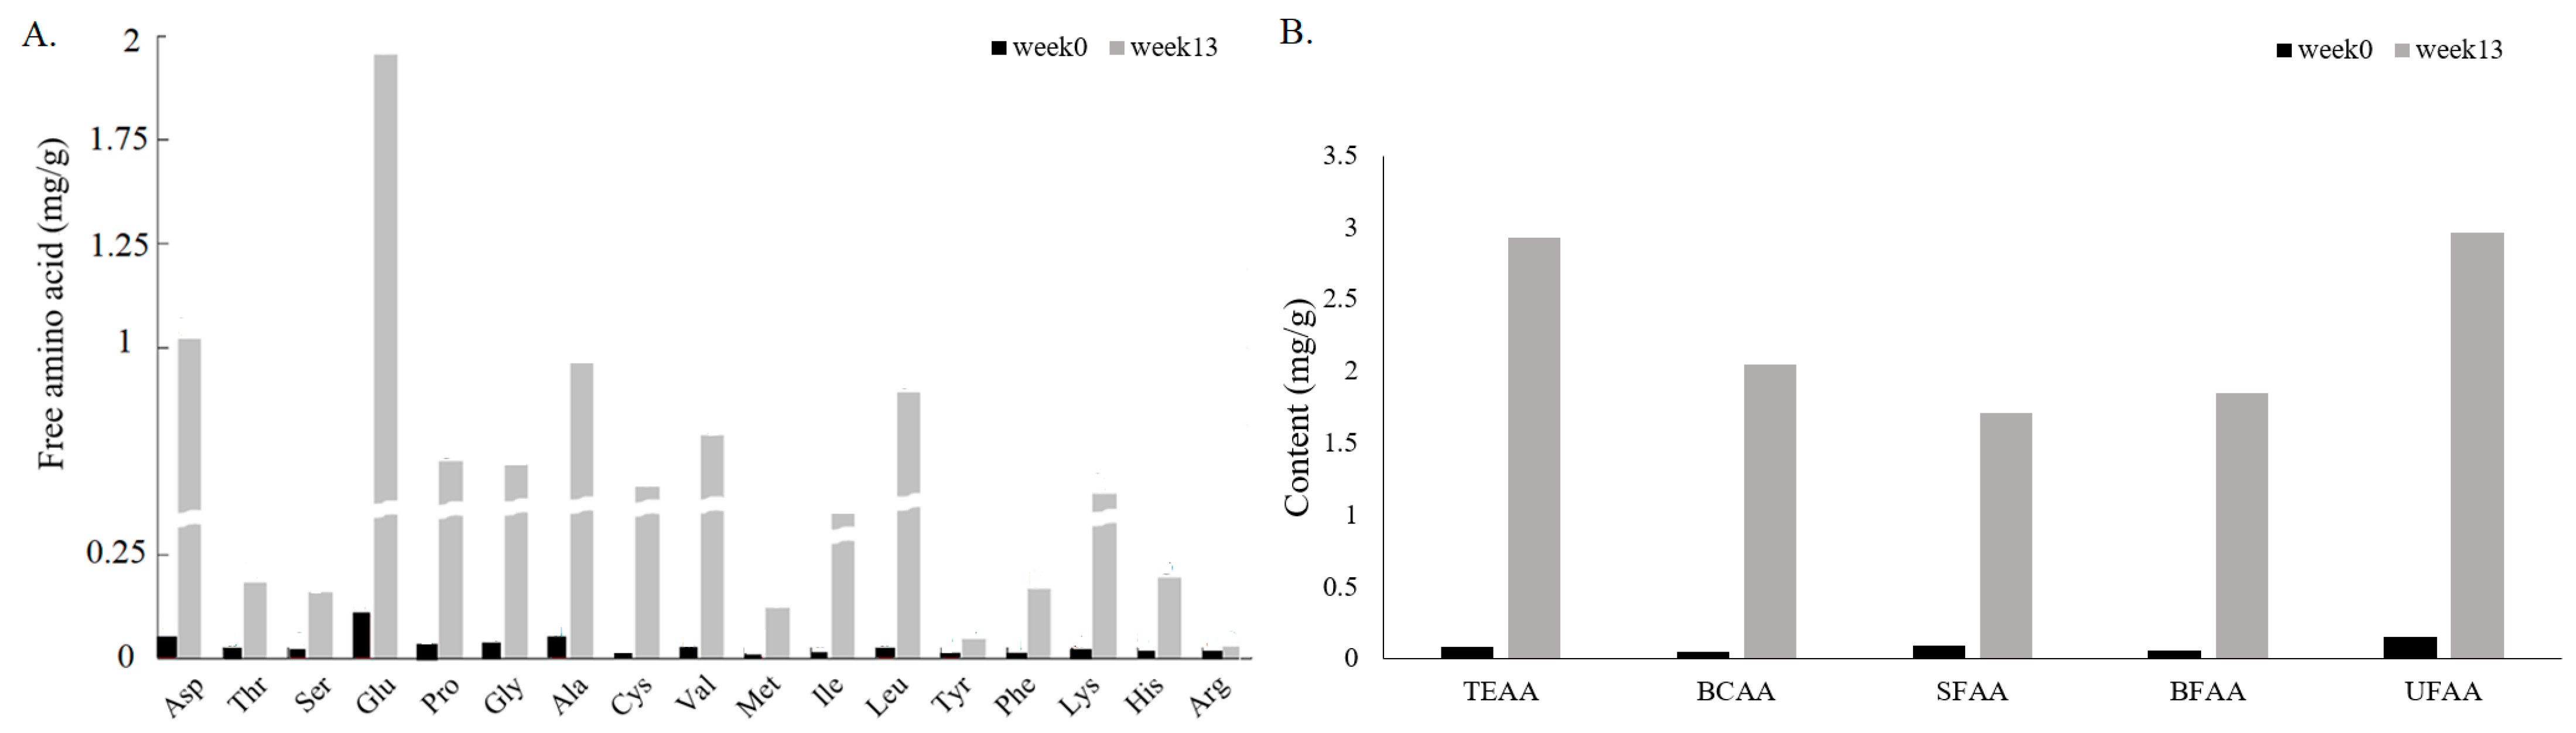
3.4. Effect on Amino Acids

In this study, total amino acids (TFAAs) were measured before and after fermentation and tested using the amino acid hydrolysis method. The crude protein content of the EWG fermentation sample was 1.14 g/100 g before fermentation; it was not detected after 13 weeks. After fermentation, total amino acids showed a significant increase of 2197.72% of total amino acids from 0.414 mg/g to 9.496 mg/g (Figure 1A). This indicates that microorganisms metabolize the crude protein to amino acids during the fermentation. Glutamic acid (Glu) is considered the body’s most abundant and versatile amino acid. It is a critical compound in cellular metabolism and a source of umami. This study found that the amount of Glu was highest after fermentation; the other 16 amino acids showed an increase of 1749.52% from 0.105 to 1.942 mg/g during fermentation. Aspartic acid (Asp) was the second highest content among the 17 tested amino acids, with an increase of 2033.33% from 0.048 to 1.024 mg/g. Asp is the raw material for various amino acids, including four essential amino acids: methionine, threonine, isoleucine, and lysine. A large population-based cohort study reported that nine amino acids, including Glu and Asp, are associated with decreased insulin secretion and increased glucose levels [32]. The most significant increase was tyrosine (Tyr), with a rise of 6100%. Tyr is the precursor for neurotransmitters and increases plasma neurotransmitters (mainly dopamine and norepinephrine). Tyr plays a role in the body’s response to stress and temperature regulation [33]. Methionine (Met) increased to 5300%. Met is one of nine essential amino acids in humans. Met plays a vital role in the process of angiogenesis. In addition, Met is an antidote to copper poisoning, and other heavy metal poisonings, by providing sulfhydryl groups [34].
After 13 weeks of fermentation, seven of the nine essential amino acids (TEAAs, including histidine, isoleucine, leucine, lysine, methionine, phenylalanine, threonine, and valine) and two branched-chain amino acids (BCAAs, including leucine, isoleucine, and valine) showed a significant increase. Before and after fermentation, TEAAs and BACCs significantly increased by 3191% and 3762%, respectively (Figure 1B). Two BCAAs, Leucine (Leu) and Valine (Val), increased by 4170% and 3309.52%, respectively, because whole grains are rich in Leu and Val. BCAAs could increase alanine aminotransferase, aspartate aminotransferase, serum albumin, nitrogen balance, ammonia, and urea, and the general condition of the patient for improving malnutrition, hypercatabolism, and sarcopenia [35].
The sensory properties of amino acids can be classified into three groups: sweetish amino acids (SFAAs), bitter amino acids (BFAAs), and umami amino acids (UFAAs). SFAAs include Ala, Gly, Pro, Ser, and Thr. Meanwhile, UFAAs include Asp and Glu [36]. BFAAs include Pro, Gly, Ala, Val, Leu, Tyr, and Phe [37]. In terms of sensory qualities, BFAAs, SFAAs, and UFAA had a significant increase of 3193%, 1839%, and 1939%, respectively, before and after fermentation. Although the content of BFAAs increased the most, it (1.85 mg/g) was still the lowest among the three groups. Sweet and umami accounted for 49.24% of all amino acid contents, with a luscious taste.

3.5. Effect on the ACE Inhibition Capacity

ACE inhibition has the effect of lowering blood pressure [38]. ACE inhibition capacity showed a significant increase after fermentation in our study; it reached the highest in the 13th week. ACE inhibition rose from 44.52% to 75.34%, an increase of 69.28% (Table 3), after 13 weeks of fermentation. The protein hydrolysate of α-kefiran likely has ACE inhibition qualities [39] through grain fermentation. While ACE inhibition lowers blood pressure [38], clinical studies have shown that synthetic ACE inhibition has negative side effects on the human body [40]. These negative effects have prompted the development of natural, safe, and novel ACE-inhibiting foods. Bioactive peptides, produced by eight-whole-grain fermentation, can be a healthier, natural alternative to ACE-inhibiting drugs.

3.6. Correlation Analysis

There was a moderate positive correlation between acidity and flavonoids (r = 0.5) (Figure 2). This is because flavonoids contain phenolic hydroxyl groups. Glucose was moderately positively correlated with bacillus strains (r = 0.56); bacillus strains continuously metabolized fructose to produce glucuronic acid and cellulose, and carbohydrates were continuously glycolyzed to make glucose, lactic acid, and fructose. Our findings indicate that glucuronic acid and fructose were negatively correlated. The three strains produced ethanol in heterogeneous fermentation with the duration of fermentation time. Lactic acid, ethanol, TPC, DPPH, ABTS, GABA, and glucuronic acid all increased with fermentation duration, resulting in moderate to strong positive correlations. TFC, ABTS, GABA, and ethanol showed a moderate positive correlation with lactic acid; however, lactic acid showed a strong negative correlation with fructose (r = −0.78). The Bacillus strains metabolized fructose to produce lactic acid, decreasing fructose with fermentation time. This resulted in a strong negative correlation of fructose with TPC, DPPH, ABTS, glucuronic acid, GABA, and ethanol (r = −0.92, −0.87, −0.80, −0.83, −0.84, −0.83, respectively). TPC had a strong positive correlation with DPPH and ABTS (r = 0.9, r = 0.88), indicating that the antioxidant capacity strongly correlated with TPC. There was no significant correlation between the number of bacteria and other components except glucose. We found that the metabolites of ethanol and fructose were not directly related to the number of bacteria but related to other biologically active components.

4. Conclusions

This study used two fermentation steps to ferment eight whole grains. Three new lactic acid bacteria strains were isolated from EGB. The phytochemical compounds (TPC, TFC, GABA, glucuronic acid) and the abilities of ACE inhibition and free radical scavenging activities (DPPH, ABTS) of EGB significantly increased during 13 weeks of fermentation. All the amino acids increased in concentration; seven increased by more than 30%. Significant increases in SFAAs and UFAAs after fermentation enhance flavors and provide substrates beneficial to the human body in producing proteins. These results indicated that the EGB could be a potential beverage leading to agricultural-based, health-care, and disease-prevention benefits. In the future, the EGS can be fermented by adding other vegetables, fruits, or herbs to develop more functional beverages.

Author Contributions

All authors contributed to the study conception and design. Y.-C.L., Chiayi University (NCYU), provided useful discussion and experimental design. The experimental design execution and the first draft of the manuscript were written by C.-F.W. and all authors commented on the manuscript before it was completed. Material preparation, data collection, and analysis were performed by C.-R.H. All authors have read and agreed to the published version of the manuscript.

Funding

The authors declare that no funds, grants, or other support were received during the preparation of this manuscript.

Institutional Review Board Statement

Not applicable.

Informed Consent Statement

Not applicable.

Data Availability Statement

The datasets generated during the current study are available from the contributor on reasonable request.

Acknowledgments

The authors acknowledge the National Chiayi University (NCYU) for laboratory facilities support.

Conflicts of Interest

We declare that the research was conducted in the absence of any commercial or financial relationship that could be construed as a potential conflict of interest.

References

  1. Dordević, T.M.; Šiler-Marinković, S.S.; Dimitrijević-Branković, S.I. Effect of Fermentation on Antioxidant Properties of Some Cereals and Pseudo Cereals. Food Chem. 2010, 119, 957–963. [Google Scholar] [CrossRef]
  2. Wang, C.Y.; Wu, S.J.; Shyu, Y.T. Antioxidant Properties of Certain Cereals as Affected by Food-Grade Bacteria Fermentation. J. Biosci. Bioeng. 2014, 117, 449–456. [Google Scholar] [CrossRef] [PubMed]
  3. Awika, J.M.; Rose, D.J.; Simsek, S. Complementary Effects of Cereal and Pulse Polyphenols and Dietary Fiber on Chronic Inflammation and Gut Health. Food Funct. 2018, 9, 1389–1409. [Google Scholar] [CrossRef] [PubMed]
  4. Mabunga, D.F.N.; Gonzales, E.L.T.; Kim, H.J.; Choung, S.Y. Treatment of GABA from Fermented Rice Germ Ameliorates Caffeine-Induced Sleep Disturbance in Mice. Biomol. Ther. 2015, 23, 268–274. [Google Scholar] [CrossRef] [PubMed] [Green Version]
  5. Lv, M.; Aihaiti, A.; Liu, X.; Tuerhong, N.; Yang, J.; Chen, K.; Wang, L. Development of Probiotic-Fermented Black Mulberry (Morus nigra L.) Juice and Its Antioxidant Activity in C2C12 Cells. Fermentation 2022, 8, 697. [Google Scholar] [CrossRef]
  6. Algonaiman, R.; Alharbi, H.F.; Barakat, H. Antidiabetic and Hypolipidemic Efficiency of Lactobacillus plantarum Fermented Oat (Avena Sativa) Extract in Streptozotocin-Induced Diabetes in Rats. Fermentation 2022, 8, 267. [Google Scholar] [CrossRef]
  7. Bouchard, J.; Malalgoda, M.; Storsley, J.; Malunga, L.; Netticadan, T.; Thandapilly, S.J. Health Benefits of Cereal Grain-and Pulse-Derived Proteins. Molecules 2022, 27, 3746. [Google Scholar] [CrossRef]
  8. Jayabalan, R.; Malbaša, R.V.; Lončar, E.S.; Vitas, J.S.; Sathishkumar, M. A Review on Kombucha Tea -Microbiology, Composition, Fermentation, Beneficial Effects, Toxicity, and Tea Fungus. Compr. Rev. Food Sci. Food Safet 2014, 13, 538–550. [Google Scholar] [CrossRef]
  9. Taga, M.S.; Miller, E.E.; Pratt, D.E. Chia Seeds as a Source of Natural Lipid Antioxidants. J. Am. Oil Chem. Soc. 1984, 61, 928–931. [Google Scholar] [CrossRef]
  10. Samsonowicz, M.; Regulska, E.; Karpowicz, D.; Leśniewska, B. Antioxidant Properties of Coffee Substitutes Rich in Polyphenols and Minerals. Food Chem. 2019, 278, 101–109. [Google Scholar] [CrossRef]
  11. Barbosa, M.D.S.G.; Scholz, M.B.D.S.; Kitzberger, C.S.G.; Benassi, M.D.T. Correlation between the Composition of Green Arabica Coffee Beans and the Sensory Quality of Coffee Brews. Food Chem. 2019, 292, 275–280. [Google Scholar] [CrossRef] [PubMed]
  12. Hayat, A.; Jahangir, T.M.; Khuhawar, M.Y.; Alamgir, M.; Siddiqui, A.J.; Musharraf, S.G. Simultaneous HPLC Determination of Gamma Amino Butyric Acid (GABA) and Lysine in Selected Pakistani Rice Varieties by Pre-Column Derivatization with 2-Hydroxynaphthaldehyde. J. Cereal Sci. 2014, 60, 356–360. [Google Scholar] [CrossRef]
  13. Hayat, A.; Jahangir, T.M.; Khuhawar, M.Y.; Alamgir, M.; Hussain, Z.; Haq, F.U.; Musharraf, S.G. HPLC Determination of Gamma Amino Butyric Acid (GABA) and Some Biogenic Amines (BAs) in Controlled, Germinated, and Fermented Brown Rice by Pre-Column Derivatization. J. Cereal Sci. 2015, 64, 56–62. [Google Scholar] [CrossRef]
  14. Je, J.; Park, J.; Jung, W.; Park, P.; Kim, S. Isolation of Angiotensin I Converting Enzyme (ACE) Inhibitor from Fermented Oyster Sauce, Crassostrea gigas. Food Chem. 2005, 90, 809–814. [Google Scholar] [CrossRef]
  15. Sritongtae, B.; Sangsukiam, T.; Morgan, M.R.A.; Duangmal, K. Effect of Acid Pretreatment and the Germination Period on the Composition and Antioxidant Activity of Rice Bean (Vigna Umbellata). Food Chem. 2017, 227, 280–288. [Google Scholar] [CrossRef] [PubMed] [Green Version]
  16. Tung, Y.T.; Lee, B.H.; Liu, C.F.; Pan, T.M. Optimization of Culture Condition for ACEI and GABA Production by Lactic Acid Bacteria. J. Food Sci. 2011, 76, 585–591. [Google Scholar] [CrossRef]
  17. Bao, W.; Huang, X.; Liu, J.; Han, B.; Chen, J. Influence of Lactobacillus brevis on Metabolite Changes in Bacteria-Fermented Sufu. J. Food Sci. 2020, 85, 165–172. [Google Scholar] [CrossRef] [PubMed]
  18. Li, R.Y.; Zheng, X.W.; Zhang, X.; Yan, Z.; Wang, X.Y.; Han, B.Z. Characterization of Bacteria and Yeasts Isolated from Traditional Fermentation Starter (Fen-Daqu) through a 1H NMR-Based Metabolomics Approach. Food Microbiol. 2018, 76, 11–20. [Google Scholar] [CrossRef] [PubMed]
  19. Ruiz-Moyano, S.; Martín, A.; Benito, M.J.; Hernández, A.; Casquete, R.; de Guia Córdoba, M. Application of Lactobacillus fermentum HL57 and Pediococcus acidilactici SP979 as Potential Probiotics in the Manufacture of Traditional Iberian Dry-Fermented Sausages. Food Microbiol. 2011, 28, 839–847. [Google Scholar] [CrossRef]
  20. Neveling, D.P.; Endo, A.; Dicks, L.M.T. Fructophilic Lactobacillus kunkeei and Lactobacillus brevis Isolated from Fresh Flowers, Bees and Bee-Hives. Curr. Microbiol. 2012, 65, 507–515. [Google Scholar] [CrossRef]
  21. Martínez-Anaya, M.A.; Llin, M.L.; Macías, M.P.; Collar, C. Regulation of acetic acid production by homo-and heterofermentative lactobacilli in whole-wheat sour-doughs. Z. Für Lebensm. -Unters. Und Forsch. 1994, 199, 186–190. [Google Scholar] [CrossRef] [PubMed]
  22. Huynh, N.T.; VanCamp, J.; Smagghe, G.; Raes, K. Improved Release and Metabolism of Flavonoids by Steered Fermentation Processes: A Review. Int. J. Mol. Sci. 2014, 15, 19369–19388. [Google Scholar] [CrossRef] [PubMed]
  23. Pandey, K.B.; Rizvi, S.I. Plant Polyphenols as Dietary Antioxidants in Human Health and Disease. Oxidative Med. Cell. Longev. 2009, 2, 270–278. [Google Scholar] [CrossRef] [Green Version]
  24. Mehreen, Z.; Linda, E.T.; Hugues, B.M.; Keith, N.E.; Kerry, R.; Grace, L.; Christian, H.; Parastoo, A.; Chow, H.L. Structural elucidation and immuno-stimulatory activity of a novel polysaccharide containing glucuronic acid from the fungus Echinodontium tinctorium. Carbohydr. Polym. 2021, 258, 117700. [Google Scholar]
  25. Mancini, A.; Carafa, I.; Franciosi, E.; Nardin, T.; Bottari, B.; Larcher, R.; Tuohy, K.M. In Vitro Probiotic Characterization of High GABA Producing Strain Lactobacilluas brevis DSM 32386 Isolated from Traditional “Wild” Alpine Cheese. Ann. Microbiol. 2019, 69, 1435–1443. [Google Scholar] [CrossRef]
  26. Garzón, A.G.; Van deVelde, F.; Drago, S.R. Gastrointestinal and Colonic in Vitro Bioaccessibility of γ-Aminobutiric Acid (GABA) and Phenolic Compounds from Novel Fermented Sorghum Food. Lwt 2020, 130, 109664. [Google Scholar] [CrossRef]
  27. Cui, Y.; Miao, K.; Niyaphorn, S.; Qu, X. Production of Gamma-Aminobutyric Acid from Lactic Acid Bacteria: A Systematic Review. Int. J. Mol. Sci. 2020, 21, 995. [Google Scholar] [CrossRef] [Green Version]
  28. Tian, J.; Yong, J.; Dang, H.; Kaufman, D.L. Oral GABA Treatment Downregulates Inflammatory Responses in a Mouse Model of Rheumatoid Arthritis. Autoimmunity 2011, 44, 465–470. [Google Scholar] [CrossRef] [Green Version]
  29. Rashmi, D.; Zanan, R.; John, S.; Khandagale, K.; Nadaf, A. γ-Aminobutyric Acid (GABA): Biosynthesis, Role, Commercial Production, and Applications. Stud. Nat. Prod. Chem. 2018, 57, 413–452. [Google Scholar]
  30. Mohamed, L.K.; Sulieman, M.A.; Yagoub, A.E.A.; Mohammed, M.A.; Alhuthayli, H.F.; Mohamed Ahmed, I.A.; Almaiman, S.A.; Alfawaz, M.A.; Osman, M.A.; Hassan, A.B. Changes in Phytochemical Compounds and Antioxidant Activity of Two Irradiated Sorghum (Sorghum bicolor (L.) Monech) Cultivars during the Fermentation and Cooking of Traditional Sudanese Asida. Fermentation 2022, 8, 60. [Google Scholar] [CrossRef]
  31. Ravisankar, S.; Queiroz, V.A.V.; Awika, J.M. Rye Flavonoids—Structural Profile of the Flavones in Diverse Varieties and Effect of Fermentation and Heat on Their Structure and Antioxidant Properties. Food Chem. 2020, 324, 126871. [Google Scholar] [CrossRef] [PubMed]
  32. Maltais-Payette, I.; Boulet, M.M.; Prehn, C.; Adamski, J.; Tchernof, A. Circulating Glutamate Concentration as a Biomarker of Visceral Obesity and Associated Metabolic Alterations. Nutr. Metab. 2018, 15, 78. [Google Scholar] [CrossRef] [PubMed]
  33. Hao, S.; Avraham, Y.; Bonne, O.; Berry, E.M. Separation-Induced Body Weight Loss, Impairment in Alternation Behavior, and Autonomic Tone: Effects of Tyrosine. Pharmacol. Biochem. Behav. 2001, 68, 273–281. [Google Scholar] [CrossRef] [PubMed]
  34. Willke, T. Methionine Production—A Critical Review. Appl. Microbiol. Biotechnol. 2014, 98, 9893–9914. [Google Scholar] [CrossRef] [PubMed]
  35. Aung, T.; Park, S.S.; Kim, M.J. Influence of Lactobacillus (LAB) Fermentation on the Enhancement of Branched Chain Amino Acids and Antioxidant Properties in Bran among Wheat By-Products. Fermentation 2022, 8, 732. [Google Scholar] [CrossRef]
  36. Li, Z.; Hong, T.; Shen, G.; Gu, Y.; Guo, Y.; Han, J. Amino Acid Profiles and Nutritional Evaluation of Fresh Sweet–Waxy Corn from Three Different Regions of China. Nutrients 2022, 14, 3887. [Google Scholar] [CrossRef] [PubMed]
  37. Zhao, C.J.; Schieber, A.; Gänzle, M.G. Formation of Taste-Active Amino Acids, Amino Acid Derivatives and Peptides in Food Fermentations—A Review. Food Res. Int. 2016, 89, 39–47. [Google Scholar] [CrossRef] [PubMed]
  38. Heran, B.S.; Wong, M.M.Y.; Heran, I.K.; Wright, J.M. Blood Pressure Lowering Efficacy of Angiotensin Receptor Blockers for Primary Hypertension. Cochrane Database Syst. Rev. 2008, 4, CD003823. [Google Scholar] [CrossRef]
  39. Kamath, V.; Niketh, S.; Chandrashekar, A.; Rajini, P.S. Chymotryptic Hydrolysates of α-Kafirin, the Storage Protein of Sorghum (Sorghum bicolor) Exhibited Angiotensin Converting Enzyme Inhibitory Activity. Food Chem. 2007, 100, 306–311. [Google Scholar] [CrossRef]
  40. Wu, N.; Xu, W.; Liu, K.; Xia, Y. Shuangquan.Angiotensin-Converting Enzyme Inhibitory Peptides from Lactobacillus delbrueckii QS306 Fermented Milk. J. Dairy Sci. 2019, 102, 5913–5921. [Google Scholar] [CrossRef]
Figure 1. Content changes in amino acid fermentation when unfermented and after 13 weeks of fermentation: (A) total free amino acids; (B) bitter amino acids (BFAAs), sweetish amino acids (SFAAs), umami amino acids (UFAAs), essential amino acids (TEAAs), and branched chain amino acids (BCAAs).
Fermentation 09 00209 g001
Figure 2. Pearson correlation analysis between nutritional and bio-functional compounds and antioxidant capacity. The color of the circle represents a positive (green), negative (red), or low (yellow) correlation among these indicators. The color shades represent the correlation level coefficient; the darker the color, the higher the correlation.
Fermentation 09 00209 g002
Table 1. Variety of EGB from weeks 0 to 13 of bacteria concentration and composition value changes during fermentation.
Time
(Week)
Total Latic Acid Bacteria (Log CFU/mL)Acidity
(%)
pHAcetic Acid
(mg/L)
Lactic Acid
(mg/L)
Glucose
(mg/L)
Fructose
(mg/L)
02.41 ± 0.08a1.13 ± 0.04a3.73 ± 0.05f7461.16 ± 51.57a3690.08 ± 374.88a247.41 ± 4.03a1987.55 ± 148.19f
18.17 ± 0.08n1.61 ± 0.04d3.71 ± 0.03def14,371.71 ± 30.50g9515.13 ± 71.54b3290.32 ± 70.86h2391.98 ± 47.92g
27.11 ± 0.43e2.14 ± 0.08g3.50 ± 0.04a14,360.30 ± 62.67g13,267.98 ± 75.77d1233.54 ± 48.50e1429.02 ± 34.23e
37.24 ± 0.12g2.02 ± 0.08f3.62 ± 0.05bcd13,754.15 ± 89.99f12,634.07 ± 171.07c1050.98 ± 29.09b689.88 ± 130.90d
47.32 ± 0.06m1.88 ± 0.07e3.56 ± 0.07ab11,960.60 ± 419.38d17,165.70 ± 135.35g1191.99 ± 1.66de511.35 ± 23.72c
57.52 ± 0.06k1.78 ± 0.06e3.67 ± 0.03cde11,729.57 ± 253.93d17,165.70 ± 47.98g1185.23 ± 1.82d188.57 ± 35.18b
67.20 ± 0.13d1.80 ± 0.08e3.69 ± 0.02cdef12,089.86 ± 68.15de19,448.19 ± 679.30i1280.39 ± 8.51f99.50 ± 9.03ab
76.61 ± 0.23b1.78 ± 0.02e3.60 ± 0.04bc12,142.85 ± 27.60de18,449.03 ± 151.61h1363.73 ± 24.41g46.48 ± 2.70a
87.07 ± 0.05c1.65 ± 0.03d3.68 ± 0.02cdef10,488.22 ± 43.81b15,082.07 ± 519.15e1128.48 ± 4.77c25.05 ± 2.80a
97.31 ± 0.09f1.47 ± 0.11c3.72 ± 0.06def10,892.34 ± 23.53c16,094.12 ± 183.63f1191.64 ± 9.98de47.46 ± 6.32a
107.43 ± 0.28h1.66 ± 0.09d3.77 ± 0.05ef12,413.94 ± 207.60e18,760.00 ± 203.33h1336.00 ± 21.36g37.25 ± 1.62a
117.40 ± 0.07i1.45 ± 0.03c3.74 ± 0.05ef15,623.31 ± 315.64h17,067.05 ± 17.57g1287.97 ± 4.10f40.38 ± 3.41a
127.49 ± 0.21j1.40 ± 0.05c3.71 ± 0.02def16,448.87 ± 200.12i13,087.13 ± 60.47cd1011.62 ± 4.20b51.37 ± 0.30a
137.40 ± 0.03l1.27 ± 0.07b3.88 ± 0.13g14,585.03 ± 600.99g13,246.34 ± 206.11d1102.80 ± 3.49c57.53 ± 0.04a
Values are expressed as the mean ± SD. Means in the same line followed by different letters are significantly different (p < 0.05). (p < 0.05) based on the one-way analysis of variance (ANOVA). The letters “a, b, c, d, e, f, g, h, i” from small row to large mark significant differences.
Table 2. Changes in glucuronic acid, GABA, total phenolic contents, and total flavonoid contents during 13 weeks of fermentation.
Time (Week)Glucuronic Acid (ppm)GABA (ppm)TPC (mg Gallic Acid/mL)TFC (mg Quercetin/L)
05.29 ± 0.02a36.16 ± 3.82a0.044 ± 0.01a10.43 ± 0.69a
15122.65 ± 45.87b82.98 ± 4.23a0.23 ± 0.07b17.86 ± 1.53d
26193.77 ± 44.90c701.81 ± 12.34b0.35 ± 0.01c13.56 ± 1.10bc
36497.49 ± 56.96d742.53 ± 8.14b0.84 ± 0.04d15.00 ± 0.70c
48019.57 ± 25.02f780.58 ± 14.03bc0.93 ± 0.02ef15.10 ± 0.87b
58059.23 ± 51.16f951.34 ± 19.24d0.85 ± 0.05d20.58 ± 1.54e
68890.20 ± 74.60h803.90 ± 20.26bc0.90 ± 0.07de17.94 ± 0.39d
78672.23 ± 72.85g884.68 ± 22.80cd0.94 ± 0.02 ef18.49 ± 0.10d
87454.21 ± 43.55e1503.62 ± 5.54e0.94 ± 0.03ef14.08 ± 1.33bc
97970.00 ± 35.45f1523.23 ± 49.95e0.96 ± 0.02efg13.53 ± 0.58bc
109644.19 ± 110.85i1750.23 ± 8.56f1.08 ± 0.01fg12.90 ± 1.30b
118793.23 ± 77.04gh1547.32 ± 12.35e1.04 ± 0.01g12.95 ± 0.94b
128857.65 ± 67.10gh1516.91 ± 25.16e1.25 ± 0.04i12.21 ± 1.36b
138683.66 ± 42.02gh1775.61 ± 84.28f1.19 ± 0.05h12.21 ± 1.20b
Data are the means ± SD of two independent experiments. Means in the same line followed by different letters are significantly different (p < 0.05). The letters “a, b, c, d, e, f, g, h, and i” from small row to large mark significant differences (p < 0.05) based on the one-way analysis of variance (ANOVA). Abbreviations: TPC: Total phenols contents; TFC: Total flavonoids contents.
Table 3. ACE inhibition, antioxidant capacity of EGB during 13 weeks of fermentation.
Time (Week)ABTS (μg Trolox/mL)DPPH (μg Trolox/mL)ACEi (%)
0181.43 ± 21.72a88.21 ± 5.76 a44.52 ± 0.05b
1307.22 ± 20.07b183.55 ± 16.03b37.40 ± 0.02a
2329.05 ± 15.48bc227.99 ± 15.25c46.23 ± 0.01b
3354.05 ± 28.15c240.86 ± 4.35cd58.77 ± 0.02c
4357.22 ± 31.86c264.10 ± 15.17de56.03 ± 0.01c
5420.32 ± 14.69d280.90 ± 10.24ef70.55 ± 0.08g
6453.25 ± 8.10de311.11 ± 7.38gh66.44 ± 0.01def
7465.56 ± 15.07ef352.86 ± 23.14hi69.80 ± 0.04fg
8442.94 ± 11.50de294.70 ± 3.71fg66.93 ± 0.02efg
9497.70 ± 17.10f319.02 ± 16.29ghi64.04 ± 0.01de
10554.05 ± 30.88g348.03 ± 14.63ijk65.55 ± 0.01de
11581.43 ± 31.97gh359.23 ± 13.77jk64.04 ± 0.04de
12605.24 ± 2.06h331.11 ± 15.74hij62.67 ± 0.06d
13614.76 ± 4.12h374.87 ± 20.08k75.34 ± 0.05h
Values of ACE inhibition, ABTS, and DPPH after 13 weeks of EGB. Values are expressed as the mean ± SD. Means in the same line followed by different letters are significantly different (p < 0.05). The letters “a, b, c, d, e, f, g, h, i, j, and k” from small row to large mark significant differences (p < 0.05) based on the one-way analysis of variance (ANOVA).
Disclaimer/Publisher’s Note: The statements, opinions and data contained in all publications are solely those of the individual author(s) and contributor(s) and not of MDPI and/or the editor(s). MDPI and/or the editor(s) disclaim responsibility for any injury to people or property resulting from any ideas, methods, instructions or products referred to in the content.

