Abstract
Rumen fermentation (RF) is a complex system of oxidation–reduction reactions governed by the rumen microbiota, and its end-products are the volatile fatty acids (VFAs) which constitute the main energy source for the host animal. We speculated that the process could be manipulated through electrofermentation (EF) by utilizing solid-state electrodes as electron sources. This study aimed to evaluate the effects of single-chamber EF applied (0.4 vs. 0.9 V) for 6, 12, or 24 h to rumen fluid on the resulting microbial biomass, dry matter digestibility (DMD), VFA production, NADH/NAD ratio, and composition of the rumen fluid’s bacterial communities. The application of a 0.9 V electric potential for 24 h produced the most significant changes in RF compared to the control treatment (0V), increasing microbial biomass (12%), DMD (58%), and VFA concentrations (~84%), and reducing NAD/NADH ratio (~50%) without a significant impact on bacterial diversity. These results suggest that the application of a 0.9 V electric potential allows the microbiota to better hydrolyze and digest the feed’s components and could offer an electron sink for the production of VFAs. Hence, EF can provide innovative solutions to a range of challenges that limit the RF process. Nonetheless, more studies are needed to understand how the solid electrodes and external electric energy function.
1. Introduction
Ruminants have a digestive tract that is evolutionarily adapted for feeding on fibrous roughage, some of which is undigestible for humans and other animals [1]. They convert these materials through a fermentation process governed by the microbiota in the rumen (ruminal fermentation; RF). Hence, ruminal microbes play a key role in the degradation of feed carbohydrates such as cellulose, hemicellulose, pectin, and starch, as well as fats, proteins, and nonprotein nitrogen [1,2]. The main end-products of RF are volatile fatty acids (VFAs), such as acetate, propionate, and butyrate, which constitute up to 80% of the energy available to the host animal; the rest is lost and released as carbon dioxide, methane, and heat [3].
A complex and dynamic microbial ecology characterizes the ruminal environment, with populations of strict and facultative anaerobes, such as bacteria, fungi, and protozoa, which change over time and with feeding. Microbial metabolic activities and proliferation are favored in this organ, promoted by a physiological pH of 5.5 to 7.0, a temperature that ranges from 38 to 41 °C, an osmolarity between 250 to 400 mOsm/kg, and a redox potential oscillating from −240 to −450 mV [1,3]. These conditions are highly stable and are similar to those of an ideal commercial fermentation chamber [1]. Hence, there seems to be an opportunity to manipulate ruminal fermentation to enhance its efficiency, increase the synthesis of VFAs, and decrease the concentration of methane. In this way, better nutrition for the host animal could be achieved, resulting in higher animal production and therefore increased outputs of meat and milk, staples of human nutrition.
Considerable research efforts have focused on methods to manipulate ruminal fermentation, including diet modifications [2,4] and the use of antibiotic ionophores [5], plant extracts [6,7], and probiotics [1,2,4,8]. Recently, novel biotechnological approaches using bioelectrochemical systems (BESs) have also been employed for similar purposes, resulting in the development of electrofermentation tools (EF) [9,10,11,12]. EF involves the application of an electrical field in a microbial fuel cell (MFC) to yield valuable end-products from electricity-driven microbial CO2 reduction. Hence, EF involves unbalanced fermentation and microbial electrosynthesis (MES) using bidirectional electron transfer to promote microbial metabolism [13]. Fermentation is a flow of electrons that travel from oxidizing compounds (electron donors) to reducing compounds (electron acceptors) through carrier molecules such as NADH/NAD, ferredoxin, and FAD. Therefore, it is feasible to modify this electron flow using an external energy source with solid electrodes, thus altering the fermentation patterns to increase the synthesis of VFAs and improve ruminant nutrition efficiency. The major difference between EF and other BESs is that EF does not require high current densities. In this context, electric current is neither the desired product nor the main energy source, but is instead a trigger that allows the fermentation process to occur under unbalanced conditions.
There have been several studies using BESs with ruminal fluids to manipulate RF with the purpose of generating electricity using MFCs. The findings of these studies suggest that an electric potential increases the VFA concentration. For example, the application of current in a double-chamber H-type MFC with a carbon electrode using a rumen microorganism inoculum converted soluble cellulose into electricity [14]. Furthermore, the production of electricity was observed when aquatic plants (Cana indica) [15] and purified microcrystalline cellulose [16] were incorporated as a substrate in an air-cathode MFC. In the same way, using external resistance on a similar cellulose-fed MFC resulted in an increased production of electricity and altered VFA concentration [17]. Another study demonstrated the suppression of methanogenesis accompanied by increased electricity and changes in rumen bacterial communities when an MFC was applied [18]. Moreover, when Bermuda grass straw was added to an MFC, the rumen microorganisms metabolized it into electricity and increased the VFA concentrations [19]. These studies suggest that changes of VFA concentrations could be related to the increase of electricity production and changes in the oxidation–reduction potential (ORP).
Therefore, the present work was based on these previous findings and in contrast to the studies that employed the MFC principle. In EF, an external electric potential source is applied and this is one of the reasons that it is a viable alternative for rumen manipulation. We hypothesized that an external voltage applied in EF could enhance fermentation patterns and electricity-driven ruminal microbiota metabolism to increment VFA concentrations. Recently, we evaluated the effects of an external electric potential (0.75 V) in a double-chamber EF separated by a proton membrane with a rumen microorganism inoculum [20]. We observed increases in acetate, propionate, and butyrate concentrations and changes in the diversity of the bacterial communities.
In this study we evaluated the effects of two external electric potentials (0.4 and 0.9 V) in a single-chamber EF configuration using a rumen microorganism inoculum and Rhoades grass as a substrate, and measured dry matter digestibility (DMD), biomass, bacterial communities, and VFA production.
2. Materials and Methods
2.1. Ruminal Fluid Collection
Fluid samples were collected from two rumen-cannulated clinically healthy Brown Swiss 8-year-old steers freely grazing on native pastures at the Centro de Nacional de Investigación Disciplinaria en Fisiología y Mejoramiento Animal (CeNID-Fisiología, INIFAP). Experimental protocols were performed according to the Norma Oficial Mexicana NOM-062-ZOO-1999 [21]. This work was approved by the Internal Committee for Care and Use of Experimental Animals (CICUAE.DC-2019/4-2, UNAM). Samples were filtered with gauze, stored, and transported in a thermos flask at 37 °C [22].
2.2. Electrofermentation System Design and Operation
The electrofermentation system was constructed using a sterilized glass beaker chamber (10 cm length, 5 cm diameter) with an airtight rubber stopper which operated as a single chamber as shown in Figure 1. Briefly, the system contained anode and cathode electrodes made from stainless steel (2 × 2 cm, 0.2 mm thickness) attached to a titanium wire (10 cm in length with a 0.5 mm diameter; Sigma-Aldrich), which passed through a rubber plug to establish electrical contact [20]. The single-chamber EF was operated with 100 mL of rumen fluid inoculum and Rhodes grass as a substrate. This substrate was previously dried and milled (2 mm mesh) and 0.5 g measures were placed in digestible filter bags with a 0.25 µm pore size (F57, ANKOM, Macedon, NY, USA) and then heat-sealed.
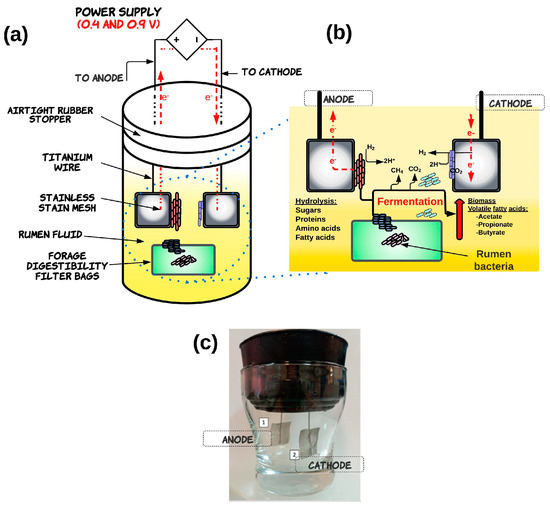
Figure 1.
Schematic diagram of basic structural components (a) and function (b) of the single-chamber electrofermentation system (c). In a single-chamber electrofermentation system, both anode and cathode electrodes are placed in the same chamber, and the microorganisms are grown on both electrodes. The application of an external electric potential supplies electrons to the solid conducting anode. The electron donors are transferred through the electroactive bacteria (EAB) achieved via direct extracellular electron transfer (ETT) mechanisms or mediators. This promotes the oxidative reactions of organic compounds in fermentation, which releases electrons into a circuit. The electron sink at the anode leads to a reduced NADH/NAD+ ratio, resulting in compensating cellular regulation favoring pathways to regulate NADH, promoting fermentation efficiency and improving biomass yields. The reduction reactions can occur at the cathode electrode, which is colonized by microorganisms that reduce the substrate using the electrons provided by the anode, which contribute to the production of valuable products like volatile fatty acids.
The experimental design for the EF system was completely randomized in a factorial scheme, which consisted of two factors and different levels: (1) electric potential (0.4 and 0.9 V) and (2) operating time (6, 12, and 24 h). The same configuration but without the application of electric potential (0 V) was used as a control treatment for each operating time. The electric potentials of 0.4 and 0.9 V were supplied by a DC multichannel direct power supply (GW Instek GPS-403; Instek America Corp, Montclair, CA, USA).
The electric potential and the stainless steel electrodes were chosen based on previous work [20], as well as pilot experimental results from a study by our laboratory in which we evaluated rumen EF in a single chamber constructed with nickel (We) and platinum (Ce) electrodes using different electric potentials and operating times (with and without substrate). These previous results showed a significant increase in VFAs that did not depend on operating time. However, considerable electrode physical deterioration caused oscillation in electric potential values and low stability (unpublished data). All single-chamber EF systems were incubated with shaking (60 rpm, 38 °C) to simulate in vivo rumen conditions.
2.3. Biomass Determination
Rumen biomass from each EF treatment was quantitated using a my-Control bioreactor (Applikon Biotechnology, Delft, The Netherlands). Briefly, aliquots of rumen fluid were diluted 1:5 with artificial saliva consisting of a two-buffer solution combined in a 4:1 ratio of buffer A (10.0 g/L KH2PO4, 0.5 g/L MgSO4-7H2O, 0.5 g/L NaCl, 0.1 g/L CaCl2-2H2O, and 0.5 g/L urea) and buffer B (15 g/L Na2CO3 and 1 g/L Na2S-7H2O), adjusted to pH 6.8 [20]. Diluted rumen fluid samples were then placed in the bioreactor for biomass measurements, and the results were expressed as log10 UFC/mL.
2.4. Dry Matter Digestibility
The in vitro dry matter digestibility (DMD) by rumen fluids in each EF treatment was measured in filter bags according to the manufacturer’s protocol (ANKOM Technology, Macedon, NY, USA). After the EF treatment, filter bags were washed extensively with water, dried at 60 °C for 24 h, and weighed. The results were expressed as % DMD.
2.5. Volatile Fatty Acid Quantification Using Gas Chromatography
Total and individual VFA products of each EF treatment were determined using gas chromatography according to Chung et al. [17]. Rumen fluid samples (10 mL) were collected and acidified with 1 mL of 0.6 M HCl, and then 1.5 mL aliquots were centrifuged (5000× g, 10 min, 4 °C) and 1.2 mL measures of supernatant were recovered in 1.5 mL microcentrifuge tubes. Next, 240 µL of 25% metaphosphoric acid was added to each supernatant sample, which was incubated on ice for 30 min for protein precipitation and centrifuged (10,000× g, 15 min, 4 °C). Finally, supernatants were collected and filtered using Whatman glass microfiber filters (2 mm diameter). One microliter of each sample was injected into an Agilent gas chromatograph (GC) series 7890B (Agilent Technologies, Wilmington, DE, USA) coupled to a flame ionization detector. The carrier gas (nitrogen) flow rate was maintained at 9.5 mL min−1. The injector temperature was set at 190 °C in splitless mode. A Zebron ZB-FFAP capillary column (15 m × 0.53 mm inner diameter × 0.25 μm) was used. The initial oven temperature was 70 °C, which was held for 1.5 min, raised to 130 °C at 10 °C min−1, raised to 210 °C at 1 °C min−1, and held for 5 min. GC data processing was performed using Chemstation software (Agilent Technologies, Santa Clara, CA, USA). The results are expressed as mM of VFA of rumen fluid (mM) using VFA standard curve calibration.
2.6. NADH/NAD Ratio Assay
NADH/NAD production ratio during EF treatments was quantified using an enzymatic commercial fluorometric kit ab1723 (Abcam, Cambridge, UK) according to the manufacturer’s protocols.
2.7. DNA Extraction and Illumina Sequencing
To evaluate bacterial communities in the rumen fluid during EF, the genomic DNA was extracted from each single-chamber treatment (n = 3). Rumen DNA extraction was performed according to the RBB + C method [23]. Samples (1 mL) were homogenized with zirconium beads and lysis buffer followed by centrifugation, and the supernatant was recovered. Then, 10 mM ammonium acetate, 98% isopropanol, and 70% ethanol were added to the supernatant for nucleic acid precipitation. Finally, for protein removal and DNA purification, QIAamp DNA Mini Kit (QIAGEN, Hilden, Germany) columns were used.
DNA concentration was quantitated using a Qubit 3.0 fluorometer (Life Technologies, Carlsbad, CA, USA), and DNA integrity was verified using 1% agarose gel electrophoresis. DNA rumen microbiota 16s rRNA sequencing was performed by Research and Testing Laboratory (RTL) Genomics using the Illumina MiSeq platform. Illumina produces FASTQ files with a Prhred offset of +33.
Data quality control and analyses were performed using the USEARCH V.11 pipeline. The FASTQ forward and reverse files were merged into a single FASTQ file per sample; quality control and processing included removing adapters and cutting the sequences for length-based filtering of 400 bp (reads smaller than 200 bp were excluded from the analysis). The resulting filtered reads were then aligned to RDP V.16 operational taxonomic units (OTUs) for taxonomy assignment. OTUs were selected at 97% sequence similarity. The UCLUST method was used to cluster the reads into OTUs [24]. Alpha diversity values for bacterial communities of rumen samples were obtained using various diversity indexes (observed OTUs, Chao’s estimator, Shannon’s diversity index) [22].
2.8. Statistical Analysis
Single-chamber EF experiments were performed in two replicates, and the obtained data (DMD, biomass yield, and NADH/NAD ratio) were measured in triplicate. The results were expressed as mean and standard errors. The data were subjected to a two-way analysis of variance (ANOVA), and comparative mean differences were determined using Tukey’s test. Statistical analyses were completed using the software JMP V.5.0.1. Data on rumen bacterial diversity were analyzed using R software with the help of the Phyloseq library [25]. In addition, some graphics were produced using GraphPad Prism software version 6 (GraphPad Software, Inc., San Diego, CA, USA).
3. Results
3.1. Effects of Ruminal Electrofermentation on Biomass and Dry Matter Digestibility
To determine the effects of in vitro EF of a grass substrate with rumen fluid, the biomass, DMD, and VFAs were evaluated, and the results are shown in Figure 2. In general, the factors that influenced the measured parameters the most compared to the control (0 V) were the operating time of 24 h and the electric potential of 0.9 V. In this sense, no significant changes were present in microbial growth biomass (log10 UFC/mL) throughout the operating time for the control treatment. Interestingly, both electric potentials (0.4 and 0.9 V) improved the biomass content, especially the latter, which exerted the most significant effect (p < 0.05) (up to 12%, after 12 and 24 h); this was followed by the 0.4 V treatment with an increase of 10% at 12 and 24 h (Figure 2a). According to the two-way ANOVA, significant effects were observed for the time factor (p = 0.018), which was higher for 24 h; in contrast, the interactions of factors were not significant (p = 0.829).
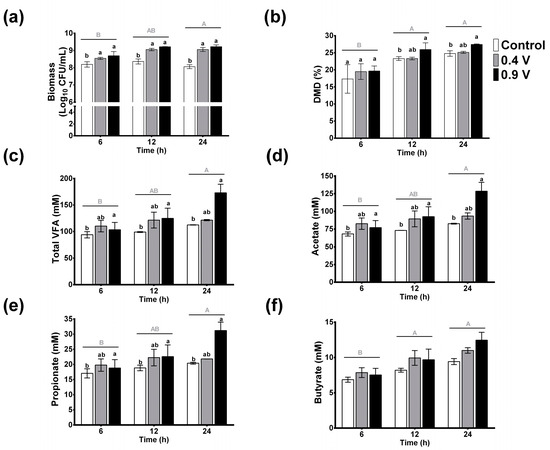
Figure 2.
Effects of in vitro ruminal electrofermentation with application of electric potential (0.4 and 0.9 volts) for 6, 12, and 24 h on biomass (a), dry matter digestibility (b), total volatile fatty acids (c), and individual acetate (d), propionate (e), and butyrate (f) production levels. Mean values and SEM. The data were analyzed using a two-way ANOVA to determine whether there were significant differences in the means of parameters between the potential electric treatments and the time. Different letters indicate significant differences according to the post hoc analysis conducted using Tukey’s HSD test at p < 0.05 (capital letters show the effects of the time factor and lowercase letters show the effects of the treatment group factor).
Dry matter digestibility increased at all three operating times, with and without electric current (Figure 2b). No significant changes were observed among treatments at 6 h, however, and the control treatment at 24 h showed an increase of 42% compared to the 6 h control (p < 0.05, capital letters). Moreover, the application of electric potential enhanced DMD over the course of the operating time, with the 0.9 V treatment showing a significant increase of 50 and 58% at 12 h and 24 h, respectively, as compared to the 6 h control treatment. Similarly, at 24 h, the 0.9 V treatment was significantly higher among groups at the same time frame. The time factor showed the most influence on the increase of the DMD (p = 0.0001), while the interactions of the factors did not show statistical differences (p = 0.856).
3.2. Volatile Fatty Acids
The effects of electric potential on VFA concentrations are shown in Figure 2c. No significant changes of total VFAs in control treatments throughout the operation time were observed (p > 0.05). In contrast, the application of current in the 0.9 V treatment changed the total VFAs through the operating time, with an increase of about 84% at 24 h compared to the 6 h control, and an increase of 53% compared to the 24 h control. The two-way ANOVA analysis revealed significant effects for both factors and showed the effects of treatment (p = 0.035) and treatment time (p = 0.028), but their interaction was not significant (p = 0.235). Comparing the means, the 0.9 V treatment and the 24 h treatment time were statistically different compared to the control treatment and the 6 h, respectively. For individual VFA concentrations, similar behaviors were observed. Namely, no significant changes were observed for acetate, propionate, and butyrate in the control treatment over time, and again the electric potential application of 0.9 V for 24 h resulted in the most significant increases of 88, 82, and 81% for these individual VFAs with a ratio of 74:18:7, respectively (Figure 2d–f).
According to these results, the 0.9 V treatment for 24 h produced the most significant changes in ruminal electrofermentation, and this treatment was selected for pH, NADH/NAD ratio, and bacterial community analysis.
3.3. Effects of Rumen Electrofermentation on pH and NADH/NAD Ratio
Ruminal pH provides an ideal and dynamic set of conditions (5.5 to 7.0, in physiological conditions) for the metabolic activities and proliferation of the microbiota, as well as favoring the fermentation process. As shown in Figure 3a, the pH values in the control treatment remained constant and ranged from 6.6 to 6.78 over time. In contrast, the electric potential application of 0.9 V in the ruminal EF system significantly decreased the pH values (6.7 to 6.2), with the lowest values observed at 24 h, which were 8% lower than the control treatment. Again, the effects of both factors were shown to be significant for treatment (p = 0.006) and time (p = 0.002), but their interaction effects were not (p = 0.127). These results suggest that a 0.9 V treatment for a period of 24 h provides the optimal pH conditions for increasing biomass and VFAs.
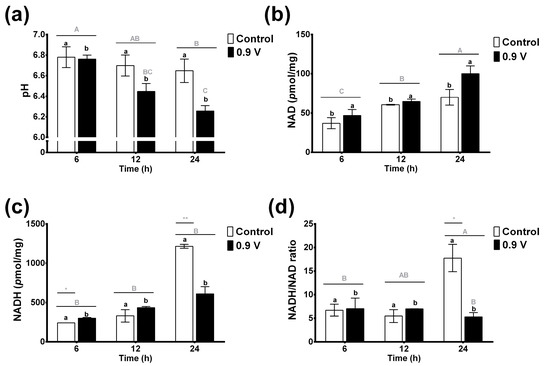
Figure 3.
Effects of in vitro ruminal electrofermentation using application of electric potential (0.9 volts) for 6, 12, and 24 h on pH (a), NAD (b) and NADH concentration (c), and NADH/NAD ratio (d). Means values and SEM. The data were analyzed using a two-way ANOVA to determine whether there were significant differences in means of parameters between the electric potential treatments and the treatment times. Different letters indicate significant differences according to the post hoc analysis using Tukey’s HSD test at p < 0.05 (capital letters indicate the effects of the time factor and lowercase letters indicate the effects of treatment group factor, and *, ** indicates the significant differences for the factor interaction effects of treatment group vs. time).
The concentrations of enzymatic cofactors NAD+ and NADH, and their ratio in the ruminal fluid EF system, are shown in Figure 3b–d. NAD concentrations increased slightly over time in the control treatment without reaching significant values (Figure 3b). Significant changes were found for NAD concentrations between the control and 0.9 V treatments through two-way ANOVA analysis (p < 0.045). When the 0.9 V treatment was applied, NAD concentrations were increased significantly (2-fold) at 24 h compared to the 6 h control treatment, showing an important effect of the time factor (p < 0.001).
The NADH concentrations in ruminal fermentations were higher than those of the oxidized form (Figure 3c). The control treatment presented an important increase in NADH concentration after 24 h (5-fold). Hence, in this case, the factor interaction effects of treatment group vs. time were shown to be significant, in that the 6 h and 24 h controls had the most significantly increased NADH concentrations (p = 0.002). Interestingly, the application of the 0.9 V treatment prevented the increase of NADH concentration over time, including at 24 h, at which point the level was half that of the 24 h control treatment. Thus, the NADH/NAD ratio showed a similar behavior, in which the 0.9 V treatment for 24 h prevented the increase of the NADH/NAD ratio compared to the control. These results suggest that the electrons from the electric potential application in the EF system might affect the microbial intracellular redox conditions and could cause re-oxidation of NADH to NAD+ in the cells, producing more VFAs.
3.4. Rumen Microbial Community Composition across Electrofermentation Systems
After quality control of 965,044 total raw sequences was completed, 604,300 high-quality reads were included in the pre-process data (trimming, filtering, denoising, and clustering) for further analysis (Table S1). Accordingly, a total of 2161 bacterial OTUs were identified across all samples (Table S2).
Bacterial composition abundances of EF-treated rumen fluid at 24 h of operating time are shown in Figure 4. An average abundance of 4517 reads for the control treatment was observed, and the application of 0.9 V electric potential resulted in a higher abundance of 4686 reads (Figure 4a). A total of 17 bacterial phyla were obtained across all samples, and the two most predominant were Firmicutes and Bacteroidetes, with average proportions of 52.38% and 40.59% for the three groups, respectively (Figure 4b). The phylum Proteobacteria also represented a considerable fraction (1.08%), followed by Verrucomicrobia (0.95%) and Actinobacteria (0.84%) across the three samples. The remainder of highly abundant phyla observed represent the 1.31% clustered as “Other” (Tables S3 and S4). No differences were found in the Firmicutes/Bacteroidetes ratio, which ranged from 1.19 to 1.35 among the groups, although the 0.9 V treatment presented the highest values.
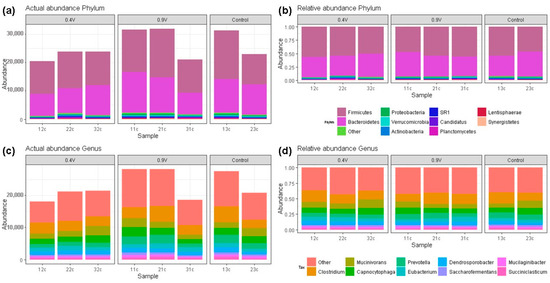
Figure 4.
Bacterial community compositions at different taxon levels in the rumen fluid after in vitro electrofermentation using electric potentials of 0.4 V and 0.9 V. The composition of actual and relative bacterial abundances at the phylum (a,b) and genus (c,d) levels.
A similar bacterial composition was observed regarding the major genera (top 10) (Figure 4c), and similar proportions were found among groups. A total of 126 taxa at the genus level were present in all samples across all treatments. The most predominant bacterial genus was Clostridium (~15%), followed by Mucinivorans (~9.40%), Capnocytophaga (~8.47%), and Prevotella (~7.89%) (Figure 4d). The remaining taxa at the genus level were clustered in “Others”, representing 40.28%, of which 10% were not assigned taxa or were unidentified species in the RDP database (Table S5), indicating that many ruminal bacteria have not been characterized yet.
3.5. Rumen Bacterial Diversity and Similarities in the Electrofermentation System
Alpha diversity indexes for bacterial communities in the rumen fluid across electrofermentation conditions are shown in Table 1. The richness of bacterial communities as measured by observed OTUs did not present significant differences among the groups. Similarly, no differences in the Shannon diversity or Chao1 indices were observed. These results indicate that the electric potential did not affect the bacterial communities at the phylum level. However, EF enhanced microorganism proliferation (as shown in biomass results; Figure 2a), which suggests changes in their metabolism.

Table 1.
Alpha diversities of bacterial communities following in vitro electrofermentation: diversity and richness of rumen bacteria after application of electric potential for 24 h.
Data are shown as the mean and standard error. Different letters indicate significant (p < 0.05) differences between groups according to Tukey’s test.
According to the bacterial community comparisons using Jensen–Shannon divergence as a beta diversity measurement, microbial samples in the 0.9 V group clustered closely into a large group along the second principal coordinate (variance explained = 23%), whereas the 0.4 V and control group samples were clustered in the first PCoA (Figure 5). Moreover, the analysis of similarity (ANOSIM) revealed no significant differences in the compositions of bacterial communities (R = 0.19, p = 0.83). These results again highlighted the robust stability of the ruminal bacterial community against the application of electric potential, which, in the absence of changes in the alpha diversity and richness of these bacteria, increased VFA production.
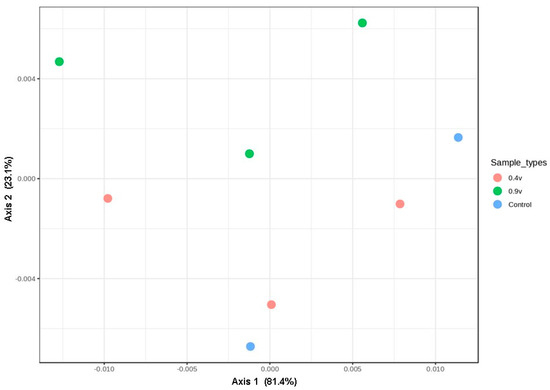
Figure 5.
Principal coordinate analysis (PCoA) plots of the bacterial community compositions in the rumen fluid in electrofermentation systems, achieved using a Jensen–Shannon divergence. The percentages of variation explained by PC1 and PC2 are indicated on the axes.
4. Discussion
Ruminal fermentation is a catabolic spontaneous process in which microorganisms conserve energy by anaerobically decomposing organic matter, producing valuable end-products such as VFAs that are usable energy forms for the host animal. Nevertheless, the energy from RF is also released as CO2, methane, and heat [4]. Extensive studies have been performed to manipulate RF and make it more efficient [1,2,6,8]. In this study, we applied a bioelectrochemical system to rumen fluid using a single-chamber EF system to evaluate its effects on VFA production, biomass yield, and bacterial communities.
EF is a fairly new field that allows the manipulation of microbial metabolism using solid-state electrodes as electron mediators, such that the anode is used as an electron acceptor and the cathode as an electron donor (Figure 1) [11,12]. EF can help to stabilize and optimize fermentation metabolism through controlled redox and pH, substrate purity, and end-product VFA formation. In this sense, in the present study, the application of an electric potential of 0.9 V to rumen fluid for 24 h resulted in the most significant increases of DMD and VFA concentrations (acetate, propionate, and butyrate), as well as reducing the pH and NADH/NAD ratio.
In a previous work [20], we demonstrated that an external power supply of 0.4 V in a double-chamber EF increased the VFA concentration, but no changes were found in DMD, microbial biomass, or community biodiversity at the phylum level. In contrast, in this study, significant changes were observed in DMD and biomass, which appear to have been associated with the EF system configuration and the application of an electric potential of 0.9 V. The basic difference between a single- and double-chamber EF system is the absence of a dividing membrane in the single-chamber, and in the double-chamber, different conditions can be maintained in each compartment. The advantages of a single-chamber configuration are its reduced cost and the oxygen diffusion rate into the anode, which is higher than in the double-chamber design [26]. The present results suggest that the application of an external electric current changes the fermentation patterns of the ruminal microorganisms, favoring their proliferation (biomass) and metabolism, therefore enhancing VFA production.
All microorganisms need an electron donor and acceptor to maintain their metabolism, and the reducing/oxidizing agents NADH/NAD couple to serve this function. These agents are found in all living cells and are involved in the transfer of electrons, such as in glycolysis, the citric acid cycle, and, as in this case, fermentation. NAD in its oxidized form (NAD+), serves as an electron acceptor, and its reduced form (NADH) donates electrons.
The key role of the electrical current in EF is as an alternate source of reducing or oxidizing power, which is potentially more sustainable than conventional substrates produced through feed (i.e., glucose) [12] or by control of the oxidation–reduction potential of the fermentation broth. Kracke and Krömer [27] calculated the theoretical yields of different metabolites for glucose and glycerol EF models and reported that an excess of redox cofactors (NADH and NADPH) induced by a cathode can drive specific reduction reactions. In this regard, the consumption of reducing power by an electron sink (i.e., an anode) can improve microbial biomass yields. Our results are in accordance with the findings of these authors.
NAD+ is reduced to NADH in fermentation and must be regenerated to sustain the process via reoxidation of NADH. Most VFAs derived from organic substrates produce NADH, but only some metabolites, such as lactate, butyrate, and propionate, allow its reoxidation [9,10,11,12]. Thus, an excess of NADH may be reoxidized by reducing other organic compounds and producing more reduced compounds such as VFAs, and some of it can act as an electron sink. Overall, if more electron donors are produced in the system, as occurs in EF applications, more VFAs are produced, and extra electrons are stored [28].
Our observation of a decreased NADH/NAD ratio at 24 h could be related to the extra electrons donated by the application of 0.9 V of electric potential, compared to the control treatment, thus increasing VFA production according to the mechanisms described above. In addition, it is possible that a biofilm of electroactive microorganisms could interact with the solid electrodes through extracellular electron transfer (EET), providing a possible mechanism for electron transfer that could conserve energy in either coupled or uncoupled reactions, whereby the electrons derived from electrodes aid in the catalytic generation of the energy carriers NADH or ATP [10,11,12]. Moreover, other electron transfer mechanisms can also be established in the rumen fluid through direct ETT (nanowires, cytochromes) or shuttle-mediated ETT (i.e., flavins, H2, formate, etc.) [10,13]. This process of transferring electrons into and out of the cell (ETT) can occur in three steps: (1) the oxidation of the substrate, (2) the transfer of electrons to the corresponding proteins, and (3) extracellular electron transport [10]. The electrons are transferred to proteins present in the outer membrane by diffusible intracellular electron carriers such as NADH/NAD. Therefore, the electric current could affect both extracellular and intracellular ORP, and thus affect the overall biological regulation through changes in the proton carrier balance, significantly impacting the end-products of fermentation. In addition, the reduction of NADH/NAD ratio after 10 h has previously been reported in cathodic EF with pure cultures compared to control fermentations, which is in agreement with our results [29].
Rumen fluid has been previously used successfully in a microbiological fuel cell for the generation of electricity employing different substrates such as cellulose, aquatic plants, and straw [6,7,14,15,16,18]. These studies focused on the generation of electricity and revealed important increases in VFA and gas production, as well as a drop in pH. However, using an electron donor in EF was not investigated in these studies as no external electric potential was applied. Nevertheless, at least one of these studies observed changes in bacterial taxa across the days of operation when different substrates were introduced into the MFC. Rizmani et al. [16] reported that Firmicutes, Methanoculleus, and Methanobrevibacter were the dominant taxa in an MFC configuration, and over 90 days of operation, bacterial taxa decreased.
In this work, the electric potential in the EF did not affect the diversity of bacterial communities in the rumen fluid, although it increased the proliferation of the microorganisms, as shown by the abundance and biomass, as well as by the increase of VFAs compared to the control treatment. The taxa found in all samples across the EF-treated rumen fluid coincide with previous authors’ descriptions of in rumen microbial ecology [2,4,6,22], although more studies are still needed regarding the changes in the fungal communities [30], which will allow a greater understanding of the effects of the application of electric potential. Furthermore, no significant changes were observed in bacterial alpha and beta diversities in this study across the EF conditions, showing a robust microbiota ecology in the rumen.
5. Conclusions
This study is one of the first to explore and apply single-chamber electrofermentation using a 0.9 V electric potential over 24 h treatment of rumen fluid, resulting in the increase of microbial biomass and VFA concentration. The concomitant decrease in NADH/NAD suggests that a modulation of fermentation patterns in microbial metabolism occurred under our experimental conditions. These microorganisms hydrolyzed and digested the dry matter and could serve as an electron sink to produce VFAs. This provides an improvement in biomass yield without changes of diversity at the phylum level. Hence, EF can help to overcome a range of limitations of the rumen fermentation process, which could be applied to in vivo studies to improve ruminant nutrition and increase the efficiency of meat and milk production. This EF system also provides a new framework for the study of interactions between electroactive rumen bacteria and fermenters. Nevertheless, although this is one approach for furthering the understanding of how a solid electrode and current energy can enhance rumen fermentation, more molecular and biochemical studies are needed to identify the advantages and limitations of EF. In addition, it will be important to assess potential changes in methane production and fungal communities, characterize the microbial biofilm formed, and define robust design criteria for the electrode material to be replicated efficiently at a large scale.
Supplementary Materials
The following supporting information can be downloaded at: https://www.mdpi.com/article/10.3390/fermentation9060502/s1, Table S1: Summary of 16S rRNA gene sequencing reads for bacteria across samples; Table S2: Operational taxonomic units (OTUs) of bacteria in rumen fluid across electrofermentation treatments; Table S3: Taxonomy of OTUs in rumen fluid across electrofermentation treatments; Table S4: Bacterial relative abundance at phylum level (top 10) across electrofermentation treatments of rumen fluid; Table S5. Bacterial relative abundance at genus level (top 10) across electrofermentation treatments of rumen fluid.
Author Contributions
Conceptualization, O.M., B.C.-Q. and A.S.; methodology, R.L.-H., H.D.J.G.-V., C.R.-R. and L.G.-D.; software, H.D.J.G.-V. and C.R.-R.; validation, O.M., A.V.-E. and A.S.; formal analysis, R.L.-H. and H.D.J.G.-V.; investigation, R.L.-H. and H.D.J.G.-V.; resources, R.L.-H., B.C.-Q. and L.G.-D.; data curation, H.D.J.G.-V. and C.R.-R.; writing—original draft preparation, H.D.J.G.-V.; writing—review and editing, A.V.-E., O.M. and A.S.; visualization, R.L.-H. and H.D.J.G.-V.; supervision, O.M., B.C.-Q. and A.S.; project administration, L.G.-D. and O.M.; funding acquisition, O.M. All authors have read and agreed to the published version of the manuscript.
Funding
This study was supported by PAPIIT (IN213021-UNAM).
Institutional Review Board Statement
The animal study protocol was approved by the Ethics Committee of Internal Committee for Care and Use of Experimental Animals of Universidad Nacional Antónoma de México (CICUAE.DC-2019/4-2, UNAM).
Informed Consent Statement
Not applicable.
Data Availability Statement
Data that support the findings of this study are available as supplementary material; the sequence read archive (SRA) is in NCBI as BioProject PRJNA945450, and data are available from the corresponding author upon reasonable request.
Acknowledgments
R.L.H. gratefully acknowledges CONACYT for their fellowship. Jaime Pérez Trevilla, Lab Technician from the Laboratory of Research on Advanced Processes for Water Treatment-UNAM for his assistance with VFA and GC analysis, and Ricardo Basurto Gutierrez from CeNID-Fisiología, INIFAP for his help in obtaining rumen fluid.
Conflicts of Interest
The authors declare no conflict of interest.
References
- Owens, F.N.; Basalan, M. Ruminal fermentation. In Rumenology; Millen, D.D., De Beni Arrigoni, M., Pacheco, R.D.L., Eds.; Springer: Cham, Switzerland, 2016; pp. 63–102. [Google Scholar]
- Nagaraja, T.G.; Newbold, C.J.; van Nevel, C.J.; Demeyer, D.I. Manipulation of ruminal fermentation. In The Rumen Microbial Ecosystem; Springer: Dordrecht, The Netherland, 1997; pp. 523–632. Available online: http://link.springer.com/10.1007/978-94-009-1453-7_13 (accessed on 10 January 2023).
- Aguilar-González, M.; Buitrón, G.; Shimada-Miyasaka, A.; Mora, O. State of the art of bioelectrochemical systems: Feasibility for enhancing rumen propionate production. Agrociencia 2016, 50, 149–166. [Google Scholar]
- Castillo-González, A.R.; Burrola-Barraza, M.E.; Domínguez-Viveros, J.; Chávez-Martínez, A. Rumen microorganisms and fermentation. Arch. Med. Vet. 2014, 46, 349–361. [Google Scholar] [CrossRef]
- Azzaz, H.H.; Murad, H.A.; Morsy, T.A. Utility of ionophores for ruminant animals: A review. Asian J. Anim. Sci. 2015, 9, 254–265. [Google Scholar] [CrossRef]
- Zhou, R.; Wu, J.; Lang, X.; Liu, L.; Casper, D.P.; Wang, C.; Zhang, L.; Shen, W. Effects of oregano essential oil on in vitro ruminal fermentation, methane production, and ruminal microbial community. J. Dairy Sci. 2020, 103, 2303–2314. [Google Scholar] [CrossRef]
- Jadhav, R.V.; Kannan, A.; Bhar, R.; Sharma, O.P.; Gulati, A.; Rajkumar, K.; Zhang, L.; Sheng, W. Effect of tea (Camellia sinensis) seed saponins on in vitro rumen fermentation, methane production and true digestibility at different forage to concentrate ratios. J. Appl. Anim. Res. 2018, 46, 118–144. [Google Scholar] [CrossRef]
- Arowolo, M.A.; He, J. Use of probiotics and botanical extracts to improve ruminant production in the tropics. Anim. Nutr. J. 2018, 4, 241–249. [Google Scholar] [CrossRef]
- Yamada, S.; Takamatsu, Y.; Ikeda, S.; Kouzuma, A.; Watanabe, K. Towards application of electro-fermentation for the production of value-added chemicals from biomass feedstocks. Front. Chem. 2022, 9, 1–7. [Google Scholar] [CrossRef]
- Moscoviz, R.; Toledo-Alarcón, J.; Trably, E.; Bernet, N. Electro-fermentation: How to drive fermentation using electrochemical systems. Trends Biotechnol. 2016, 34, 856–865. [Google Scholar] [CrossRef]
- Bhagchandanii, D.D.; Babu, R.P.; Sonawane, J.M.; Khanna, N.; Pandit, S.; Jadhav, D.A.; Khilari, S.; Prassad, R. A comprehensive uderstanding of electro-fermentation. Fermentation 2020, 6, 92. [Google Scholar] [CrossRef]
- Schievano, A.; Sciarria, T.P.; Vanbroekhoven, K.; De Wever, H.; Puig, S.; Andersen, S.J.; Rabaey, K.; Pant, D. Electro-fermentation-merging electrochemistry with fermentation in industrial applications. Trends Biotechnol. 2016, 34, 866–878. [Google Scholar] [CrossRef]
- Gong, Z.; Yu, H.; Zhang, J.; Li, F.; Song, H. Microbial electro-fermentation for synthesis of chemicals and biofuels driven by bi-directional extracellular electron transfer. Synth. Syst. Biotechnol. 2020, 5, 304–313. [Google Scholar] [CrossRef] [PubMed]
- Rismani-Yazdi, H.; Christy, A.D.; Dehority, B.A.; Morrison, M.; Yu, Z.; Tuovinen, O.H. Electricity generation from cellulose by rumen microorganisms in microbial fuel cells. Biotechnol. Bioeng. 2007, 97, 1398–1407. [Google Scholar] [CrossRef]
- Zang, G.L.; Sheng, G.P.; Tong, Z.H.; Liu, X.W.; Teng, S.X.; Li, W.W.; Yu, H.Q. Direct electricity recovery from canna indica by an air-cathode microbial fuel cell inoculated with rumen microorganisms. Environ. Sci. Technol. 2010, 44, 2715–2720. [Google Scholar] [CrossRef] [PubMed]
- Rismani-Yazdi, H.; Carver, S.M.; Christy, A.D.; Yu, Z.; Bibby, K.; Peccia, J.; Touvinen, O.H. Suppression of methanogenesis in cellulose-fed microbial fuel cells in relation to performance, metabolite formation, and microbial population. Bioresour. Technol. 2013, 129, 281–288. [Google Scholar] [CrossRef] [PubMed]
- Chung, R.; Kang, E.Y.; Shin, Y.J.; Park, J.J.; Park, P.S.; Han, C.H.; Kim, B.; Moon, S.I.; Park, J.; Chung, P.S. Development of a consolidated anaerobic digester and microbial fuel cell to produce biomethane and electricity from cellulosic biomass using bovine rumen microorganisms. J. Sustain. Bioenergy Syst. 2019, 9, 17–28. [Google Scholar] [CrossRef]
- Tsan, W.C.; Ming, Y.C.; Sheng, C.Z.; Shuai, T. Effect of biometric flow channel on the power generation at different Reynolds numbers in the single chamber of rumen microbial fuel cells (RMFCs). Int. J. Hydrogen Energy 2011, 36, 9242–9251. [Google Scholar] [CrossRef]
- Wang, C.T.; Yang, C.M.J.; Chen, Z.S. Rumen microbial volatile fatty acids in relation to oxidation reduction potential and electricity generation from straw in microbial fuel cells. Biomass Bioenergy 2012, 37, 318–329. [Google Scholar] [CrossRef]
- Aguilar-González, M.; Buitrón, G.; Shimada, A.; Ayala-Sumuano, J.; González-Dávalos, L.; Varela-Echavarría, A.; Mora, O. Study on manipulation of ruminal fermentation using a bioelectrochemical system. J. Anim. Physiol. Anim. Nutr. 2022, 107, 357–366. [Google Scholar] [CrossRef]
- Norma Oficial Mexicana nom-062-zoo-1999, Especificaciones Tecnicas Para la Produccion, Cuidado y Uso de Los Animales de Laboratorio. Diario Oficial de la Federación. 2001. Available online: https://www.gob.mx/cms/uploads/attachment/file/203498/NOM-062-ZOO-1999_220801.pdf. (accessed on 15 November 2022).
- Rodríguez-González, S.; González-Dávalos, L.; Robles-Rodríguez, C.; Lozano-Flores, C.; Varela-Echavarría, A.; Shimada-Miyasaka, A.; Mora, O. Isolation of bacterial consortia with probiotic potential from the rumen of tropical calves. J. Anim. Physiol. Anim. Nutr. 2023, 107, 2–7. [Google Scholar] [CrossRef]
- Yu, Z.; Morrison, M. Improved extraction of PCR-quality community DNA from digesta and fecal samples. Bio Tech. 2004, 36, 808–812. [Google Scholar] [CrossRef]
- Edgar, R.C. Search and clustering orders of magnitude faster than BLAST. Bioinformatics 2010, 26, 2460–2461. [Google Scholar] [CrossRef] [PubMed]
- McMurdie, P.J.; Holmes, S. Phyloseq: An R package for reproducible interactive analysis and graphics of microbiome census data. PLoS ONE 2013, 8, e61217. [Google Scholar] [CrossRef] [PubMed]
- Saravanan, N.; Karthikeyan, M. Study of single chamber and double chamber efficiency and losses of wastewater treatment. Int. Res. J. Eng. Technol. 2018, 5, 1225–1230. [Google Scholar]
- Kracke, F.; Lai, B.; Yu, S.; Krömer, J.O. Balancing cellular redox metabolism in microbial electrosynthesis and electro fermentation–A chance for metabolic engineering. Metab. Eng. 2018, 4, 109–120. [Google Scholar] [CrossRef]
- Chen, B.; Rupani, P.F.; Azman, S.; Dewil, R.; Apples, L. A redox-based strategy to enhance propionic and butyric acid production during anaerobic fermentation. Bioresour Technol. 2022, 361, 127672. [Google Scholar] [CrossRef] [PubMed]
- Choi, O.; Kim, T.; Woo, H.M.; Um, Y. Electricity-driven metabolic shift through direct electron uptake by electroactive heterotroph Clostridium pasteurianum. Sci. Rep. 2014, 4, 6961. [Google Scholar] [CrossRef]
- Niu, D.; Yu, C.; Zheng, M.; Jianjun, R.; Li, C.; Xu, C. Effects of ensiling on Irpex lacteus fermentation in wheat straw: Chemical composition, in vitro rumen digestibility, and fungal community. Anim. Feed. Sci. Technol. 2022, 292, 115433. [Google Scholar] [CrossRef]


Disclaimer/Publisher’s Note: The statements, opinions and data contained in all publications are solely those of the individual author(s) and contributor(s) and not of MDPI and/or the editor(s). MDPI and/or the editor(s) disclaim responsibility for any injury to people or property resulting from any ideas, methods, instructions or products referred to in the content. |
© 2023 by the authors. Licensee MDPI, Basel, Switzerland. This article is an open access article distributed under the terms and conditions of the Creative Commons Attribution (CC BY) license (https://creativecommons.org/licenses/by/4.0/).