Article

Improvement of ε-Poly-l-lysine Production by Co-Culture Fermentation Strategy

1
Henan Provincial Key Laboratory of Biological Processing and Nutritional Function of Wheat, School of Biological Engineering, Henan University of Technology, Zhengzhou 450001, China
2
School of Biotechnology, Jiangnan University, Wuxi 214122, China
3
College of Life Sciences, Huaibei Normal University, Huaibei 235000, China
4
School of Food and Pharmacy, Xuchang University, Xuchang 461000, China
5
State Key Laboratory of Crop Stress Adaptation and Improvement, College of Agriculture, Henan University, Kaifeng 475004, China
6
Food Laboratory of Zhongyuan, Henan University of Technology, Zhengzhou 450001, China
*
Authors to whom correspondence should be addressed.
Fermentation 2023, 9(7), 626; https://doi.org/10.3390/fermentation9070626
Submission received: 30 May 2023 / Revised: 27 June 2023 / Accepted: 29 June 2023 / Published: 30 June 2023

Abstract

:
ε-poly-l-lysine (ε-PL) has been routinely used as a natural and safe preservative for many years in the food industry. However, most existing production methods struggle to achieve low cost and high production simultaneously. In this work, we present a co-culture fermentation strategy to enhance ε-PL production. Specifically, we screened a strain from five different strains that could be co-cultured with Streptomyces albulus to raise the production of ε-PL. Subsequently, a single factor experiment and response surface design were used to optimize the conditions of co-culture fermentation to further improve the production of ε-PL. Moreover, the optimal fermentation process was successfully verified in a 2-L fermentor with fed batch fermentation. The production of ε-PL reached 27.07 ± 0.47 g/L by 144 h. Compared with single strain (S. albulus) fermentation, the production of ε-PL was increased by 31.47%. At the same time, the amount of bacteria increased by 19.62%, which means that the ε-PL synthesis ability of bacteria had been improved. All the obtained results showed great potential for co-culture fermentation in large-scale ε-PL production and provide a new fermentation strategy for ε-PL biosynthesis.

1. Introduction

ε-Poly-L-lysine (ε-PL) is an amino acid polymer, when polymerized containing 25–35 lysine monomer units [1]. ε-PL displays a multi-cation characteristic in acidic to slightly alkaline environments due to the presence of many free amino groups in the main chain. Furthermore, ε-PL has strong antibacterial activity against a wide spectrum of microorganisms, including most of the gram-positive and gram-negative bacteria, fungi, yeasts, and some viruses [2]. In addition, this polymer is biodegradable and non-toxic. As a result, ε-PL has been routinely used as a natural and safe food preservative for many years in the food industry in Japan, Korea, the USA, and China [3]. However, high cost of production remains a major hurdle to widespread use of this natural antimicrobial agent and highly functional material.
To meet the growing demand for ε-PL in various fields, numerous studies aimed at improving the production of ε-PL have been performed [4,5,6]. For example, to solve the problem of end-product feedback inhibition during ε-PL production, an in situ product removal method based on resin was used to increase the production of ε-PL to 23.4 g/L in 192 h in a 5-L fermenter [7]. Furthermore, to reduce energy consumption during ε-PL production, an airlift bioreactor [8], immobilized cells with repeated fed-batch cultures [9], and solid-state fermentation [10] have been employed instead of the popular approach of using free cells in a jar fermenter. In addition, pH control had also been used to improve metabolites during fermentation. Kahar et al. [11] reported that no ε-PL was produced when pH was maintained above 5.0 during fermentation, but this pH range was beneficial for cell growth; however, pH in the range of 3.5–4.5 achieved high ε-PL accumulation. Accordingly, a two-stage pH control strategy was developed and enhanced ε-PL production to 48.3 g/L. In the research of Ren et al., a pH shock strategy was used to improve the production of ε-PL [12]; although this strategy can effectively improve the production of ε-PL, it also greatly increases the amount of bacteria, which brings difficulties in the control of dissolved oxygen (DO) in industrial application.
Since then, no new fermentation strategy has been reported to improve the production of ε-PL. The existing fermentation strategies seem to encounter a bottleneck period in the process of continuously improving the production of ε-PL. Therefore, it is necessary to find a new fermentation strategy to improve the industrial productivity of ε-PL. A co-culture fermentation strategy had been used in many food fields to improve the flavor of fermented food [13,14,15], and also to improve the production of products such as L-ornithine [16] and nisin [17]. However, there is no report about the production of ε-PL by co-culture fermentation.
In this study, we first screened a strain that could co-culture with Streptomyces albicans to increase the production of ε-PL. After that, we optimized the inoculation time, inoculation amount, initial fermentation pH and fermentation temperature of the co-culture by single factor optimization. The response surface optimization was further implemented under the optimal single-factor conditions. Finally, we applied the optimal fermentation conditions to the 2 L fermentor for batch fermentation and fed-batch fermentation. Compared with single strain (S. albulus) fermentation, the final production of ε-PL increased significantly. So far, there is no report on the fermentation of co-culture to increase the production of ε-PL. Therefore, this work provides a new fermentation strategy to increase the production of ε-PL and guide the industrial application of this strategy.

2. Materials and Methods

2.1. Microorganism

The strain of Streptomyces albulus IFO 14147 and Corynebacterium glutamicum CICC 10064 was purchased from China Industrial Microbial Culture Collection and Management Center. Escherichia coli, Brevibacterium flavum, Bacillus subtilis and Lactobacillus were stored in our laboratory at −80 °C.

2.2. Culture and Fermentation Media Composition

The BNT agar [18] was used for spore preparation, which was composed of (g/L): glucose, 10; peptone, 2; yeast extract, 1; and agar, 20, with the initial pH of 7.5 adjusted by 1 M NaOH solution and/or 1 M H2SO4.
The M3G [19] as seed medium was used for S. albulus cultivation in this study, which contained (g/L): glucose, 50; yeast extract, 5; (NH4)2SO4, 10; KH2PO4, 1.36; K2HPO4·3H2O, 0.8; MgSO4·7H2O, 0.5; ZnSO4·7H2O, 0.04; FeSO4·7H2O, 0.03, with the initial pH of 6.8 adjusted by 1 M NaOH solution and/or 1 M H2SO4. A 1 mL spore suspension was taken to inoculate a 250 mL shake flask with 50 mL seed medium, and cultivated at 30 °C in a rotary shaker (HYL-C, Qiangle Experimental Co., Ltd., Taicang, China) with 200 rpm for 24 h. Then, 8% of the seeds were transferred to fresh medium and incubated at 30 °C and 200 rpm on a rotating shaker for 72 h. These cultures were used for all fermentations in this study.
Seed medium of E.coli [20], B. flavum [21], C. glutamicum [22], B. subtilis [23] and Lactobacillus [24] refer to previous reports, and the ratio of co-culture (each strain) inoculation was 8%.
The fermentation medium [25] for ε-PL adopted by our previous study was slightly modified as follows (g/L): glucose, 60; (NH4)2SO4, 10; beef extract, 10; KH2PO4, 4; MgSO4·7H2O, 0.8; and FeSO4·7H2O, 0.05, with the initial pH of 6.8 adjusted by 1 M NaOH solution and/or 1 M H2SO4.
All media components were purchased from Sinopharm Chemical Reagent Co., Ltd. (Shanghai, China) at analytical and biochemical grades. All the media were sterilized in an autoclave at 121 °C for 20 min.

2.3. Single Factor Experiment in Co-Culture Fermentation

A single factor experiment was used in the condition optimizations of co-culture fermentation. The inoculum time, inoculum volume, fermentation temperature and initial pH were the main parameters for process optimization. In the present study, the inoculation time for C. glutamicum CICC 10064 was selected as 0, 12, 24, 36 and 48 h after inoculation of S. albulus IFO 14147; the inoculation amount for S. albulus was determined to be 8%, and the range of inoculation amount of C. glutamicum was optimized as 4%, 6%, 8%, 10% and 12%; the fermentation temperature was optimized as 26, 28,30, 32, 34 °C; initial pH was optimized from 6.6 to 7.6, then the fermentation medium were incubated at 30 °C and 200 rpm on a rotating shaker for 72 h.

2.4. Response Surface Design of Co-Culture Fermentation Process

After determining the inoculation time of the co-culture, a three-factor and three-level central composite design with 17 individual design points was adopted for this study [26]. The independent variables and their levels are presented in Table 1. To avoid bias, 17 runs were performed in totally random order. The independent variables, or factors studied, were the inoculation amount (A), the initial fermentation pH (B) and the fermentation temperature (C). The response or dependent variable (Y) was the production of ε-PL (Table 2). Duplicate experiments were carried out at all design points. The effect of these independent variables A, B and C on the response Y was investigated using the second order polynomial regression equation with backward elimination. The analysis of data and the optimizing process were generated using Design-Expert software (Version 8.0.6) for the experimental design and statistical analysis.

2.5. Fermentation in a 2-L Stirred Tank Bioreactor

The fermentation in a 2-L glass stirred tank bioreactor (Biotech-2BG, Baoxing Bio-Engineering Equipment Co., Ltd., Shanghai, China) was performed with a filling volume of 1.4 L. Before the inoculation, the sterilized bioreactor of temperature, aeration rate, and agitation speed was maintained at 30 °C, 0.5 vvm and 200 rpm, respectively, and initial pH was controlled at 6.8 via manual addition of ammonia water (12.5%, w/v). When the system was stable, 300 mL of 24 h-old seed culture was inoculated into the bioreactor. During the fermentation, pH and DO were monitored online by pH and DO electrodes (K8S-225 and InPro6800-12-220, Mettler Toledo, Zurich, Switzerland), respectively. The DO was kept above 30% of air saturation before pH declined to 4.0; afterward, the DO was maintained above 20% of air saturation until the end of fermentation, which was controlled by adjusting the agitation speed from 200 to 800 rpm. When the agitation speed reached 800 rpm, aeration rate was then manually increased stepwise by 0.5 vvm, with a range of 0.5–2.5 vvm. In addition, when the glucose concentration in the fermentation broth was below 10 g/L, the sterilized glucose (90%, w/v) was automatically added and maintained at about 10 g/L to prevent carbon source limitation. Moreover, when the ammonia nitrogen (NH4+-N) concentration was less than 0.5 g/L, the sterilized (NH4)2SO4 solution (40%, w/v) was also automatically added and maintained at about 0.5 g/L for preventing nitrogen source limitation. Those conditions were used throughout this study when fermentations were performed in the 2 L bioreactor.

2.6. Analytical Methods

All samples were centrifuged at 4500× g for 10 min at 20 °C. For determination of the dry cell weight (DCW), the precipitate was collected and washed twice with deionized water, then the washed mycelia were filtered through a pre-weighed filter paper and dried at 105 °C to a constant weight. The supernatant was used for further analysis. The ε-PL concentration was determined using the method described by Itzhaki [27]. Briefly, the supernatant was diluted to ensure that the concentration of ε-PL was maintained between 0.01 and 0.1 g/L, and then 2.0 mL diluent was mixed with 2.0 mL 1 mM methyl orange solution (pH 6.90). After vortex mixing, the precipitation reaction was incubated at 30 °C for 30 min in a shaker at 200 rpm. Subsequently, the mixture was centrifuged at 4500× g for 15 min, and the supernatant was diluted 20-fold and its absorbance was measured at 465 nm. The concentration of glucose was determined using a biosensor (SBA-50B, Biology Institute of Shandong Academy of Sciences, Jinan, China), and NH4+-N was analyzed by a colorimetric method using Nessler reagent [28].

2.7. Statistical Analysis

Each value is a mean of three replications. The results are expressed as mean ± standard deviation (mean ± S.D.). The difference between experimental group and control group in this study was distinguished by statistical analysis with GraphPad Prism 6.0 and p-value < 0.05 was considered significant.

3. Results

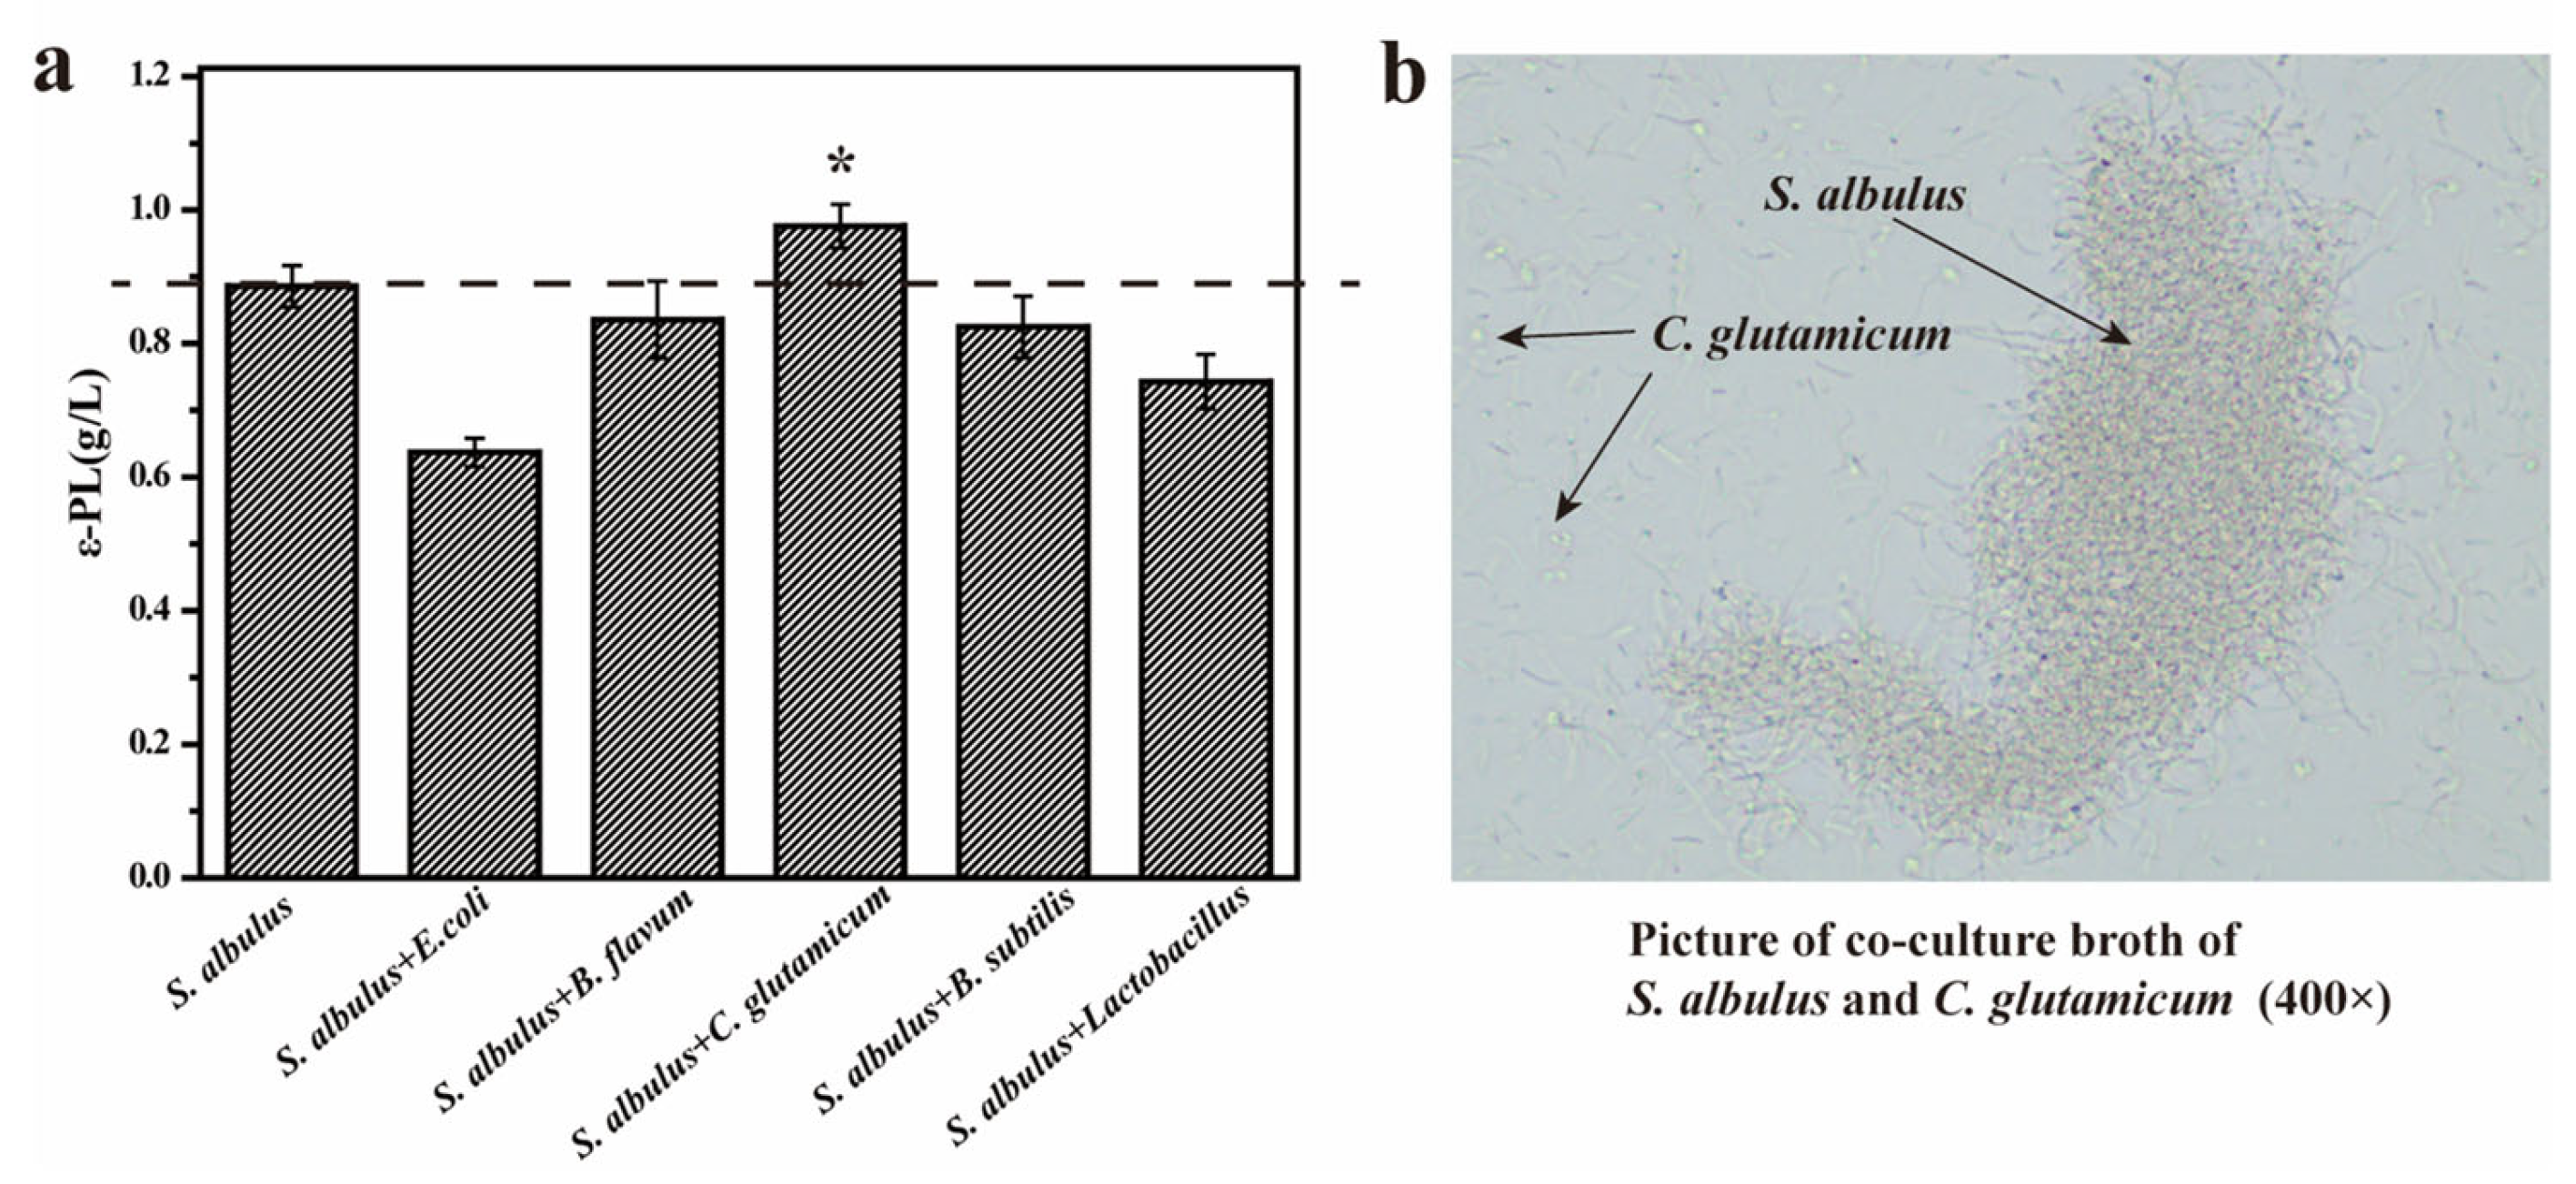
3.1. Improving the Production of ε-PL by Co-Culture with S. albulus IFO 14147 and C. glutamicum CICC 10064

In this study, we selected five different strains for co-culture with S. albulus IFO 14147. After the seed solution was prepared, five different strains were inoculated with S. albulus into a 250 mL shake flask with 50 mL fermentation medium by inoculum of 8%, then cultivated at 30 °C in a rotary shaker with 200 rpm for 72 h. The production of ε-PL was determined after the fermentation and shown in Figure 1a. Compared to the single strain fermentation of S. albulus (0.886 g/L), the production of ε-PL showed an increase only in the co-culture of S. albulus with C. glutamicum group ((0.976 g/L) by 14.02% (p < 0.05). We speculate that the other four strains may have developed competitive relationships when co-cultured with S. albulus, or may have metabolized certain products that inhibit the synthesis of ε-PL by S. albulus. Therefore, C. glutamicum CICC 10064 was selected to co-culture with S. albulus IFO 14147 to increase the production of ε-PL. Figure 1b shows that these two strains could coexist in the fermentation broth (C. glutamicum is short rod-shaped and S. albulus is a spherical mycelium), which indicates that the metabolites produced by strains will not inhibit or damage them.

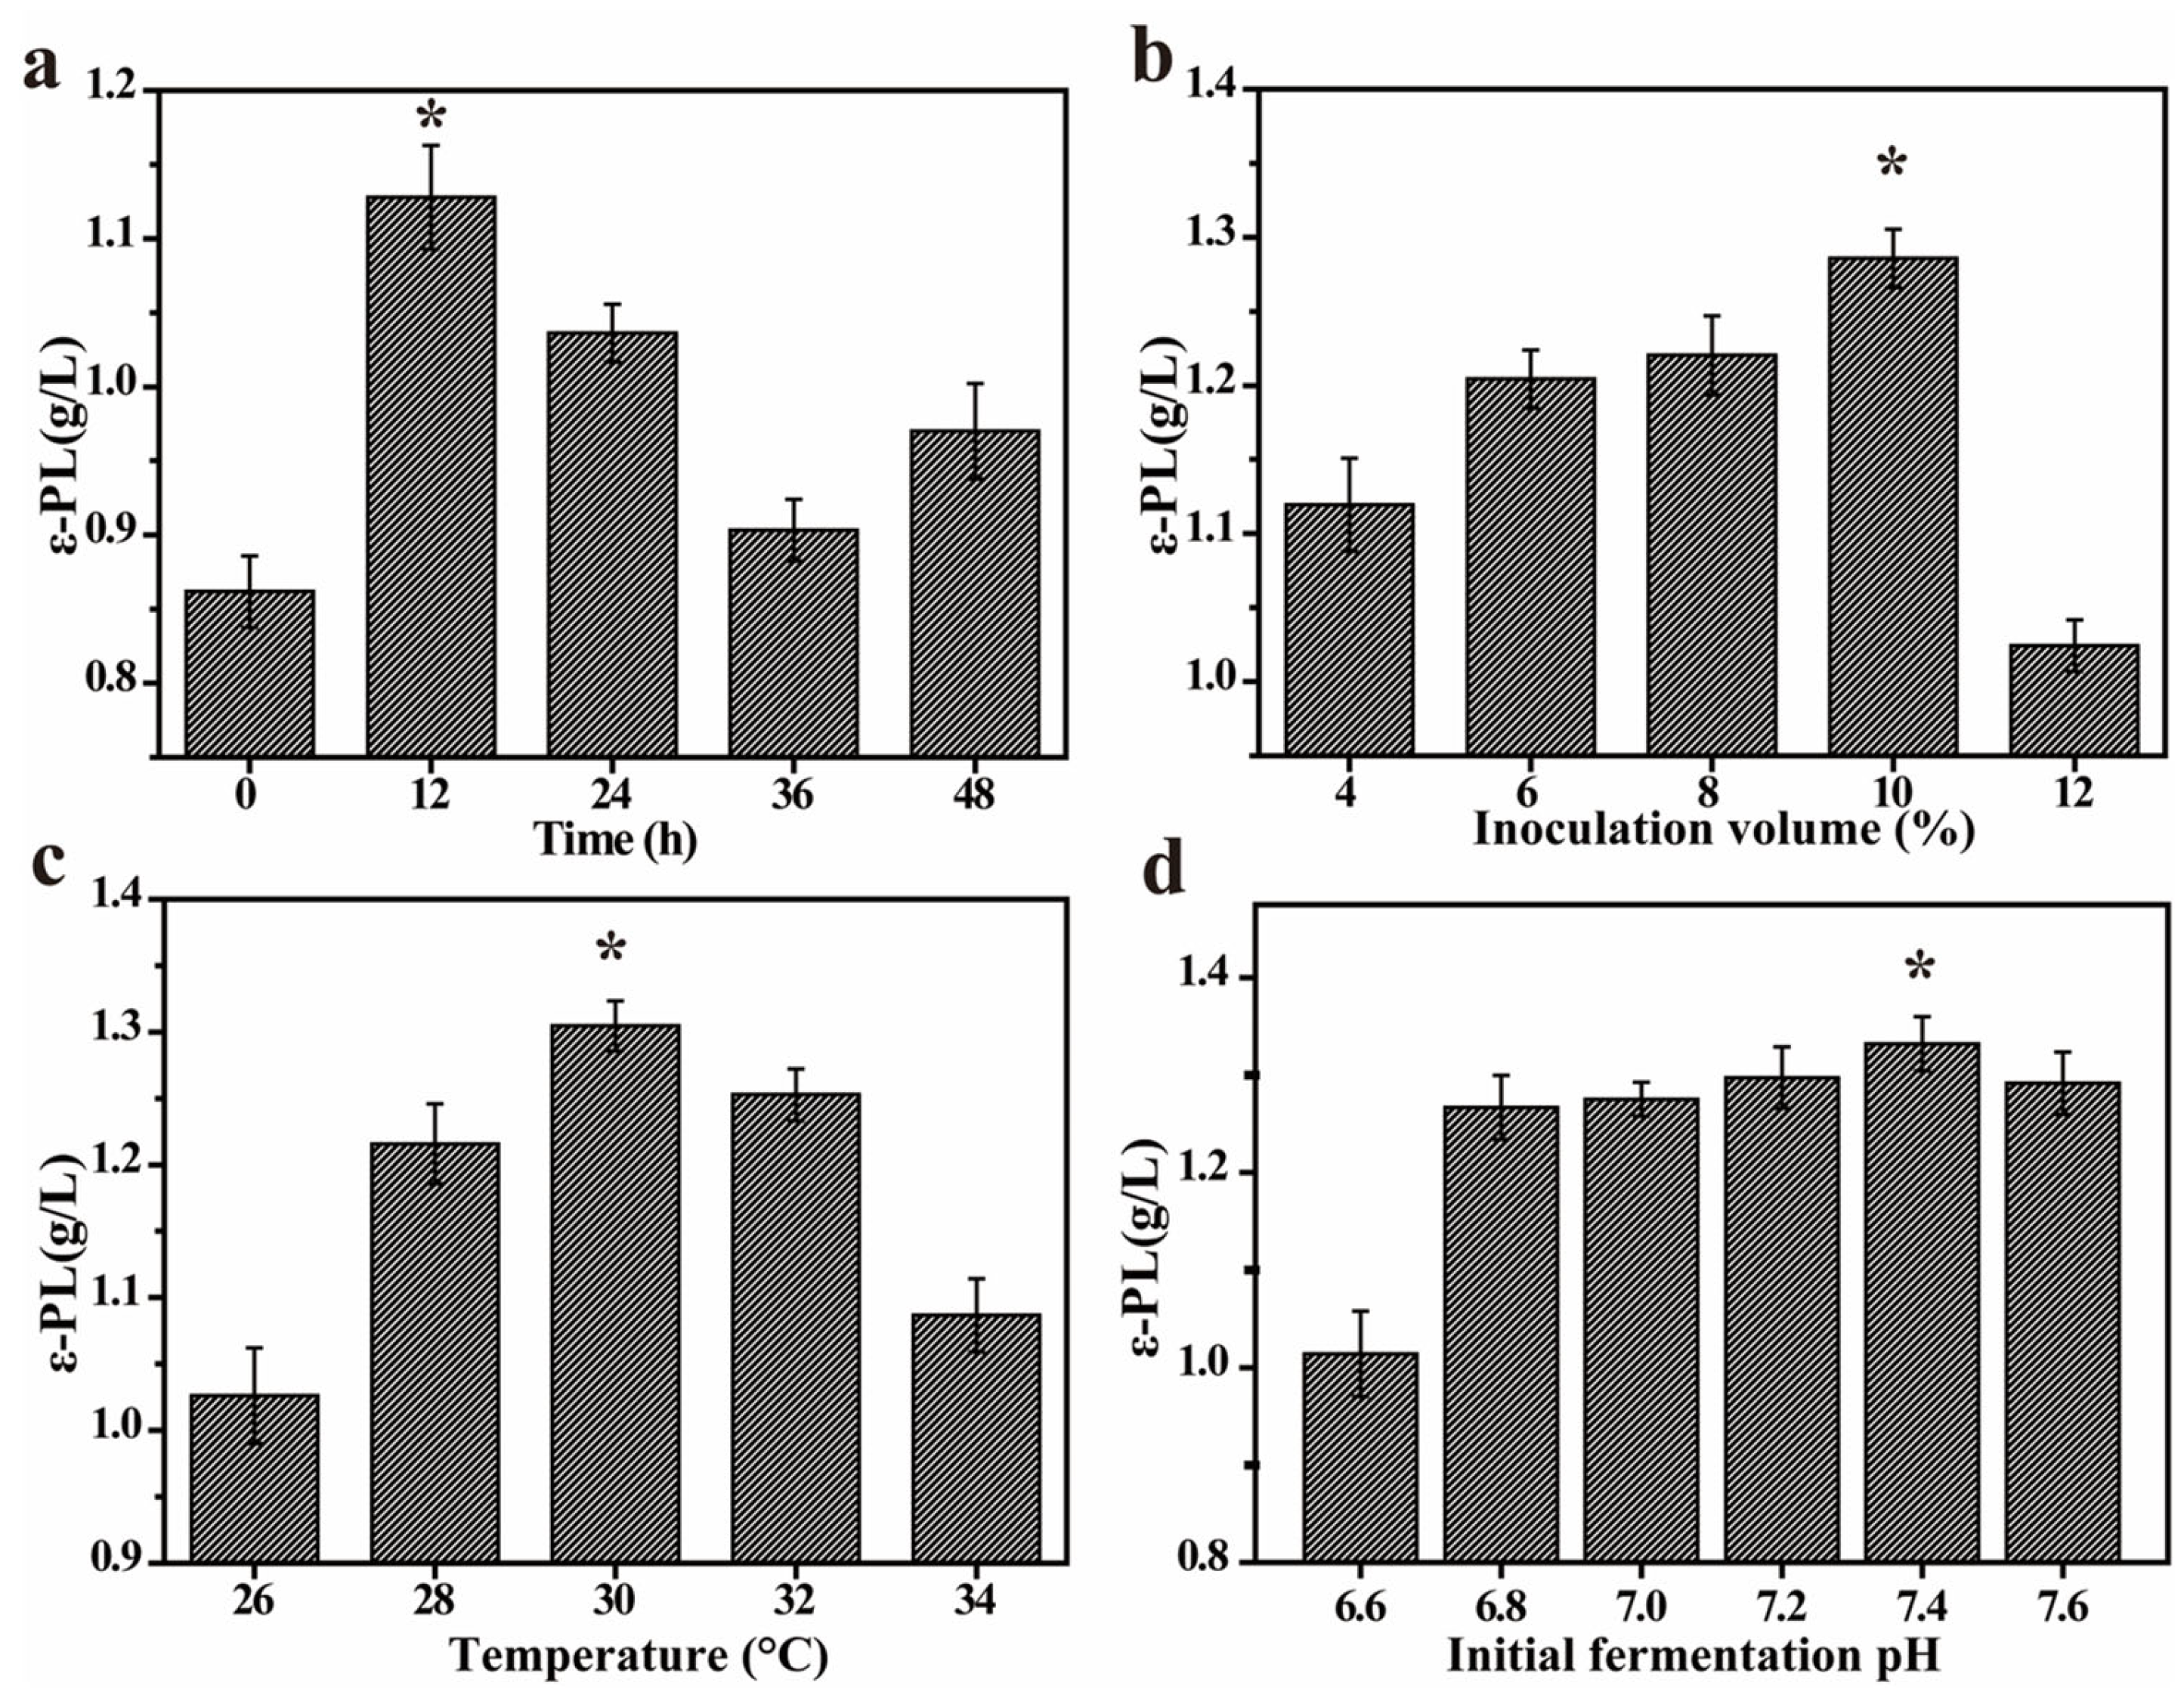
3.2. Single Factor Experiment on Co-Culture Fermentation

3.2.1. Effect of Inoculum Time Conditions on ε-PL Production

It is well known that age represents the physiological state of the seed culture; therefore, inoculation time could significantly influence on the co-culture of different strains. The optimized results are shown in Figure 2a. The highest production of ε-PL (1.13 ± 0.03 g/L) was obtained 12 h after the inoculation of S. albulus IFO 14147. Therefore, the inoculation time of C. glutamicum was determined to be 12 h after S. albulus inoculation.

3.2.2. Effect of Inoculum Volume on ε-PL Production

Inoculum volume plays an important role in fermentation. Especially in co-culture, if the inoculum of one strain is too small, it will cause one of the strains to become a weak strain and it cannot achieve co-growth [16]. As shown in Figure 2b, the highest production of ε-PL was obtained when the inoculation amount of C. glutamicum was 10%.

3.2.3. Effect of Fermentation Temperature on ε-PL Production

The results of the optimization of the fermentation temperature of the co-culture are shown in the Figure 2c. At 12 h after inoculation of S. albulus, and C. glutamicum was inoculated with 10% of the inoculum, the highest production of ε-PL was obtained when the inoculation temperature was 30 °C.

3.2.4. Effect of Initial pH on ε-PL Production

The initial pH might influence mycelial growth. Thus, the effects of initial pH on ε-PL production in co-culture were evaluated, and the results are shown in Figure 2d. With the increase in the initial fermentation pH value, the production of ε-PL gradually increased and reached the highest value at pH 7.4. With the initial fermentation pH continuing to increase, the production of ε-PL would no longer increase, but had a decreasing trend. Therefore the optimal initial fermentation pH was determined to be 7.4.

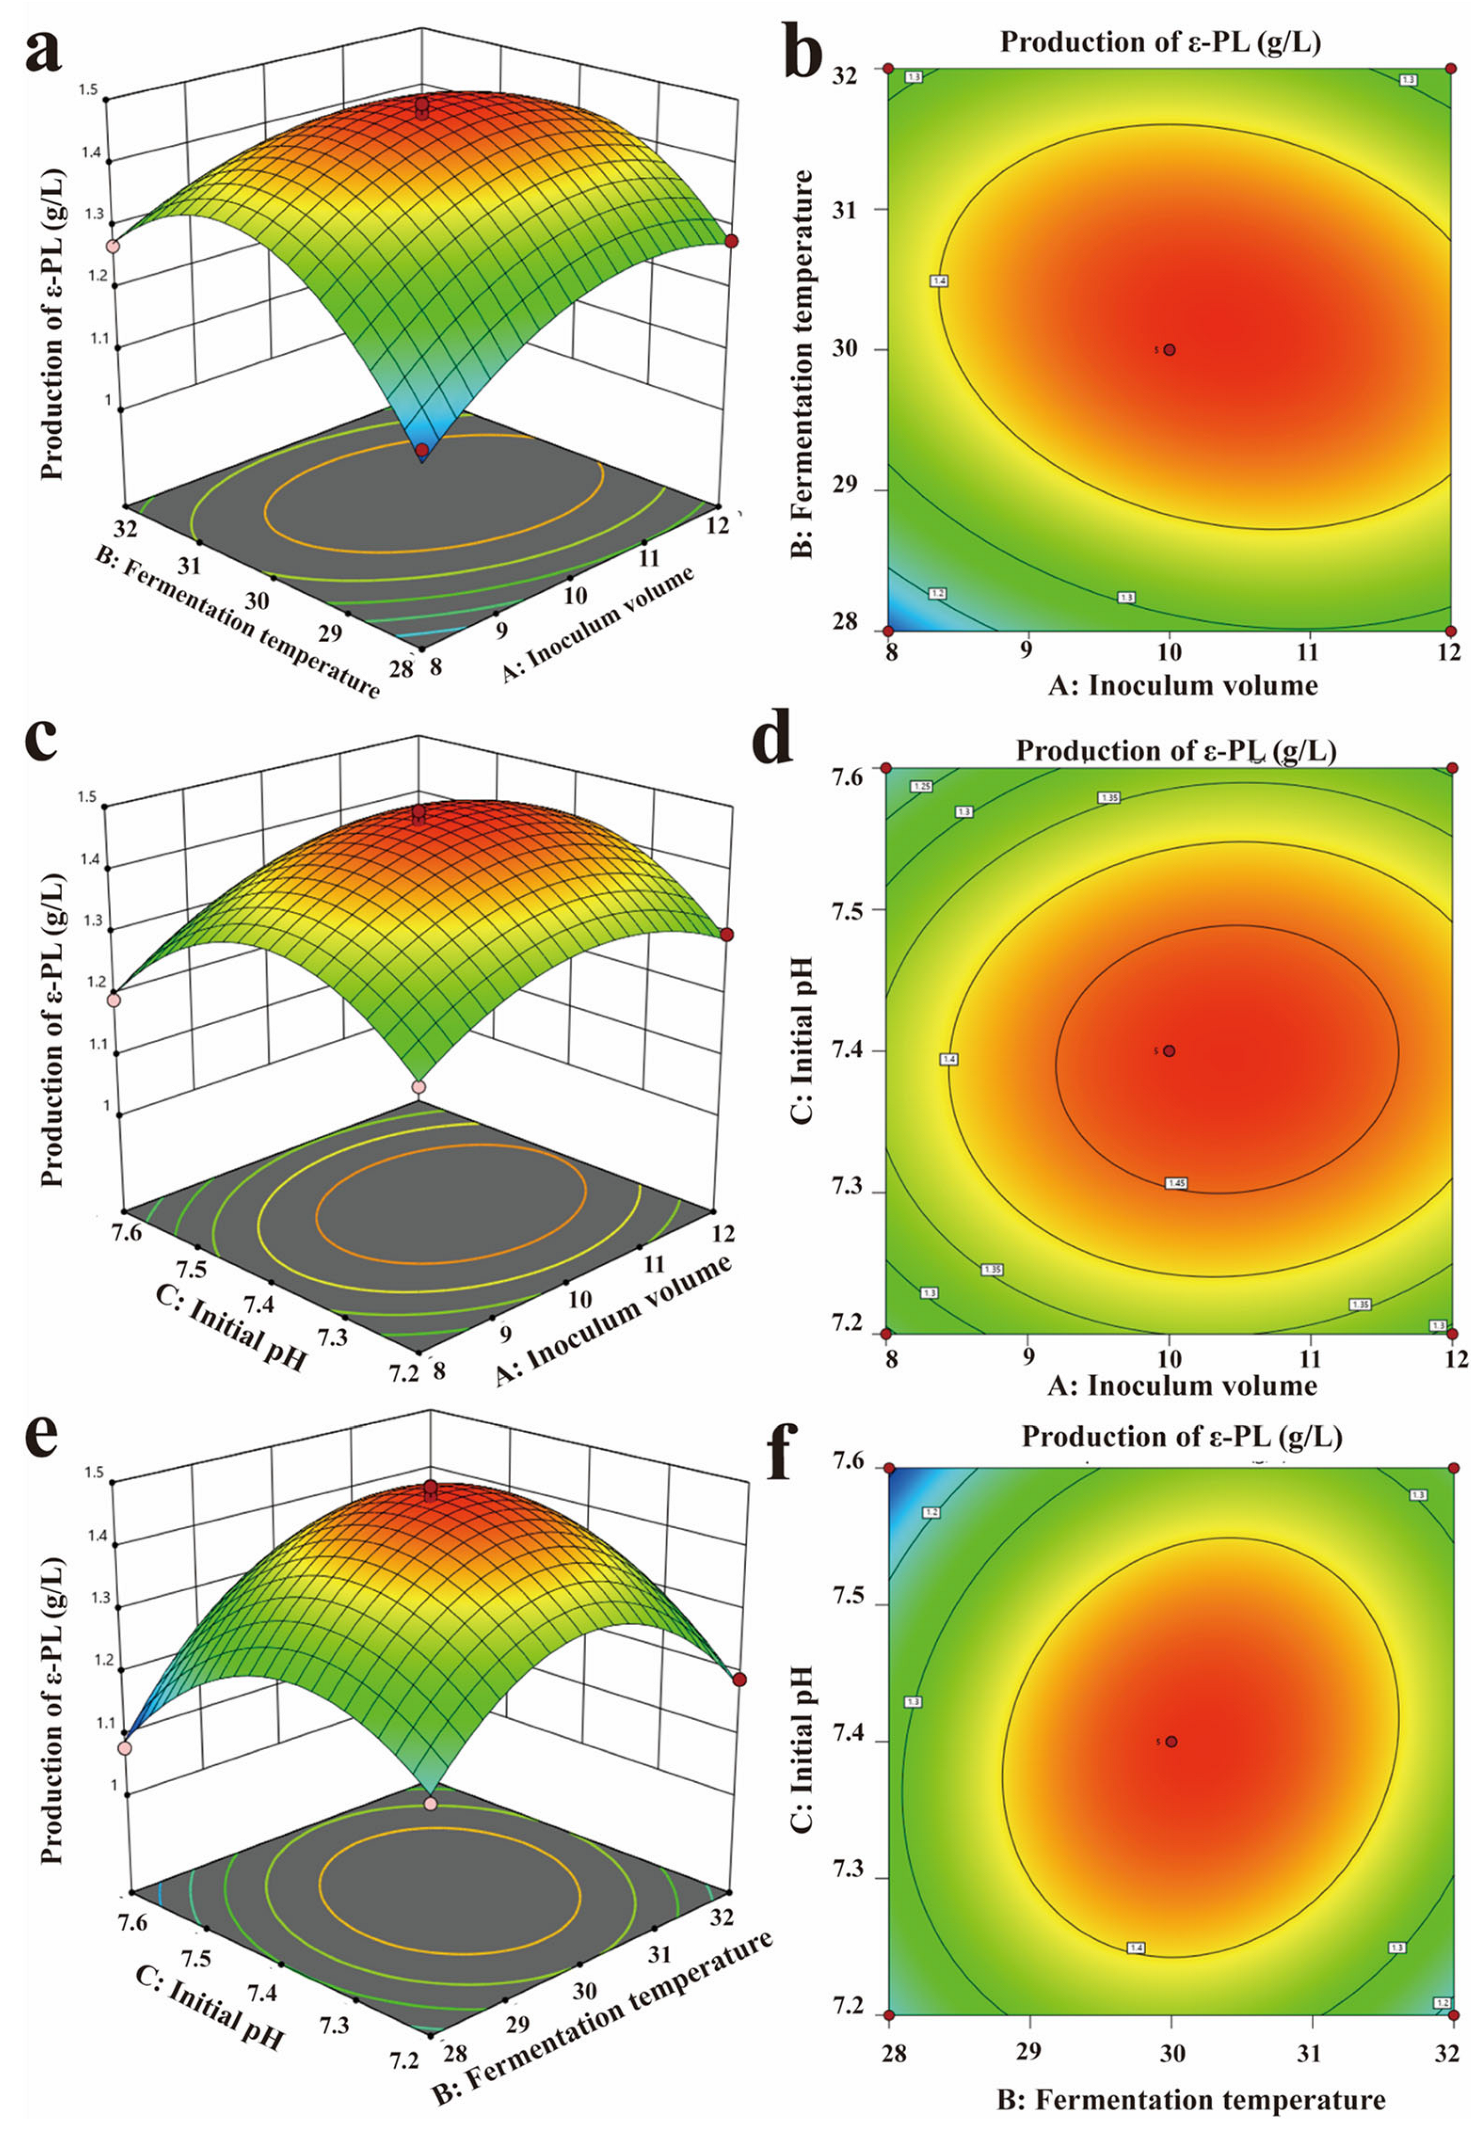
3.3. Response Surface Design to Optimize the Optimal Fermentation Conditions of Co-Culture

Based on the results of single factor experiments, inoculum volume, fermentation temperature, and initial pH were selected as variables, and optimized by Box–Behnken experimental design [29]. The second-order polynomial equation explains the production of ε-PL obtained by multiple regression analysis, which is shown as follows:
Y = −195.176 + 0.537A + 1.718B + 45.412C − 0.011AB + 0.107BC + 0.028AC − 0.02A2 − 0.04B2 − 3.307C2
where Y is the production of ε-PL (g/L), A is inoculum volume, B is fermentation temperature, and C is initial pH, respectively.
The results were analyzed by ANOVA and the statistical significance was checked by F test. As shown in Table 3, the F value was 29.18, which implied that the model was statistically significant (p < 0.001). The p value for lack of fit (0.5577) implied that the lack of fit was not significant compared with pure error. The value of R2 (0.9847) and Adj-R2 (0.9651) suggested that the regression equation developed had a goodness of fit and could successfully predict the response and explain more than 95% of the variability in the production of ε-PL. Furthermore, the coefficient of variation (C.V. = 1.92%) indicated a high degree of precision and better reliability of these experimental results.
All the results showed good consistency between the experimental and predicted production of ε-PL, which also implied that the mathematical model was suitable for the production of ε-PL in the present study. The smaller the magnitude of p value, the more significant the corresponding term, which can also help to understand the interaction among the variables [30]. From Table 3, the most significant factors of this model were A, B, AB, A2, B2 and C2. The p values of these were all less than 0.01, followed by BC. Information visualization of the relationship between variables and response were carried out through three-dimensional response surfaces and count plots based on the result of the second-order polynomial function model (Figure 3). As shown in Figure 3a,e, the slope of the surface is steep, and inoculum volume and fermentation temperature (AB) displayed a significant effect on the production of ε-PL. This result suggested that inoculum volume and fermentation temperature might be the crucial factors in promoting the production of ε-PL, followed by fermentation temperature and initial pH (BC). The mutual interaction between inoculum volume and initial pH (AC) was not significant (Figure 3c), which is consistent with results of ANOVA analysis. Moreover, contour shapes (Figure 3b,d,f) indicate that the production of ε-PL changes relatively insignificantly along with variation in initial pH.

3.4. Verification Test with the Optimal Fermentation Conditions of Co-Culture

The second-order polynomial model obtained by the regression analysis was used to calculate the optimal parameters for the highest production of ε-PL, and the optimal predicted values of the variables are as follows: inoculum volume, 10.37%; fermentation temperature, 30.2 °C; and initial pH, 7.40. Under the optimal conditions, the maximum predicted production of ε-PL was 1.482 g/L. The production of ε-PL achieved 1.501 ± 0.013 g/L at optimal conditions with triple validation experiments in the shake flask, and the relative error between the predicted value and the experiment value was only 1.01%, indicating that the production of ε-PL in the experiment was in a good agreement with the model prediction. The production of ε-PL obtained in co-culture with the optimized conditions was 53.79% (p < 0.01) higher than that before optimization (0.976 g/L). The result suggests that co-culture fermentation strategy can be carried out in the fermenter at a large-scale.

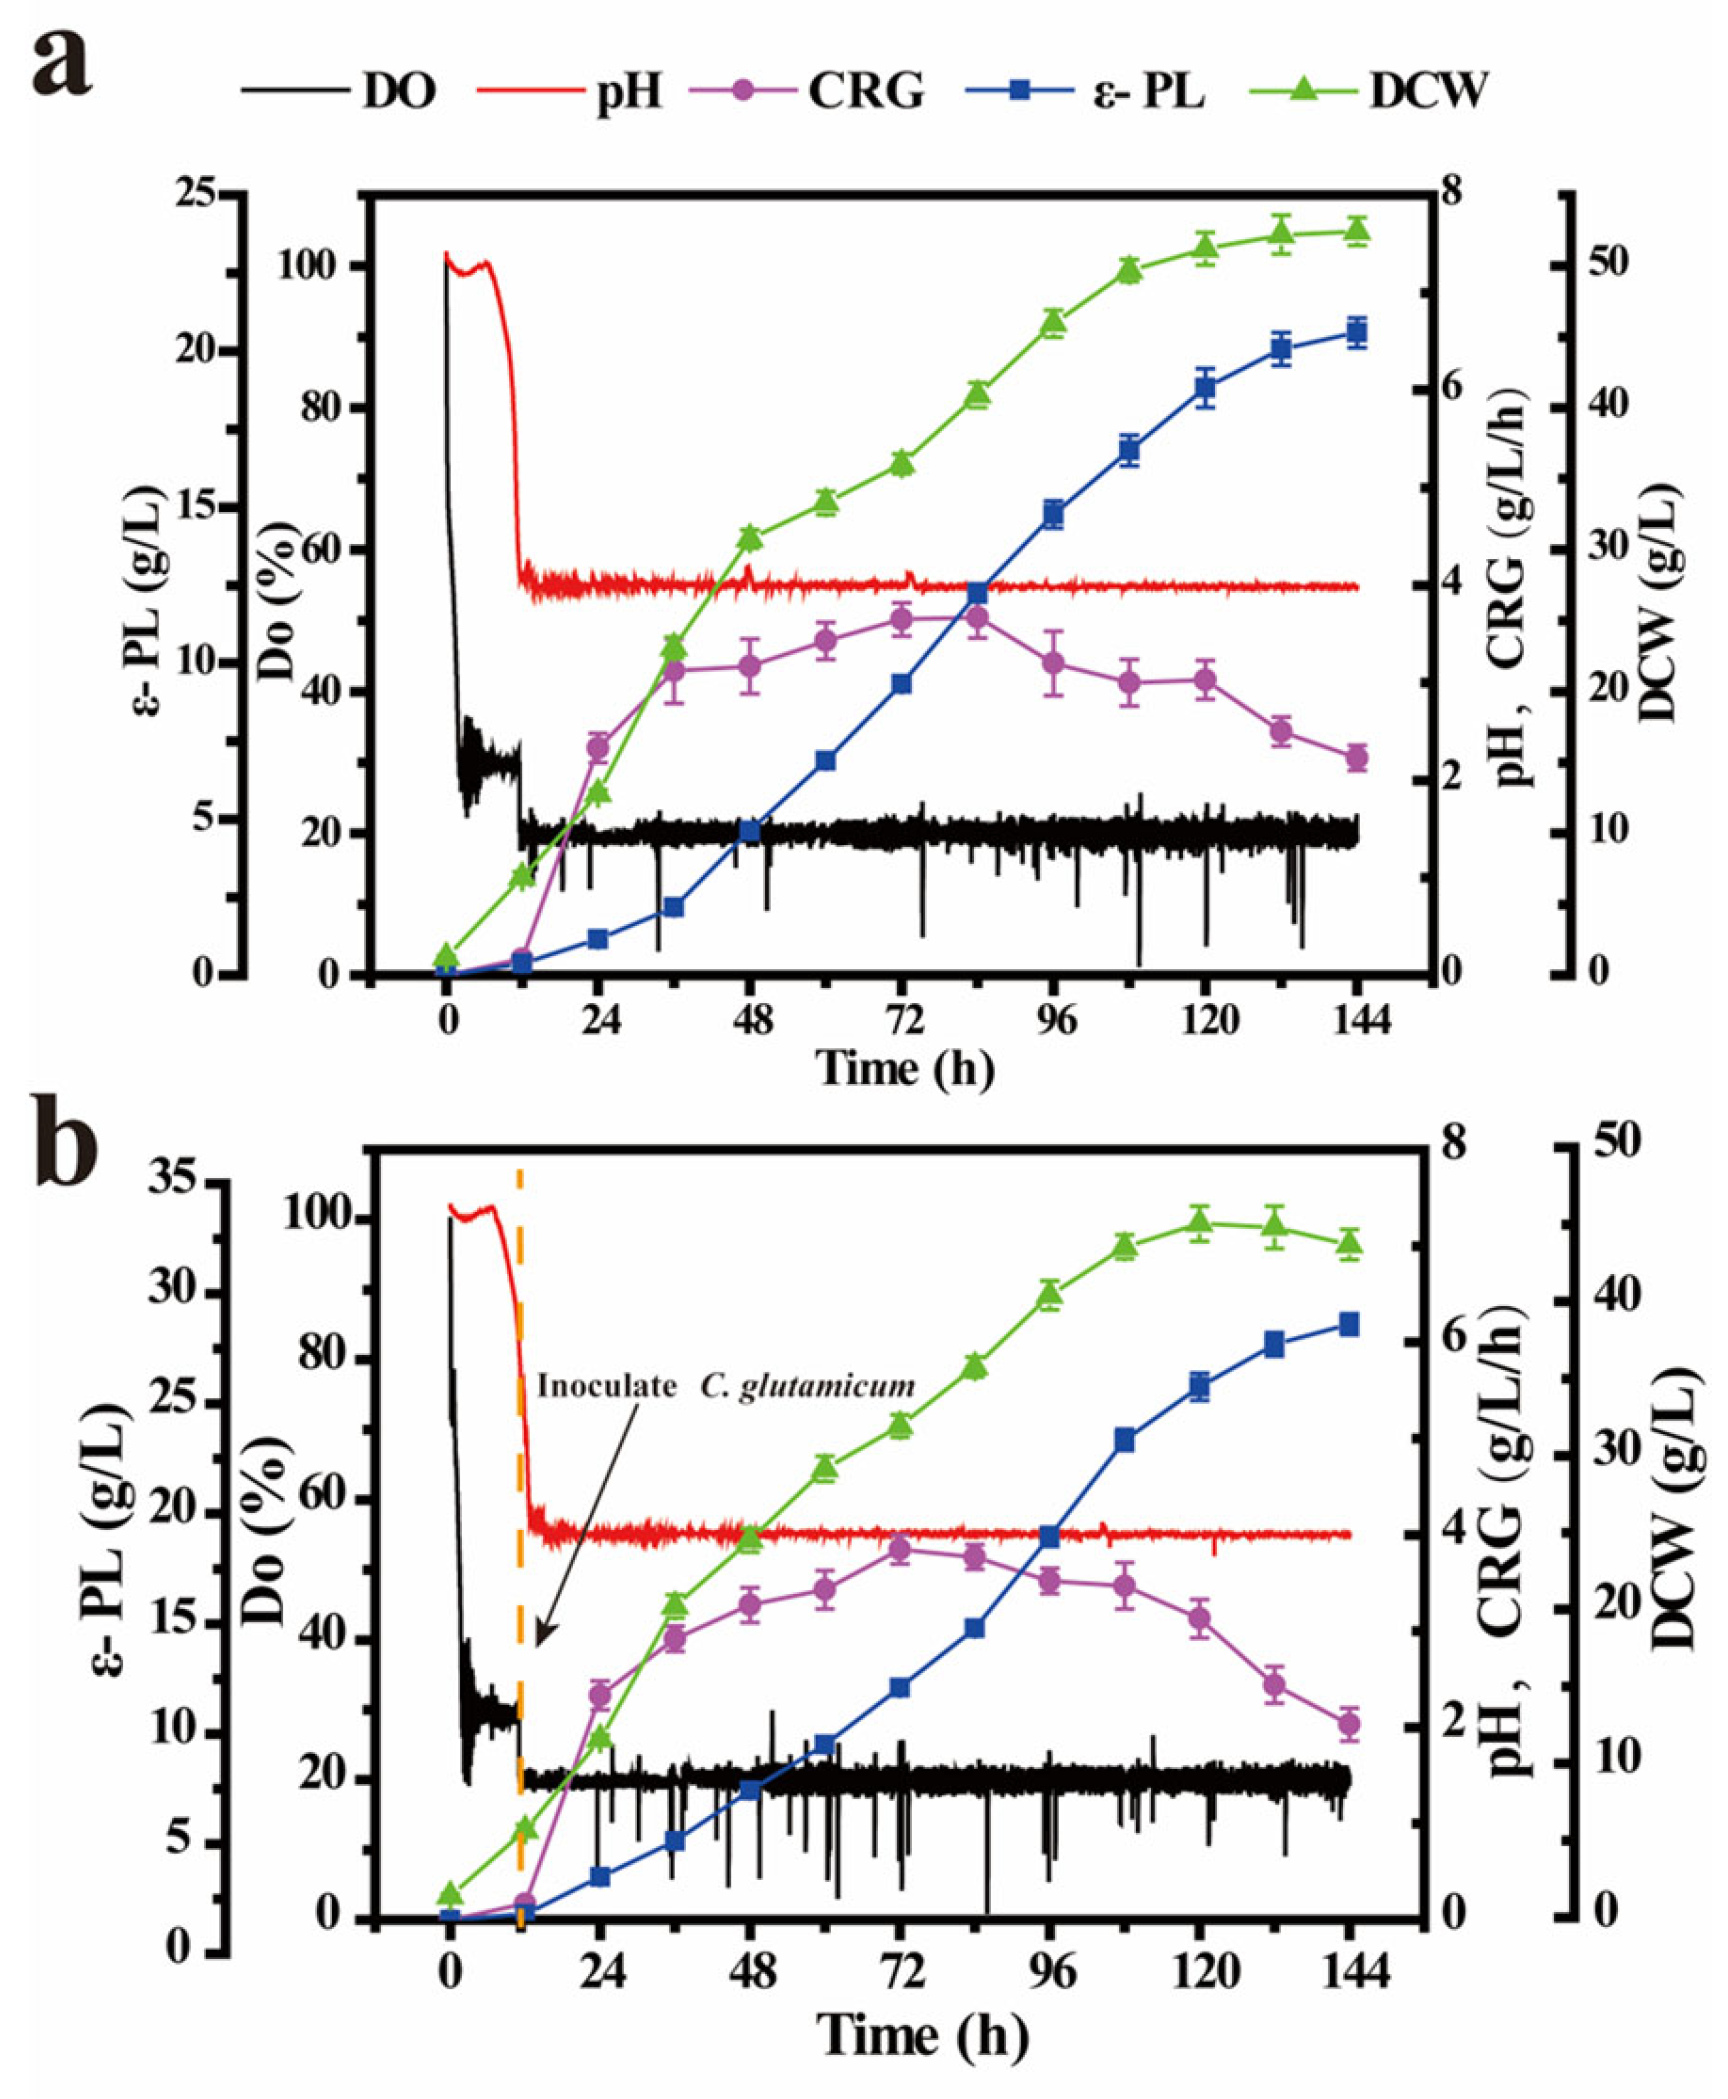
3.5. Production of ε-PL with Co-Culture Fermentation Strategy in a 2-L Fermenter

Following optimization of the fermentation parameters, a novel co-culture fermentation strategy was developed and performed in a 2-L jar fermenter; fed-batch fermentation of single S. albulus was also carried out as control group (Figure 4a). As shown in Figure 4b (experimental group), C. glutamicum was inoculated into the fermentor 12 h after the start of fermentation and co-culture with S. albulus. The DO level remained at 30% before the pH was reduced to 4.0, and then remained at 20% (pH reached 4.0) until the end of fermentation. When the glucose concentration in the fermentation broth was below 10 g/L, the sterilized glucose (90%, w/v) was automatically added and maintained at about 10 g/L, and the consumption rate of glucose (CRG) in the experimental group was higher than that in the control group after 72 h of fermentation. In the experimental group, ε-PL steadily accumulated in the culture broth from the start of fed-batch fermentation, and finally reached 27.07 ± 0.47 g/L by 144 h. However, the DCW in the experimental group was only 43.84 ± 0.98 g/L, showing a decrease compared to that in the control group. This means that more glucose was used to synthesize ε-PL, i.e., the ability of bacteria to synthesize ε-PL had been improved.

4. Discussion

When compared with the single-strain fermentation of S. albulus, the co-culture fermentation process exhibited two advantages. First, the DCW in the co-culture fermentation process decreased by 16.39% (Table 4). It has been reported that lower DCW could result in decreased viscosity of the fermentation broth and increased oxygen transfer coefficients [31], so the consumption of aseptic air and power for stirring during fermentation would be reduced, and ultimately decrease the total power consumption. ε-PL fermentation is a high oxygen consumption bioprocess, with power consumption for aseptic air preparation covering over 50% of the cost of ε-PL fermentation [18]. Thus, the lower DCW could reduce the consumption of aseptic air and decrease the cost of fermentation.
In addition, the co-culture fermentation strategy could considerably increase the production of ε-PL. In the novel fermentation process, C. glutamicum was co-cultured with S. albulus after the start of fermentation, and the CRG in co-culture group showed no significant increase compared to that in the control group. However, ε-PL in the experimental group showed higher production after 48 h, and this continued until the end of fermentation. At the end of the fermentation, the production and the yield of ε-PL reached 27.07 ± 0.47 g/L and 0.62 ± 0.06 g/g, compared with the control group, increasing by 31.47% and 58.97% (Table 4). This means that more glucose was used to synthesize ε-PL than bacteria, indicating that the utilization of raw materials had been increased. It is speculated that, in the co-culture fermentation system, the presence of C. glutamicum changes the composition of nutrients in the fermentation broth, and some intermediate metabolites may stimulate or promote the metabolic pathway of L-lysine synthesis in S. albulus, thereby increasing the final production of ε-PL. Thus, the novel co-culture fermentation strategy could be significantly important for rapid and efficient production of ε-PL.
It has been reported that some other fermentation products, nisin and bioethanol, could also be markedly enhanced by co-culture fermentation. It was confirmed that yeast can utilize the metabolic by-products of C. glutamicum, such as residual sugar metabolic intermediates, hetero-acids, and so on, to further improve the L-Ornithine production during the co-culture fermentation process [16]. In the latest report of nisin, the researchers co-cultured Saccharomyces cerevisiae with Lactococcus lactis to improve the production of nisin [17]. He et al. enhanced cellulosic bioethanol fermentation by co-culture of Clostridium and Thermoanaerobacter spp. and pointed out that vitamin B12, which is produced by Thermoanaerobacter spp., could be used as valuable nutrient supplements to optimize the fermentative production of bioethanol [32]. These findings will guide us in studying the mechanism of increasing the production of ε-PL by co-culture fermentation.

5. Conclusions

In conclusion, a novel fermentation strategy was developed by co-culture fermentation to increase the production of ε-PL. Under the optimal conditions, the production and the yield of ε-PL reached 27.07 ± 0.47 g/L and 0.52 ± 0.02 g/g after 144 h of fed-batch fermentation in a 2-L fermenter, which were 31.47% and 13.04% higher, respectively, when compared with single strain fermentation. As a result, the proposed strategy might significantly increase the amount of DCW and the production of ε-PL. The results obtained in this study could be useful for large-scale ε-PL production.

Author Contributions

Conceptualization, J.H. and X.Z.; methodology, L.P., M.T. and C.Z.; investigation, X.Y. and Z.Z.; data curation, Y.Z. and C.T.; writing—original draft preparation, L.P.; writing—review and editing, X.Z., X.C., G.Y., A.L. and M.H.; supervision, J.H. and X.Z.; project administration, J.H. and M.H.; funding acquisition, J.H. and L.P. All authors have read and agreed to the published version of the manuscript.

Funding

This research was funded by High-Level Talents Research Fund of HAUT (Grant No. 2020BS064), Henan Province Science and Technology Research and Development Plan Joint Fund Project (222103810060), Henan Province Postdoctoral Research Project Funding (202103120), Henan Province Youth Science Fund Project (232300421266). This work was also financially supported by Major Science and Technology Projects for Public Welfare of Henan Province in China (Grant No. 201300110300), Zhongyuan Scholars of Henan Province in China (192101510004), Zhongyuan Scholar Workstation Funded Project (ZYGZZ2021056, 224400510026), The Open competition Research Projects of Xuchang University (2022JBGS11), and Central Government Guides the Local Science and Technology Development Special Fund (Z20221341069).

Institutional Review Board Statement

Not applicable.

Informed Consent Statement

Not applicable.

Data Availability Statement

Not applicable.

Acknowledgments

Sun Yang and Li Hua Associate Professor, School of Life Sciences, Henan University.

Conflicts of Interest

The authors declare that they have no conflict interest.

References

  1. Saimura, M.; Takehara, M.; Mizukami, S.; Kataoka, K.; Hirohara, H. Biosynthesis of nearly monodispersed poly(ε-l-lysine) in Streptomyces species. Biotechnol. Lett. 2008, 30, 377–385. [Google Scholar] [CrossRef] [PubMed]
  2. Chen, X.-S.; Ren, X.-D.; Zeng, X.; Zhao, F.-L.; Tang, L.; Zhang, H.-J.; Zhang, J.-H.; Mao, Z.-G. Enhancement of ε-poly-l-lysine production coupled with precursor l-lysine feeding in glucose–glycerol co-fermentation by Streptomyces sp. M-Z18. Bioprocess Biosyst. Eng. 2013, 36, 1843–1849. [Google Scholar] [CrossRef] [PubMed]
  3. Yoshida, T.; Nagasawa, T. ε-Poly-l-lysine: Microbial production, biodegradation and application potential. Appl. Microbiol. Biotechnol. 2003, 62, 21–26. [Google Scholar] [CrossRef] [PubMed]
  4. Chen, X.-S.; Ren, X.-D.; Dong, N.; Li, S.; Li, F.; Zhao, F.-L.; Tang, L.; Zhang, J.-H.; Mao, Z.-G. Culture medium containing glucose and glycerol as a mixed carbon source improves ε-poly-l-lysine production by Streptomyces sp. M-Z18. Bioprocess Biosyst. Eng. 2012, 35, 469–475. [Google Scholar] [CrossRef]
  5. Xu, Z.; Feng, X.; Sun, Z.; Cao, C.; Li, S.; Xu, Z.; Xu, Z.; Bo, F.; Xu, H. Economic process to co-produce poly(ε-l-lysine) and poly(l-diaminopropionic acid) by a pH and dissolved oxygen control strategy. Bioresour. Technol. 2015, 187, 70–76. [Google Scholar] [CrossRef]
  6. Pan, L.; Chen, X.-S.; Wang, K.-F.; Mao, Z.-G. Mechanisms of response to pH shock in microbial fermentation. Bioprocess Biosyst. Eng. 2020, 43, 361–372. [Google Scholar] [CrossRef]
  7. Liu, S.; Wu, Q.; Zhang, J.; Mo, S. Production of ε-poly-L-lysine by Streptomyces sp. using resin-based, in situ product removal. Biotechnol. Lett. 2011, 33, 1581–1585. [Google Scholar] [CrossRef]
  8. Kahar, P.; Kobayashi, K.; Iwata, T.; Hiraki, J.; Kojima, M.; Okabe, M. Production of ε-polylysine in an airlift bioreactor (ABR). J. Biosci. Bioeng. 2002, 93, 274–280. [Google Scholar] [CrossRef]
  9. Zhang, Y.; Feng, X.; Xu, H.; Yao, Z.; Ouyang, P. ε-Poly-L-lysine production by immobilized cells of Kitasatospora sp. MY 5-36 in repeated fed-batch cultures. Bioresour. Technol. 2010, 101, 5523–5527. [Google Scholar] [CrossRef]
  10. Xu, D.; Yao, H.; Xu, Z.; Wang, R.; Xu, Z.; Li, S.; Feng, X.; Liu, Y.; Xu, H. Production of ε-poly-lysine by Streptomyces albulus PD-1 via solid-state fermentation. Bioresour. Technol. 2017, 223, 149–156. [Google Scholar] [CrossRef]
  11. Kahar, P.; Iwata, T.; Hiraki, J.; Park, E.Y.; Okabe, M. Enhancement of ε-polylysine production by Streptomyces albulus strain 410 using pH control. J. Biosci. Bioeng. 2001, 91, 190–194. [Google Scholar] [CrossRef]
  12. Ren, X.-D.; Chen, X.-S.; Zeng, X.; Wang, L.; Tang, L.; Mao, Z.-G. Acidic pH shock induced overproduction of ε-poly-l-lysine in fed-batch fermentation by Streptomyces sp. M-Z18 from agro-industrial by-products. Bioprocess Biosyst. Eng. 2015, 38, 1113–1125. [Google Scholar] [CrossRef]
  13. Rodríguez, M.E.; Lopes, C.A.; Barbagelata, R.J.; Barda, N.B.; Caballero, A.C. Influence of Candida pulcherrima Patagonian strain on alcoholic fermentation behaviour and wine aroma. Int. J. Food Microbiol. 2010, 138, 19–25. [Google Scholar] [CrossRef]
  14. Casey, E.; Mosier, N.S.; Adamec, J.; Stockdale, Z.; Ho, N.; Sedlak, M. Effect of salts on the Co-fermentation of glucose and xylose by a genetically engineered strain of Saccharomyces cerevisiae. Biotechnol. Biofuels 2013, 6, 83. [Google Scholar] [CrossRef] [Green Version]
  15. Kaur, S.; Kaur, K.; Bhushan, B.; Kaur, M.; Hans, M. Inoculum Size and Age Studies on Single and Mixed Strain Fermentation of Grape Juice. J. Pure Appl. Microbiol. 2020, 14, 2137–2145. [Google Scholar] [CrossRef]
  16. Huan, L.I.; Zhou, L.; Chen, Y.; Wei, P.; Ouyang, P.K. Studies on multi-bacterium fermentation of L-ornithine. Ind. Microbiol. 2006. [Google Scholar] [CrossRef]
  17. Liu, W.; Zhou, J.; Tan, F.; Yin, H.; Yang, C.; Lu, K. Improvement of nisin production by using the integration strategy of co-cultivation fermentation, foam fractionation and pervaporation. LWT Food Sci. Technol. 2021, 142, 111093. [Google Scholar] [CrossRef]
  18. Pan, L.; Chen, X.-S.; Liu, M.-M.; Liu, Y.-J.; Mao, Z.-G. Efficient production of ε-poly-l-lysine from glucose by two-stage fermentation using pH shock strategy. Process. Biochem. 2017, 63, 8–15. [Google Scholar] [CrossRef]
  19. Pan, L.; Chen, X.; Wang, K.; Mao, Z. A temporal transcriptomic dynamics study reveals the reason of enhanced ε-poly-L-lysine production in Streptomyces albulus M-Z18 by pH shock. Process. Biochem. 2019, 85, 1–11. [Google Scholar] [CrossRef]
  20. VanBogelen, R.A.; Kelley, P.M.; Neidhardt, F.C. Differential induction of heat shock, SOS, and oxidation stress regulons and accumulation of nucleotides in Escherichia coli. J. Bacteriol. 1987, 169, 26–32. [Google Scholar] [CrossRef] [PubMed] [Green Version]
  21. Huang, Q.-G.; Zeng, B.-D.; Liang, L.; Wu, S.-G.; Huang, J.-Z. Genome shuffling and high-throughput screening of Brevibacterium flavum MDV1 for enhanced l-valine production. World J. Microbiol. Biotechnol. 2018, 34, 121. [Google Scholar] [CrossRef] [PubMed]
  22. Vallino, J.J.; Stephanopoulos, G. Metabolic flux distributions inCorynebacterium glutamicum during growth and lysine overproduction. Biotechnol. Bioeng. 2010, 41, 633–646. [Google Scholar] [CrossRef] [PubMed]
  23. Voelker, U.; Dufour, A.; Haldenwang, W.G. The Bacillus subtilis rsbU gene product is necessary for RsbX-dependent regulation of sigma B. J. Bacteriol. 2019, 177, 114–122. [Google Scholar] [CrossRef] [Green Version]
  24. Huang, R.; Pan, M.; Wan, C.; Shah, N.P.; Tao, X.; Wei, H. Physiological and transcriptional responses and cross protection of Lactobacillus plantarum ZDY2013 under acid stress. J. Dairy Sci. 2016, 99, 1002–1010. [Google Scholar] [CrossRef] [PubMed] [Green Version]
  25. Ren, X.-D.; Chen, X.-S.; Tang, L.; Zeng, X.; Wang, L.; Mao, Z.-G. Physiological mechanism of the overproduction of ε-poly-l-lysine by acidic pH shock in fed-batch fermentation. Bioprocess Biosyst. Eng. 2015, 38, 2085–2094. [Google Scholar] [CrossRef]
  26. Santisawadi, S.; Chaiseri, S.; Jinda, N.; Klinkesorn, U. Process optimization using response surface design for diacylglycerol synthesis from palm fatty acid distillate by enzymatic esterification. Songklanakarin J. Sci. Technol. 2013, 35, 23–32. [Google Scholar]
  27. Ren, X.-D.; Chen, X.-S.; Tang, L.; Sun, Q.-X.; Zeng, X.; Mao, Z.-G. Efficient production of ε-poly-l-lysine from agro-industrial by-products by Streptomyces sp. M-Z18. Ann. Microbiol. 2014, 65, 733–743. [Google Scholar] [CrossRef]
  28. Itzhaki, R.F. Colorimetric method for estimating polylysine and polyarginine. Anal. Biochem. 1972, 50, 569–574. [Google Scholar] [CrossRef]
  29. Buruleanu, C.L.; Nicolescu, C.L.; Avram, D.; Manea, I.; Bratu, M.G. Effects of yeast extract and different amino acids on the dynamics of some components in cabbage juice during fermentation with Bifidobacterium lactis BB-12. Food Sci. Biotechnol. 2012, 21, 691–699. [Google Scholar] [CrossRef]
  30. Xin, W.; Shao, C.; Lian, L.; Xing, G.; Xu, Y.; Xin, L. Optimization, partial characterization and antioxidant activity of an exopolysaccharide from Lactobacillus plantarum KX041. Int. J. Biol. Macromol. 2017, 103, 1173–1184. [Google Scholar]
  31. Bandaiphet, C.; Prasertsan, P. Effect of aeration and agitation rates and scale-up on oxygen transfer coefficient, kLa in exopolysaccharide production from Enterobacter cloacae WD7. Carbohydr. Polym. 2006, 66, 216–228. [Google Scholar] [CrossRef]
  32. He, Q.; Hemme, C.L.; Jiang, H.; He, Z.; Zhou, J. Mechanisms of enhanced cellulosic bioethanol fermentation by co-cultivation of Clostridium and Thermoanaerobacter spp. Bioresour. Technol. 2011, 102, 9586–9592. [Google Scholar] [CrossRef] [PubMed]
Figure 1. Co-culture and fermentation of S. albulus IFO 14147 with different microorganisms (a) and picture of co-culture fermentation broth of S. albulus and C. glutamicum (b). (* represent p < 0.05; black arrow: means the mycelial morphology of S. albulus and C. glutamicum).
Fermentation 09 00626 g001
Figure 2. Optimization of fermentation conditions of co-culture for improving the production of ε-PL in flask cultivation level: (a) inoculation time of C. glutamicum, (b) inoculation volume of C. glutamicum, (c) different fermentation temperature, (d) different initial pH. (* represent p < 0.05).
Fermentation 09 00626 g002
Figure 3. Three-dimensional plots and corresponding contour plots of the three variables on the response (production of ε-PL(g/L)) of the second-order polynomial function model. ((a,b) effect of inoculum volume and fermentation temperature; (c,d) effect of inoculum volume and initial pH; (e,f) effect of initial pH and fermentation temperature).
Fermentation 09 00626 g003
Figure 4. Fed-batch fermentation of ε-PL with different fermentation strategies: (a) control group; (b) experimental group.
Fermentation 09 00626 g004
Table 1. The levels of selected fermentation conditions for inoculation.
Parameters Levels
−101
Inoculums volume (%)8%10%12%
Fermentation temperature (°C)283032
Initial pH 7.27.47.6
Table 2. The response surface design and results.
Run NoABC
1−1−10
2−110
31−10
4110
50−1−1
60−11
701−1
8011
9−10−1
1010−1
11−101
12101
13000
14000
15000
16000
17000
Note: A is inoculum volume, B is fermentation temperature, and C is initial pH, respectively.
Table 3. Analysis of variance (ANOVA) of Box–Behnken design experiments for co-culture fermentation.
Source Sum of SquaredfMean SquareF Valuep ValueSignificant
Model0.279690.031150.16<0.0001**
A0.009610.009615.510.0056**
B0.009710.009715.720.0054**
C0.000810.00081.360.2825
AB0.007710.007712.380.0097**
AC0.000510.00050.78470.4051
BC0.007310.007311.770.0110*
A20.023110.023147.500.0002**
B20.093010.0930181.14<0.0001**
C20.064610.0646127.18<0.0001**
Residual0.004370.0272
Lack of fit0.001630.00055.910.7120
Pure Error0.002720.0010
Cor Total0.284014
R20.9847
Adj-R20.9651
C.V.%1.92
Note: A is inoculum volume, B is fermentation temperature, and C is initial pH. * and ** Represent p < 0.05 and p < 0.01, respectively.
Table 4. Comparison of fermentation parameters in fed-batch fermentation of ε-PL with different fermentation strategies.
ParametersControl GroupExperimental GroupComparison (%)
Fermentation time (h)1441440
ε-PL production (g/L)20.59 ± 0.3927.07 ± 0.4731.47
DCW (g/L)43.84 ± 0.9852.44 ± 1.1819.62
Yield (g/g)0.46 ± 0.010.52 ± 0.0213.04
Disclaimer/Publisher’s Note: The statements, opinions and data contained in all publications are solely those of the individual author(s) and contributor(s) and not of MDPI and/or the editor(s). MDPI and/or the editor(s) disclaim responsibility for any injury to people or property resulting from any ideas, methods, instructions or products referred to in the content.

