Article

Real-Time Discrimination and Quality Evaluation of Black Tea Fermentation Quality Using a Homemade Simple Machine Vision System

1
Tea Research Institute, Shandong Academy of Agricultural Sciences, Jinan 250033, China
2
College of Engineering and Technology, Southwest University, Chongqing 400715, China
*
Authors to whom correspondence should be addressed.
These authors contributed equally to this work.
Fermentation 2023, 9(9), 814; https://doi.org/10.3390/fermentation9090814
Submission received: 21 August 2023 / Revised: 4 September 2023 / Accepted: 5 September 2023 / Published: 6 September 2023

Abstract

:
Fermentation is a key link in determining the quality and flavor formation of black tea. However, during the actual production, the judgment of black tea fermentation quality mainly relies on the sensory evaluation of the tea maker, which is more subjective and prone to cause inconsistency in tea quality. Traditional testing methods, such as physical and chemical analyses, are time-consuming, laborious, and costly and are unable to meet the needs of the actual production. In this study, a self-developed machine vision system was used to quickly and accurately identify the degree of black tea fermentation by acquiring color and texture information on the surface of fermented leaves. To accurately control the quality of black tea fermentation and to understand the dynamic changes in key endoplasmic components in the fermented leaves, a quantitative prediction model of the key endoplasmic components in the fermentation process of black tea was constructed. The experiments proved that the system achieved 100% accuracy in discriminating the degree of fermentation of black tea, and the prediction accuracy of catechin components and thearubigin content reached more than 0.895. This system overcomes the defects of accurate measurement of multiple sensors coupled together, reduces the detection cost, and optimizes the experimental process. It can meet the needs of online monitoring in actual production.

1. Introduction

As a fully fermented tea, black tea is widely sought after for its richness in caffeine, minerals, tea polyphenols, and other efficacious components. It is the most traded tea in the world, accounting for more than 70% globally. China is the origin of black tea with a long history, and the processing generally includes five major processes: plucking, withering, kneading, fermentation, and drying [1]. Black tea fermentation is the key process in black tea production. Fermentation is mainly the process of catalyzing and oxidizing polyphenols, such as catechins and other polyphenols in tea leaves, by polyphenol oxidase and peroxidase of tea leaves, forming the intermediate product o-quinone and then further polymerizing o-quinone into thearubigins [2]. During the fermentation process, the color of the leaves changes from greenish green to greenish yellow and then to purple-red. The tea masters’ decisions are based on this important feature, combined with many years of experience in tea production, to determine whether the black tea fermentation process is complete. However, this method is influenced by factors subjective to tea makers, which seriously affects the quality of the finished tea and fails to achieve the purpose of the scaled-up, batch and standardized production of black tea [3]. To accurately determine the degree of black tea fermentation, assisted analysis methods must be used to continuously detect key physical and chemical indicators in fermented black tea, which is expensive and time-consuming [4]. Therefore, nondestructive, rapid, and accurate evaluation of the fermentation quality of black tea is of great significance for achieving a level of intelligent production of black tea.
With the rapid development of technologies such as machine learning, deep learning, and artificial intelligence, the sensitivity of various types of sensors has been significantly promoted, and remarkable achievements have been made in the real-time monitoring of black tea fermentation quality. Jia, Huiyan et al. selected phenylboronic acid as the receptor for polyphenol-directed binding based on the principle of reversible covalent binding of phenylboronic acid to catechin. An indicator-displacement array (IDA) sensor was developed using catechol violet and cellular alizarin red as indicators, and the accuracy of the evaluation of the degree of black tea fermentation combined with a support vector machine (SVM) algorithm was 80.39~88.00%. The prediction deviations of total polyphenols, total catechins, and epigallocatechin in fermented black tea leaves were 1.55–1.72, 2.03–2.21, and 2.03–2.08, respectively [5]. An, Ting et al. collected the aroma generated by black tea at different fermentation times and used a colorimetric sensor array and color reaction generated by aroma information. Combined with hyperspectral technology, they successfully predicted the aroma quality of black tea at different fermentation times using a data fusion strategy, with a prediction accuracy of 0.969 for the aroma content fraction. Luo, Xuelun et al. proposed a surface-enhanced Raman spectroscopy (SERS) technique to monitor the changes in the content of key quality indicators during the fermentation process of black tea and identified important characteristic peaks associated with black tea of different fermentation levels, which were combined with a one-dimensional convolutional neural network algorithm to achieve prediction accuracies of 0.81 and 0.82 for catechin (C) and epigallocatechin gallate (EGCG), respectively [6]. Although scholars have conducted many studies on the rapid monitoring of black tea fermentation quality, the research results mainly focus on the multidimensional information of monitoring black tea fermentation quality, which requires the joint use of multiple sensors to achieve prediction accuracy to meet practical usage requirements. However, there is relatively little research on the rapid monitoring of black tea fermentation quality using a single portable and real-time monitoring device.
At present, in the actual production process, the fermentation quality of black tea mainly relies on the sensory evaluation of the tea maker, which is highly subjective and easy to cause uneven quality of finished tea. To address this problem, although scholars have conducted related research on the rapid discrimination of black tea fermentation quality, the research results are usually based on the results of multiple monitoring devices coupled together to discriminate, which leads to high sensor costs and complex experimental processes and analysis steps, so there is an urgent need for an inexpensive, rapid, and non-destructive intelligent monitoring device to realize the online evaluation of the black tea fermentation quality, under the premise of guaranteeing the prediction accuracy.

2. Materials and Methods

2.1. Sample Preparation

Fresh tea leaves were picked from the Shengzhou base of the Tea Research Institute of the Chinese Academy of Agricultural Sciences (CAAS). It is located at 29°35′ N latitude and 120°49′ E longitude, at an altitude between 300 and 500 m above sea level and a subtropical monsoon climate. The variety was Tieguanyin, the tea was tender with one bud and one leaf, and the experimental site was the processing building of the Tea Research Institute of CAAS. Tea production was performed in accordance with the traditional process, and the specific steps were as follows: the leaves were evenly laid on a withering rack and naturally withered. After withering for 12 h, multiple samples were taken and placed in a moisture tester for testing. When the moisture content drops to 61%, the rolling process begins. The specific process for empty kneading was 15 min → 10 min of light kneading → 5 min of heavy kneading → 5 min of light kneading → 5 min of light kneading → light kneading for a total of 45 min. After rolling was completed, black tea fermentation was carried out in an artificial climate box. The temperature inside the box was 30 ℃, and the humidity was ≥90%. To study the color change in overfermented samples, the fermentation time was delayed to 5 h (the normal fermentation time for black tea is 3–4 h) [7]. The sampling interval was 1 h, and the sample weight was 500 g, of which 250 g was used for data collection. The remaining 250 g of the sample was put into liquid nitrogen for preservation and then put into a freeze–dryer for freeze–drying treatment. After freeze–drying was completed, it was used for the detection of physical and chemical components [8].

2.2. Detection of Catechin Components and Thearubigin Content

The lyophilized samples were ground for 3 min using a JC-FW-200 pulverizer (Qingdao Ju Chuang Environmental Protection Group Co., Ltd., Qingdao, Shandong, China) and then sieved using a 200-mesh sieve. The thearubigin content was determined according to a systematic analytical method, and the catechin content was determined according to GB/T8313-2008 “Determination of tea polyphenols and catechins in tea” [9].

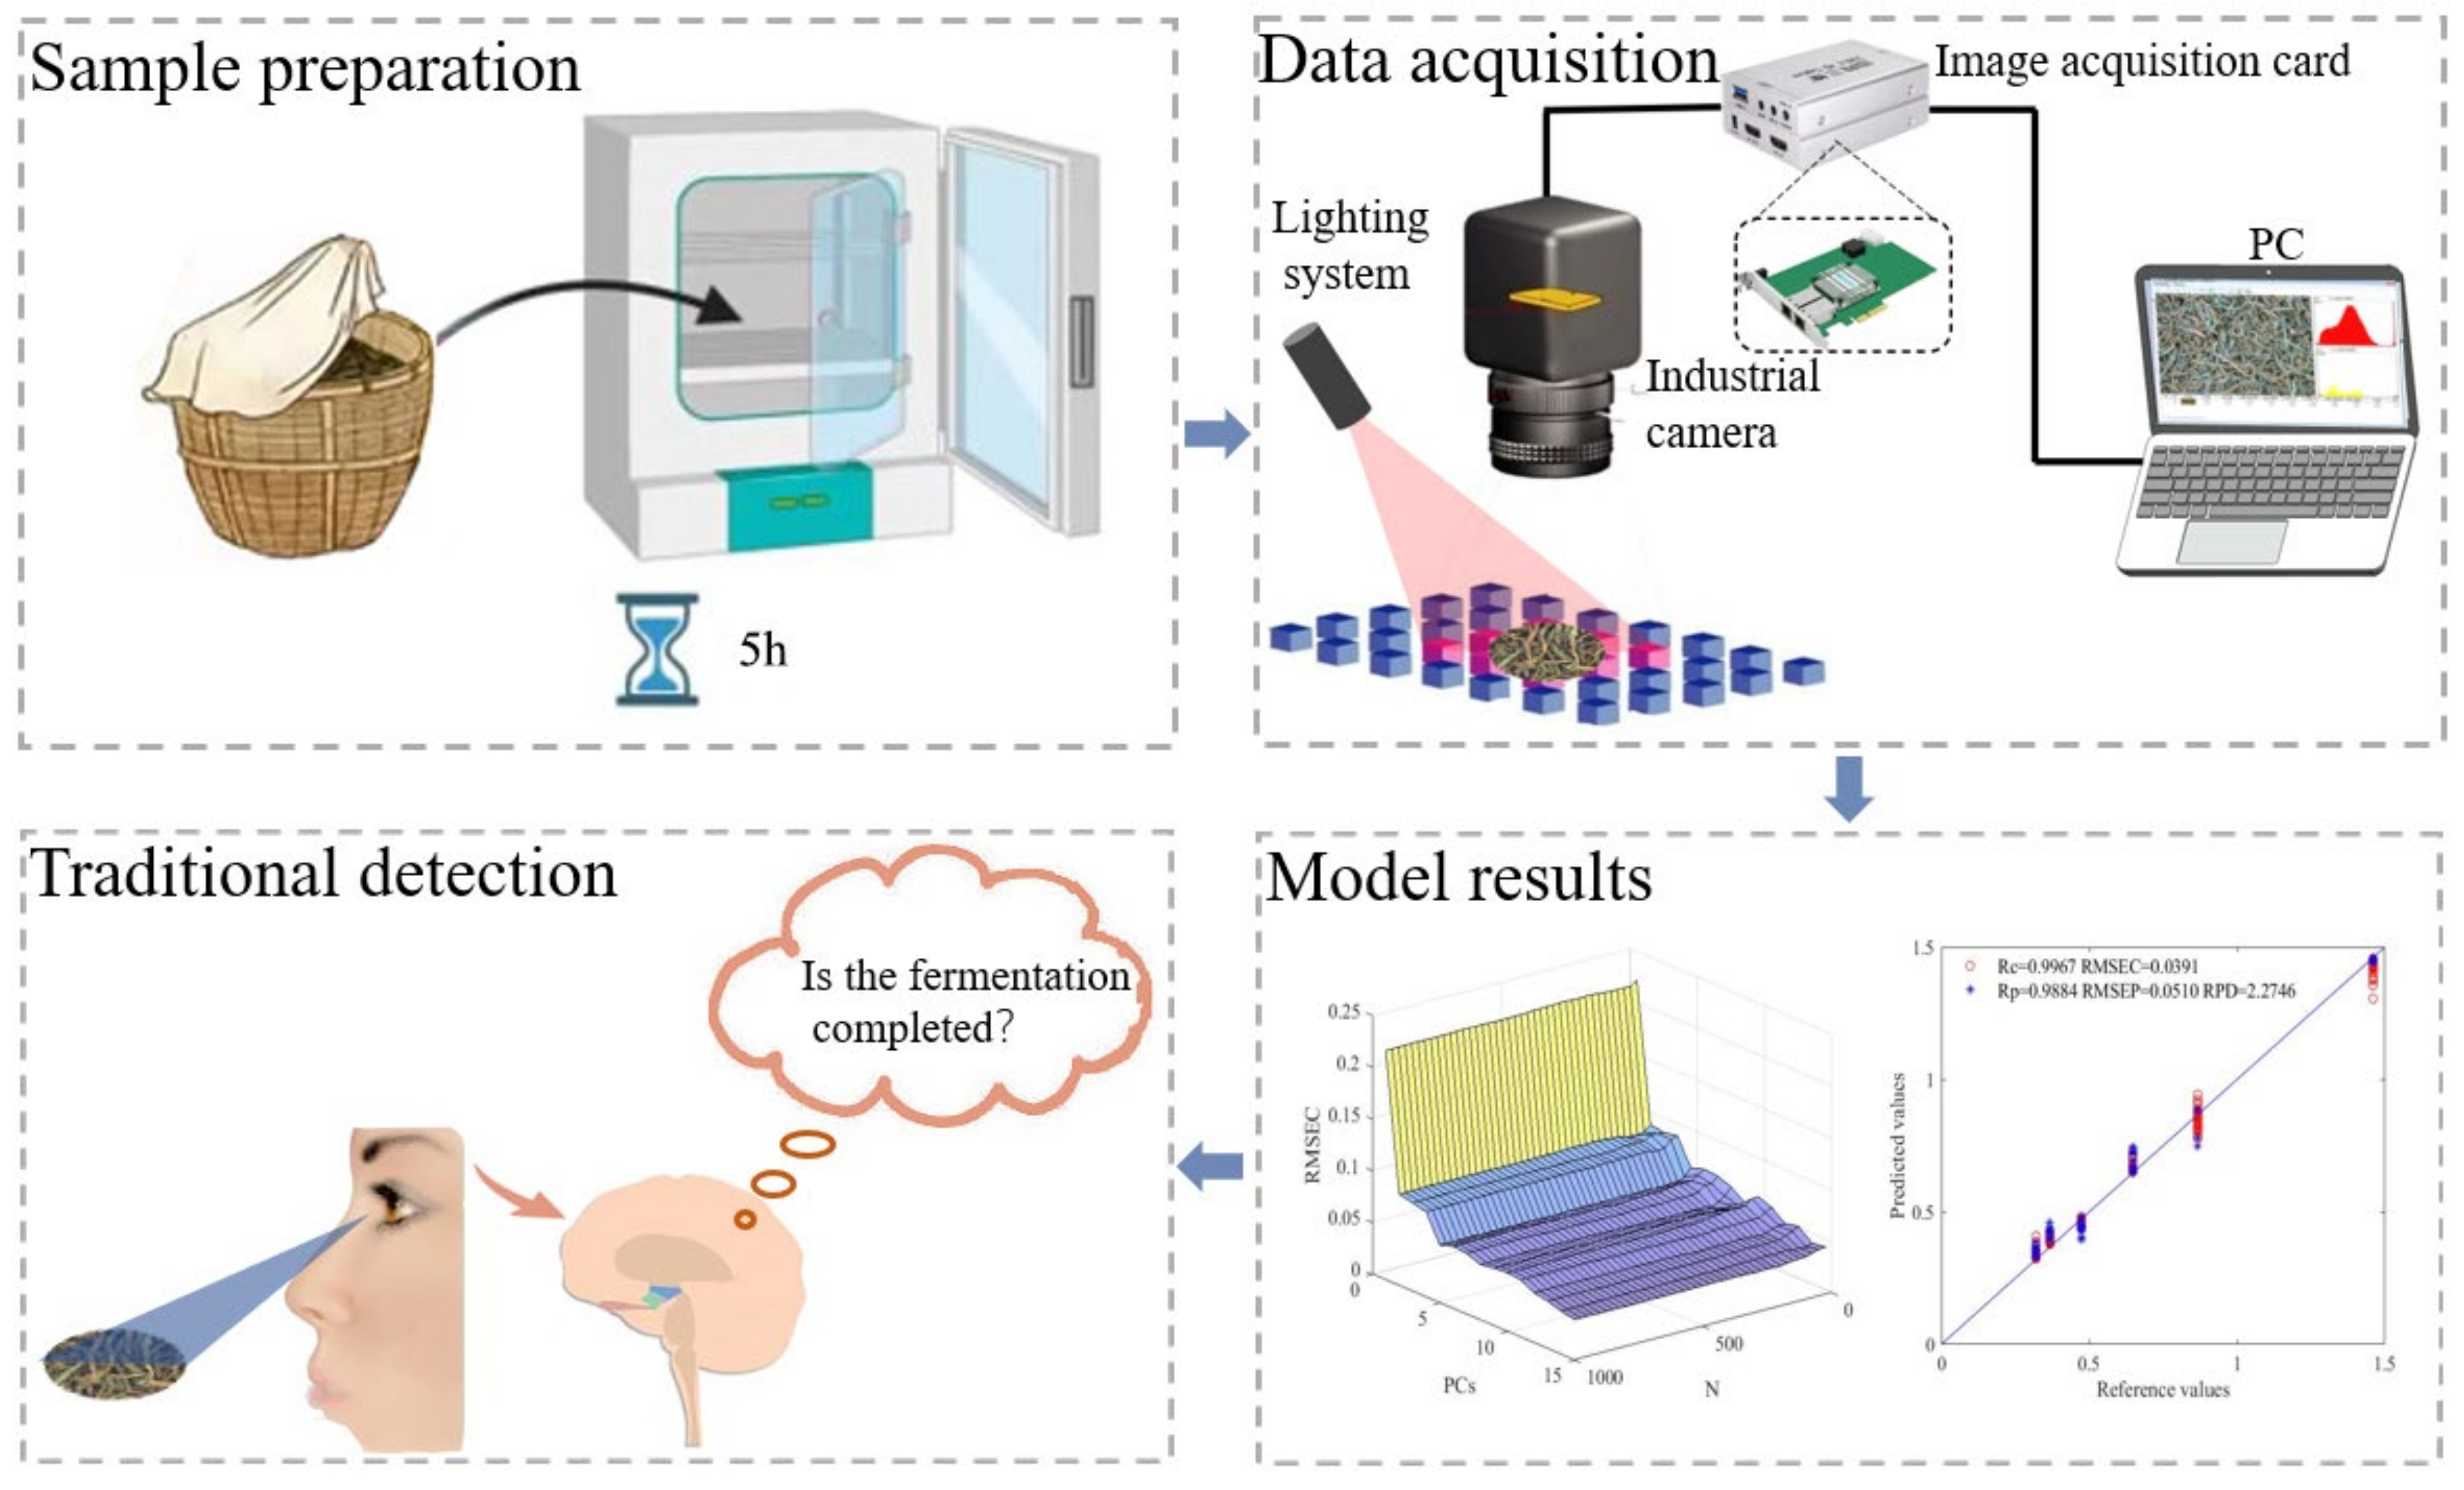
2.3. Machine Vision System Construction and Data Acquisition

The machine vision system constructed in the experiment mainly consists of a dome light source, box, industrial lens, image acquisition card, and GUI software processing system. The industrial camera model is an FI-S200C-G, the lens is a 4 nm optical aberration lens with excellent optical performance and high edge brightness, and the image sensor is a 1/2.8-inch high-quality complementary metal-oxide-semiconductor (CMOS) sensor. The exposure time was 0.09 ms and the resolution was 1080 × 1080. To more clearly compare the color changes in black tea with different fermentation times, the system light source used a DOME pure white dome light source with a better shadow-free effect and uniformity. The brightness of the light source was 100 lx, and the format of the sample photos was bitmap (bmp) [10]. When the system was built, the camera lens was fixed on the top of the dark box to ensure that the distance from the lens to the sample was constant and that the angle did not change. Before the experimental data acquisition, the dome light source was turned on for 30 min for preheating, and then the color card was placed on the bottom of the camera, combined with the built-in photographic cube to ensure that the camera photographed all the color blocks. After clicking “save calibration”, images of black tea fermentation samples were collected, 20 pieces of image data were acquired for each fermentation time sample, and a total of 120 pieces of image data were acquired. Subsequently, data were extracted using a self-developed software. The image data acquisition process is shown in Figure 1.

2.4. Data Processing

When using a machine vision system to collect color information of black tea fermentation samples, it is affected by the uneven surface of the samples in the quartz dish and the existence of gaps, which lead to blurred contours of the samples to be measured and poor image quality, and the accuracy of the constructed model will be seriously affected [11]. To improve the model prediction accuracy and reduce the influence of noise and environmental factors on the image information, the original spectra were preprocessed in this study using zero mean normalization (ZScore), multiplicative scatter correction (MSC), smoothing, and centering. Afterwards [12,13,14,15], principal component analysis (PCA) was used to further downscale the optimized data, and finally (Xiao et al., 2023), k-nearest neighbor (KNN) and random forest (RF) models were established to discriminate the degree of black tea fermentation. According to the results of the model discrimination, the best discriminative model for the degree of black tea fermentation was selected. To accurately control the fermentation quality of black tea and deeply explore the texture related to black tea fermentation, catechin and thearubigin substances closely related to the quality of black tea fermentation were selected, and their content changes in the process of black tea fermentation were analyzed. Partial least squares regression (PLS) and RF quantitative prediction models of catechins and thearubigins were successfully established by combining machine vision technologies [16,17].

2.5. The Model Evaluation Indicators

The Kennard–Stone (K-S) algorithm was selected for the division of training and prediction set data in the sample dataset, and the 120 sample sets were divided into 96 training sets and 24 prediction sets according to a ratio of 4:1 [18]. The linear KNN model and the nonlinear RF model were used to discriminate the black tea samples with different degrees of fermentation. To accurately control the process of black tea fermentation quality, the PLS and RF models were used to quantitatively predict the catechin and thearubigin contents, which are closely related to black tea fermentation quality. The merits and demerits of the discriminative models were directly judged by the discriminative rate, and the evaluation indexes of the quantitative prediction models mainly included the correlation coefficient of the prediction set (Rp), the root mean square error of cross validation (RMSECV), the root mean square error of prediction (RMSEP), and the relative percent deviation (RPD). Typically, the closer the Rp value is to 1, the higher the model prediction accuracy. RPD values between 1.4 and 2 indicate that the model can be applied in practice, and when the RPD value is greater than 2, it indicates that the model has better robustness and prediction accuracy [19].

3. Results and Discussion

3.1. Results of Physicochemical and Correlation Analysis of Samples

Figure 2a shows a flowchart of black tea processing. Fresh tea leaves enter the fermentation process after picking, withering, and kneading processes. According to the sensory experience of professional tea makers, the samples with different black tea fermentation times are classified into three kinds: light fermentation, moderate fermentation, and overfermentation [20]. The image information of the samples was collected every hour, and at the same time, the samples were processed as frozen samples, which were used to analyze the subsequent physicochemical compositions. Figure 2b,c show the process of variation of the content of the thearubigin and catechin fractions in the samples with the fermentation time of black tea, which generally showed a gradual decrease in the change, mainly because during the fermentation process, polyphenols dominated by catechins underwent enzymatic oxidation to form theaflavin and thearubigin, which were then further polymerized into theabrownine as the fermentation process proceeded [21]. Figure 2d shows the correlation analysis graph between the content of catechin fractions and thearubigin content, and the results showed that the catechin content and thearubigin fractions showed a significant positive correlation with the fermentation time (p < 0.05). The content of catechin and theobromine in fermented leaves has a strong correlation with the fermentation time of black tea, and the degree of fermentation is determined by the fermentation time. During the actual fermentation process of black tea, by accurately predicting the content of catechin and theobromine in the fermented leaves, it is possible to predict the time of fermentation of black tea, and then determine the degree of fermentation of black tea [22].

3.2. Response of Color Variables in the Black Tea Fermentation Process

The light source of the homemade simple machine vision system adopts the dome light source design and is connected to the digital dimmable light source controller, the corresponding USB serial port from the VGA interface of the digital dimmable light source controller is connected to the PC, and the industrial camera lens is connected to the PC through the Ethernet SC fiber-optic Gigabit interface, which has a shorter image acquisition time and can realize the real-time acquisition of the production-oriented needs. The power switch is connected to the camera and the digital adjustable light source controller, which can control the dome light source and the industrial camera through the power switch, and the inside of the main devices and detection process are shown in Figure 3a. Figure 3c shows the GUI human–computer interaction interface established using MATLAB, which is mainly divided into the setting area, image acquisition area, model selection area, and result display area. After the acquisition, the image is stored in BMP format, and when the image information is extracted, a neighborhood of 800 pixels × 800 pixels is intercepted as the target area with the center as the origin to extract its color and texture features. The color features include 12 variables, including R, G, B, H, S, V, L *, a *, b *, 2G-R-B, R/G, hab *, and the texture features include a total of six variables, m, δ, r, μ, U, and e [23].
In Figure 3b, row A is the original picture of the black tea fermentation process collected by the machine vision system. To study the change rule of tea color in the process of black tea fermentation, the average color information of the original photo was extracted, as shown in row B of Figure 3b. Due to the darker color of the fermented leaf as a whole, the comparison of the average color information was not obvious, so the average color information was enhanced, and the result is shown in row C of Figure 3b. The enhanced average color information gradually changed from yellow-red to purple-red, which is consistent with the mechanism of black tea fermentation [24]. In actual production, due to the different tea varieties and tea masters, the difference in tea color between different black tea fermentation degrees is not obvious. To better distinguish the color information of different degrees of fermentation, the RGB image was converted into an HSV image, and then the average color information was extracted. The results are shown in the images of rows D and E in Figure 3b. As can be seen from the color information in rows D and E in Figure 3b, the HSV image is more intuitive than the RGB image to express the hue, vividness, and lightness and darkness of the colors, and it is able to clearly differentiate between the images of samples of black tea with different degrees of fermentation [25].

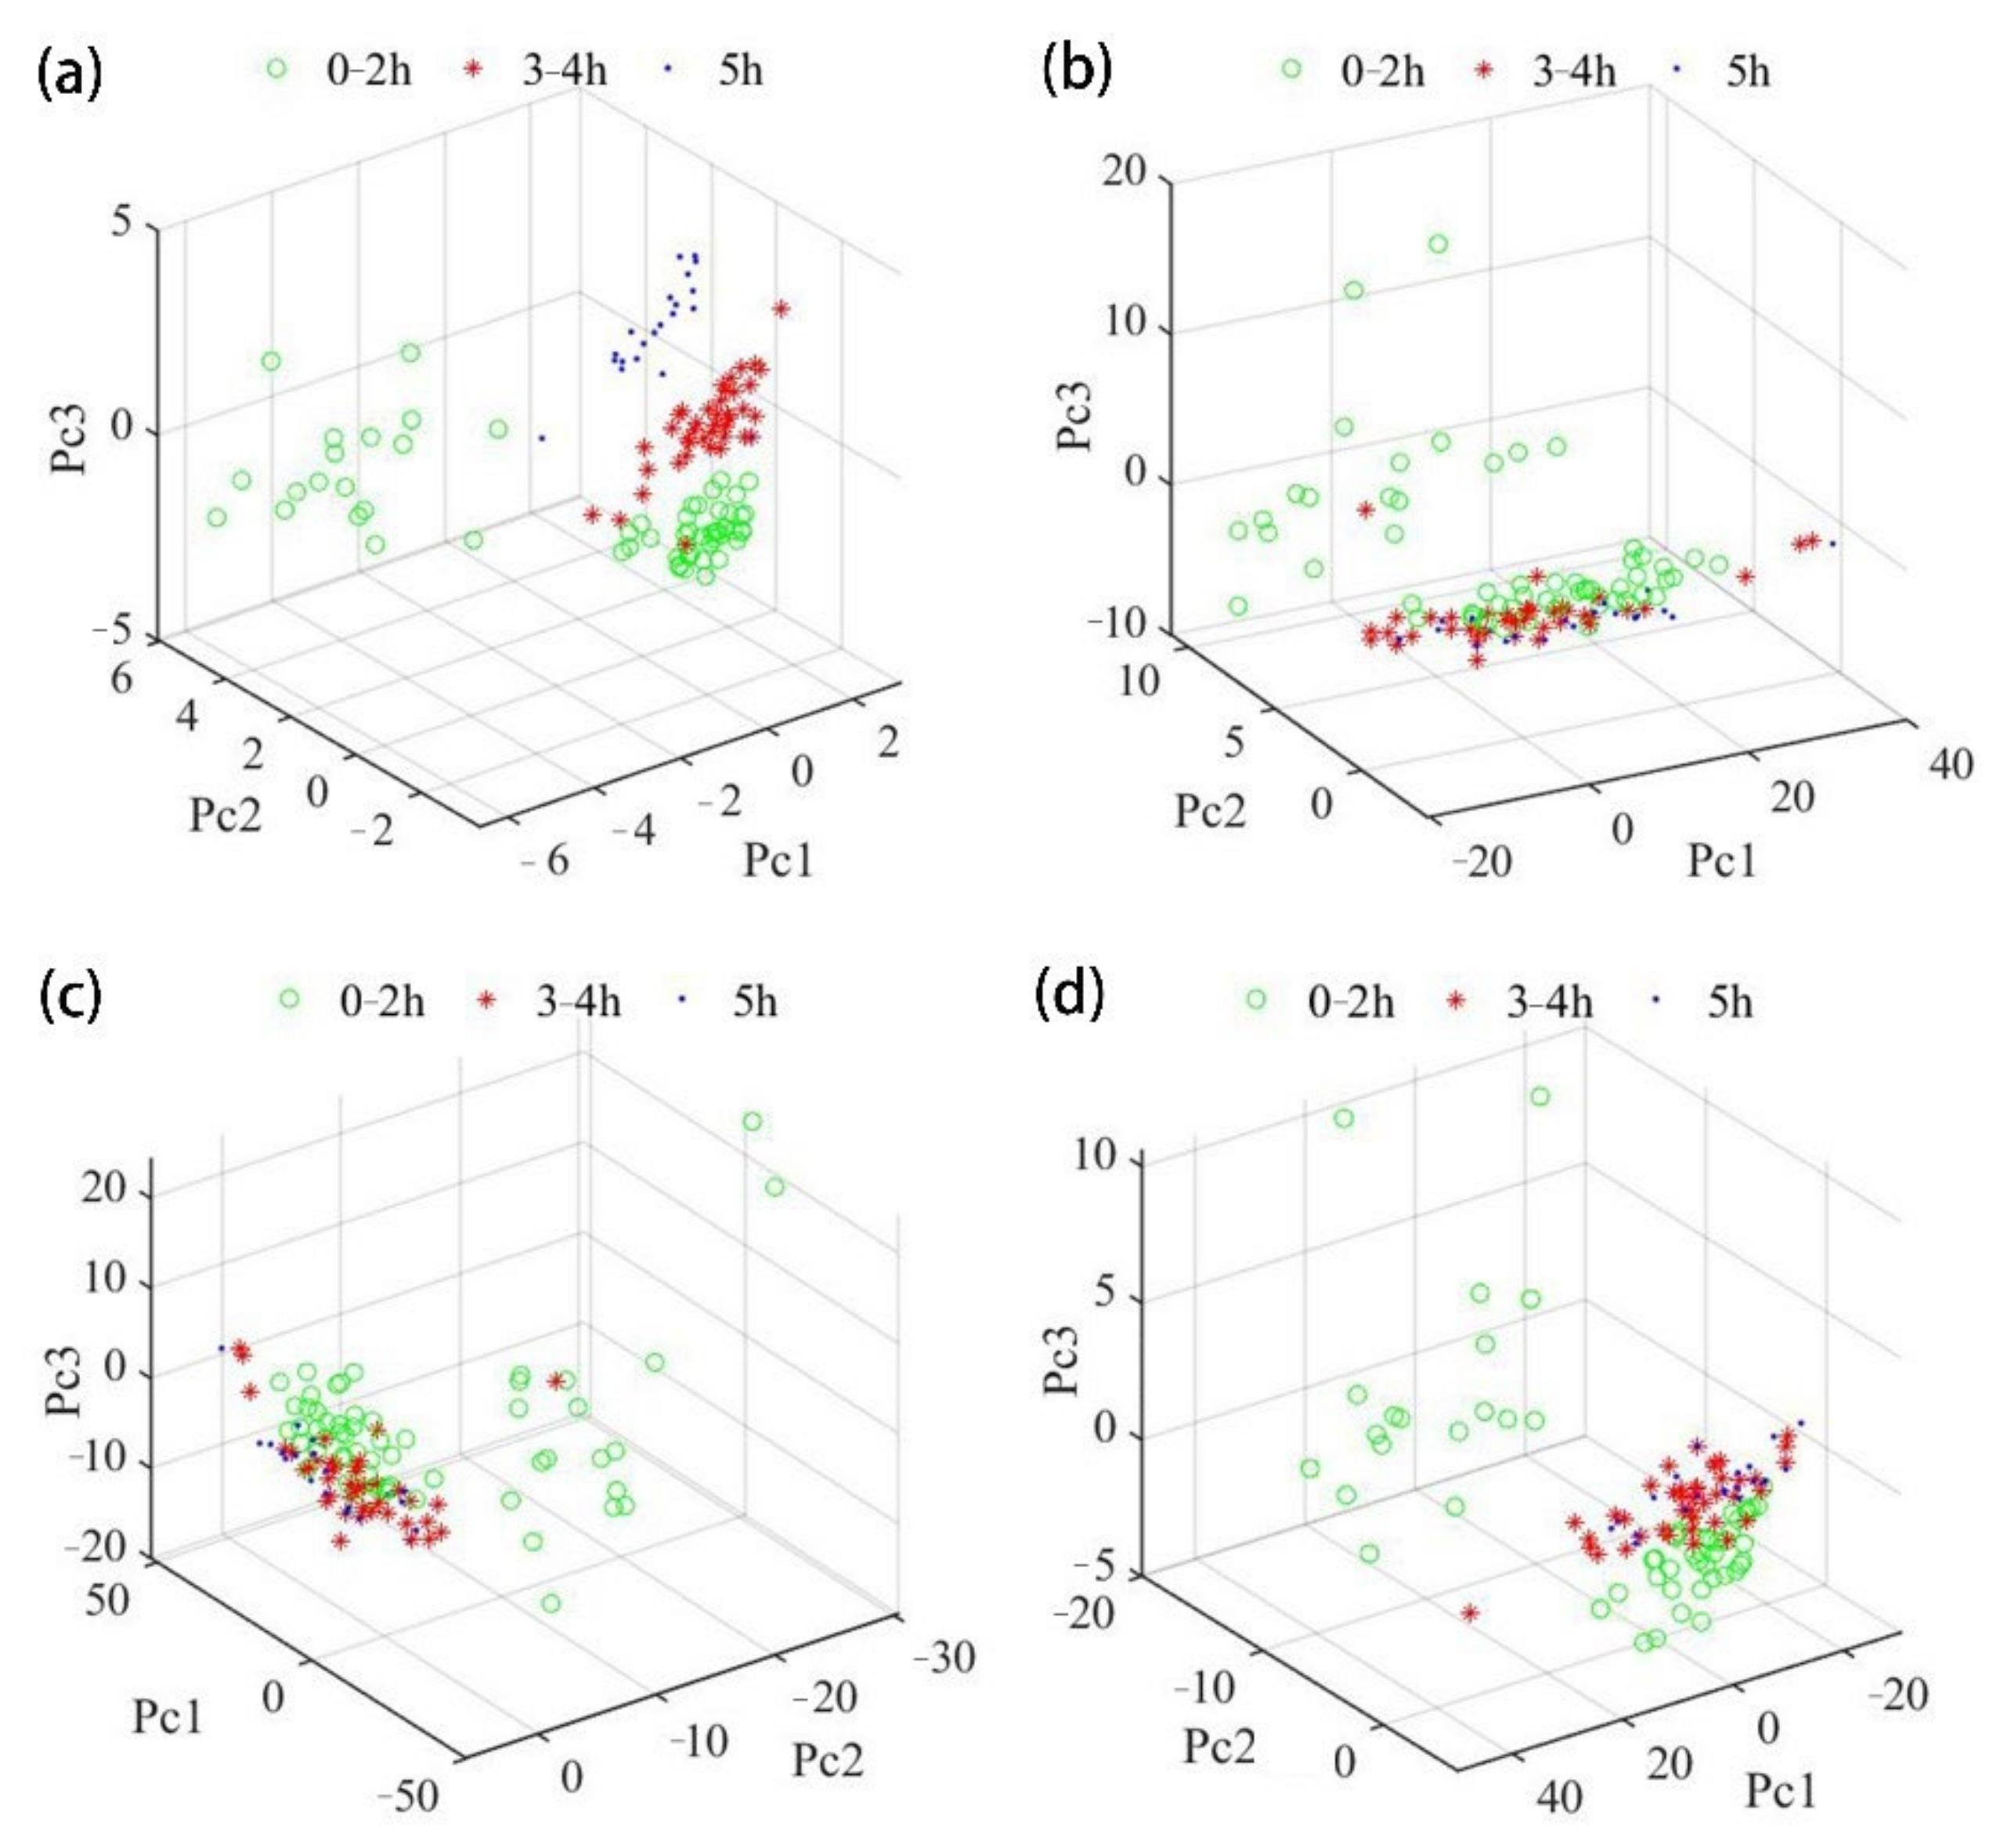
3.3. Data Preprocessing Results and PCA

After the color and texture feature information of the images of different black tea fermentation moments was extracted, the modeling and analysis affected the accuracy and stability of the model due to the different dimensions of the variable information. Therefore, before modeling, different algorithms were used to preprocess the color and texture information of the images to reduce data dimensions and redundant information.
Subsequently, the preprocessed data were subjected to PCA. Figure 4a shows the 3D load map obtained after preprocessing using the Zscore method with PC1 contributing 83.51% and PC2 and PC3 contributing 9.25% and 4.01%, respectively. Figure 4b shows the 3D load map obtained after preprocessing using the smoothing method with a PC1 contribution of 90.12% and PC2 and PC3 contributions of 4.78% and 2.56%, respectively. Figure 4c is the 3D load map obtained using the center method after pretreatment; its PC1 contribution is 89.56%, and PC2 and PC3 are 5.59% and 3.88%, respectively. Figure 4d is the 3D load map obtained using the MSC method after pretreatment; its PC1 contribution is 90.86%, and PC2 and PC3 are 4.61% and 4.02%, respectively [26]. It can be seen from the results that the sample areas of different black tea fermentation times pretreated using the Zscore method are distributed dispersedly with fewer overlapping areas, which is better than other pretreatment algorithms. However, there is a crossover between some of the sample regions, which requires further modeling discrimination for distinguishing samples with different black tea fermentation times [27].

3.4. KNN and RF Model Discrimination Results

The KNN algorithm is based on the fact that the majority of the K neighboring samples in the sample space belong to a category, following the principle of the majority rule. This algorithm is suitable for situations where there are many overlapping areas of samples in the same region [28]. In building the KNN model, the results of dimensionality reduction in image information (color and texture) by different principal components and the K parameter are used as inputs, and the different fermentation degrees of black tea are used as outputs to build a discriminative model. The RF algorithm is a type of integrated algorithm that includes multiple decision trees for discriminant analysis, and the final result is determined by the mode of the decision tree. It has the characteristics of high accuracy, effective processing of high-dimensional data, and good prediction of default values. Its application prospects are broad [20]. In building the RF model, the results of dimensionality reduction in image information (color and texture) by different principal components and the decision tree (1–1000) are used as inputs, and different degrees of fermentation of black tea are used as outputs to build the discriminant model [29].
Figure 5a,c show the optimization graph and discrimination results of the KNN model under different numbers of principal components, respectively. It can be seen from the graph that when the PCs are eight and the k parameters are 5–8, the KNN model has the best discrimination effect, with recognition accuracies of 96.90% and 91.65% for the training and prediction sets, respectively, as shown by the red square in Figure 5c. Figure 5b,d show the optimization search and discrimination results of the RF model with different numbers of principal components, respectively. From the graph it can be seen that when the number of PCs is 2 and the decision tree is between 50 and 150 (PCs are 4 and the decision tree is between 350 and 400, or PCs are 7–10 and the decision tree is between 550 and 100), the recognition accuracies of the training set and the prediction set are 100 percent and 100 percent, respectively. The RF model has the best performance, with recognition accuracies of 100% for the training and prediction sets, respectively, as shown by the red square in Figure 5c. Table 1 shows the specific discrimination of black tea fermentation degree by the KNN and RF models, and it can be seen that compared with the KNN model, the recognition rate of black tea fermentation degree by the RF model was significantly improved, and the misjudged samples were concentrated in moderate and excessive fermentation. This is because during black tea fermentation the enzymatic reaction of polyphenolics gradually tends to flatten with time, which results in the model easily misjudging between moderate and excessive fermentation [22].

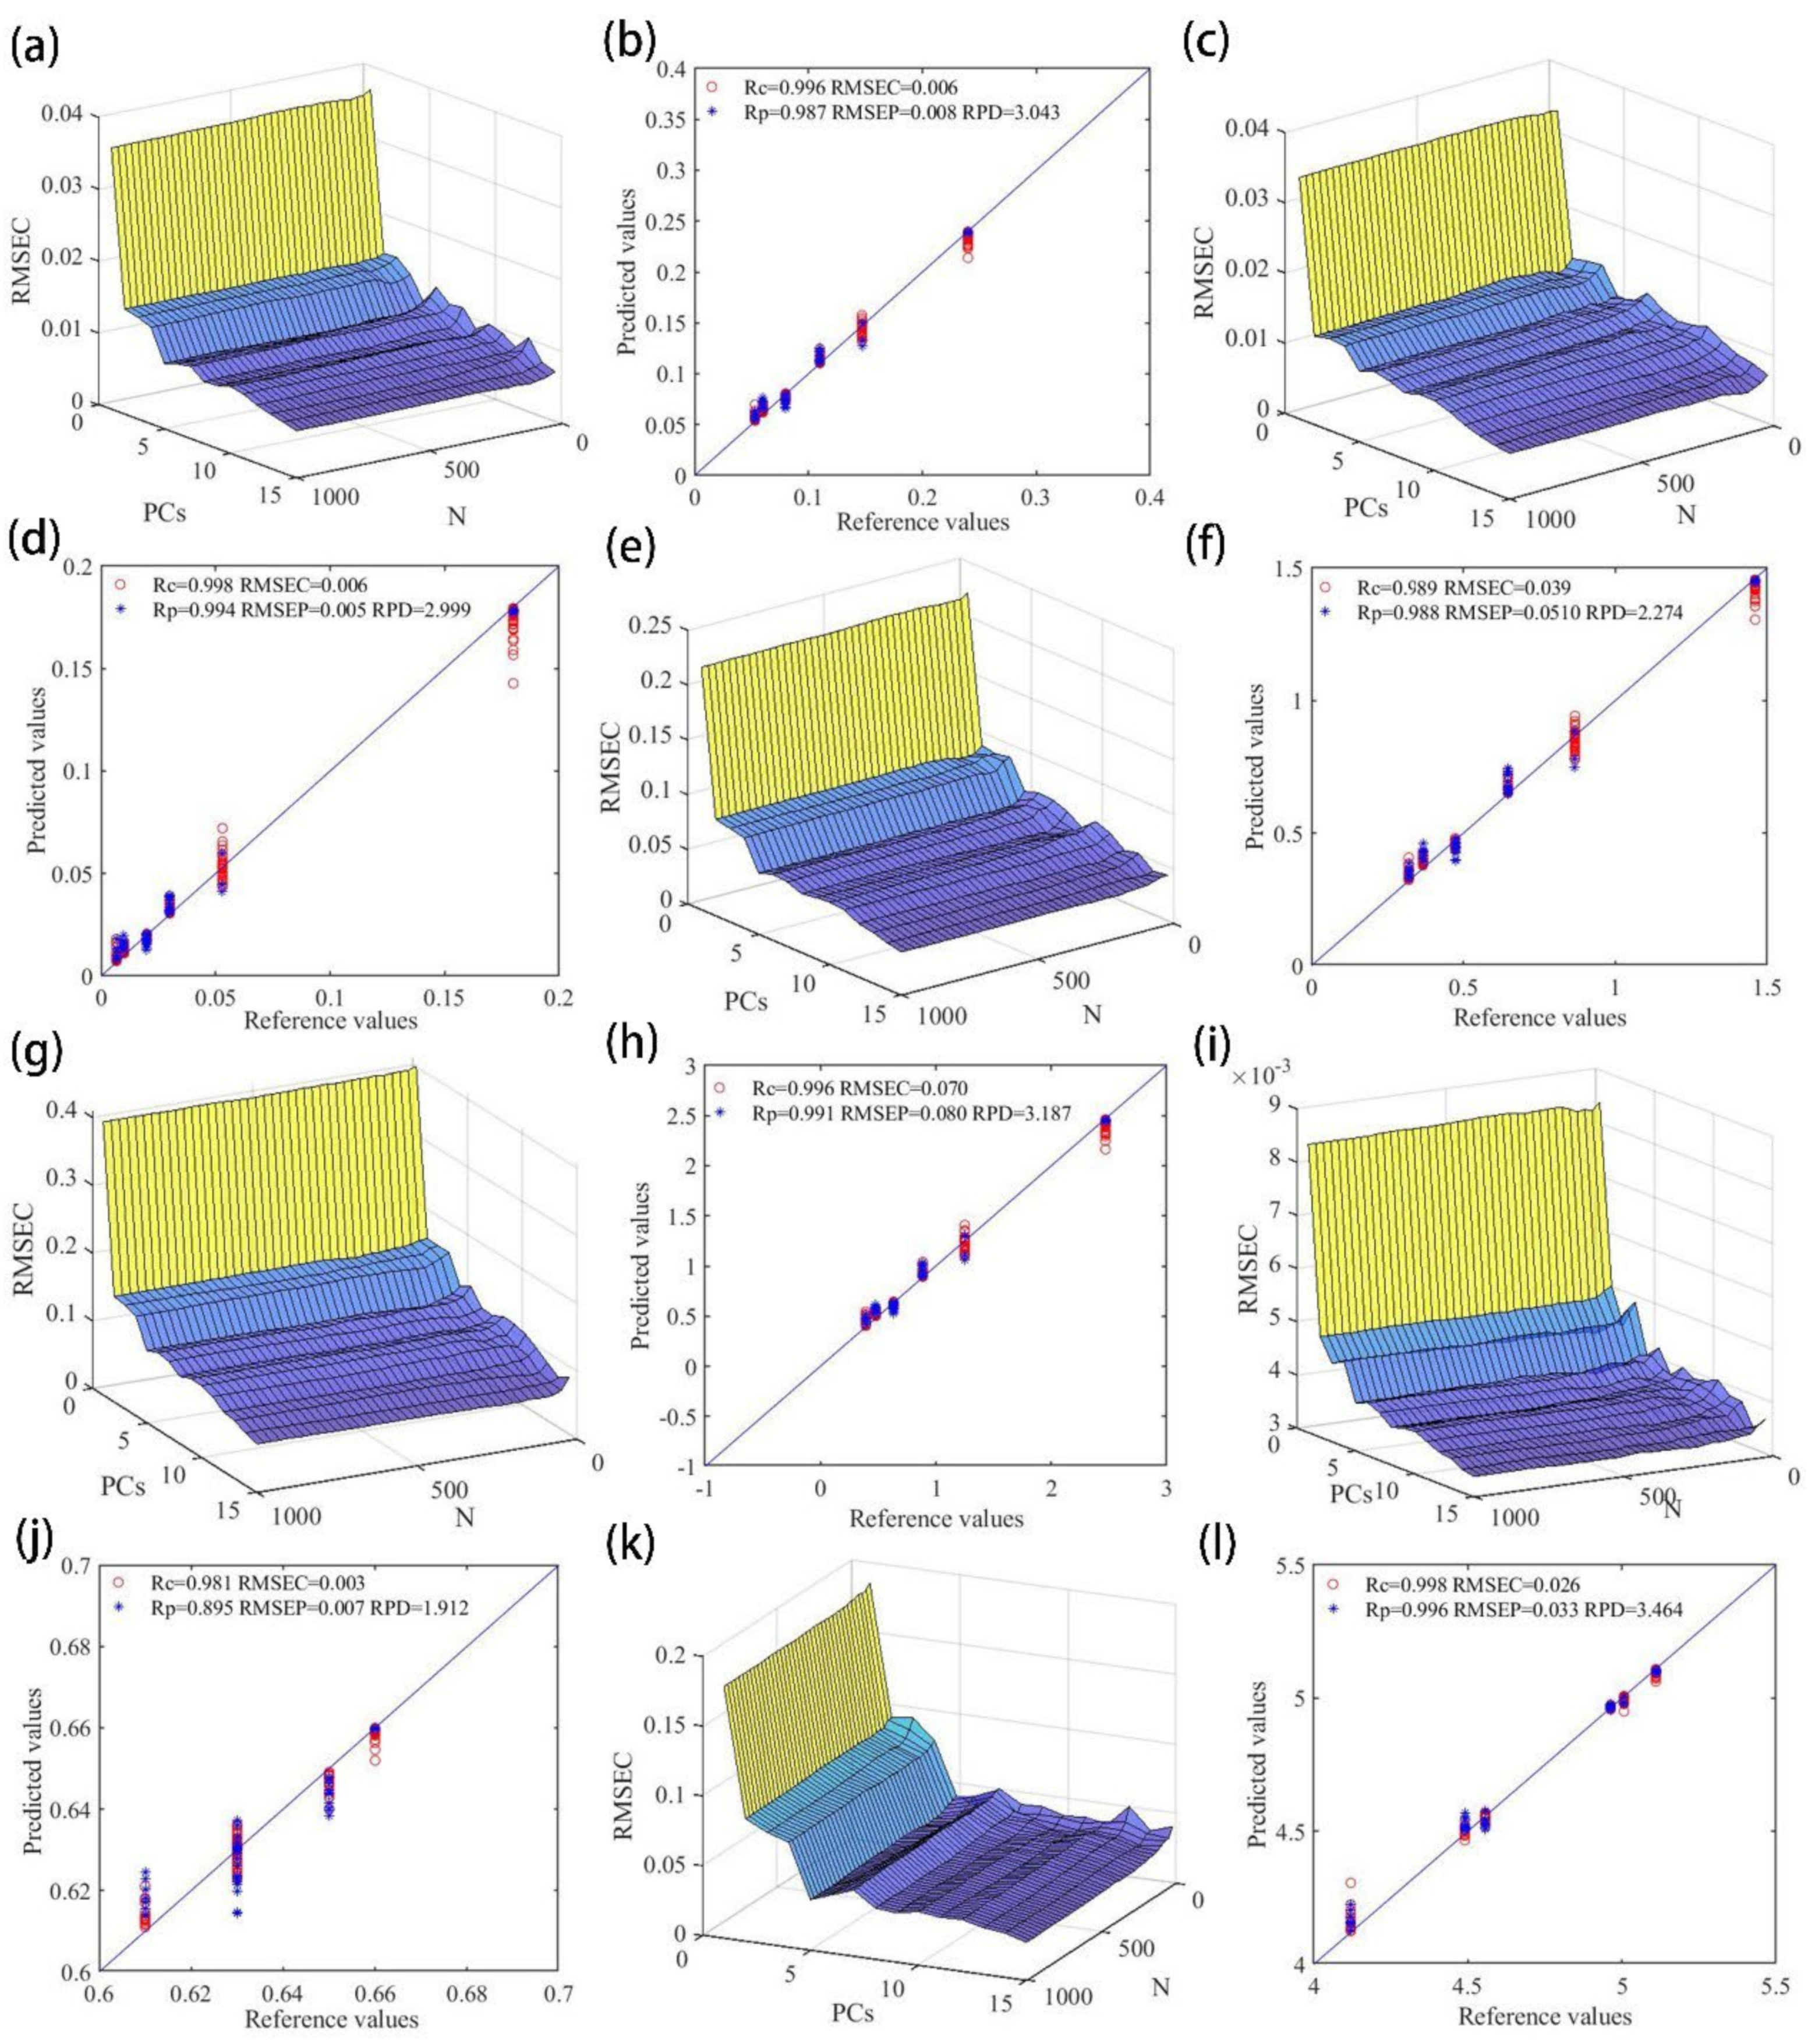
3.5. Prediction Results of the Catechin Fraction and Thearubigin Content by the PLS and RF Models

The PLS algorithm, as a linear regression analysis algorithm, can be used to deal with high-dimensional data and solve the problem of multicollinearity among independent variables by minimizing the residual sum of squares to fit the data [30]. In building the PLS model, the quantitative prediction model of endomorphic components was established using the results of dimensionality reduction in the image information (color and texture) by using different principal components as input, and the catechin fraction and thearubigin content as outputs. During RF algorithm regression, proof by exhaustion is used to select each segmentation variable and segmentation point and to select the best variable and segmentation point. For the input samples, to determine whether the root node of the decision tree is a leaf node, if it is the case, then return to the average value of the sample target variable in the current leaf; if not, compare the segmentation variable and segmentation value of this node with the value of the corresponding sample variable. If the value of the sample variable is not larger than the cutoff value of this node, the visit to the left child of this node is continued; if the value of the sample variable is larger than the cutoff value of this node, the visit to the right child of this node is performed, and so on, until the leaf node is visited, and finally, the average value of the sample target variable of the leaf node is returned [31]. In building the RF model, a quantitative prediction model of endomorphic components was established using the results of dimensionality reduction in image information (color and texture) by using different principal components and 20 N-values (50–1000, with a step size of 50) as inputs, and catechin fractions and thearubigin content as outputs [32].
Figure 6a shows the optimization search results of the C model in the catechin fraction. When the number of PCs is four and N is 980, the RMSEC reaches the minimum value of 0.009. At this time, the model has the best performance, the prediction accuracy Rp is 0.987, and the RPD is 3.043. The scatter plots of the predicted and true values are shown in Figure 6b. Figure 6c shows the optimization search results of the EC model in the catechin fraction. When the number of PCs is 15 and N is 30, the RMSEC reaches the minimum value of 0.006; at this time, the model has the best performance, the prediction accuracy Rp is 0.994, and the RPD is 2.999, and the scatter plots of the predicted and true values are shown in Figure 6d. Figure 6e shows the optimization search results of the ECG model in catechin fractions. When the PCs are five and N is 800, the RMSEC reaches the minimum value of 0.004. At this time, the model has the best performance, the prediction accuracy Rp is 0.988, and the RPD is 2.274, and the scatter plots of the predicted values and the true values are shown in Figure 6f. Figure 6g shows the optimization search results of the EGCG model in catechin fractions. The RMSEC reaches a minimum value of 0.093 when the PCs are 15 and N is 275. At this time, the model has the best performance, the prediction accuracy Rp is 0.991, and the RPD is 3.187, and the scatter plots of the predicted and the true values are shown in Figure 6h. Figure 6i shows the optimization search results of the EGC model in catechin fractions. When the PCs are 14 and N is 25, the RMSEC reaches the minimum value of 0.003. At this time, the model has the best performance, the prediction accuracy Rp is 0.895, RPD is 1.912, and the scatter plots of the predicted values and the true values are shown in Figure 6j. Figure 6k shows the optimization search results of the model of thearubigin. When the PC is five and N is 1000, the RMSEC reaches the minimum value of 0.038. At this time, the model has the best performance, the prediction accuracy Rp is 0.996, and the RPD is 3.464, and the scatter plots of the predicted values and the true values are shown in Figure 6l. Table 2 shows the prediction of the KNN and RF models on the content of key endoplasmic components of black tea fermentation. It can be seen that the nonlinear RF model has a better prediction performance compared to the linear PLS model, this is because the transformation and decomposition of the main endoplasmic components in the fermentation of black tea is more complex, showing a nonlinear law of change as time progresses. The PLS model has a weaker computational ability for the degree of complex change, and its prediction performance is weaker than that of the nonlinear RF model [33].

4. Conclusions

In this paper, to address the shortcomings of traditional sensory evaluation of black tea fermentation quality, such as strong subjectivity, we built a set of simple machine vision systems to obtain the image information of black tea fermentation leaves in real time. Due to the different dimensionality of the color and texture features, which affect the accuracy of the model after the modeling and analysis, the Zscore algorithm was selected for feature information preprocessing. To reduce redundant information, PCA was used to reduce the dimension of the pretreated data. Finally, the discriminative model for the degree of black tea fermentation and the prediction model for catechin components and thearubigin content were established. The results showed that the discrimination accuracy of the RF model for the degree of black tea fermentation reached 100% and the prediction accuracy for the content of catechin components and thearubigin reached more than 0.895, indicating that the model has better performance. This equipment has the characteristics of low cost, fast detection, simple operation, and convenience. It can make up for the shortcomings of traditional tea makers in sensory tea making, reduce the cost of manual tea making, and achieve precise control of black tea quality. It can be applied in both mechanized black tea production lines and small tea making workshops. Although the system achieves online monitoring in black tea production, based on the future development direction of intelligent detection technology and the actual needs of users, researchers should develop miniaturized, convenient, and economical non-destructive testing equipment coupled with smartphones to achieve intelligent tea processing.

Author Contributions

The people involved in the paper work are listed as authors, each author’s contribution to the paper is explained in detail in the credit author’s contribution statement, and each author bears public responsibility for the content of the material. In addition, all authors can prove that the manuscript is an independent original work without plagiarism. This material appeared before the fermentation. The content of this article has not been published in various languages at home and abroad. After this article is published, it will no longer be submitted to other journals in any language. C.Y. (Chongshan Yang): Data curation, Writing, Software; T.A.: Data Validation; D.Q.: Some Experiments; C.Y. (Changbo Yuan): Investigation; C.D.: Conceptualization, Methodology, Funding. All authors have read and agreed to the published version of the manuscript.

Funding

This study was supported by the Research start-up funds-TRI-SAAS (CXGC2023F18, CXGC2023G33), the Key R&D Projects in Zhejiang Province (2022C02044, 2023C02043), and the Key Projects of Science and Technology Cooperation in Jiangxi Province (20212BDH80025). APC is funded by the MDPI Editorial Board.

Institutional Review Board Statement

Not applicable.

Informed Consent Statement

Not applicable.

Data Availability Statement

Not applicable.

Conflicts of Interest

The authors declare no conflict of interest.

References

  1. Yang, C.-S.; Dong, C.-W.; Jiang, Y.-W.; An, T.; Zhao, Y. A Method for Judging the Fermentation Quality of Congou Based on Hyperspectral. Spectrosc. Spectr. Anal. 2021, 41, 1320–1328. [Google Scholar]
  2. Dong, C.; Yang, C.; Liu, Z.; Zhang, R.; Yan, P.; An, T.; Li, Y. Nondestructive Testing and Visualization of Catechin Content in Black Tea Fermentation Using Hyperspectral Imaging. Sensors 2021, 21, 8051. [Google Scholar] [CrossRef] [PubMed]
  3. Dong, C.; Ye, Y.; Yang, C.; An, T.; Jiang, Y.; Ye, Y.; Yang, Y. Rapid detection of catechins during black tea fermentation based on electrical properties and chemometrics. Food Biosci. 2021, 40, 100855. [Google Scholar] [CrossRef]
  4. An, T.; Li, Y.; Tian, X.; Fan, S.; Duan, D.; Zhao, C.; Dong, C. Evaluation of aroma quality using multidimensional olfactory information during black tea fermentation. Sens. Actuators B-Chem. 2022, 371, 132518. [Google Scholar] [CrossRef]
  5. Jia, H.; Yuan, W.; Ren, Z.; Ning, J.; Xu, Y.-Q.; Wang, Y.; Deng, W.-W. Cost-effective and sensitive indicator-displacement array (IDA) assay for quality monitoring of black tea fermentation. Food Chem. 2023, 403, 134340. [Google Scholar] [CrossRef] [PubMed]
  6. Luo, X.; Gouda, M.; Perumal, A.B.; Huang, Z.; Lin, L.; Tang, Y.; Dong, C. Using surface-enhanced Raman spectroscopy combined with chemometrics for black tea quality assessment during its fermentation process. Sens. Actuators B-Chem. 2022, 373, 132680. [Google Scholar] [CrossRef]
  7. Yang, C.; Zhao, Y.; An, T.; Liu, Z.; Jiang, Y.; Li, Y.; Dong, C. Quantitative prediction and visualization of key physical and chemical components in black tea fermentation using hyperspectral imaging. LWT-Food Sci. Technol. 2021, 141, 110975. [Google Scholar] [CrossRef]
  8. Wang, Z.; Ahmad, W.; Zhu, A.; Geng, W.; Kang, W.; Ouyang, Q.; Chen, Q. Identification of volatile compounds and metabolic pathway during ultrasound-assisted kombucha fermentation by HS-SPME-GC/MS combined with metabolomic analysis. Ultrason. Sonochemistry 2023, 94, 106339. [Google Scholar] [CrossRef]
  9. Wang, Y.; Ren, Z.; Chen, Y.; Lu, C.; Deng, W.W.; Zhang, Z.; Ning, J. Visualizing chemical indicators: Spatial and temporal quality formation and distribution during black tea fermentation. Food Chem. 2023, 401, 134090. [Google Scholar] [CrossRef]
  10. Liu, Z.; Zhang, R.; Yang, C.; Hu, B.; Luo, X.; Li, Y.; Dong, C. Research on moisture content detection method during green tea processing based on machine vision and near-infrared spectroscopy technology. Spectrochim. Acta Part A-Mol. Biomol. Spectrosc. 2022, 271, 120921. [Google Scholar] [CrossRef]
  11. Ren, G.; Wu, R.; Yin, L.; Zhang, Z. Intelligent Evaluation of the Appearance Modality of Black Tea Based on Machine Vision and Hyperspectral Imaging. Anal. Lett. 2023, 22, 1706. [Google Scholar] [CrossRef]
  12. Huang, Z.; Sanaeifar, A.; Tian, Y.; Liu, L.; Zhang, D.; Wang, H.; Li, X. Improved generalization of spectral models associated with Vis-NIR spectroscopy for determining the moisture content of different tea leaves. J. Food Eng. 2021, 293, 110374. [Google Scholar] [CrossRef]
  13. Sanaeifar, A.; Li, X.; He, Y.; Huang, Z.; Zhan, Z. A data fusion approach on confocal Raman microspectroscopy and electronic nose for quantitative evaluation of pesticide residue in tea. Biosyst. Eng. 2021, 210, 206–222. [Google Scholar] [CrossRef]
  14. Xu, J.; Qu, F.; Shen, B.; Huang, Z.; Li, X.; Weng, H.; Wu, R. Rapid Detection of Tea Polyphenols in Fresh Tea Leaves Based on Fusion of Visible/Short-Wave and Long-Wave near Infrared Spectroscopy and Its Device Development. Appl. Sci. 2023, 13, 1739. [Google Scholar] [CrossRef]
  15. Zhao, S.; Adade, S.Y.-S.S.; Wang, Z.; Wu, J.; Jiao, T.; Li, H.; Chen, Q.X. On-line monitoring of total sugar during kombucha fermentation process by near-infrared spectroscopy: Comparison of linear and non-linear multiple calibration methods. Food Chem. 2023, 423, 136208. [Google Scholar] [CrossRef]
  16. Dai, F.; Shi, J.; Yang, C.; Li, Y.; Zhao, Y.; Liu, Z.; Dong, C. Detection of anthocyanin content in fresh Zijuan tea leaves based on hyperspectral imaging. Food Control. 2023, 152, 109839. [Google Scholar] [CrossRef]
  17. Yin, H.; Ma, F.; Wang, D.; He, X.; Yin, Y.; Song, C.; Zhao, L. Establishing a Prediction Model for Tea Leaf Moisture Content Using the Free-Space Method’s Measured Scattering Coefficient. Agriculture 2023, 13, 1136. [Google Scholar] [CrossRef]
  18. Geng, D.; Chen, X.; Lu, D.; Chen, B. Discrimination of different edible vegetable oils based on GC-IMS and SIMCA. Cyta-J. Food 2023, 21, 49–56. [Google Scholar] [CrossRef]
  19. Wu, J.; Zareef, M.; Chen, Q.; Ouyang, Q. Application of visible-near infrared spectroscopy in tandem with multivariate analysis for the rapid evaluation of matcha physicochemical indicators. Food Chem. 2023, 421, 136185. [Google Scholar] [CrossRef]
  20. Chen, L.; Wang, H.; Ye, Y.; Wang, Y.; Xu, P. Structural insight into polyphenol oxidation during black tea fermentation. Food Chem.-X 2023, 17, 100615. [Google Scholar] [CrossRef]
  21. Liu, C.; Lin, H.; Wang, K.; Zhang, Z.; Huang, J.; Liu, Z. Study on the Trend in Microbial Changes during the Fermentation of Black Tea and Its Effect on the Quality. Foods 2023, 12, 1944. [Google Scholar] [CrossRef] [PubMed]
  22. Li, L.; Wang, Y.; Cui, Q.; Liu, Y.; Ning, J.; Zhang, Z. Qualitative and quantitative quality evaluation of black tea fermentation through noncontact chemical imaging. J. Food Compos. Anal. 2022, 106, 104300. [Google Scholar] [CrossRef]
  23. Liang, G.; Dong, C.; Hu, B.; Zhu, H.; Yuan, H.; Jiang, Y.; Hao, G. Prediction of Moisture Content for Congou Black Tea Withering Leaves Using Image Features and Nonlinear Method. Sci. Rep. 2018, 8, 7854. [Google Scholar] [CrossRef]
  24. Bhargava, A.; Bansal, A.; Goyal, V.; Shukla, A. Machine learning & computer vision-based optimum black tea fermentation detection. Multimed. Tools Appl. 2023, 15453. [Google Scholar] [CrossRef]
  25. Flores-Vidal, P.; Gomez, D.; Castro, J.; Montero, J. New Aggregation Approaches with HSV to Color Edge Detection. Int. J. Comput. Intell. Syst. 2022, 15, 78. [Google Scholar] [CrossRef]
  26. Wu, Q.; Zhou, Z.; Zhang, Y.; Huang, H.; Ou, X.; Sun, Y. Identification of Key Components Responsible for the Aromatic Quality of Jinmudan Black Tea by Means of Molecular Sensory Science. Foods 2023, 12, 1794. [Google Scholar] [CrossRef]
  27. Li, L.; Li, M.; Cui, Q.; Liu, Y.; Chen, Y.; Wang, Y.; Ning, J. Rapid monitoring of black tea fermentation quality based on a solution-phase sensor array combined with UV-visible spectroscopy. Food Chem. 2022, 377, 131974. [Google Scholar] [CrossRef]
  28. Dos Santos Freitas, M.M.; Barbosa, J.R.; dos Santos Martins, E.M.; da Silva Martins, L.H.; Farias, F.d.S.; Henriques Lourenco, L.d.F.; da Silva e Silva, N. KNN algorithm and multivariate analysis to select and classify starch films. Food Packag. Shelf Life 2022, 34, 100976. [Google Scholar] [CrossRef]
  29. Chen, J.; Liu, H.; Li, T.; Wang, Y. Edibility and species discrimination of wild bolete mushrooms using FT-NIR spectroscopy combined with DD-SIMCA and RF models. LWT-Food Sci. Technol. 2023, 180, 114701. [Google Scholar] [CrossRef]
  30. Akram, U.; Sahar, A.; Sameen, A.; Muhammad, N.; Ahmad, M.H.; Khan, M.I.; Rahman, H.U.U. Use of Fourier transform infrared spectroscopy and multi-variant analysis for detection of butter adulteration with vegetable oil. Int. J. Food Prop. 2023, 26, 167–178. [Google Scholar] [CrossRef]
  31. Putri, L.A.; Rahman, I.; Puspita, M.; Hidayat, S.N.; Dharmawan, A.B.; Rianjanu, A.; Wasisto, H.S. Rapid analysis of meat floss origin using a supervised machine learning-based electronic nose towards food authentication. NPJ Sci. Food 2023, 7, 31. [Google Scholar] [CrossRef] [PubMed]
  32. Xiao, M.; Chen, Y.; Zheng, F.; An, Q.; Xiao, M.; Wang, H.; Dai, Q. Predicting the storage time of green tea by myricetin based on surface-enhanced Raman spectroscopy. NPJ Sci. Food 2023, 7, 28. [Google Scholar] [CrossRef] [PubMed]
  33. Dong, C.; An, T.; Zhu, H.; Wang, J.; Hu, B.; Jiang, Y.; Li, J. Rapid Sensing of Key Quality Components in Black Tea Fermentation Using Electrical Characteristics Coupled to Variables Selection Algorithms. Sci. Rep. 2020, 10, 1598. [Google Scholar] [CrossRef] [PubMed]
Figure 1. Flowchart of image data collection.
Fermentation 09 00814 g001
Figure 2. (a) Black tea processing flow−chart. (b) Changes in the content of thearubigin during fermentation of black tea. (c) Changes in catechin content during fermentation of black tea. (d) Correlation of catechin content and thearubigin with fermentation time of black tea.
Fermentation 09 00814 g002
Figure 3. (a) An internal device diagram of the machine vision system. (b) Black tea fermentation image data collected by the machine vision system. (c) The human–computer interface for machine vision systems.
Fermentation 09 00814 g003
Figure 4. (ad) are the three-dimensional loading plots of principal components after preprocessing with Zscore, smooth, center, and MSC algorithms, respectively.
Fermentation 09 00814 g004
Figure 5. (a,c) are the optimization graph and discrimination results of the KNN model; (b,d) are the optimization graph and discrimination results of the RF model.
Fermentation 09 00814 g005
Figure 6. (a,b) show the scatter plots of model optimization and prediction of C content by the RF model; (c,d) show the scatter plots of model optimization and prediction of EC content by the RF model; (e,f) show the scatter plots of model optimization and prediction of ECG content by the RF model; (g,h) show the scatter plots of model optimization and prediction of EGCG content by the RF model; (i,j) show the scatter plots of model optimization and prediction of EGC content by the RF model; (k,l) show the scatter plots of model optimization and prediction of thearubigin content by the RF model.
Fermentation 09 00814 g006
Table 1. Distinguishing results of KNN and RF models on the degree of black tea fermentation.
The Models’ Ferment Quality NCThe Discrimination Results of the Correction Set NPThe Discrimination Results of the Prediction Set
123Discrimination/%123Discrimination/%
KNN148471096.88%12111091.65%
23230118710
31600164400
RF1484800100%121200100%
23203208080
31601164004
Table 2. Prediction results of catechin components and thearubigin content in black tea fermentation using the PLS and RF models.
Quality IndexMethodsVariableNumberPCsCalibration SetPrediction Set
RcRMSECVRpRMSEPRPD
CZscore-PLS1880.8750.0470.8370.0551.475
Zscore-RF1860.9960.0060.9870.0083.043
ECZscore-PLS1870.9100.0280.8980.0321.541
Zscore-RF1870.9980.0060.9940.0052.999
ECGZscore-PLS1860.9020.1130.8850.1691.411
Zscore-RF1830.9890.0390.9880.0512.274
EGCGZscore-PLS1840.8980.3410.8520.4471.243
Zscore-RF1830.9960.0700.9910.0803.187
EGCZscore-PLS1860.9340.0520.8470.0861.227
Zscore-RF1830.9810.0030.8950.0071.912
ThearubiginZscore-PLS18100.9570.0760.9140.1342.574
Zscore-RF1890.9980.0260.9960.0333.464
Disclaimer/Publisher’s Note: The statements, opinions and data contained in all publications are solely those of the individual author(s) and contributor(s) and not of MDPI and/or the editor(s). MDPI and/or the editor(s) disclaim responsibility for any injury to people or property resulting from any ideas, methods, instructions or products referred to in the content.

