Abstract
With its quality, intensity, and photoperiod, light is a decisive abiotic factor that directly influences plant biomass and the accumulation of specialized metabolites (SMs). Photosynthetically active radiation (PAR) has significant effects on primary and secondary plant metabolism and thus influences the morphological characteristics of plants and their antioxidant systems. The aim of this study was to investigate the effects of blue, red, and a 50:50 combination of blue and red LED lighting on the SM content in broccoli, mustard, and garden cress microgreens grown in an indoor farm using the zero-acreage farming technique (ZFarming). This research aims to provide valuable insights into the optimization of light spectra to improve the nutritional quality of microgreens, with a focus on sustainable and space-saving cultivation methods. After eight days, the samples were cut in the cotyledon phenophase and analyzed in a fresh state. The microgreens grown under the blue spectrum LED lighting had the highest content of ascorbic acid (112.70 mg·100 g fw−1), total phenolics (412.39 mg GAE·100 g fw−1), and the highest antioxidant capacity (2443.62 µmol TE·L−1). The results show that the highest content of SMs in all the studied microgreens species was accumulated under the blue spectrum LED lighting. This study underlines the favorable influence of the blue spectrum (400–500 nm) on the nutrient content, especially the enhancement of SMs, in the microgreens investigated. Furthermore, the use of supplemental LED lighting proves to be a sustainable and effective means of producing microgreens with superior nutritional properties through the innovative practice of the zero-acreage farming technique.
1. Introduction
There is less and less arable land, while the need for nutrient-rich food for the growing population is increasing. Urbanization is leading to a reduction in arable land, a decline in biodiversity, and an increase in CO2 emissions, all of which are current challenges for agriculture. Due to the increasing incidence of adverse abiotic conditions, greenhouse cultivation is increasingly used in crop production. Shamshiri et al. [1] noted that protected cultivation has evolved over time from light-covered greenhouse structures to high-tech plant factories, often referred to as Controlled Environment Agriculture (CEA) or Controlled Environment Plant Production Systems (CEPPSs). One of the CEPPS types is the climate chamber with supplemental lighting as a light source. High-pressure sodium lamps (HPS), metal halide lamps (MH), xenon lamps and fluorescent lamps are the most commonly used lighting systems for cultivation in greenhouses [2], which have shown numerous shortcomings over time and are not optimal due to their poor energy efficiency and inadequate control of ultraviolet and infrared radiation [3,4]. The use of light-emitting diodes (LEDs) has advantages over the light sources mentioned above, such as high energy efficiency and longevity [5,6] and other technical advantages [7,8].
The most important factors that directly affect metabolic functions in plants related to chemical and nutrient composition are light quality (wavelength), quantity (radiation intensity) and photoperiod (duration) [9].
Wavelengths in the range of 400–800 nm, named photosynthetically active radiation (PAR), are absorbed in plant cells by two main photoreceptors: phytochromes, which absorb red (600–700 nm) and dark red wavelengths (700–800 nm), and cryptochromes, which absorb blue (400–500 nm) and ultraviolet wavelengths (280–400 nm) [10,11]. The application of the red light spectrum increases biomass, activates the plant antioxidant system and increases phenolic concentration. The use of the blue wavelengths increases the synthesis of chlorophyll, polyphenolic compounds and ascorbic acid [12,13]. For photosynthesis and bioactive compounds in plants, an appropriate ratio of red and blue light may be more favorable [14,15] due to its highest photon efficiency, compared to other LED combinations [16]. An adequate amount of blue and red light significantly favors the photosynthetic rate, photosynthetic pigment content, photosynthetic utilization efficiency and photosynthetic capacity, resulting in increased glucose content, the most important precursor for the synthesis of ascorbic acid and phenols. The content of pigments is also increased with dichromatic light treatment with blue and red light [16], as is the dry weight [6]. Some recent research [15] has emphasized the significant effectiveness of some other light spectra, namely the green and far-red spectra, in addition to the ratio of red to blue light spectra. These spectra are mainly used as partial supplements in the red–blue ratio and show significant positive effects on plant growth and yield.
As one of the main priorities in providing nutritionally superior foods, more and more new food sources are being sought that are characterized by a high nutrient content and form the basis for promoting health and a healthy lifestyle. Microgreens are actually one of the normal phenophases of plant growth, and are consumed in the cotyledon phenophase, in which the first two true leaves are formed. Their popularity has been increasingly promoted among consumers in recent times [17]. Besides their nutritional properties, microgreens are characterized by their easy and short cultivation [18]. They germinate easily and grow quickly, so they can be grown without substrate, fertilizer, or pesticides [19]. In light of the above, Fabek Uher et al. [20] have also found that the commercial production of microgreens is more sustainable under greenhouse growing conditions, especially in hydroponics, mainly because the strictly controlled growing conditions in such areas allow for faster growth, i.e., higher yields of plant biomass and earlier harvesting in more product cycles, which ultimately has a positive effect on yield, but also on a more favorable chemical composition.
The phytonutrient content depends on the phenophase of the plant and decreases from the germination stage to the fully developed plant [21]. Species of Brassicaceae family are widely used in microgreens production. Because of their high ascorbic acid, polyphenolic compound, and antioxidant content, microgreens are a nutritionally valuable food. The Brassicaceae family includes many plant species, including broccoli, mustard, and garden cress. In addition to glucosinolates, Brassicaceae vegetables contain high levels of phytochemicals: ascorbic acid, phylloquinone, carotenoids, phenolic compounds, tocopherols, polyphenols, and minerals, suggesting a high antioxidant capacity [22,23].
The aim of this study was to investigate and quantify the effects of blue, red, and a 50:50 combination of blue and red LED lighting on the SM content in broccoli, mustard, and garden cress microgreens grown in an indoor farm using the zero-acreage farming technique (ZFarming).
2. Materials and Methods
2.1. Plant Material
In this study, fresh material of three microgreens species were analyzed: broccoli (Brassica oleracea L. var. italica Plenck), mustard (Sinapis alba L.), and garden cress (Lepidium sativum L.). The experiment was conducted in the company Vesela motika at Zagreb, Croatia, in the controlled conditions of a climate chamber with a temperature of 25 °C (±2 °C) and relative humidity of 60% (±5%). Three different spectra of supplemental lighting were used: blue (450 nm), red (620 nm), and a combination of red and blue spectrum in the ratio (50:50), in a photoperiod of 14 h as a randomized block design with three replicates under supplemental lighting with LEDs (SANSOL GmbH, Jennersdorf, Austria). Broccoli, mustard, and garden cress microgreens seeds were procured from Lokvina d.o.o. (Varaždin, Croatia). Plastic PVC trays (0.0851 m2) filled with substrate TraySubstrate® (Klasmann-Deilmann GmbH, Geeste, Germany) were used for sowing, without prior treatment, in an amount of 10 g per tray for broccoli, 7 g per tray for garden cress, and 15 g per tray for mustard. Trays were set on shelves, 31 cm away from LEDs, and regularly irrigated with tap water. Microgreens were manually cut after eight days in the cotyledon phenophase at the base of the hypocotyl. Plant material samples weighing 50 g were transferred to the laboratory at Department of Sustainable Technologies and Renewable Energy Sources, Faculty of Agriculture, University of Zagreb, for analyses.
2.2. Total Dry Matter Content and Chromaticity Parameters Analysis
The total dry matter content (DM) was determined according to the AOAC method by drying at 105 °C to constant mass [24].
The color parameters of the fresh plant material (L*, a*, b*, C, h°) were measured with a colorimeter (ColorTec PCM +, PCE Instruments, Southampton, UK) according to the CIELAB method. The lightness of the sample indicates the L* value, from 0 (for black) to 100 (for white), negative a* values (−a*) indicate the presence of green, while positive a* values (+a*) indicate the presence of red; negative b* values (−b*) represent blue, while positive values (+b*) indicate a yellow color [25]. Greenness (a*), yellowness (b*), and lightness (L*) were used to calculate chroma (C) = (a*2 + b*2)1/2 and Hue angle (H°) = (b*/a*).
2.3. Specialized Metabolites Analysis
From the group of specialized metabolites, the following were analyzed: ascorbic acid content (AsA), total phenols (TPC), total flavonoids (TFC), total nonflavonoids (TNFC), and from the group of pigments: total chlorophylls (TCh), chlorophyll a (Chl_a), chlorophyll b (Chl_b), and total carotenoids (TCa).
Ascorbic acid (AsA) content was analyzed according to the AOAC [26] method by titration with 2,6-dichloroindophenol (DCPIP). For each plant material, an amount of 10 g ± 0.01 was homogenized with 2% (v/v) oxalic acid in an amount of 100 mL. After filtration, a volume of 10 mL was obtained.
DCPIP was used to titrate the filtrate until pink coloration occurred, while the final AsA content was calculated according to Equation (1) and expressed as mg·100 g−1 fresh weight (fw); the final AsA content was calculated as follows:
where V—DCPIP volume (mL); F—the factor of DCPIP; D—sample mass (g).
Total phenolic content (TPC), total flavonoids (TFC), and total nonflavonoids (TNFC) were analyzed by the method of Ough and Amerine [27], based on the blue coloration that occurs when phenols react with the Folin–Ciocalteu reagent (FC). First, 10 g ± 0.01 of the sample mass was weighed and homogenized with 40 mL 80% EtOH (v/v). The reflux method was used for extraction, in which the samples prepared above were heated to boiling point and refluxed for 10 min. The procedure was repeated twice with additional 50 mL EtOH, while the samples were filtered through quantitative Whatman® filter paper (Merck d.o.o., Zagreb, Croatia) after 10 min of reflux each time. Both filtrates were combined and a 100 mL volumetric flask was filled up to the mark with 80% EtOH (v/v). The prepared extracts were used for the reaction with the FC reagent as follows: 0.5 mL of the ethanolic extract, 30 mL of distilled water (dH2O), 2.5 mL of the freshly prepared FC reagent (1:2, v/v), and 7.5 mL of saturated sodium carbonate solution (Na2CO3) were each added to a volumetric flask with a volume of 50 mL. The flask was then filled to the mark with distilled water and allowed to stand at room temperature for 2 h. The final content was analyzed with a spectrophotometer (Shimadzu, 1900i, Kyoto, Japan) at a wavelength of 750 nm, where distilled water was used as a blank.
For TNFC determination, the ethanolic extracts prepared above were used in the following procedure: 10 mL of the ethanolic extract, 5 mL HCl in EtOH (1:4, v/v), and 5 mL formaldehyde were placed into 25 mL volumetric flasks. The prepared samples were passed through a nitrogen stream containing (N2) and stored for 24 h at 21 degrees in a dark place. After precipitation of the non-flavonoid compounds, the contents of the flask were filtered and the same reaction was performed with the FC reagent. The TFC content was expressed as the difference between the TPC and TNFC content. For the analysis of total phenols, agallic acid and pyrocatechol were used as external standards. The total phenols analyzed were expressed as milligrams of gallic acid (GAE) for TPC and TNFC and catechol (CTH) for TFC equivalents per 100 g body weight.
The photosynthetic pigments, i.e., total chlorophyll (TCh), chlorophyll a (Chl_a), chlorophyll b (Chl_b), and total carotenoids (TCa), were analyzed according to the method of Holm [28] and Wettstein [29]. A quantity of 0.2 g ± 0.01 fresh microgreen species was weighed, and a total volume of 15 mL acetone (p.a.) was added in three separate portions. After each addition of acetone, the sample was homogenized using a laboratory homogenizer (IKA, UltraTurax T-18, Staufencity, Germany). After extraction, the samples were filtered and the absorbance was measured spectrophotometrically (Shimadzu, 1900i, Kyoto, Japan) at 662, 644, and 440 nm, using acetone (p.a.) as a blank. The following Holm–Wettstein equations were used to calculate the individual pigment concentrations (2)–(5):
Chl_a = 9.784 × A662 − 0.990 × A644 (mg·L−1)
Chl_b = 21.426 × A644 − 4.65 × A662 (mg·L−1)
TCh = 5.134 × A662 + 20.436 × A644 (mg·L−1)
TCa = 4.695 × A440 − 0.268 × TCh (mg·L−1)
Results for pigment compound content were expressed in mg·g−1 fw.
2.4. Analysis of Individual Phenols
The modified method of high-performance liquid chromatography by Otles and Yalcin [30] was used to identify and quantify the selected individual phenolic compounds. Extraction of the plant material was performed by homogenization (IKA, UltraTurax T-18, Staufencity, Germany) of 1 g ± 0.01 of the plant material with 10 mL of 80% methanol (v/v), while further extraction was performed in an ultrasonic bath (Bandelin RK 103H, Berlin, Germany) for 30 min at 50 °C. After extraction, the eluate was passed through Whatman filter paper and then through Chromafil PA filters. The LC Nexera (Shimadzu, Kyoto, Japan) with a photodiode array and a fluorescence detector (PDA-RF) was used for purification of the HPLC analysis. The separation of phenolic components was performed on a NUCLEOSIL 100-5 C18 (5 µm, 250 × 4.6 mm i.d.) column (Macherey-Nagel, GmbH, Dueren, Germany). The HPLC protocol for the separation of phenols was modeled after the modified method of Repajić et al. [31]. A gradual elution was used under the following conditions: at 0 min = 90% A/10% B, at 25 min 60% A/40% B, at 30 min 30% A/70% B, and then after 35 min to 45 min 90% A/10% B. The mobile phase A consisted of 3% formic acid and 97% HPLC water (v/v), and the mobile phase B consisted of 3% formic acid and 97% HPLC acetonitrile (v/v). The operating conditions were 23 °C oven temperature, 45 min run time per sample, 0.9 mL/min flow rate, and 20 µL injection volume. The analysis was performed at wavelengths from 220 to 360 nm. The individual phenolic compounds were identified by comparing the retention times with commercial standards (Sigma Aldrich, Steinheim, Germany). The quantification of the individual phenols was performed using the standard equation based on the calibration curves (Table 1) obtained using the mixed standard solution with different concentrations of the individual phenolic compounds (2, 10, 40, and 100 µg/mL). The results of the phenolic compounds were expressed in mg·L−1.

Table 1.
Equations of calibration curves for individual phenolic standards.
2.5. Antioxidant Capacity Analysis
Antioxidant capacity analyses were performed using the ABTS method [32] using the 2,20-azinobis-(3-ethylbenzothiazoline-6-sulfonic acid) radical cation. The method is based on the reaction between the antioxidant compound and the radical cation ABTS+, which is reduced to ABTS, followed by a color change, i.e., the specific blue-green color of the ABTS+ cation is reduced. First, a stable ABTS+ solution was prepared by adding 88 µL of a 140 mM K2S2O8 solution to 5 mL of ABTS solution and allowing the prepared solution to stand at room temperature for 16 h. For the reaction with the antioxidant compound, a 1% ABTS solution was prepared in 96% ethanol, and 160 µL of the ethanolic extract (prepared for the analysis of total phenols) and 2 mL of the 1% ABTS+ solution was mixed. The reaction was allowed to stand for 5 min. Then, the absorbance was measured spectrophotometrically at 734 nm (Shimadzu, 1900i, Kyoto, Japan) using 96% ethanol as a blank.
Antioxidant capacity was also determined using the assay for the reducing antioxidant power of iron (III) (FRAP) by Benzie and Strain [33]. The FRAP assay is also based on the staining reaction at low pH, in which Fe3+-TPTZ is reduced to a blue-colored Fe2+-TPTZ. The absorbance of the coloration was measured spectrophotometrically (Shimadzu, 1900i, Kyoto, Japan) at 593 nm using an 80% EtOH (v/v) blank. The FRAP reagent was prepared by mixing acetate buffer (300 mM, pH 3.6), a solution of 10 mM TPTZ in 40 mM HCl, and 20 mM FeCl3 × 6H2O in a ratio of 10:1:1 (v/v/v) on the day of analysis. For the preparation of the reaction with the antioxidant compound, 720 µL dH2O, 240 µL ethanol extracts, and 6240 µL of the FRAP reagent were used. The absorbance values were measured after 5 min of incubation in a water bath at 37 °C. The standard curve was prepared with different concentrations of Trolox and the results were expressed as μmol Trolox equivalent (µmol TE·L−1).
2.6. Statistical Analysis
The resulting data were processed using two-way ANOVA with LSD test to compare the mean values at the significance level p ≤ 0.0001. The PROC GLM procedure, with light and plant species as categorical predictors, from the SAS® software version 9.3 (2010) [34] was used for the statistical analysis. The results are presented in the tables and figures as mean values with standard deviation, with different letters indicating significant statistical differences at the p ≤ 0.0001 level. The significance of the interactions of various factors with p-values are also indicated in the tables.
3. Results
3.1. Physico-Chemical Properties of Microgreens
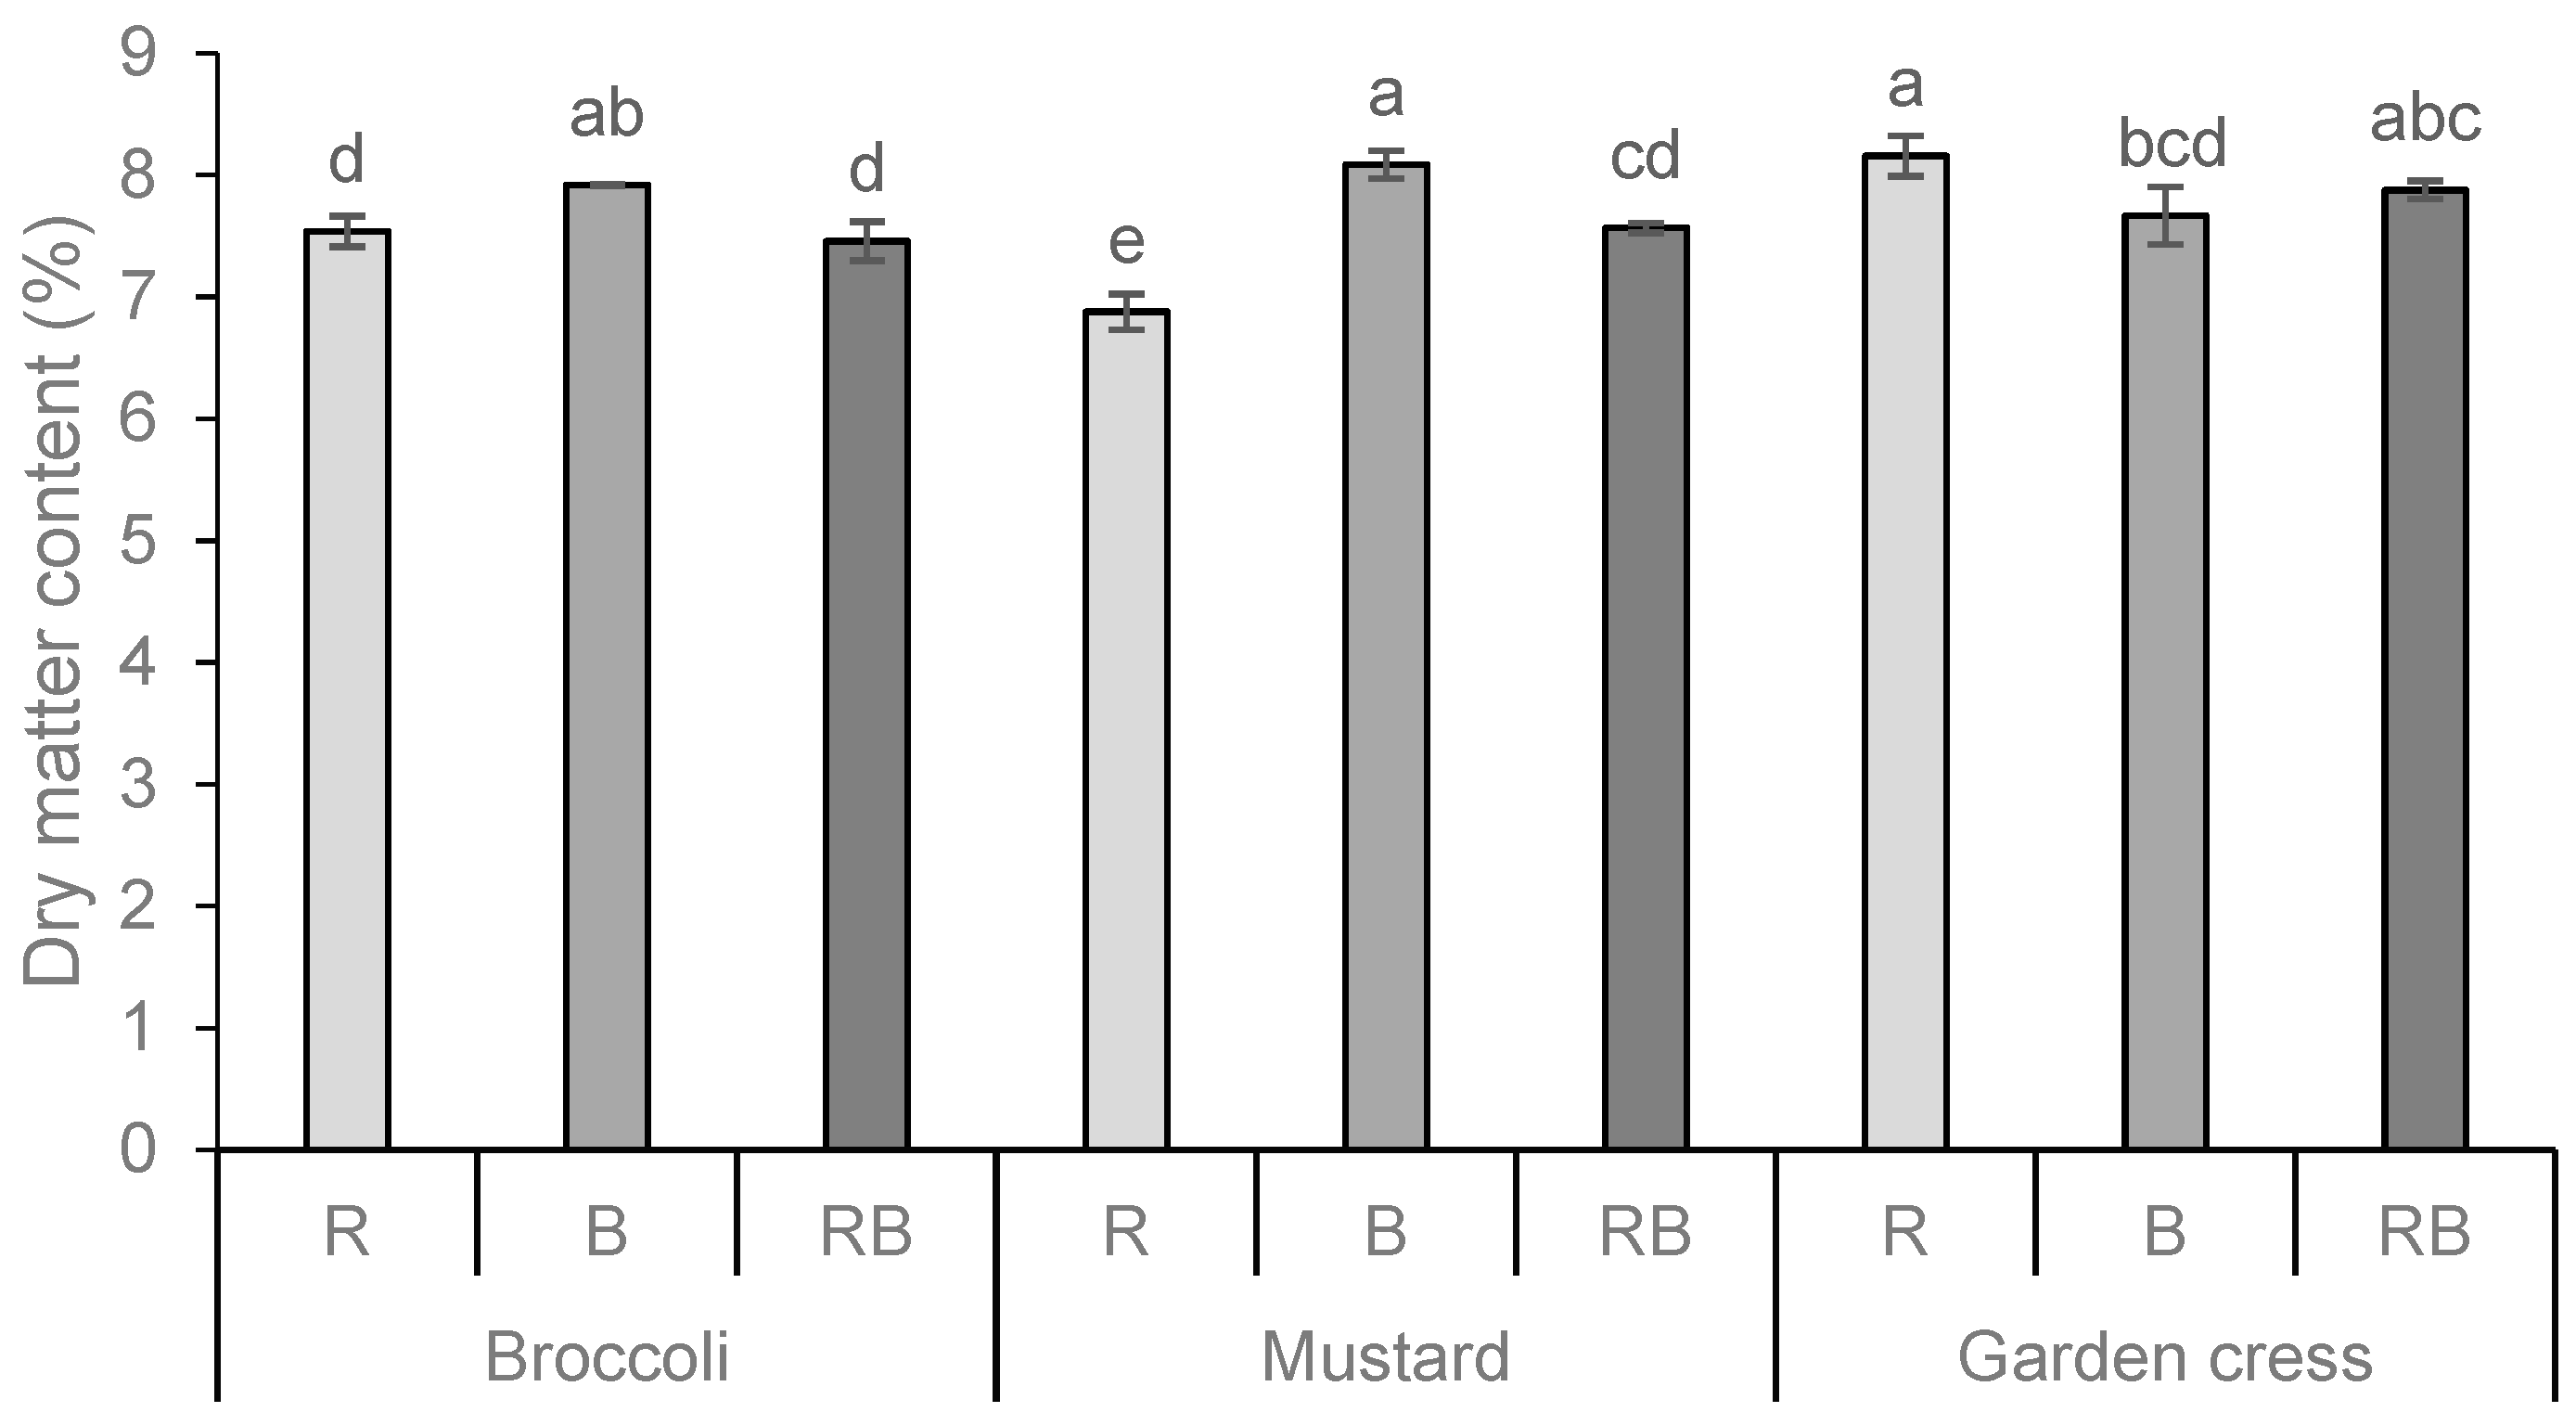
The total dry matter content (DM%) of the fresh microgreens is shown in Figure 1. The DM content varied significantly according to the species and light treatment, with the highest content obtained in garden cress when treated with red light (R) and in mustard when treated with blue light (B). Also, from the extracted results on the influence of individual factors, in this case, the type of light spectrum (LED lamps), it is clear that the blue spectrum had the most positive effect on the increase in dry matter content in the analyzed microgreens.

Figure 1.
Total dry matter content (DM%) of broccoli, mustard, and garden cress microgreens grown under the different LED wavelengths. Results are presented as mean ± standard deviation. Different letters indicate significant differences between mean values at p ≤ 0.0001. R = red spectrum, B = blue spectrum, RB = combination of red and blue spectrum. Interactions: PS = p ≤ 0.0001; L = p ≤ 0.0001; PSxL = p ≤ 0.0001.
As for the coloration of selected microgreens species (Table 2), the highest brightness (L*) was observed in garden cress and broccoli grown under blue light (B), while the lowest value was observed in garden cress grown under red light (R). No statistical difference was observed in a* and b* values between the observed microgreens species and light treatment. The supplemental lighting had no effect on the significant changes in a* and b* values or on the occurrence of the specific green and yellow coloration in selected species. The interaction between the factors plant species x light is not statistically significant.
Table 2.
Chromaticity parameters of broccoli, mustard, and garden cress microgreens grown under the different LED wavelengths.
3.2. Specialized Metabolites Content
Regardless of light treatment, the highest AsA content (Table 3) was found in the broccoli microgreens, which was 20% higher than in technologically mature broccoli (according to Rybarczyk-Plonska et al. [35], the average content is 96.52 mg·100 g−1 fw). A slightly higher value was determined for garden cress microgreens (average value of 73.09 mg·100 g−1 fw) and the lowest value for mustard microgreens (70.38 mg·100 g−1 fw). Also, all AsA values determined, regardless of the species observed, were high, indicating that the Brassicaceae family microgreens are a rich source of this valuable micronutrient. Light treatment had a significant effect on the AsA content in the microgreens of all species studied; in particular, blue light treatment (B) had the most positive effect on the AsA content in the broccoli and garden cress. In mustard, the combination of red and blue light (RB) had the strongest effect on the AsA accumulation.
Table 3.
Specialized metabolites content of broccoli, mustard, and garden cress microgreens grown under the different LED wavelengths.
As an interaction of factors, the microgreen species and the light treatment significantly influenced the polyphenolic compounds content. As for the genetic traits, the highest total phenolic content (TPC) was found in the mustard microgreens, lower in garden cress, and the lowest in broccoli microgreens (Table 3). The same trend as for TPC, given the genetic characteristics, was also observed for the total non-flavonoid (TNFC) and total flavonoid content (TFC) in the observed species. Light treatment had a significant effect on the accumulation of TPC in all the microgreens, while blue light (B) had the strongest effect on the accumulation of polyphenolic compounds in all the species. Thus, the highest TPC content was observed in the mustard microgreens grown under the blue light spectrum. A higher TPC content was also determined in the other two observed microgreen species when treated with B than when treated with red (R) and red–blue combination light (RB). For example, in the mustard microgreens, the TPC level at B was 25% higher than in the RB treatment and as much as 39% higher than in the R treatment. For the broccoli microgreens, this significant effect of the B treatment was not as pronounced compared to the R and RB treatments, with a roughly 16% difference between the highest (B) and the lowest (R) value determined, and for garden cress, even smaller differences were detected with no statistical differences between the B and R treatments and about 8% between the highest values (R and B treatments) and the lowest value (RB).
The results of the microgreens pigment compounds are shown in Table 4. Both the factors analyzed, plant species and light spectrum, had a significant effect on the photosynthetic pigments content. Considering both factors, the highest contents of the pigments, including chlorophyll a (Chl_a), chlorophyll b (Chl_b), and the total chlorophyll (TCh), but also of the photoprotective pigments, i.e., total carotenoids (TCa), were found in the mustard microgreens grown under the red light spectrum (R). In the broccoli microgreens, the effect of the light spectrum on the content of Chl_a, Chl_b, TCh, and TCa was most pronounced with the red–blue (RB) combination, while in the garden cress, the highest content of photosynthetic pigments analyzed was found with the red (R) and blue (B) spectrum, with no statistical difference detected between these two LED lights. The present results suggest that genetic traits have a significant effect on the pigment content. Since light is a crucial factor to induce and stimulate the photosynthetic rate and thus influence the content of photosynthetic pigments, the isolated effect of light treatment was statistically studied.
Table 4.
Pigment compounds content of broccoli, mustard, and garden cress microgreens grown under the different LED wavelengths.
3.3. Individual Phenolic Content
In accordance with the high TPC values recorded in all the analyzed microgreens species, the individual phenols were determined and quantified, and are presented in Table 5. The highest content of caffeic acid was determined in the mustard microgreens grown under blue light (B), while the lowest content was found in garden cress, with no significant difference between the light treatments. The highest content of coumaric acid was determined in garden cress grown under combined light (RB), while the lowest concentration was determined in broccoli grown under blue light. The content of ellagic acid is lowest in broccoli, with no significant difference between the treatments, while the concentrations found are extremely low compared to mustard and garden cress microgreens, even several times lower. While the highest ferulic acid content is determined in broccoli grown under the combined light (RB), the lowest one is determined in garden cress. Garden cress grown under red light (R) and combined light (RB, 636.95 mg·L−1) has the highest concentration of naringin, while the lowest concentration was found in mustard. The naringin content is an exception in the mustard samples, with significantly lower values compared to broccoli and garden cress.
Table 5.
Individual phenolic compounds of broccoli, mustard, and garden cress microgreens grown under the different LED wavelengths.
3.4. Microgreens Antioxidant Activity
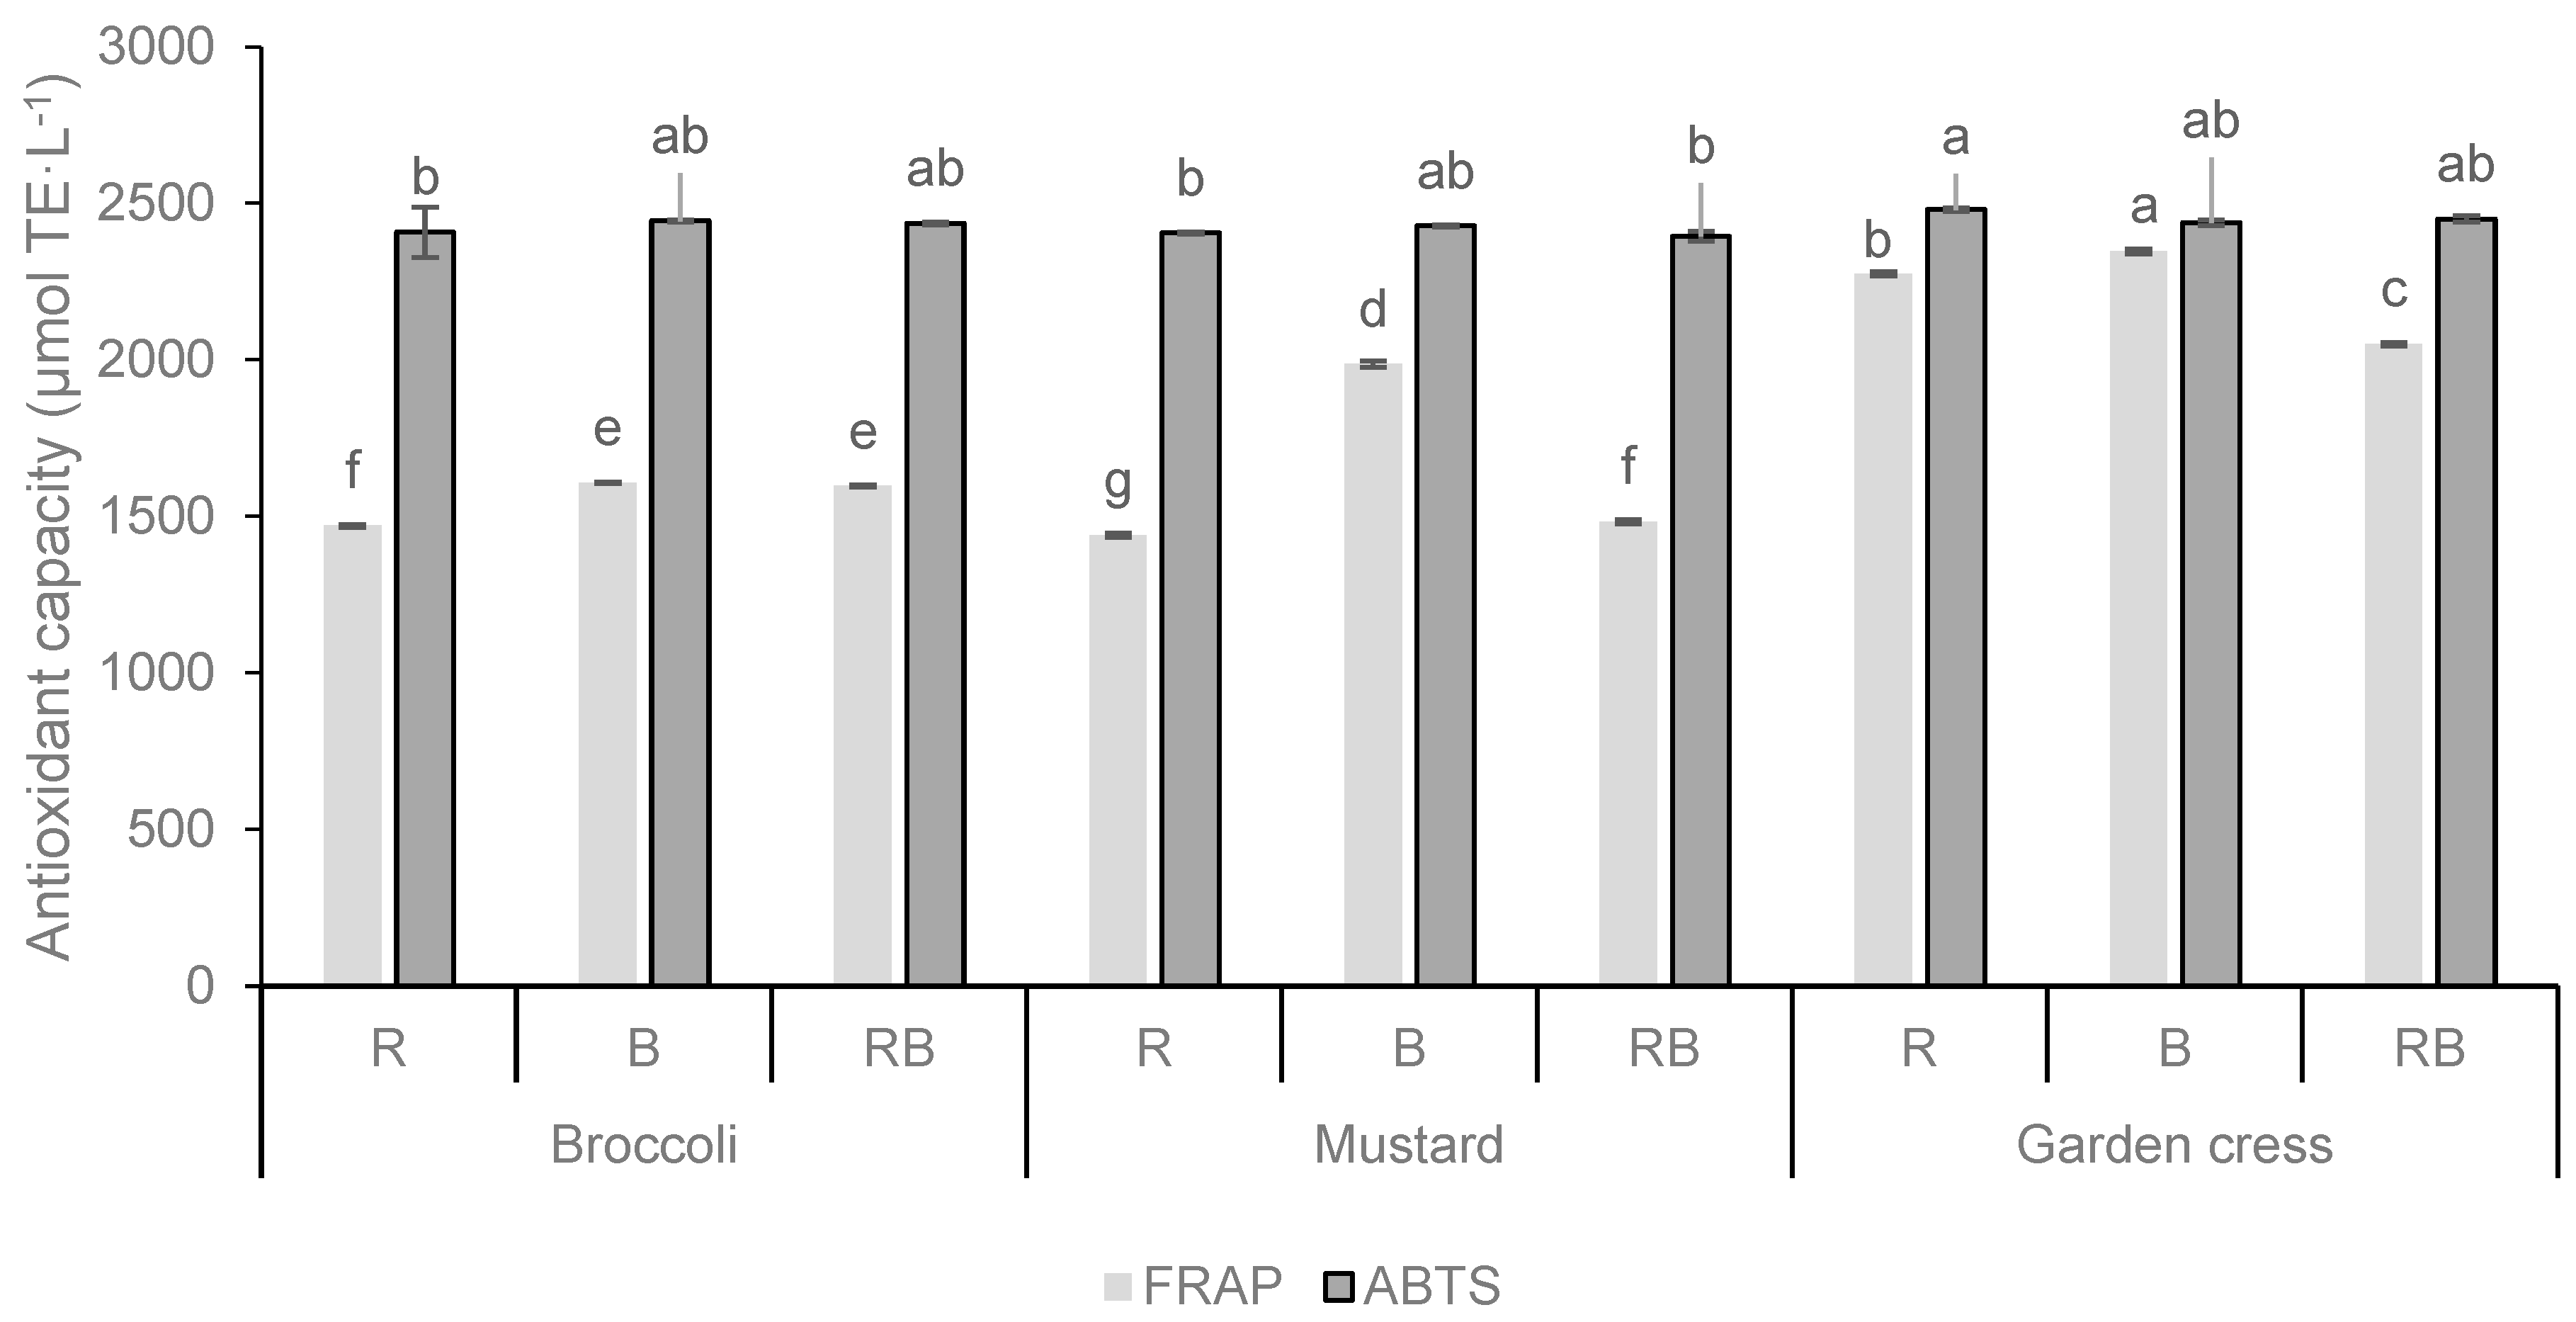
In this study, the FRAP and the ABTS assays were used to detect the antioxidant capacity of fresh microgreens (Figure 2). The highest antioxidant capacity was observed with both assays in broccoli and mustard microgreens grown under blue light (B), while the same microgreens species grown under red light (R) showed significantly lower capacities. Garden cress grown under red light (R) showed a higher antioxidant capacity in the ABTS assay and FRAP assay when grown under blue light (B). The results suggest that microgreens grown under blue light have the highest antioxidant capacity compared to red light and the combination of red and blue light (RB). The results of the effects of the light factor on the antioxidant capacity analyzed by both the ABTS and FRAP assays indicate a strong positive effect of blue light treatment on the antioxidant capacity analyzed by the FRAP assay, whereas some opposite results were obtained by the ABTS assay. Indeed, the results indicate that the light treatment and the interaction of plant species and light treatment (PSxL) does not have a significant influence on the antioxidant capacity studied with the ABTS assay.

Figure 2.
Antioxidant capacity (µmol TE·L−1) of broccoli, mustard, and garden cress microgreens grown under the different LED wavelengths. Results are expressed as mean ± standard deviation. Different letters indicate significant differences between mean values at p ≤ 0.0001. R = red spectrum, B = blue spectrum, RB = combination of red and blue spectrum. Interactions for FRAP: PS = p ≤ 0.0001; L = p ≤ 0.0001; PSxL = p ≤ 0.0001 and for ABTS: PS = p ≤ 0.0094; L = p ≤ 0.7661; PSxL = p ≤ 0.1441.
It is noted that the microgreens with the highest TPC content had the highest antioxidant capacity (FRAP assay), both under the B light treatment.
4. Discussion
The DM content was low in all the species compared to some previously published studies on broccoli (8.94%), mustard (13.25%), and garden cress (11.06%) microgreens grown in greenhouses [36], but it was similar to the DM content (6.25–10.15%) of microgreens grown hydroponically [20]. According to Ma [6], the dry weights of cucumber seedlings and lettuce plants were increased with red–blue LED combinations. Similar results were obtained by a group of authors [16] who also found a higher DM content in the plants treated with additional red–blue spectrum (7:2). According to the results obtained by other authors, it can be pointed out that the results of this study vary with respect to the effect of the light spectrum, as a higher DM accumulation was observed when the blue light spectrum was used in broccoli and mustard microgreens, while in garden cress under the red light spectrum. Based on the above data from the literature, the blue–red combination had no significant effect on the DM content in this study, while in broccoli microgreens, the DM content was lower in the red light and blue–red light treatments. In mustard and garden cress microgreens, a positive effect of the blue–red combination was observed as the DM values were close to the higher values that were observed. It is worth noting that some studies [23] also suggest that the amendment of green light to a red/blue light increases the accumulation of DM. In order to achieve higher DM values in the plant material and thus potentially produce plant material with a higher nutrient quality, light treatment also has a considerable influence, so that an optimal combination of light treatments is crucial.
Color is an external sensory attribute that is related to the quality of the raw material and strongly influences consumer preferences. Moreover, color parameters are directly related to plant pigments and are a first indicator of plant pigment accumulation in plant tissues.
The obtained results regarding the chromaticity parameters do not agree with other data from the literature, since other studies indicate a significant effect of blue, red, and, especially, combined blue–red light on the accumulation of photosynthetic pigments or chlorophylls responsible for the appearance of the specific green coloration [16,37]. The blue light spectrum induces the opening of stomata and thus affects the increase in the ratio of chlorophyll a (blue-green) and b (yellow-green) [12,13,38], while a suitable red–blue combination further enhances this effect. Moreover, it is worth mentioning that in this study, a significant effect of the LED light treatment was observed for all the photosynthetic pigments studied, chlorophyll a and b, total chlorophylls, and total carotenoids.
Ascorbic acid (AsA) is one of the compounds of chemical composition with a high antioxidant capacity, which plays an important role in plant damage caused by abiotic stresses [39]. This could be the reason why the AsA content in microgreens produced in a floating hydroponic, in which plants are optimally supplied with water and nutrients, was 52.28 mg·100 g−1 fw on average [20], and it was lower than in our study. Some research has reported a positive influence of LED light on the content of AsA [11,16,40]. The results show that the blue light spectrum has a stronger effect on the AsA accumulation in the microgreen tissue. These results are confirmed by the statistical analysis of the effects of the LED light treatment on the AsA content regardless of the microgreen species. According to these results, the blue spectrum had the most significant positive effect on the AsA accumulation, while the other treatments, R and RB, did not differ significantly in their effect on the AsA content in the microgreens. The main product of photosynthesis is glucose, which serves as the first precursor for the biosynthesis of AsA [41]. In this case, blue light increases the photosynthetic rate, i.e., glucose level, leading to an increase in the AsA concentration in microgreens grown under blue light. Also, some other authors have found that additional blue LED light stimulates the antioxidant status in green vegetables: an increased content of polyphenols, vitamin C, carotenoids, and anthocyanins [7,16].
Zhang et al. [11] found that the TPC of Chinese cabbage sprouts and buckwheat sprouts changed significantly depending on the LED treatment, namely, the TPC decreased under red light and increased under blue light, which is consistent with the results of this study. The results show that blue light has a positive effect on the total phenol accumulation in all the microgreens studied, which may be related to the process of photosynthesis. Indeed, glucose is the main product degraded to shikimic acid, which is the main precursor for the biosynthesis of aromatic amino acids. Aromatic amino acids are precursors for the synthesis of phenolic compounds [42], which explains the increased concentration of phenols in the microgreens grown under blue light. Phenolic compounds have immunomodulatory effects on the human immune system. Their diverse structures can be associated with numerous antioxidant properties. Many studies have shown that the antioxidant activity of shoots and microgreens is positively correlated with TPC and TFC and closely related to light conditions [11].
Chlorophylls and carotenoids are considered the most important pigments affecting the visual (color) appearance of green sprouts [36], but they also have functional value, as they are also recognized as important phytochemicals, especially from the perspective of antioxidant activity [43]. Moreover, these compounds are the most important for the process of photosynthesis in plants, the main process for all other vital processes of the plant. The achieved results demonstrate that regardless of the plant species, the red light spectrum (R) had the highest effect on TCh accumulation, i.e., the highest pigment compounds were found under the R light treatment and the lowest under the RB light treatment. The same trend was observed for the total carotenoids, the content of which was the highest in the microgreens treated with R light and lowest in those treated with RB. The obtained results are mainly in accordance with other data from the literature. According to Perez-Galvez et al. [43], R increases the chlorophyll content. Samouliene et al. [44] reported an increased concentration of chlorophyll and carotenoids in mustard microgreens grown under blue light (B) and noted an increase in chlorophyll content when B is used alone or in combination with R.
According to the results, blue light (B) had the greatest effect on the accumulation of caffeic acid and ellagic acid, while red light (R) had the greatest effect on the accumulation of naringin. Combined light (RB) had the strongest effect on the accumulation of coumaric and ferulic acids. From the results, it appears that the genetic characteristics of the plant species and the light spectrum have a significant influence on the synthesis of individual phenolic compounds. Caffeic acid shows the highest result in mustard regardless of treatment, being 95% higher than in garden cress, and 44% higher than in broccoli. All the identified individual polyphenolic compounds have specific properties and responses to health maintenance with significant health-promoting effects and antibacterial, anti-inflammatory, anti-cancer [45], and antimicrobial activity, and play an important role in human health [46].
In general, the antioxidant capacity values of the microgreens grown under different light wavelengths are high, indicating a high functional potential, which has also been confirmed by other studies [47,48]. Microgreens therefore have great potential as valuable health and functional foods. The results achieved in this study are in accordance with the results reported by Fabek Uher et al. [20] regarding the specialized metabolites content and antioxidant capacity of microgreens.
Microgreens are rich in nutrients, especially in a variety of bioactive compounds and antioxidants [11,19]. It is worth mentioning that microgreens have a significantly higher content of specialized metabolites compared to the later phenophases of the plant (e.g., technological maturity) [49], which are strongly influenced by light wavelengths under greenhouse cultivation conditions. LED lighting therefore enables a precise selection of intensities and wavelengths, i.e., a quality of light in which conditions can be manipulated to specifically promote the accumulation of specialized metabolites in plant tissue and enable the production of plant biomass with a higher nutritional potential [50]. For example, Chinese cabbage sprouts grown under blue light showed the highest antioxidant activity [11], while in contrast, the results for Valerianella locusta were highest under red light [12]. According to Brazaityte [14], blue light affects the accumulation of antioxidants more significantly. The results obtained in this study are in agreement with the findings of Zhang et al. [11], who found that the antioxidant capacity was highest in sprouts grown under LED blue light, with an increased accumulation of mineral elements after light exposure. It should also be noted that the results of the influence of light treatment on the antioxidant capacity are consistent with the results of the light spectrum on the total phenolic compounds. Indeed, phenols are one of the most pronounced antioxidants, the content of which strongly affects the antioxidant capacity of the samples; in other words, if the higher the phenolic content is, the higher is the antioxidant capacity of the samples.
5. Conclusions
According to the results, the LED light had a significant influence on the studied SMs. Blue light had a positive effect on the accumulation of the following SMs: ascorbic acid content and total phenols, while red light had a significant effect on the accumulation of chlorophylls and carotenoids, the pigments of photosynthesis. According to the results of the antioxidant capacity determined by the FRAP assay, blue light had a greater effect on increasing the antioxidant capacity, while there was no significant difference in the antioxidant activity with the ABTS assay. LED technology was used to obtain high-quality plant material from microgreens, which have potential functional properties due to their significant antioxidant capacity. To better understand the influence of the red and blue monochromatic light spectra and their combination, it is necessary to conduct further research to include the photoperiod as one of the crucial factors in optimizing LED technology to cultivate plant material with a higher content of SMs and a greater antioxidant potential.
Author Contributions
Conceptualization, R.V., B.B. and J.Š.Ž.; methodology, R.V., B.B. and J.Š.Ž.; software, M.D.; validation, J.Š.Ž. and B.B.; formal analysis, J.Š.Ž. and B.B.; investigation, R.V., J.Š.Ž., M.D. and B.B.; resources, R.V.; data curation, R.V., J.Š.Ž. and M.D.; writing—original draft preparation, R.V. and J.Š.Ž.; writing—review and editing, R.V., J.Š.Ž., M.D. and B.B.; visualization, R.V. and J.Š.Ž.; supervision, J.Š.Ž. and B.B. All authors have read and agreed to the published version of the manuscript.
Funding
The publication was supported by the Open Access Publication Fund of the University of Zagreb Faculty of Agriculture.
Data Availability Statement
The original contributions presented in the study are included in the article, further inquiries can be directed to the corresponding author.
Acknowledgments
The authors would like to thank colleagues and friends from the company Vesela motika for their help and support during this research. Thank you!
Conflicts of Interest
Author Roberta Vrkić was employed by the company Vesela motika LLC. The remaining authors declare that the research was conducted in the absence of any commercial or financial relationships that could be construed as a potential conflict of interest.
References
- Shamshiri, R.R.; Kalantari, F.; Ting, K.C.; Thorp, K.R.; Hameed, I.A.; Weltzien, C.; Ahmad, Z.; Mojgan Shad, D. Advances in greenhouse automation and controlled environment agriculture: A transition to plant factories and urban farming. Int. J. Agric. Biol. Eng. 2018, 11, 1–22. [Google Scholar] [CrossRef]
- Mitchell, C.A.; Both, A.J.; Bourget, C.M.; Burr, J.F.; Kubota, C.; Lopez, R.G.; Morrow, R.C.; Runkle, E.S. LEDs: The future of greenhouse lighting! Chron. Hortic. 2012, 52, 6–12. [Google Scholar]
- Kaiser, E.; Ouzounis, T.; Giday, H.; Schipper, R.; Heuvelink, E.; Marcelis, L.F.M. Adding blue to red supplemental light increases biomass and yield of greenhouse-grown tomatoes but only to an optimum. Front. Plant Sci. 2019, 9, 2002. [Google Scholar] [CrossRef]
- Jones-Baumgardt, C.; Llewellyn, D.; Zheng, Y. Different microgreen genotypes have unique growth and yield responses to intensity of supplemental PAR from light-emitting diodes during winter greenhouse production in Southern Ontario, Canada. HortScience 2020, 55, 156–163. [Google Scholar] [CrossRef]
- Zhang, M.; Whitman, M.K.; Runkle, E.S. Manipualting growth, color and taste attributes of fresh cut lettuce by greenhouse suplemental lighting. Sci. Hortic. 2019, 252, 274–282. [Google Scholar] [CrossRef]
- Ma, Y.; Xu, A.; Cheng, Z.M. Effects of light emitting diode lights on plant growth, development and traits a meta-analysis. Hortic. Plant J. 2021, 7, 552–564. [Google Scholar] [CrossRef]
- Olle, M.; Viršile, A. The effects of light-emitting diode lighting on greenhouse plant growth and quality. Agric. Food Sci. 2013, 22, 223–234. [Google Scholar] [CrossRef]
- Turner, E.R.; Luo, Y.; Buchanan, R.L. Microgreen nutrition, food safety, and shelf life: A review. J. Food Sci. 2020, 85, 870–882. [Google Scholar] [CrossRef]
- Negri, M.; Bulgari, R.; Santoro, P.; Ferrante, A. Evaluation of different growing substrates for microgreens production. Acta Hortic. 2021, 1305, 109–114. [Google Scholar] [CrossRef]
- Hasan, M.; Bashir, T.; Ghosh, R.; Lee, S.K.; Bae, H. An Overview of LEDs’ effects on the production of bioactive compounds and crop quality. Molecules 2017, 22, 1420. [Google Scholar] [CrossRef]
- Zhang, X.; Bian, Z.; Yuan, X.; Chen, X.; Lu, C. A review on the effects of light-emitting diode (LED) light on the nutrients of sprouts and microgreens. Trends Food Sci. Technol. 2020, 99, 203–216. [Google Scholar] [CrossRef]
- Lobiuc, A.; Vasilache, V.; Oroian, M.; Stoleru, T.; Burducea, M.; Pintilie, O.; Zamfirache, M.-M. Blue and red LED illumination improves growth and bioactive compounds contents in Acyanic and Cyanic Ocimum basilicum L. microgreens. Molecules 2017, 22, 2111. [Google Scholar] [CrossRef]
- Ying, Q.; Kong, Y.; Zheng, Y. Applying blue light alone, or in combination with far-red light, during nighttime increases elongation without compromising yield and quality of indoor-grown microgreens. HortScience 2020, 55, 876–881. [Google Scholar] [CrossRef]
- Brazaitytė, A.; Miliauskienė, J.; Vaštakaitė-Kairienė, V.; Sutulienė, R.; Laužikė, K.; Duchovskis, P.; Małek, S. Effect of different ratios of blue and red LED light on Brassicaceae microgreens under a controlled environment. Plants 2021, 10, 801. [Google Scholar] [CrossRef]
- Wang, J.; Lu, W.; Tong, Y.; Yang, Q. Leaf morphology, photosynthetic performance, chlorophyll fluorescence, stomatal development of lettuce (Lactuca sativa L.) exposed to different ratios of red light to blue light. Front. Plant Sci. 2016, 7, 250. [Google Scholar] [CrossRef]
- Bartucca, M.L.; Guiducci, M.; Falcinelli, B.; Del Buono, D.; Benincasa, P. Blue:red LED light proportion affects vegetative parameters, pigment content, and oxidative status of einkorn (Triticum monococcum L. ssp. monococcum) wheatgrass. J. Agric. Food Chem. 2020, 68, 8757–8763. [Google Scholar] [CrossRef]
- Di Gioia, F.; Santamaria, P. Microgreens: Novel fresh and functional food to explore all the value of biodiversity. S. Afr. J. Bot. 2015, 106, 250. [Google Scholar] [CrossRef]
- Ebert, A. Sprouts, microgreens, and edible flowers: The potential for high value specialty produce in Asia. In Proceedings of the Regional Symposium on High Value Vegetables in Southeast Asia: Production, Supply and Demand, Chiang Mai, Thailand, 25–26 January 2012; pp. 216–227. [Google Scholar]
- Kyriacou, M.S.; Rouphael, Y.; Di Gioia, F.; Kyratzis, A.; Serio, F.; Renna, M.; De Pascale, S.; Santamaria, P. Micro-scale vegetable production and the rise of microgreens. Trends Food Sci. Technol. 2016, 57, 103–115. [Google Scholar] [CrossRef]
- Fabek Uher, S.; Radman, S.; Opačić, N.; Dujmović, M.; Benko, B.; Lagundžija, D.; Mijić, V.; Prša, L.; Babac, S.; Šic Žlabur, J. Alfalfa, cabbage, beet and fennel microgreens in floating hydroponics—Perspective nutritious food? Plants 2023, 12, 2098. [Google Scholar] [CrossRef]
- Ebert, A.; Wu, D.; Ray-Yu, Y. Amaranth sprouts and microgreens—A homestead vegetable production option to enhance food and nutrition security in the rural-urban continuum. In Proceedings of the Regional Symposium on Sustaining Small-Scale Vegetable Production and Marketing Systems for Food and Nutrition Security, Bangkok, Thailand, 25–27 February 2014; pp. 233–244. [Google Scholar] [CrossRef]
- Aires, A. Brassica composition and food processing. In Processing and Impact on Active Components in Food, 1st ed.; Preedy, V., Ed.; Academic Press: Cambridge, MA, USA, 2015; pp. 17–25. [Google Scholar]
- Samuolienė, G.; Brazaitytė, A.; Viršilė, A.; Miliauskienė, J.; Vaštakaitė-Kairienė, V.; Duchovskis, P. Nutrient levels in Brassicaceae microgreens increase under tailored light-emitting diode spectra. Front. Plant Sci. 2019, 10, 1475. [Google Scholar] [CrossRef]
- AOAC. Official Methods of Analysis, 16th ed.; Association of Official Analytical Chemists: Washington, DC, USA, 1995. [Google Scholar]
- Hunterlab. Available online: https://support.hunterlab.com/hc/en-us/article_attachments/201450469 (accessed on 7 December 2023).
- AOAC. Official Methods of Analysis, 17th ed.; Association of Official Analytical Chemists: Washington, DC, USA, 2002. [Google Scholar]
- Ough, C.S.; Amerine, M.A. Methods for Analysis of Musts and Wines, 2nd ed.; John Wiley & Sons: New York, NY, USA, 1988. [Google Scholar]
- Holm, G. Chlorophyll mutations in barley. Acta Agric. Scand. 1954, 4, 457–471. [Google Scholar] [CrossRef]
- von Wettstein, D. Chlorophyll-letale und der submikroskopische formwechsel der plastiden. Exp. Cell Res. 1957, 12, 427–434. [Google Scholar] [CrossRef]
- Otles, S.; Yalcin, B. Phenolic compounds analysis of root, stalk, and leaves of nettle. Sci. World J. 2012, 2012, 564367. [Google Scholar] [CrossRef]
- Repajić, M.; Cegledi, E.; Kruk, V.; Pedisić, S.; Çınar, F.; Bursać Kovačević, D.; Žutić, I.; Dragović-Uzelac, V. Accelerated solvent extraction as a green tool for the recovery of polyphenols and pigments from wild nettle leaves. Processes 2020, 8, 803. [Google Scholar] [CrossRef]
- Miller, N.J.; Diplock, A.T.; Rice-Evans, C.; Davies, M.J.; Gopinathan, V.; Milner, A. A novel method for measuring antioxidant capacity and its application to monitoring the antioxidant status in premature neonates. Clin. Sci. 1993, 84, 407–412. [Google Scholar] [CrossRef]
- Benzie, I.F.F.; Strain, J.J. The ferric reducing ability of plasma (FRAP) as a measure of “antioxidant power”: The FRAP assay. Anal. Biochem. 1996, 239, 70–76. [Google Scholar] [CrossRef]
- SAS®/STAT, version 9.3; SAS Institute Inc.: Cary, NC, USA. 2010. Available online: http://documentation.sas.com/?docsetId=statug&docsetTarget=titlepage.htm&docsetVersion=14.3&locale=en (accessed on 10 January 2023).
- Rybarczyk-Plonska, A.; Kare Hansen, M.; Wold, A.B.; Fiskaa Hagen, S.; Borge, G.I.A.; Bengtsson, G.B. Vitamin C in broccoli (Brassica oleracea L. var. italica) flower buds as affected by postharvest light, UV-B irradiation and temperature. Postharvest Biol. Technol. 2014, 98, 82–89. [Google Scholar] [CrossRef]
- Marchioni, I.; Martinelli, M.; Ascrizzi, R.; Gabbrielli, C.; Flamini, G.; Pistelli, L.; Pistelli, L. Small functional foods: Comparative phytochemical and nutritional analyses of five microgreens of the Brassicaceae family. Foods 2021, 10, 427. [Google Scholar] [CrossRef]
- Lanoue, J.; St Louis, S.; Little, C.; Hao, X. Continuous lighting can improve yield and reduce energy costs while increasing or maintaining nutritional contents of microgreens. Front. Plant Sci. 2022, 13, 983222. [Google Scholar] [CrossRef]
- Baroli, I.; Price, G.D.; Badger, M.R.; Caemmerer, S.V. The contribution of photosynthesis to the red light response of stomatal conductance. Plant Physiol. 2008, 146, 737–747. [Google Scholar] [CrossRef]
- Paciolla, C.; Fortunato, S.; Dipierro, N.; Paradiso, A.; De Leonardis, S.; Mastropasqua, L.; de Pinto, M.C. Vitamin C in plants: From functions to biofortification. Antioxidants 2019, 8, 519. [Google Scholar] [CrossRef]
- Zushi, K.; Suehara, C.; Shirai, M. Effect of light intensity and wavelengths on ascorbic acid content and the antioxidant system in tomato fruit grown in vitro. Sci. Hortic. 2020, 274, 09673. [Google Scholar] [CrossRef]
- Alrajhi, A.A.; Alsahli, A.S.; Alhelal, I.M.; Rihan, H.Z.; Fuller, M.P.; Alsadon, A.A.; Ibrahim, A.A. The Effect of LED light spectra on the growth, yield and nutritional value of red and green lettuce (Lactuca sativa). Plants 2023, 12, 463. [Google Scholar] [CrossRef]
- Francenia Santos-Sánchez, N.; Salas-Coronado, R.; Hernández-Carlos, B.; Villanueva-Cañongo, C. Shikimic acid pathway in biosynthesis of phenolic compounds. In Plant Physiological Aspects of Phenolic Compounds; IntechOpen: London, UK, 2019. [Google Scholar] [CrossRef]
- Pérez-Gálvez, A.; Viera, I.; Roca, M. Carotenoids and chlorophylls as antioxidants. Antioxidants 2020, 9, 505. [Google Scholar] [CrossRef]
- Samuolienė, G.; Viršilė, A.; Brazaitytė, A.; Jankauskienė, J.; Sakalauskienė, S.; Vaštakaitė, V.; Novičkovas, A.; Viškelienė, A.; Sasnauskas, A.; Duchovskis, P. Blue light dosage affects carotenoids and tocopherols in microgreens. Food Chem. 2017, 228, 50–56. [Google Scholar] [CrossRef]
- Yang, X.; Zhao, Y.; Gu, Q.; Chen, W.; Guo, X. Effects of naringin on postharvest storage quality of bean sprouts. Foods 2022, 11, 2294. [Google Scholar] [CrossRef]
- Boz, H. p-Coumaric acid in cereals: Presence, antioxidant and antimicrobial effects. Int. J. Food Sci. Technol. 2015, 50, 2323–2328. [Google Scholar] [CrossRef]
- Ghoora, M.D.; Haldipur, A.C.; Srividya, N. Comparative evaluation of phytochemical content, antioxidant capacities and overall antioxidant potential of select culinary microgreens. J. Agric. Food Res. 2020, 2, 100046. [Google Scholar] [CrossRef]
- Xiao, Z.; Rausch, S.R.; Luo, Y.; Sun, J.; Yu, L.; Wang, Q.; Chen, P.; Yu, L.; Stommel, J.R. Microgreens of Brassicaceae: Genetic diversity of phytochemical concentrations and antioxidant capacity. LWT Food Sci. Technol. 2019, 101, 731–737. [Google Scholar] [CrossRef]
- Kowitcharoen, L.; Phornvillay, S.; Lekkham, P.; Pongprasert, N.; Srilaong, V. Bioactive composition and nutritional profile of microgreens cultivated in Thailand. Appl. Sci. 2021, 11, 7981. [Google Scholar] [CrossRef]
- Loi, M.; Villani, A.; Paciolla, F.; Mulè, G.; Paciolla, C. Challenges and opportunities of light-emitting diode (LED) as key to modulate antioxidant compounds in plants. A Review. Antioxidants 2021, 10, 42. [Google Scholar] [CrossRef] [PubMed]
Disclaimer/Publisher’s Note: The statements, opinions and data contained in all publications are solely those of the individual author(s) and contributor(s) and not of MDPI and/or the editor(s). MDPI and/or the editor(s) disclaim responsibility for any injury to people or property resulting from any ideas, methods, instructions or products referred to in the content. |
© 2024 by the authors. Licensee MDPI, Basel, Switzerland. This article is an open access article distributed under the terms and conditions of the Creative Commons Attribution (CC BY) license (https://creativecommons.org/licenses/by/4.0/).