Abstract
Plant growing using light-emitting diodes (LEDs) in a controlled environment is a revolutionary and innovative idea, regardless of the external environmental disturbances. Studying the growth and tuber yield of potatoes (Solanum tuberosum L.) in an LED-based plant factory system is a relatively innovative concept. The current study was conducted in a plant factory to evaluate the effects of different LED spectral compositions on potato tuberization. Potato tuberization was analyzed under six different LED light spectral combinations with irradiances of 300 mol m−2 s−1, with natural light considered the control treatment. The findings stated that the L2 treatment (red70 + blue20 + white10) increased the plant height, branch number, and biomass accumulation, while photosynthetic pigments and photosynthetic activity increased significantly in L5 (red60 + blue20 + green10 + white10). Higher gibberellic acid (GA3) content was recorded in L1 (red70 + blue30), whereas the tuber number and tuber fresh weight were recorded in L3 (red70 + blue20 + green10) and L7 (natural light), respectively. On the other hand, a higher number of smaller-sized tubers were observed in L5, while L2 and L4 (red70 + blue20 + far-red10) resulted in a higher number of medium-sized tubers. In conclusion, a high proportion of red and blue light, along with white and far-red light, increased the plant height, branch number, plant biomass, and production of small- and medium-sized tubers. On the other hand, the inclusion of green light with red and blue enhanced the chlorophyll content, photosynthesis, and leaf expansion, and promoted the production of smaller-sized tubers. Finally, with regard to tuberization, the treatment using L4 followed by L2 outperformed the other treatments.
1. Introduction
The potato (Solanum tuberosum L.) is the most extensively consumed vegetable globally and is a substantial source of carbohydrates, dietary fiber, and potassium for humans [1]. The potato is a significant agricultural crop grown in numerous nations due to its substantial nutritional content, productivity, and capacity to thrive in diverse climate conditions [2]. During the process of cultivation, potato plants are susceptible to viral infections and other diseases, which subsequently lead to the deterioration of the plants and a reduction in the overall yield of the crop. The production and subsequent in vitro micropropagation of virus-free potato plantlets result in the generation of high-quality seed tubers, ensuring purified seed material [3]. The sustainability of potato crops depends, in part, on the use and availability of high-quality seeds (free from diseases). Unfortunately, such seeds may not always be easily accessible to growers in less developed nations [4]. High-yield potato cultivation depends on the use of virus-free seed potatoes. Tissue culture techniques produce pathogen-free plant materials, allowing for the creation of virus-free seed tubers in controlled, aseptic conditions, such as those found in plant factories with LED lighting, enabling year-round production [5]. This innovative technology addresses the challenge of maintaining seed availability, which is crucial during the growing season. However, the cost of potato seeds, representing 17 to 21% of overall crop expenses, poses a significant obstacle, particularly given the high expense associated with obtaining quality seeds [1,6]. This technology significantly reduces virus infection and secures the yield as well. For continued quality seed availability in the market, we need to grow seed year-round in controlled environment conditions (under LED light and plant factory conditions). The features of LED light (its spectrum, intensity, and photoperiod) are essential elements that regulate the photosynthesis, metabolism, and morphogenesis of potato plantlets when grown in vitro as well as in vivo conditions. The light spectrum is one of the most essential environmental elements for the growth and development of potato plants. It not only produces energy for photosynthesis but also signals cues for physiological functions [7].
Light quality, amount, and photoperiod regulate the entire developmental process of plants. Light plays an important role in affecting the nutrition and quality of germinating seeds [8]. Artificial supplemental light compensates for the natural light in greenhouse production, but in plant factories, the plant is completely reliant on artificial light. Furthermore, by adjusting the light in the closed plant factory conditions, it is possible to control plant productivity and nutritional quality [9]. Apart from nutritional quality, for entire plant production (yield and biomass production), blue and red light have a significant impact [10]. Using red and blue LED light, many plant species may be effectively grown in greenhouses or plant factories [11,12]. Previous studies have indicated that, out of the total sunlight received by plants, 90% of the absorbed light consists of red and blue wavelengths [13]. Furthermore, the nutritional and functional status of lettuce, spinach, and radish were improved by blue and red light [12]. It has been reported that optimizing both the quality and quantity of light during the phytochrome photo stationary stage, by adjusting the ratio of active phytochrome to total phytochrome can enhance both crop production and quality [14]. Plantlets exposed to red fluorescent light grew weak, with much longer stems and small leaves, whereas plantlets exposed to blue light grew short, strong, and had well-developed leaves [3]. Increasing the proportion of red in the spectrum increased the leaf area [15]. In a previous study, the development of potato plantlets was examined under red, blue, and green LED lights, revealing that red light resulted in the most significant stem elongation, followed by green light, and then blue light. The highest fresh weight of potato shoots and roots was found under a wide light spectrum condition (white LED). Under a narrow spectrum (blue, red, and red/blue), the fresh weight was the lowest. Several researchers have suggested that genetic variances in responsiveness to light treatment exist among different potato cultivars within the species, and these variances are influenced by genetic diversity [16].
Considering the factors mentioned above, our goal was to optimize the LED light spectrum in our experiment. The objective was to examine how variations in the light spectrum impact potato plantlets and the early generation of seed tubers.
2. Materials and Methods
2.1. Plant Material
Professor Young-Seok Lim at Kangwon National University, a breeder of this cultivar, provided ’Happy King’ (also called ‘Unification’ and N-198) potato (Solanum tuberosum L.) for the experiments. The mother plant was multiplicated through in vitro processes under artificial white LED light (Bisol LED Light Co., Ltd., Seoul, Republic of Korea) with a photosynthetic photon flux density (PPFD) of 100 µmolm−2 s−1 in an aseptic medium (MS medium 4.41 g L−1; sucrose 30 g L−1; agar 8 g L−1, pH 5.6–5.8) in plastic culture vessel (8 cm × 12 cm; SPL Life Sciences Co., Ltd., Pocheon-si, Korea), where 10 plantlets/vessel were used for 30 days. The photoperiod, relative humidity (RH), and in vitro growth room temperature were 16/8 (day/night), 70%, and 25 °C.
2.2. Plant Growth Conditions and Light-Emitting Diode (LED) Settings and Nutrient Growth
The virus-free potato (Solanum tuberosum L.) plantlets (tested by ISK 20001/0025, Agdia, Inc., Elkhart, IN, USA) were transplanted to a steel-made chamber structure 80 cm × 60 cm × 80 cm outfitted covered by a black curtain (QINGDAO SUNTEN PLASTIC Co., Ltd., Qingdao, China), with various LED light (Bisol LED Light Co., Ltd., Seoul, Korea) combinations (Table 1). The 30-day-old plantlets were directly transplanted in the commercial substrates’ soil (Biosangtho. Co., Ltd., Suncheon, Korea), and the plant-growing pot was made of plastic with a height and diameter of 12 cm × 10 cm, which was placed in a steel-made light chamber. The photosynthetic photon flux density (PPFD) and the duration of placement in the chamber were 300 molm−2 s−1 and 16 h (6 a.m. to 10 p.m.), respectively, where the plant grew until harvesting (Figure 1). Growth nutrient solutions [17] were prepared by mixing nutrients with water, and they were supplied to the plants every day in the morning using a hand shower. Throughout the experiment, the quality of the nutrition solution (EC and pH) was checked daily. To maintain the pH, HCl (1 N) and NaOH (5 M) were used.

Table 1.
LED light spectrum combination.
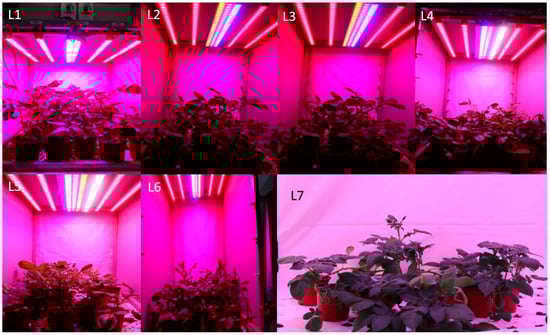
Figure 1.
Photograph of potato plant grown under different LED spectrums: (L1)—red70 + blue30; (L2)—red70 + blue20 + white10; (L3)—red70 + blue20 + green10; (L4)—red70 + blue20 + far-red10; (L5)—red60 + blue20 + green10 + white10; (L6)—red60 + blue20 + far-red10 + white10; (L7)—natural light.
2.3. Leaf Gas Exchange Measurement
The photosynthetic data were obtained 40 days after transplantation. The net photosynthetic rate (A, µmolm−2 s−1), the transpiration rate (E, mmolm−2 s−1), and stomatal conductance (gs, mmolm−2 s−1) were measured on well-developed leaves (the third node from the top) of six plants under each treatment using an LCpro gas analyzer (ADC BioScientific Ltd., Hoddesdon, UK). The level of A, gs, E, and WUE was measured under ambient environmental conditions. The measurements of gas exchange were taken at midday between 10.00 a.m. and 3.00 p.m. The photosynthetic water use efficiency (WUE) was calculated as the A/E ratio.
2.4. Analysis of Photosynthetic Pigments
The photosynthetic pigments of potato plants were investigated, including chlorophyll a (Chl a), chlorophyll b (Chl b), total chlorophyll (Tch), and carotenoid (Car). Three plant samples from each treatment were taken for the photosynthetic pigment analysis. Already harvested leaves were immediately immersed in liquid nitrogen and preserved at −80 °C for subsequent study. Fresh weight (500 mg) leaves were macerated in acetone (10 mL) with the use of a mortar and pestle and left at room temperature for 15 min to detect photosynthetic pigments. The extracted material was placed in a tube and centrifuged at 5000 rpm for 10 min. The absorbance was measured using a spectrophotometer at 647, 663, and 470 nm (UV-1800 240 V, Shimadzu Co., Ltd., Kyoto, Japan). The photosynthetic pigments were estimated using Lichtenthaler’s formula [18] and reported in milligrams per gram of fresh weight (FW).
Chl a = 12.25 × A663 − 2.79 ×A647
Chl b = 21.50 × A647 − 5.10 × A663
Car = [(1000 × A470) − (1.82 × Chl a) − (85.02 × Chl b)]/198
Tch = 7.15 × A663 + 18.71 × A647
2.5. SPAD Index Analysis
The SPAD (Soil–Plant Analysis Development) readings were taken 40 days after transplantation in the pot using a hand-held chlorophyll meter model SPAD-502 Plus (Konica Minolta, Tokyo, Japan). Before taking the readings, the instrument was calibrated with the reading checker according to the recommendations of the manual. Ten plants per plot were sampled, and readings were taken in the terminal leaflet of the fourth leaf fully expanded from the apex of the plant, avoiding reading in the central vein of the leaflets. When the potato plant did not have the fourth leaf fully expanded yet, the oldest leaf was chosen for SPAD readings. Care was taken not to sample unhealthy (pest attack and disease) and out-of-spacing plants. The SPAD readings were performed during the morning (8:00–10:00 a.m.), shading the device to avoid sunlight interference. In each leaf, three readings were taken, and values were averaged.
2.6. GA3 Analysis Pretreatment Methods
After freeze-drying (ilShinBioBase Co., Ltd., Donducheon, Korea), 0.2 g of the sample homogenized with a homogenizer was taken using a conical tube (SPL Life Science Co., Ltd., Pocheon, Korea), and 10 mL of purified water was added, and then the pH was adjusted to 3 using 96% sulfuric acid–water (1:1, v/v). After adding 20 mL of ethyl acetate, it was shaken at 300 rpm for 15 min with a shaking mixer and centrifuged at 4000 rpm for 5 min, and the supernatant (ethyl acetate layer) was taken; this process was repeated twice. After mixing the extracted ethyl acetate layer, 10 mL of pH 8.0 phosphate buffer was added. After shaking at 300 rpm for 15 min with a shaking mixer, centrifugation was carried out at 4000 rpm for 5 min. After that, an aqueous layer was collected, and the pH was adjusted to 3.0 using 96% sulfuric acid–water (1:1, v/v). After adding 10 mL of ethyl acetate (Tokyo Chemical Industry Co., Ltd., Tokyo, Japan), the mixture was shaken at 300 rpm with a shaking mixer (Hankuk S&I Co., Ltd., Hwaseong, Korea) for 15 min. The ethyl acetate layer was taken, and the organic solvent was volatilized with nitrogen at 45 °C to dry it completely; then, 300 µL of tetrahydrofuran (THF, Sigma-Aldrich Co., Ltd., St. Louis, MO, USA), 5 µL of triethylamine, and 40 µL of 0.2 M phenacyl bromide (Tokyo Chemical Industry Co., Ltd., Tokyo, Japan) were added. After mixing with a vortex mixer for 2 min, the reaction was carried out at 90 °C for 1 h. After the completion of the reaction, the test tube was cooled to room temperature and then completely dried at 40 °C. After dissolving the residue with 500 µL of methanol (JT Baker, Phillipsburg, NJ, USA), it was transferred to a vial for HPLC analysis (Shimadzu Co., Ltd., Kyoto, Japan, model: NEXRA XR).
2.7. Tuber Yield
Tubers were manually harvested 70 days after transplanting (DAT) and sorted to determine the total yield. After sorting, the tubers were counted and weighed to determine the tuber number (TN) per plant, the mean tuber fresh weight (TFW), and the grade of the tubers by weight, defined as <1 g, >1 g, or >3 g.
2.8. Statistical Analysis
Statistical analysis was conducted using Statistics 10 (Tallahassee, FL, USA), and a one-way analysis of variance was performed. All results are presented as mean ± SD (standard deviation). The mean differences were compared by Tukey’s post hoc multiple comparison test; p values < 0.05 were significant. Principal component analysis (PCA) was carried out using the OriginLab 10.0 software (OriginLab, Northampton, MA, USA).
3. Results and Discussion
3.1. The Morphological Characteristics of Potato Plants Grown under LED Light
The morphological response of potato plants varied under different light spectrums (Table 2). Compared to the control, L2 yielded 13.25%, 50%, 46.79%, and 76.92% more stem length, branch number, plant fresh weight, and dry weight, respectively. L4 and L5 also had a positive influence on stem length, which was enhanced by 2.01% and 8.41% compared to L7. Despite a shorter stem length, L3 resulted in a higher stem diameter (29.57%), leaf number (28.23%), and leaf width (18.89%) than L7.
Table 2.
The morphological parameters of plants grown under different LED light spectrums in artificial soil pot culture.
The light spectrum plays an important role in plant production under LED lighting. In our study, we analyzed the effect of the light spectrum and recorded the morphophysiological and photosynthetic activity of potato plant growth. The results revealed that a high ratio of red and blue light, along with green and white light, stimulated biomass production. The findings are partially supported by a previous study where green light, along with red and blue, resulted in the maximum biomass, and these were considered the most eye-friendly conditions [19]. Previous studies also revealed that LED light with a spectrum combination of red, blue, green, and far-red light more strongly stimulated biomass production, leaf expansion, and stem diameter of potato plants [20]. A similar pattern was recorded in our study in the case of leaf area under L3 (red + blue + green) and L4 (red + blue + far-red) treatments. This study also revealed that the inclusion of white and far-red either alone or in combination with red and blue light had a positive effect on plant biomass production. Similarly, the inclusion of green or far-red light, along with red and blue, enhanced leaf expansion. However, monochromatic red affects the plant’s normal growth and biomass [21]. Based on a previous study, the introduction of green LEDs to the combined spectrums of red and blue light resulted in a reduction in blue light. This reduction likely alleviated stem elongation inhibition significantly, leading to an increase in the morphological parameters and leaf area of potato plantlets [22].
3.2. Effects of Different LED Light Treatments on Chlorophyll Content
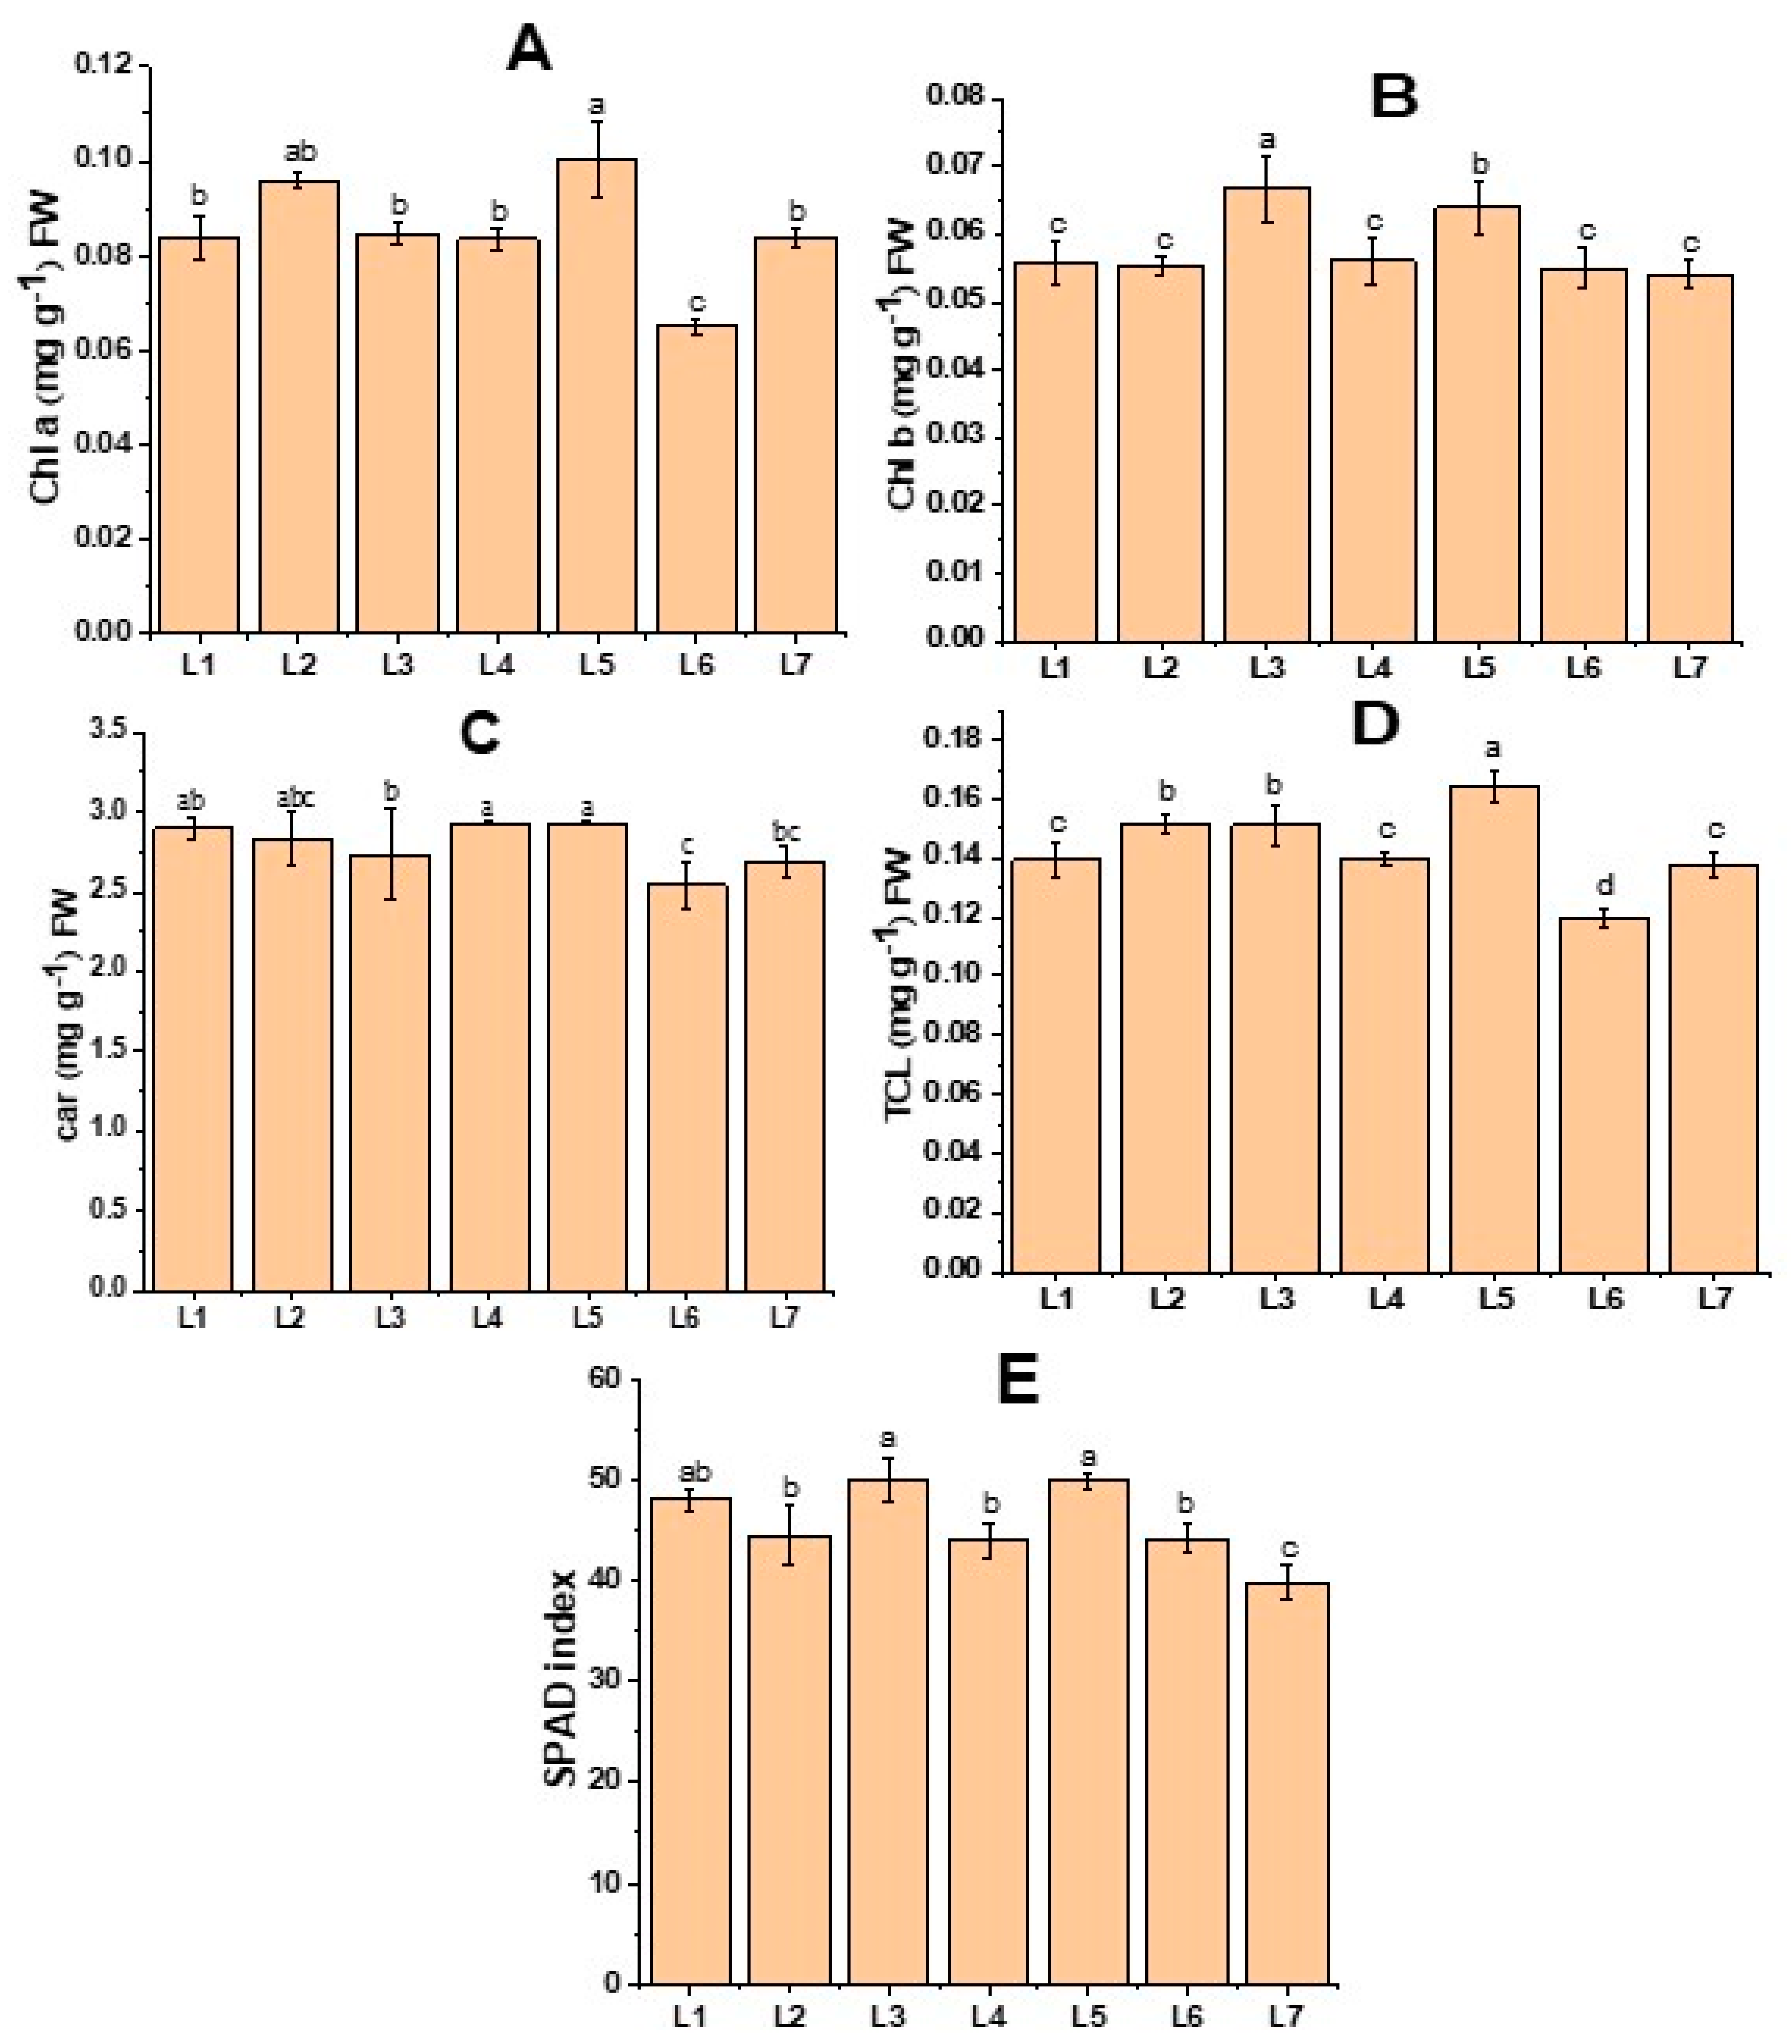
Figure 2 demonstrates the change in both the chlorophyll content and SPAD value of the potato leaves. Higher Chl b was recorded in L3, while L5 resulted in both higher Chl a and Tch content (Figure 2). Similarly, higher SPAD values were recorded in both L3 and L5 treatments. On the other hand, higher Car was observed in L4 and L5 treatments.
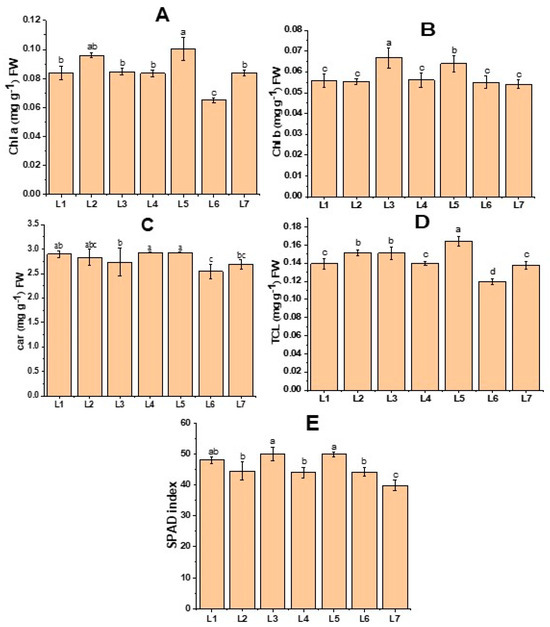
Figure 2.
Chlorophyll a (A), chlorophyll b (B), carotenoid (C), total chlorophyll (D), and SPAD index of potato plants grown under different LED light spectrums in artificial soil pot culture (E). Different letters indicate significant differences (p < 0.05) among the genotypes within each parameter. Values are expressed as mean ± SD (n = 3). L1—red70 + blue30; L2—red70 + blue20 + white10; L3—red70 + blue20 + green10; L4—red70 + blue20 + far-red10; L5—red60 + blue20 + green10 + white10; L6—red60 + blue20 + far-red10 + white10; L7—natural light.
Chlorophyll is a crucial component for the absorption of light. Therefore, the capacity for photosynthesis is enhanced as the amount of chlorophyll increases [23]. The photosynthetic antenna of plant pigment efficiently absorbs blue light, catalyzing the buildup of photosynthetic pigment in plant leaves [24]. When potato plantlets were grown under a monochromatic red light, a significant deformity in the chloroplast was observed. However, when a combination of red and blue light was used, the chloroplast in the leaf became more uniform, and the leaves became thicker [25]. When the red and blue spectrums were merged, the photosynthetic pigment exhibited a significant increase in comparison to other combinations of spectrums [26]. Furthermore, there is empirical evidence indicating that a greater proportion of green combined with red and blue LEDs results in increased chlorophyll accumulation [27]. This outcome supports our research, as the treatments L3 (red70 + blue20 + green10) and L5 (red60 + blue20 + green10 + white10), which had a higher concentration of green light, resulted in the augmentation of chlorophyll content (Figure 2).
3.3. Photosynthetic Gas Exchange under Different LED Treatment
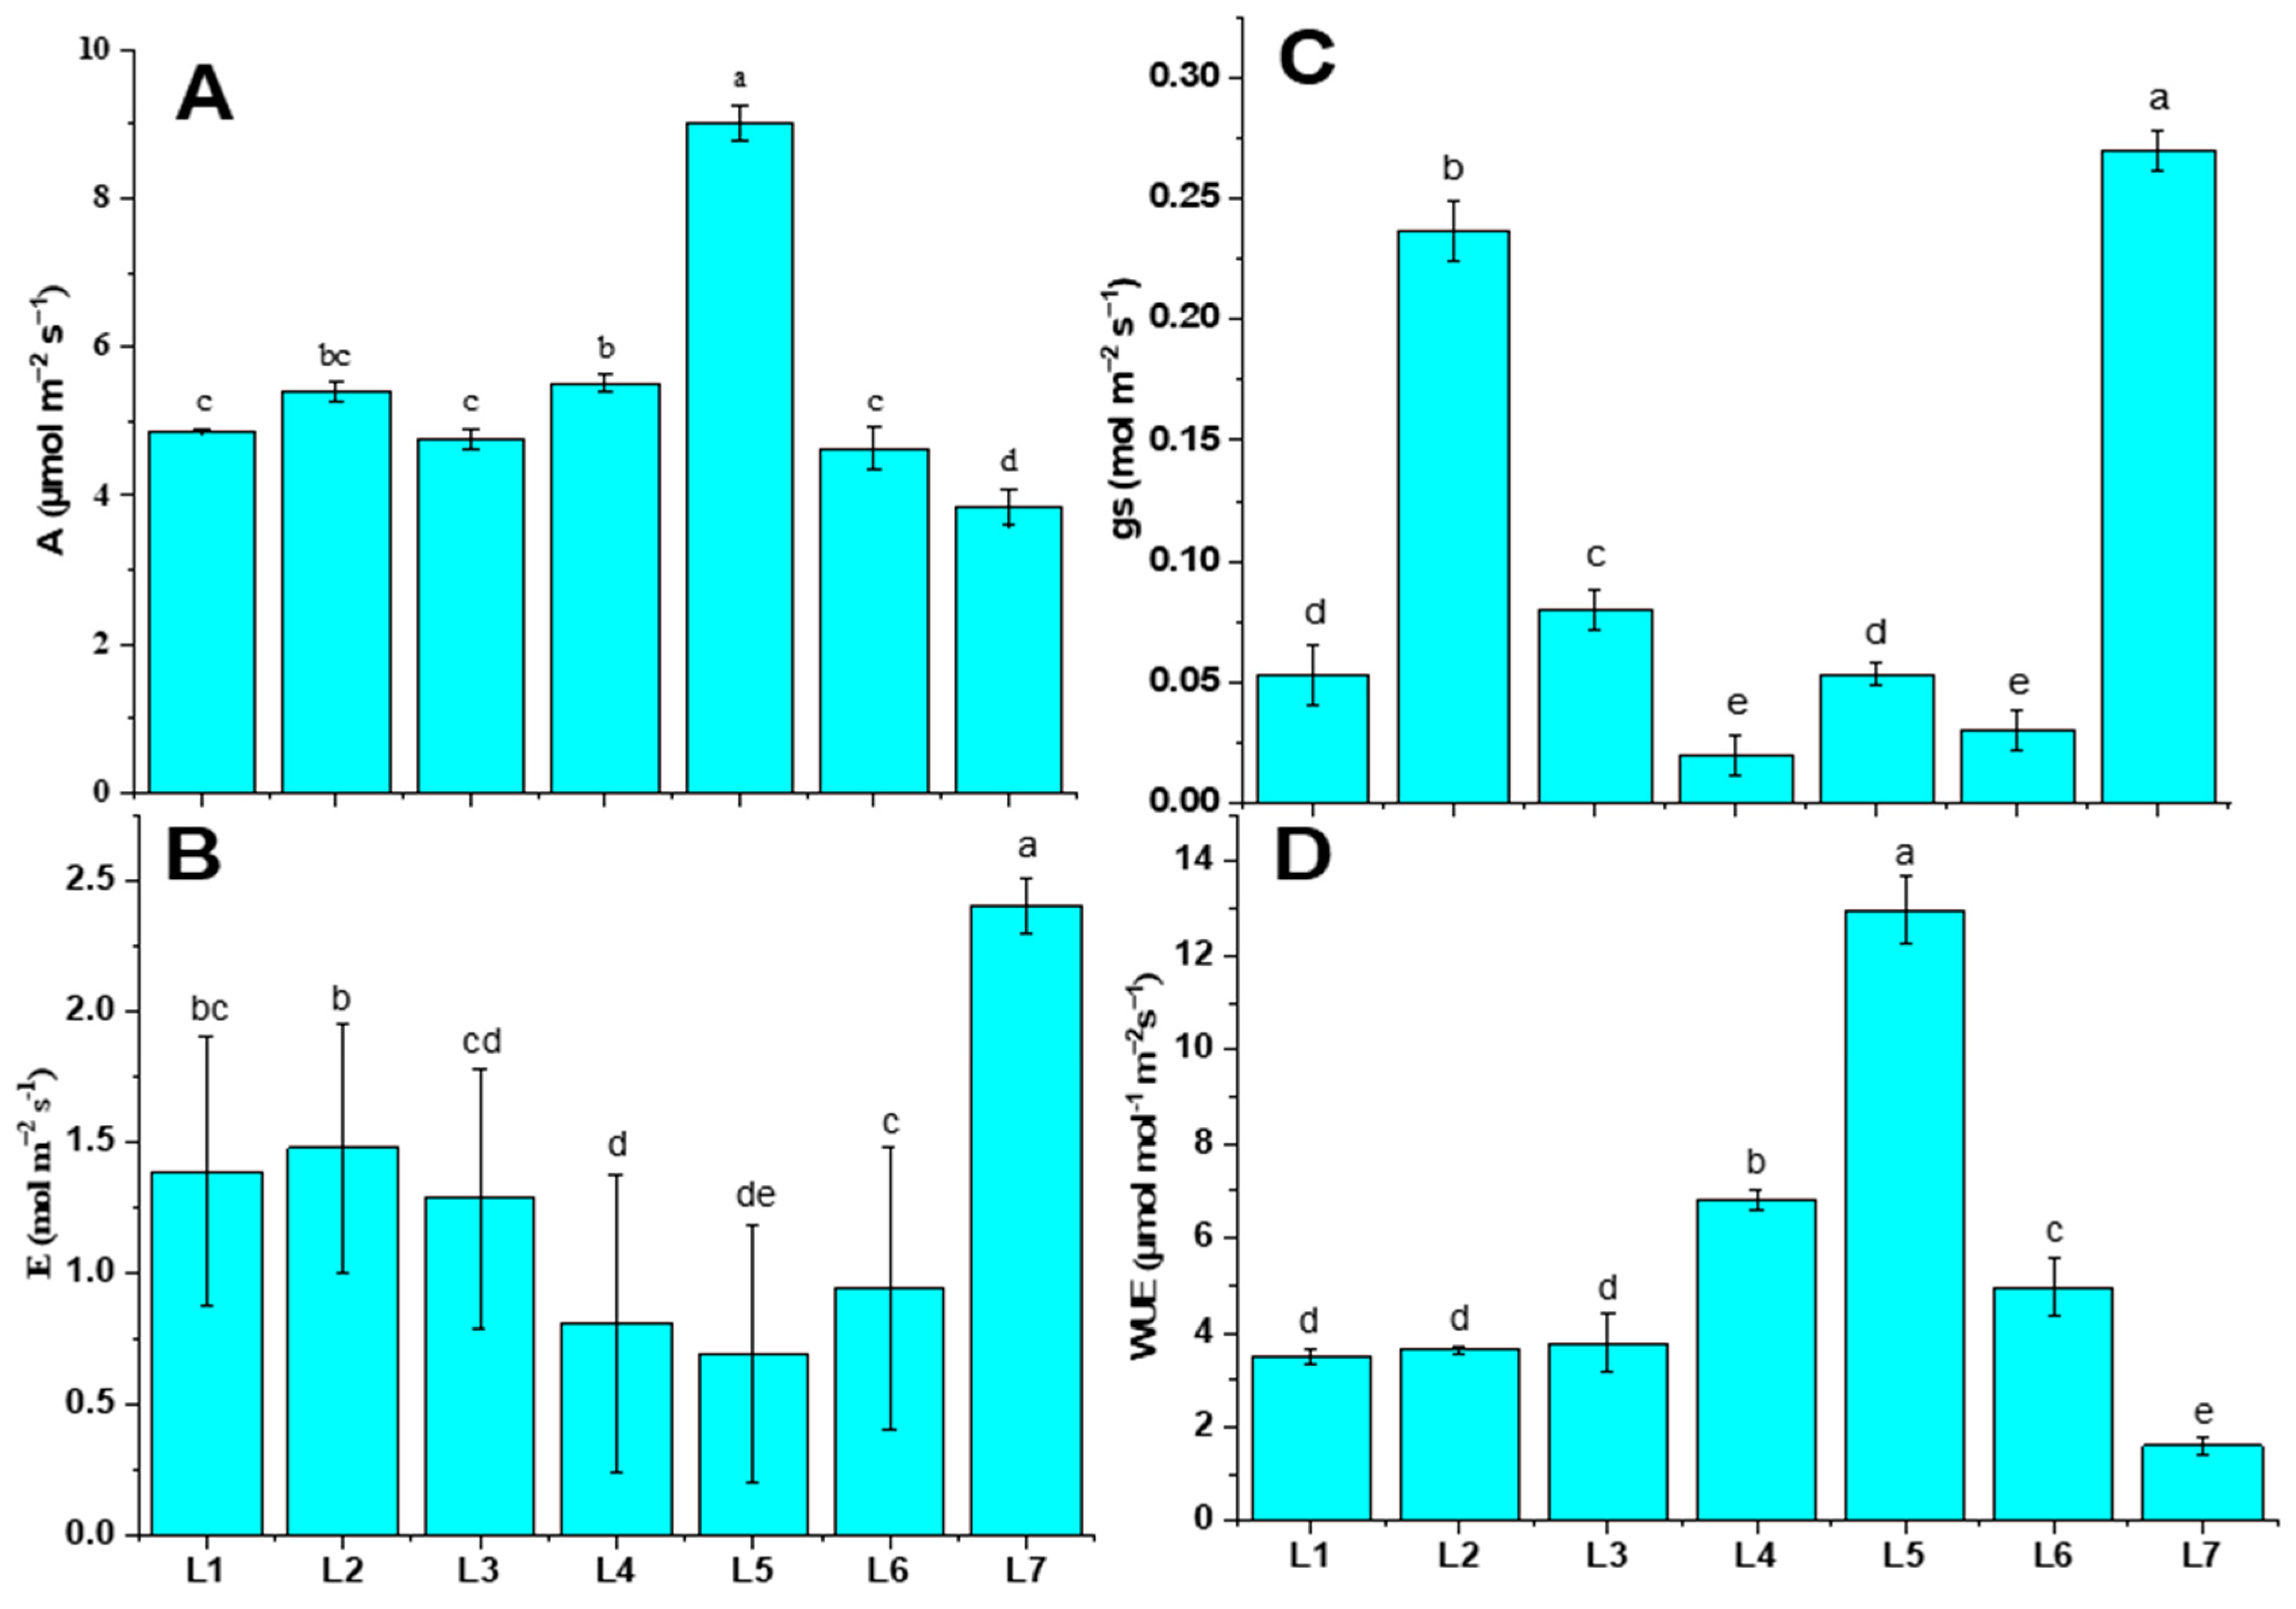
The photosynthetic activities were varied under different LED spectrums (Figure 3). The photosynthetic rate (A), the transpiration rate (E), stomatal conductance (gs), and water use efficiency (WUE) were analyzed in this study. Plants subjected to the L5 treatment were recorded with both higher A (9.01 µmol m−2 s−1) and WUE (12.98 µmol m−2 s−1), whereas they manifested minimal E (0.69 mol m−2 s−1). On the other hand, plants grown under control treatment (L7) were recorded with higher E (2.41 mol m−2 s−1) and gs (0.27 mol m−2 s−1).

Figure 3.
Net photosynthetic rate (A), transpiration rate (B), stomatal conductance (C), and water use efficiency (D) of potato plants grown under different LED spectrums in artificial soil pot culture. Different letters indicate significant differences (p < 0.05) among the genotypes within each parameter. Values are expressed as mean ± SD (n = 3). L1—red70 + blue30; L2—red70 + blue20 + white10; L3—red70 + blue20 + green10; L4—red70 + blue20 + far-red10; L5—red60 + blue20 + green10 + white10; L6—red60 + blue20 + far-red10 + white10; L7—natural light.
LED lights have gained wide attention in recent times for use in controlled environment agriculture due to their superior efficacy over traditional lighting technologies [28]. LEDs can have a narrow spectrum and excellent controllability. This presents unprecedented opportunities to manipulate crop growth and development by fine-tuning light spectrums and PPFD. Blue and red LEDs are more efficient than white and green LEDs [29]. Earlier findings revealed that a combination of red and blue light had a positive effect on stomatal opening (short-term) and stomatal conductance. However, the addition of far-red light in red and blue spectrums triggered the photosynthesis activity [30]. In our study, the L5 treatment enhanced parameter A by 57.38%, and at the same time, it led to a 7.25% lower performance of E, compared to L7. Green light is crucial in photosynthesis because it enables plants to adjust to varying light intensities. The wavelength-dependent absorption of chlorophylls allows green light to penetrate deeper into the leaves. This results in more uniform light absorption, providing excitation in the photosystem within deeper cell layers [31]. The inclusion of green light has been observed to enhance leaf photosynthesis under high photosynthetic photon flux density (PPFD) conditions. Despite plants evolving in the presence of sunlight for hundreds of millions of years, the relatively low absorption of green light has been considered a factor contributing to plant photosynthetic efficiency [31,32]. However, the current study presents contradictory results, as the addition of green light in the treatment showed poor photosynthesis performance in every parameter, specifically in L2 and L6 (Figure 3).
3.4. Potato Tuber Yield and Grading
The tuber number, tuber fresh weight, and tuber grading (>3 g, >1 g, <1 g) varied under different LED light treatments (Figure 4). L3 significantly enhanced the tuber number (by 60.06%) compared to L7, whereas a higher tuber fresh weight was recorded in L7 (8.57 g). On the other hand, L5 resulted in a 62.4% higher number of smaller-sized tubers (<1 g), while L2 and L4 led to 39.75% and 57.08% higher number of medium-sized tubers (>1 g), respectively, compared to L7.
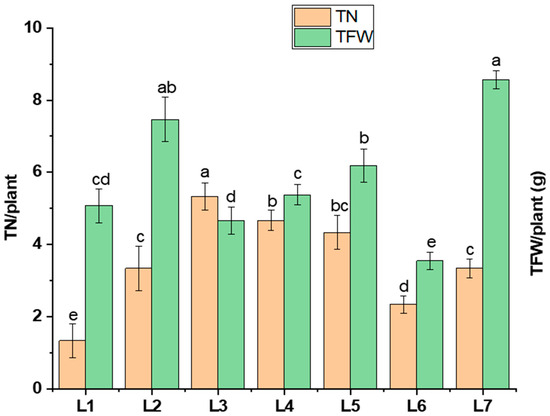
Figure 4.
Tuber number (TN/plant) and tuber fresh weight (TFW/plant) under different LED spectrums in artificial soil pot culture. Different letters indicate significant differences (p < 0.05) among the genotypes within each parameter. Values are expressed as mean ± SD (n = 3). L1—red70 + blue30; L2—red70 + blue20 + white10; L3—red70 + blue20 + green10; L4—red70 + blue20 + far-red10; L5—red60 + blue20 + green10 + white10; L6—red60 + blue20 + far-red10 + white10; L7—natural light.
This study investigated the pathway influencing potato tuberization under specific LED light spectrums, building on findings that revealed distinct impacts of different LED spectrums on this process. Diverse morphogenesis, photosynthetic pigments, photosynthetic response, and hormone levels were recorded under different spectrums of LED lights, which resulted in different yield performances. There were few indications suggesting that light affects potato tuberization [33]. Existing research has outlined the regulation of endogenous plant hormones like GA, ABA, and IAA through light-mediated processes [34]. Specifically, hormonal signals, particularly gibberellins (GAs) and cytokines, play a significant role [35]. The GA hormone is recognized as a crucial plant hormone responsible for regulating photoperiodic-mediated tuberization in potatoes. It has been demonstrated to induce stolon formation through longitudinal cell expansion achieved by the transverse orientation of microtubules and microfibrils to the cell axis [33]. The assumption is that light treatment successfully activates the plant growth-regulating hormones like cytokine and gibberellin, causing more tubers to form. More biosynthesis of endogenous gibberellin is initiated by the monochromatic red light spectrum. On the other hand, the combination of red and blue spectrums results in a static GA level, and the plant acquires growth signals such as stem elongation and stem diameter [5,36,37,38]. It has also been reported that the red and blue light spectrums increase the number of tubers per plant [25]. These findings partially support our current study (Figure 4). A previous study found that using red, blue, and white light together had a significant impact on the growth of stems. This ultimately resulted in the formation of tubers, with the weight of the tubers being highest when exposed to a combination of red, blue, and far-red light [5]. In our current study, we observed a similar pattern to earlier research. Specifically, the combination of red, blue, and green light in L3 (red70 + blue20 + green10), as well as the combination of red, blue, and far-red light in L4 (red70 + blue20 + far-red10), exhibited a positive impact on the number and fresh weight of tubers. This aligns with the positive influence on tuber development that was previously recorded in L2 (red70 + blue20 + white10) from the earlier study (Figure 4). Another hormone, indole acetic acid (IAA), improves the sink capacity of plant organs. Studies indicate that red light boosts the concentration of IAA (indole-3-acetic acid) in potatoes, facilitating the flow of assimilates into the tubers. The assimilation rate is crucial for determining the tuber size and weight [26,39,40]. Our current research aligns with this trend, revealing that larger tuber numbers were observed in L1 (red70 + blue30), with tubers exceeding 3 g in weight. Additionally, positive effects on tuber weight were noted in L4, where tubers exceeded both 3 g and 1 g, as illustrated in Figure 5.
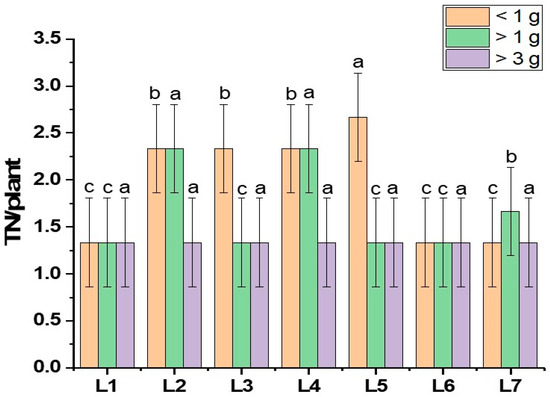
Figure 5.
Tuber grading of potato grown under different LED light spectrums in artificial soil pot culture. Different letters indicate significant differences (p < 0.05) among the genotypes within each parameter. Values are expressed as mean ± SD (n = 3). L1—red70 + blue30; L2—red70 + blue20 + white10; L3—red70 + blue20 + green10; L4—red70 + blue20 + far-red10; L5—red60 + blue20 + green10 + white10; L6—red60 + blue20 + far-red10 + white10; L7—natural light.
3.5. Gibberellic Acid Content Analysis
The gibberellic acid content (GA3) of potato plants grown under different LED light conditions is shown in Figure 6. The L1 treatment was recorded with significantly higher GA3 content (25.43% more than L7), whereas a minimal value was recorded in the L3 treatment.
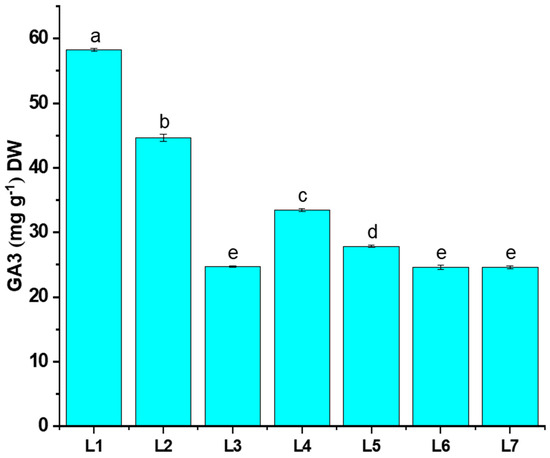
Figure 6.
Effect of different light spectrums on GA3 content of potato plants. Different letters indicate significant differences (p < 0.05) among the genotypes within each parameter. Values are expressed as mean ± SD (n = 3). L1—red70 + blue30; L2—red70 + blue20 + white10; L3—red70 + blue20 + green10; L4—red70 + blue20 + far-red10; L5—red60 + blue20 + green10 + white10; L6—red60 + blue20 + far-red10 + white10; L7—natural light.
Previous studies demonstrated that rice seedlings exposed to red LED light exhibited the highest GA3 content, fostering enhanced cell division. Consequently, rice seedlings subjected to the red LED light treatment displayed superior plant height and fresh weight [41,42]. These findings offer partial support to our current study, where the application of L1 (red70 + blue30) demonstrates a noteworthy impact on the GA3 content in potato plants, along with influencing morphophysiological traits (Figure 6). Hence, certain studies suggest that plants may be less responsive to GA when exposed to red light compared to when exposed to blue light alone. This is likely because red light inhibits positive GA signaling even when higher GA levels are present [43]. This contradicts our study, as we observed an increase in red light and elevated GA3 content with L2, L3, and L4 treatments (Figure 6). A lower GA3 content affected plant morphology, yet it resulted in an increase in the tuber number, leaf count, and leaf width, which was particularly evident in the L3 treatment (Figure 4 and Figure 6).
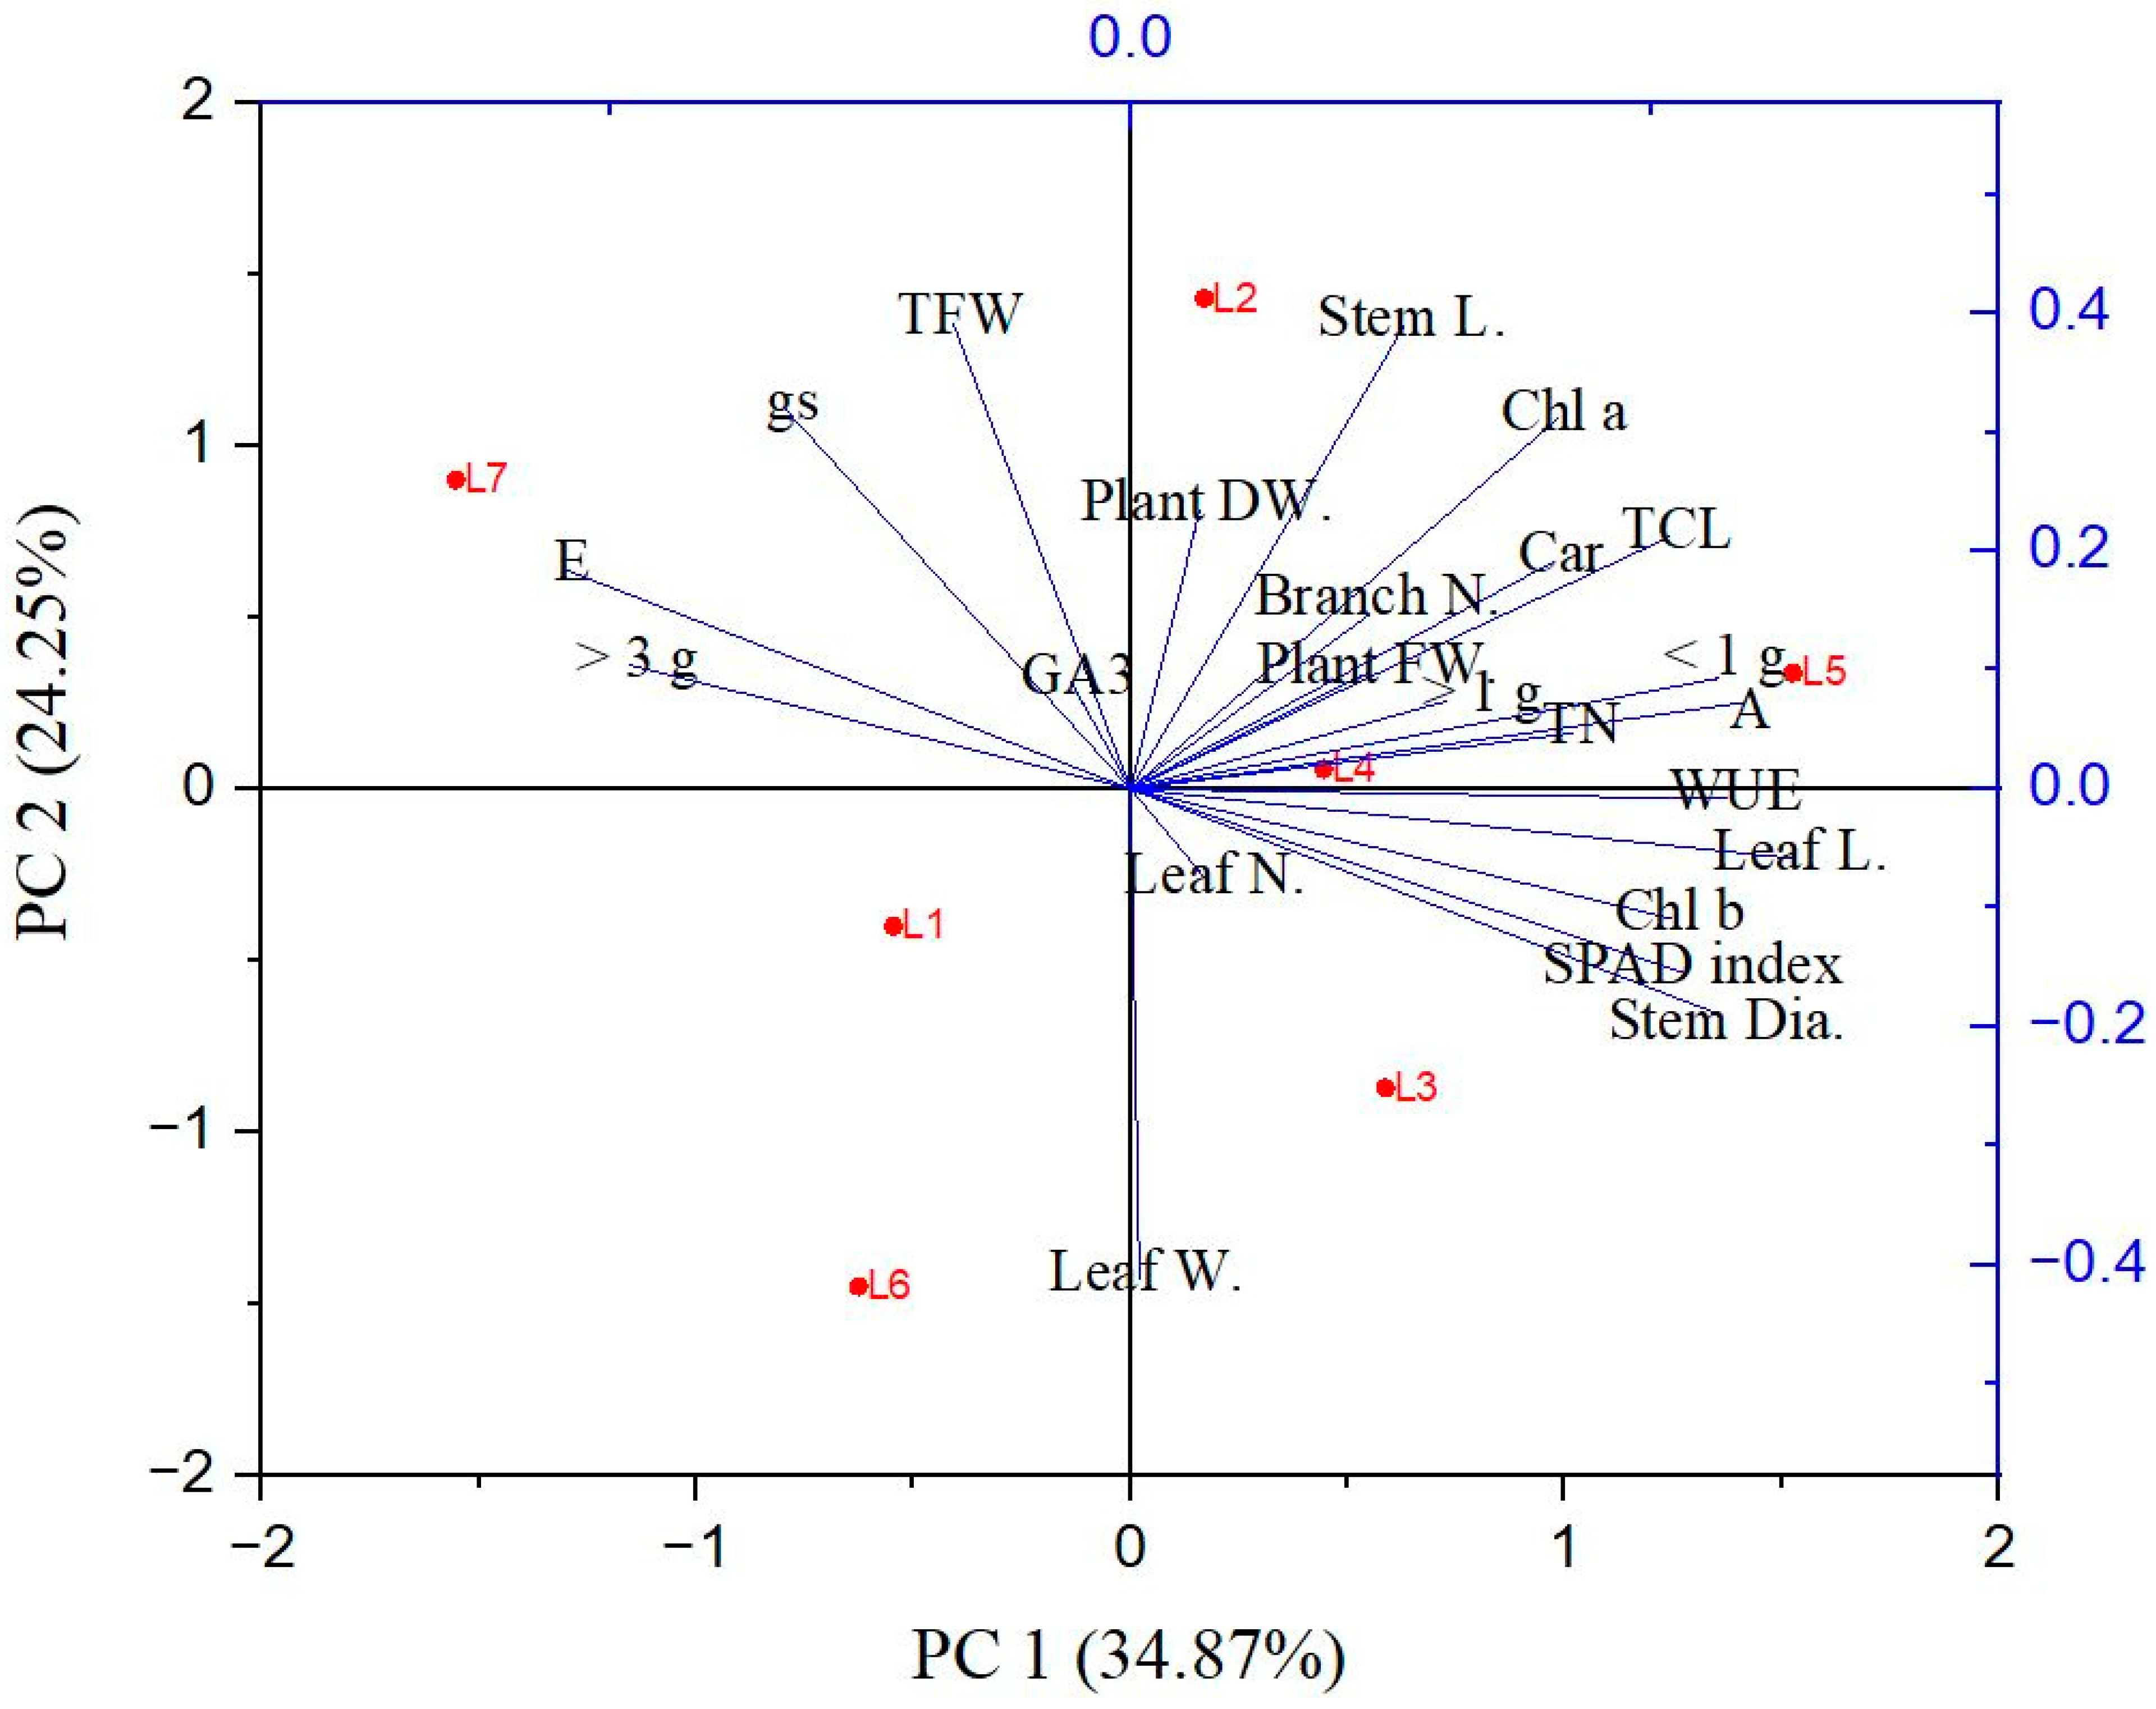
The PCA analysis was carried out to uncover the correlation of the different parameters with the different treatment groups. The PCA biplot reveals a clear segregation of the treatments into two groups. The elements of PC1 and PC2 together describe 59.12% of the variability in the data (Figure 7). From the analysis, it can be inferred that the L2, L3, L4, and L5 treatments are closely associated with each other, and most of the morphological characteristics, including the number of small- and medium-sized tubers, are clustered with them. On the other hand, the L1, L6, and L7 treatments are closely associated with each other and clustered with the transpiration rate, stomatal conductance, and the number of tubers with greater size.
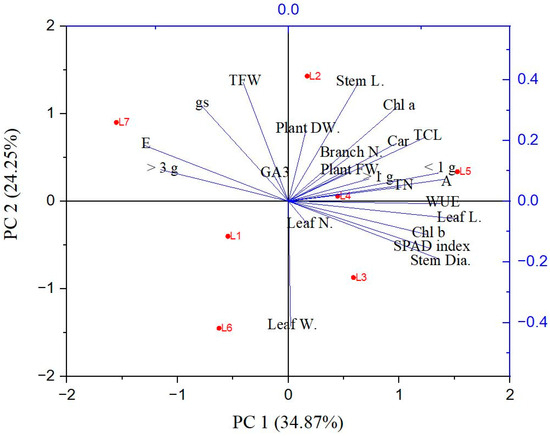
Figure 7.
Principal component analysis (PCA) represents patterns and associations among the treatments. L1—red70 + blue30; L2—red70 + blue20 + white10; L3—red70 + blue20 + green10; L4—red70 + blue20 + far-red10; L5—red60 + blue20 + green10 + white10; L6—red60 + blue20 + far-red10 + white10; L7—natural light. Lines started from the ballot’s center show negative or positive correlations between distinct light treatments. (Stem L, stem length); (Stem dia., stem diameter); (leaf N, leaf number); (Leaf L, leaf length); (Leaf W, leaf width); (Branch N, branch number); (Root L, root length); (PFW, plant fresh weight); (PDW, plant dry weight); (A, photosynthetic rate); (E, transpiration rate); (gs, stomatal conductance); (WUE, water use efficiency); (Chl a, chlorophyll a); (Chl b, chlorophyll b); (Tch, total chlorophyll); (Car, carotenoid); (SPAD index); (GA3, gibberellic acid content); (Tuber N, tuber number); (Tuber FW, tuber fresh weight); (Tuber N, tuber number); (TFW, tuber fresh weight); (<1 g, less than 1 g); (>1 g, more than 1 g); (>3 g, more than 3 g).
4. Conclusions
The L2 (red70 + blue20 + white10) and L4 (red70 + blue20 + far-red10) treatments with LEDs significantly increased the tuber count and size (>1 g, <1 g). These effects were observed alongside higher plant height, branch number, plant biomass with moderate GA3 levels, photosynthetic pigments, and activity. Following a comprehensive assessment of photomorphological, physiological, and tuberization performance, it was determined that the spectral compositions resulting from the L4 treatment, followed by L2, were the most favorable for seed potato tuberization. These findings represent initial breakthroughs in the cultivation of potato seed tubers using artificial light. They provide a basis for the development of an advanced LED lighting system specifically designed for producing early-generation potato seed tubers under artificial light conditions.
Author Contributions
M.H.R. designed the experiments, carried out all the experimental works, collected and analyzed the data, and drafted the final manuscript. M.J.I., U.H.M., B.-R.R., M.O.K.A. and J.-D.L. reviewed the manuscript draft. E.J.C. and Y.-S.L. supervised the study. All authors have read and agreed to the published version of the manuscript.
Funding
This research received no external funding.
Data Availability Statement
Data are contained within the article.
Acknowledgments
This research was supported by the BK21 FOUR funded by the Ministry of Education (MOE, Korea) and the National Research Foundation of Korea (NRF).
Conflicts of Interest
The authors declare no conflicts of interest.
References
- Da Rocha, P.S.G.; de Oliveira, R.P.; Scivittaro, W.B. New light sources for in-vitro potato micropropagation. Biosci. J. 2015, 31, 1312–1318. [Google Scholar] [CrossRef]
- Olle, M.; Viršile, A. The effects of light-emitting diode lighting on greenhouse plant growth and quality. Agric. Food Sci. 2013, 22, 223–234. [Google Scholar] [CrossRef]
- Grishchenko, O.V.; Subbotin, E.P.; Gafitskaya, I.V.; Vereshchagina, Y.V.; Burkovskaya, E.V.; Khrolenko, Y.A.; Grigorchuk, V.P.; Nakonechnaya, O.V.; Bulgakov, V.P.; Kulchin, Y.N. Growth of micropropagated Solanum tuberosum L. plantlets under artificial solar spectrum and different mono-and polychromatic LED lights. Hortic. Plant J. 2022, 8, 205–214. [Google Scholar] [CrossRef]
- Thomas-Sharma, S.; Abdurahman, A.; Ali, S.; Andrade-Piedra, J.L.; Bao, S.; Charkowski, A.O.; Crook, D.; Kadian, M.; Kromann, P.; Struik, P.C.; et al. Seed degeneration in potato: The need for an integrated seed health strategy to mitigate the problem in developing countries. Plant Pathol. 2016, 65, 3–16. [Google Scholar] [CrossRef]
- Rahman, M.H.; Azad, M.O.K.; Islam, M.J.; Rana, M.S.; Li, K.; Lim, Y.S. Production of Potato (Solanum tuberosum L.) Seed Tuber under Artificial LED Light Irradiation in Plant Factory. Plants 2021, 10, 297. [Google Scholar] [CrossRef]
- Hussain, A.; Qarshi, I.A.; Nazir, H.; Ullah, I. Plant tissue culture: Current status and opportunities. Recent Adv. Plant Vitr. Cult. 2012, 6, 1–28. [Google Scholar]
- Rongfu, G.; Hongming, Z. Advances of researches on photoregulation in plants. J. Beijing For. Univ. 2002, 24, 235–243. [Google Scholar]
- Islam, M.J.; Hassan, M.K.; Sarker, S.R.; Rahman, A.B.; Fakir, M.S.A. Light and temperature effects on sprout yield and its proximate composition and vitamin C content in lignosus and mung beans. J. Bangladesh Agric. Univ. 2017, 15, 248–254. [Google Scholar] [CrossRef]
- Wenke, L. Light environmental management for artificial protected horticulture. Agrotechnology 2012, 1, 101. [Google Scholar]
- Lin, K.-H.; Huang, M.-Y.; Huang, W.-D.; Hsu, M.-H.; Yang, Z.-W.; Yang, C.-M. The effects of red, blue, and white light-emitting diodes on the growth, development, and edible quality of hydroponically grown lettuce (Lactuca sativa L. var. capitata). Sci. Hortic. 2013, 150, 86–91. [Google Scholar] [CrossRef]
- Shimizu, H.; Saito, Y.; Nakashima, H.; Miyasaka, J.; Ohdoi, K. Light environment optimization for lettuce growth in plant factory. IFAC Proc. Vol. 2011, 44, 605–609. [Google Scholar] [CrossRef]
- Yorio, N.C.; Goins, G.D.; Kagie, H.R.; Wheeler, R.M.; Sager, J.C. Improving spinach, radish, and lettuce growth under red light-emitting diodes (LEDs) with blue light supplementation. HortScience 2001, 36, 380–383. [Google Scholar] [CrossRef] [PubMed]
- Terashima, I.; Fujita, T.; Inoue, T.; Chow, W.S.; Oguchi, R. Green light drives leaf photosynthesis more efficiently than red light in strong white light: Revisiting the enigmatic question of why leaves are green. Plant Cell Physiol. 2009, 50, 684–697. [Google Scholar] [CrossRef]
- Hanyu, H.; Shoji, K. Acceleration of growth in spinach by short-term exposure to red and blue light at the beginning and at the end of the daily dark period. In Proceedings of the IV International ISHS Symposium on Artificial Lighting 580, Québec City, QC, Canada, 7–9 November 2000; pp. 145–150. [Google Scholar]
- Seabrook, J.E.A. Light effects on the growth and morphogenesis of potato (Solanum tuberosum) in vitro: A review. Am. J. Potato Res. 2005, 82, 353–367. [Google Scholar] [CrossRef]
- Paradiso, R.; Arena, C.; Rouphael, Y.; d’Aquino, L.; Makris, K.; Vitaglione, P.; De Pascale, S. Growth, photosynthetic activity and tuber quality of two potato cultivars in controlled environment as affected by light source. Plant Biosyst. Int. J. Deal. All Asp. Plant Biol. 2019, 153, 725–735. [Google Scholar] [CrossRef]
- Rahman, M.H.; Islam, M.J.; Azad, M.O.K.; Rana, M.S.; Ryu, B.R.; Lim, Y.-S. LED Light pre-treatment improves pre-basic seed potato (Solanum tuberosum L. cv. Golden King) production in the aeroponic system. Agronomy 2021, 11, 1627. [Google Scholar] [CrossRef]
- Lichtenthaler, H.K. Chlorophylls and carotenoids: Pigments of photosynthetic biomembranes. In Methods in Enzymology; Elsevier: Amsterdam, The Netherlands, 1987; Volume 148, pp. 350–382. ISBN 0076-6879. [Google Scholar]
- Han, T.; Vaganov, V.; Cao, S.; Li, Q.; Ling, L.; Cheng, X.; Peng, L.; Zhang, C.; Yakovlev, A.N.; Zhong, Y. Improving “color rendering” of LED lighting for the growth of lettuce. Sci. Rep. 2017, 7, 45944. [Google Scholar] [CrossRef]
- Schellenberger Costa, B.; Jungandreas, A.; Jakob, T.; Weisheit, W.; Mittag, M.; Wilhelm, C. Blue light is essential for high light acclimation and photoprotection in the diatom Phaeodactylum tricornutum. J. Exp. Bot. 2013, 64, 483–493. [Google Scholar] [CrossRef]
- Amoozgar, A.; Mohammadi, A.; Sabzalian, M.R. Impact of light-emitting diode irradiation on photosynthesis, phytochemical composition and mineral element content of lettuce cv. Grizzly. Photosynthetica 2017, 55, 85–95. [Google Scholar] [CrossRef]
- Ma, X.; Wang, Y.; Liu, M.; Xu, J.; Xu, Z. Effects of green and red lights on the growth and morphogenesis of potato (Solanum tuberosum L.) plantlets in vitro. Sci. Hortic. 2015, 190, 104–109. [Google Scholar] [CrossRef]
- Jiang, C.-D.; Jiang, G.-M.; Wang, X.; Li, L.-H.; Biswas, D.K.; Li, Y.-G. Increased photosynthetic activities and thermostability of photosystem II with leaf development of elm seedlings (Ulmus pumila) probed by the fast fluorescence rise OJIP. Environ. Exp. Bot. 2006, 58, 261–268. [Google Scholar] [CrossRef]
- Hogewoning, S.W.; Trouwborst, G.; Maljaars, H.; Poorter, H.; van Ieperen, W.; Harbinson, J. Blue light dose–responses of leaf photosynthesis, morphology, and chemical composition of Cucumis sativus grown under different combinations of red and blue light. J. Exp. Bot. 2010, 61, 3107–3117. [Google Scholar] [CrossRef] [PubMed]
- Chen, L.; Zhang, K.; Gong, X.; Wang, H.; Gao, Y.; Wang, X.; Zeng, Z.; Hu, Y. Effects of different LEDs light spectrum on the growth, leaf anatomy, and chloroplast ultrastructure of potato plantlets in vitro and minituber production after transplanting in the greenhouse. J. Integr. Agric. 2020, 19, 108–119. [Google Scholar] [CrossRef]
- HU, Y. Effects of red and blue LEDs on in vitro growth and microtuberization of potato single-node cuttings. Front. Agric. Sci. Eng. 2018, 5, 197–205. [Google Scholar]
- Islam, M.J.; Ryu, B.R.; Rahman, M.H.; Rana, M.S.; Cheong, E.J.; Wang, M.-H.; Lim, J.-D.; Hossain, M.A.; Lim, Y.-S. Cannabinoid accumulation in hemp depends on ROS generation and interlinked with morpho-physiological acclimation and plasticity under indoor LED environment. Front. Plant Sci. 2022, 13, 984410. [Google Scholar] [CrossRef] [PubMed]
- Stober, K.; Lee, K.; Yamada, M.; Pattison, M. Energy Savings Potential of SSL in Horticultural Applications; EERE Publication and Product Library: Washington, DC, USA, 2017. [Google Scholar]
- Kusuma, P.; Pattison, P.M.; Bugbee, B. From physics to fixtures to food: Current and potential LED efficacy. Hortic. Res. 2020, 7, 56. [Google Scholar] [CrossRef]
- Kalaitzoglou, P.; Van Ieperen, W.; Harbinson, J.; van der Meer, M.; Martinakos, S.; Weerheim, K.; Nicole, C.; Marcelis, L.F.M. Effects of continuous or end-of-day far-red light on tomato plant growth, morphology, light absorption, and fruit production. Front. Plant Sci. 2019, 10, 322. [Google Scholar] [CrossRef] [PubMed]
- Liu, J.; van Iersel, M.W. Photosynthetic Physiology of Blue, Green, and Red Light: Light Intensity Effects and Underlying Mechanisms. Front. Plant Sci. 2021, 12, 328. [Google Scholar] [CrossRef]
- Nishio, J.N. Why are higher plants green? Evolution of the higher plant photosynthetic pigment complement. Plant. Cell Environ. 2000, 23, 539–548. [Google Scholar] [CrossRef]
- Aksenova, N.P.; Konstantinova, T.N.; Chailakhyan, M.K. Morphogenetic effect of blue and red light in the illumination of underground and above-ground potato organs in in vitro cultivation. Dokl. Akad. Nauk SSSR 1989, 305, 508–512. [Google Scholar]
- Matsuo, S.; Nanya, K.; Imanishi, S.; Honda, I.; Goto, E. Effects of blue and red lights on gibberellin metabolism in tomato seedlings. Hortic. J. 2019, 88, 76–82. [Google Scholar] [CrossRef]
- Eviatar-Ribak, T.; Shalit-Kaneh, A.; Chappell-Maor, L.; Amsellem, Z.; Eshed, Y.; Lifschitz, E. A cytokinin-activating enzyme promotes tuber formation in tomato. Curr. Biol. 2013, 23, 1057–1064. [Google Scholar] [CrossRef]
- Poudel, P.R.; Kataoka, I.; Mochioka, R. Effect of red-and blue-light-emitting diodes on growth and morphogenesis of grapes. Plant Cell Tissue Organ Cult. 2008, 92, 147–153. [Google Scholar] [CrossRef]
- Nhut, D.T.; Takamura, T.; Watanabe, H.; Tanaka, M. Efficiency of a novel culture system by using light-emitting diode (LED) on in vitro and subsequent growth of micropropagated banana plantlets. In Proceedings of the I International Symposium on Acclimatization and Establishment of Micropropagated Plants 616, Macedonia, Greece, 19–22 September 2001; pp. 121–127. [Google Scholar]
- Nhut, D.T.; Takamura, T.; Watanabe, H.; Okamoto, K.; Tanaka, M. Responses of strawberry plantlets cultured in vitro under superbright red and blue light-emitting diodes (LEDs). Plant Cell Tissue Organ Cult. 2003, 73, 43–52. [Google Scholar] [CrossRef]
- Kara, A.N.; Kotov, A.A.; Bukhov, N.G. Specific distribution of gibberellins, cytokinins, indole-3-acetic acid, and abscisic acid in radish plants closely correlates with photomorphogenetic responses to blue or red light. J. Plant Physiol. 1997, 151, 51–59. [Google Scholar] [CrossRef]
- Asghari-Zakaria, R.; Maleki-Zanjani, B.; Sedghi, E. Effect of in vitro chitosan application on growth and minituber yield of Solanum tuberosum L. Plant Soil Environ. 2009, 55, 252–256. [Google Scholar] [CrossRef]
- Su, N.; Wu, Q.; Cui, J. Effects of monochromatic LED light quality on endogenous hormone content in leaves and hypocotyl of Cucumis sativus L. Chin. J. Appl. Environ. Biol 2014, 20, 45–49. [Google Scholar]
- YU, L.; SONG, C.; SUN, L.; LI, L.; XU, Z.; TANG, C. Effects of light-emitting diodes on tissue culture plantlets and seedlings of rice (Oryza sativa L.). J. Integr. Agric. 2020, 19, 1743–1754. [Google Scholar] [CrossRef]
- Fukuda, N.; Ajima, C.; Yukawa, T.; Olsen, J.E. Antagonistic action of blue and red light on shoot elongation in petunia depends on gibberellin, but the effects on flowering are not generally linked to gibberellin. Environ. Exp. Bot. 2016, 121, 102–111. [Google Scholar] [CrossRef]


Disclaimer/Publisher’s Note: The statements, opinions and data contained in all publications are solely those of the individual author(s) and contributor(s) and not of MDPI and/or the editor(s). MDPI and/or the editor(s) disclaim responsibility for any injury to people or property resulting from any ideas, methods, instructions or products referred to in the content. |
© 2024 by the authors. Licensee MDPI, Basel, Switzerland. This article is an open access article distributed under the terms and conditions of the Creative Commons Attribution (CC BY) license (https://creativecommons.org/licenses/by/4.0/).