Article

Microsatellite Sequence Polymorphisms Reveals Substantial Diversity in Caribbean Breadfruit [Artocarpus altilis (Parkinson) Fosberg] Germplasm

by
Oral O. Daley
1,*,
Angela T. Alleyne
2,
Laura B. Roberts-Nkrumah
1 and
Lambert A. Motilal
3
1
Department of Food Production, Faculty of Food and Agriculture, The University of the West Indies, St. Augustine 330912, Trinidad and Tobago
2
Department of Chemical and Biological Sciences, Faculty of Science and Technology, The University of the West Indies, Cavehill BB11000, Barbados
3
Cocoa Research Centre, The University of the West Indies, St. Augustine 330912, Trinidad and Tobago
*
Author to whom correspondence should be addressed.
Horticulturae 2024, 10(3), 253; https://doi.org/10.3390/horticulturae10030253
Submission received: 31 January 2024 / Revised: 25 February 2024 / Accepted: 29 February 2024 / Published: 6 March 2024
(This article belongs to the Special Issue Advances in Developmental Biology in Tree Fruit and Nut Crops)

Abstract

:
Breadfruit [Artocarpus altilis (Parkinson) Fosberg] is recognized as a tropical fruit tree crop with great potential to contribute to food and nutrition security in the Caribbean and other tropical regions. However, the genetic diversity and germplasm identification in the Caribbean and elsewhere are poorly understood and documented. This hampers the effective conservation and use of the genetic resources of this tree crop for commercial activities. This study assessed the genetic identity, diversity, ancestry, and phylogeny of breadfruit germplasm existing in the Caribbean and several newly introduced accessions using 117 SNPs from 10 SSR amplicon sequences. The results showed that there was high and comparable genetic diversity in the breadfruit germplasm in the Caribbean, and the newly introduced breadfruit accessions were based on nucleotide diversity ( π T ) 0.197 vs. 0.209, respectively, and nucleotide polymorphism ( θ W ) 0.312 vs. 0.297, respectively. Furthermore, the existing Caribbean breadfruit accessions and the newly introduced breadfruit accessions were statistically genetically undifferentiated from each other (p < 0.05). Ancestry and phylogeny analysis corroborated the genetic relatedness of these two groups, with accessions of these groups being present in both main germplasm clusters. This suggests that the existing Caribbean breadfruit germplasm harbors a higher level of genetic diversity than expected.

1. Introduction

Breadfruit [Artocarpus altilis (Parkinson) Fosberg] belongs to the family Moraceae and was domesticated in the Pacific, where it has been a traditional staple on many islands in the region [1]. Starting in the 16th century, small numbers of breadfruit cultivars were introduced worldwide because of the low maintenance requirement of the crop while being a nutritious food source [2,3,4]. It is currently cultivated in over 90 countries spread across the continents of Africa, Asia, Australia, North America, and South America [5]. Breadfruit is recognized as a tree crop with great potential to contribute to food and nutrition security and to alleviate hunger in many countries in these regions [6,7]. Hence, commercial breadfruit production systems are being encouraged. Yet, there is a paucity of reliable knowledge of the genetic diversity and cultivar identification of breadfruit in many of these countries, which could compromise commercial breadfruit production activities.
Breadfruit (A. altilis) belongs to a complex that includes its two closest relatives, the breadnut, A. camansi (Blanco), native to New Guinea in Western Melanesia, and dugdug, A. mariannensis (Trécul), native to the Mariana Islands in Micronesia, as well as interspecific hybrids of A. altilis × A. mariannensis [1]. A. camansi, a fertile diploid (2n = 2x = 56), is considered the wild ancestor of A. altilis, which, however, varies in ploidy and seededness, from fertile and sterile diploids to seedless triploids (2n = 3x = 84) [8]. These seedless triploids are most common in Eastern Polynesia and were distributed worldwide. A. mariannensis is also a seeded diploid (2n = 2x = 56), which, through hybridization with A. altilis, has also produced diploid and triploid hybrids that vary in seededness [8]. Seededness is related to pollen viability [9]. Breadfruit is mainly cross-pollinated because, typically, most male inflorescences appear before the female inflorescence [9,10]. Wind pollination apparently predominates because, while insects, mainly bees, may actively collect pollen from the male flowers, they are much less attracted to the female flowers [10]. Pollen viability in the seedless breadfruit is as low as 6%, and the fruits are parthenocarpic [9]. Apart from the variation in seededness, the tree, leaf, and fruit morphology of breadfruit cultivars may differ according to age and environmental conditions [11,12]. Seedless breadfruit cultivars are propagated vegetatively only, whereas the seeded types are propagated by seed and vegetative methods.
Traditionally, diversity studies in breadfruit have employed morphological traits that are time-consuming to use, and show environmental plasticity [11,13]. Furthermore, in breadfruit-growing areas, it is common to find morphologically distinct cultivars having the same name or a single cultivar having multiple names in one or more locations [14,15]. These conditions make it difficult to rely only on morphological characterization to understand the diversity and range of cultivars within the species. The use of molecular or DNA markers has helped to simplify the estimation of plant genetic diversity in several species and offers increased reliability over morphological techniques [16]. In contrast to morphological techniques, DNA-based methods are independent of environmental factors and are usually highly polymorphic for each locus [17,18]. Several DNA marker techniques are available and are important tools for diversity studies in plant germplasm, and some have been applied to breadfruit. Analysis of Restriction Fragment Length Polymorphism (RFLP) in chloroplast DNA (cpDNA) of breadfruit, jackfruit, and nine related species showed 30 mutation sites on eight endonucleases, while 12 other endonucleases were monomorphic but were unable to distinguish among four breadfruit genotypes [19]. Using sequence data from both plastid (trnL intron and trnL-F spacer) and nuclear (internal transcribed spacers 1 and 2, ITS) genome sequences, Zerega, et al. [1] confirmed the close relationship between A. altilis and A. camansi, as well as between A. altilis and A. mariannensis, and showed that all three species had a monophyletic lineage. Furthermore, Amplified Fragment Length Polymorphism (AFLP) analyses revealed that not only were A. camansi and A. mariannensis breadfruit’s closest relatives, but they were progenitor species [8]. AFLP marker analyses also revealed a high degree of genetic variation among six breadfruit populations in the Western Ghats of India [20]. Witherup, et al. [21] isolated 25 nuclear microsatellite loci from enriched genomic libraries of breadfruit, which were all polymorphic in at least four Artocarpus species. Zerega, et al. [22] used 19 of the 25 markers developed by Witherup, et al. [21] and characterized the diversity among 349 individual trees, which included three Artocarpus species. Fifteen chloroplast microsatellite loci were also identified in chloroplast sequences from four Artocarpus transcriptome assemblies [23]. The use of nuclear and microsatellite markers to examine 423 individual breadfruit tree from Oceania, the Caribbean, India, and the Seychelles revealed that there was a range in the level of genetic diversity across regions, and the diversity in some areas was greater than expected [24]. A further 50 new microsatellite loci were characterized in Artocarpus altilis (Moraceae) and two congeners to increase the number of available markers for genotyping breadfruit cultivars using next-generation sequencing [25]. Next-generation sequencing (NGS) was also used along with phylogenetic reconstruction of breadfruit lineage to attempt a match of breadfruit cultivars in the Caribbean with existing Polynesian types [26].
The studies using simple sequence repeats (SSRs) markers relied on the detection of variation in SSRs based on scoring SSRs alleles as the length of polymorphisms, with differences in amplicon size taken to represent differences in the repeat number in the SSRs [21,22,23,24,25]. However, the amplicon size also includes the length of the flanking regions, which may contain additional information such as single nucleotide polymorphisms (SNPs) and insertion/deletions [27]. Therefore, substantial polymorphic data are neglected when SSRs are described through amplicon size alone, and this type of result is prone to size homoplasy [28]. Furthermore, Barthe, et al. [27] reported higher levels of genetic diversity for amplicon sequence variation than for amplicon size variation. Additionally, the use of marker sequences offers the opportunity to analyze evolutionary events based on the presence of mutations and the rate at which they occur within the sequence [27]. Therefore, the objectives of this study were to assess the genetic diversity of breadfruit germplasm using SSRs amplicon sequences and to investigate the genetic relatedness and structure of the breadfruit germplasm, with various cultivar names, existing in the Caribbean since the 18th century, hereafter referred to as existing Caribbean accessions (ECA) and newly introduced accessions (NIA), consisting of breadfruit germplasm introduced to the Caribbean by the Ministry of Food Production, Trinidad and Tobago, in 1989 and The University of the West Indies (UWI) during the 1990s [29,30].

2. Materials and Methods

2.1. Plant Materials

Leaf tissue samples from 153 individual breadfruit trees were collected and placed in separate labeled plastic zipper bags containing silica gel at a ratio of 10 parts silica gel to 1 part leaf sample. The bagged samples were stored in iceboxes and transported to the laboratory at The University of the West Indies (UWI), St. Augustine, Trinidad and Tobago. These samples were collected in Jamaica (25 samples), Trinidad and Tobago (21 samples), St. Vincent and the Grenadines (19 samples), and St. Kitts and Nevis (2 samples) (Table 1). The remaining samples came from the UWI, St. Augustine campus, breadfruit germplasm collection (Table 1).

2.2. DNA Isolation and Purification

Total genomic DNA was extracted from the leaf tissue following the Wizard® Genomic DNA Purification Kit following the manufacturer’s recommended protocol (Promega Corporation, Madison, WI, USA). Approximately 0.4 g of leaf tissue was ground in liquid nitrogen using a mortar and pestle. The ground tissue was transferred to a 1.5 mL microcentrifuge tube, treated with 600 µL of nuclei lysis solution, and incubated at 65 °C for 15 min. Samples were retrieved, and 3 µL of RNase solution (4 mg/mL) was added to each sample, mixed by inversion, and incubated at 37 °C for 15 min. The samples were then cooled at ambient room temperature for 5 min, treated with 200 µL of protein precipitation solution, vortexed, and then centrifuged at 13,000× g for three minutes. The supernatant of each sample was pipette-transferred to a clean, labeled microcentrifuge tube containing 600 µL of room-temperature isopropanol, mixed by inversion, and then centrifuged at 13,000× g for one minute. The supernatant was decanted, and 600 µL of room temperature 70% ethanol was added to each sample. The samples were mixed by inversion and centrifuged at 13,000 rpm for one minute. The ethanol was then aspirated, and the DNA pellet was allowed to air dry at ambient temperature for 15 min, after which 100 µL of DNA rehydration solution was added. Immediately after rehydration, the DNA concentration and quality of the samples were measured and evaluated using a Nanodrop spectrophotometer 2000. All DNA samples were diluted using DNA rehydration solution to 25 ng/µL and stored at −80 °C until use.

2.3. PCR Amplification and Sequencing

Polymerase chain reaction was performed in a 50 µL reaction volume containing 25 µL PCR master mix (Promega Corporation), 0.5 µL CXR dye, 2 µL of 10 µM forward primer, 2 µL of 10 µM reverse primer, 12 µL sample DNA (25 ng/µL), and 8.5 µL sterile distilled water. Twenty-three primers (Witherup et al., 2013) synthesized by Integrated DNA Technologies (Integrated DNA Technologies, Coralville, IA, USA) were screened. The PCR reactions were performed in a 96-well microtiter plate using an Applied Biosystems 7300 Real-Time PCR System (Thermo Fisher Scientific Corporation, Waltham, MA, USA). After initial screening of 23 primers, 10 SSR markers with sequences previously described by Witherup, et al. [21] were selected for further use (Table 2).
The PCR reaction was optimized and carried out under the following conditions: initial denaturation at 95 °C for 15 min; 40 cycles of 94 °C for 30 s; 55 °C for 90 s; and 72 °C for 60 s; and a final extension at 60 °C for 30 min. Amplification was confirmed by electrophoresis in a 1.5% agarose gel, followed by staining with ethidium bromide, then visualized under UV light.
Ninety-five of the initial 153 samples collected were selected for sequencing. This included one breadnut (A. camansi), 91 A. altilis, and three A. altilis × A. mariannensis hybrids (Table 1). This selection was based on the quality of amplicons produced over all ten primer pairs and a deliberate attempt to represent as many cultivar names as possible, leaf and fruit morphological variations (Figure 1 and Figure 2), and collection sites. This resulted in multiple samples for some cultivars and single samples for other cultivars. Amplified amplicons were sent to Macrogen Inc. (Seoul, Republic of Korea) for sequencing using the Sanger method.

2.4. Data and Statistical Analysis

2.4.1. Sequence Editing and Alignment

Base calling, sequence editing, trimming, and multiple sequence alignment were accomplished using Geneious version 9.1.3 [31].

2.4.2. Polymorphism and Diversity Analysis

The level of genetic variation at the nucleotide level assessed as nucleotide diversity ( π T ) and nucleotide polymorphism ( θ W ) as well as SNP (parsimony informative sites), Tajima’s D test, Fu’s F test, and Harpending index, number of haplotypes, haplotype diversity (h), minimum number of recombination events (Rm), estimate of population recombination, and Wall’s B statistic were calculated and analyzed for each locus using the software package DnaSP version 5 [32]. This software was also used to estimate the extent of geographic structure at individual loci among the breadfruit samples using the Snm method [33] as well as estimate the population subdivision (FST) between the ECA and NIA groups.

2.4.3. Linkage Disequilibrium

The decay of linkage disequilibrium (LD) between parsimony informative sites within loci was estimated as r2 using DnaSP 5, following the methods of Remington, et al. [34].

2.4.4. Population Structure and Phylogenetic Analysis

SequenceMatrix [35] was used to concatenate all the sequences for each of the 95 accessions. The population structure was evaluated with the software BAPS: Bayesian Analysis of Population Structure [36,37] using an admixture model with no linkage. A phylogeny of the combined sequences was then constructed using the Neighbor Joining algorithm of PAUP Ver. 4.0b10 with a bootstrapping of 1000 iterations [38].

3. Results

3.1. Sequence Analysis

Amplicons from 10 SSR loci were sequenced in each of 91 A. altilis, three A. altilis × A. mariannensis, and one A. camansi sample. Sequence length varied from 150 to 370 bp and included indels. A total of 2560 bps of sequences were aligned over the 10 loci per individual sample, and close to 240,640 bps of sequence data were generated for all 95 samples. Across samples, indel polymorphism varied from 0 to 22, with a total of 89 indel polymorphisms in the dataset.
There were 486 single nucleotide polymorphisms (SNPs) (one SNP per 5.3 bp) in the complete dataset, of which 403 were parsimony informative sites and 83 were singletons (Table 3). When considered separately, ECA harbored 560 SNPs (one SNP per 4.6 bp), including 433 parsimony informative sites and 117 singletons, whereas NIA harbored 649 SNPs (one SNP per 3.9 bp), including 447 parsimony informative sites and 202 singletons (Table 3).
Nucleotide diversity ( π T ) for the dataset varied among the 10 loci from 0 to 0.269 (mean = 0.159), and nucleotide polymorphism ( θ W ) ranged from 0 to 0.355 (mean = 0.279) (Table 3). The average nucleotide diversity ( π T ) of the 10 loci was slightly lower among ECA compared to NIA ( π T = 0.197 vs. 0.209). However, the overall mean nucleotide polymorphism ( θ W ) was slightly higher for ECA compared to NIA ( θ W = 0.312 vs. 0.297) (Table 3). Furthermore, comparing the ECA and NIA subsamples revealed no significant difference in π T   (p > 0.690) and θ W   (p > 0.545).
In terms of allele frequency distribution among the full dataset, Tajima’s D value was significantly negative only at locus MAA140 (Table 3). When ECA and NIA were considered separately, the ECA accounted for a higher Tajima’s D value in loci MAA54A, MAA71, MAA85, MAA178B, and MAA251, whereas the NIA showed higher values for loci MAA40, MAA96, MAA140, MAA178A, and MAA182 (Table 3). On average, negative values of Tajima’s D and Fu’s F tests were returned for the ECA, NIA, and all samples. Positive Tajima’s D values were observed for 10% of loci in the ECA subset and 30% of loci in the NIA subset. A similar output for Fu’s F test was returned, except that the NIA subset had 20% positive loci. The Harpending index was low in all loci in the two groups and subsequently for the overall ECA, NIA, and all samples.

3.2. Identity Analysis

A total of 48 cultivar names and eight unidentified accessions were recorded for the 94 breadfruit samples. Total haplotype number and haplotype diversity (h) varied among loci and between the ECA and NIA germplasm groups. Among the total dataset of 94 breadfruit accessions, the haplotype number ranged from 29 to 93 (Table 4). Loci MAA140 and MAA178B provided the lowest and highest number of haplotypes, respectively (Table 4). Among the 62 ECA, the mean number of haplotypes detected was 50.30 (SE ± 15.27), which ranged from 28 for loci MAA182 and MAA54A to 62 for loci MAA71 and MAA178B (Table 4). The 32 samples from the newly introduced accession group had a mean number of haplotypes of 27.9 (SE ± 6.57), which ranged from 13 for locus MAA54A to 32 for loci MAA85, MAA178A, MAA178B, and MAA251 (Table 5). Mean haplotype diversity (h) was similar for both accession groups but slightly higher among the NIA (Table 5).
Linkage disequilibrium patterns were evaluated in terms of frequency distribution and rates of decay. The results of patterns of LD analyses are presented in Table 4 and Figure 3. Among 95 accessions, there were 117 polymorphic sites with 6876 pairwise comparisons, of which 475 were significant (p < 0.01) by Fisher’s exact test after Bonferroni corrections. When separated into their respective accession groups, 157 polymorphic sites were analyzed for ECA, which gave 12,246 pairwise comparisons, of which 876 were significant (p < 0.01) by Fisher’s exact test after Bonferroni corrections. On the other hand, 211 polymorphic sites were analyzed for NIA, which gave 22,155 pairwise comparisons, of which 927 were significant (p < 0.01) based on Fisher’s exact test after Bonferroni corrections. In general, pairwise sites of low association value (r2)~0.1 and separated by a short distance were in high percentages and common to both accession groups (Figure 1).

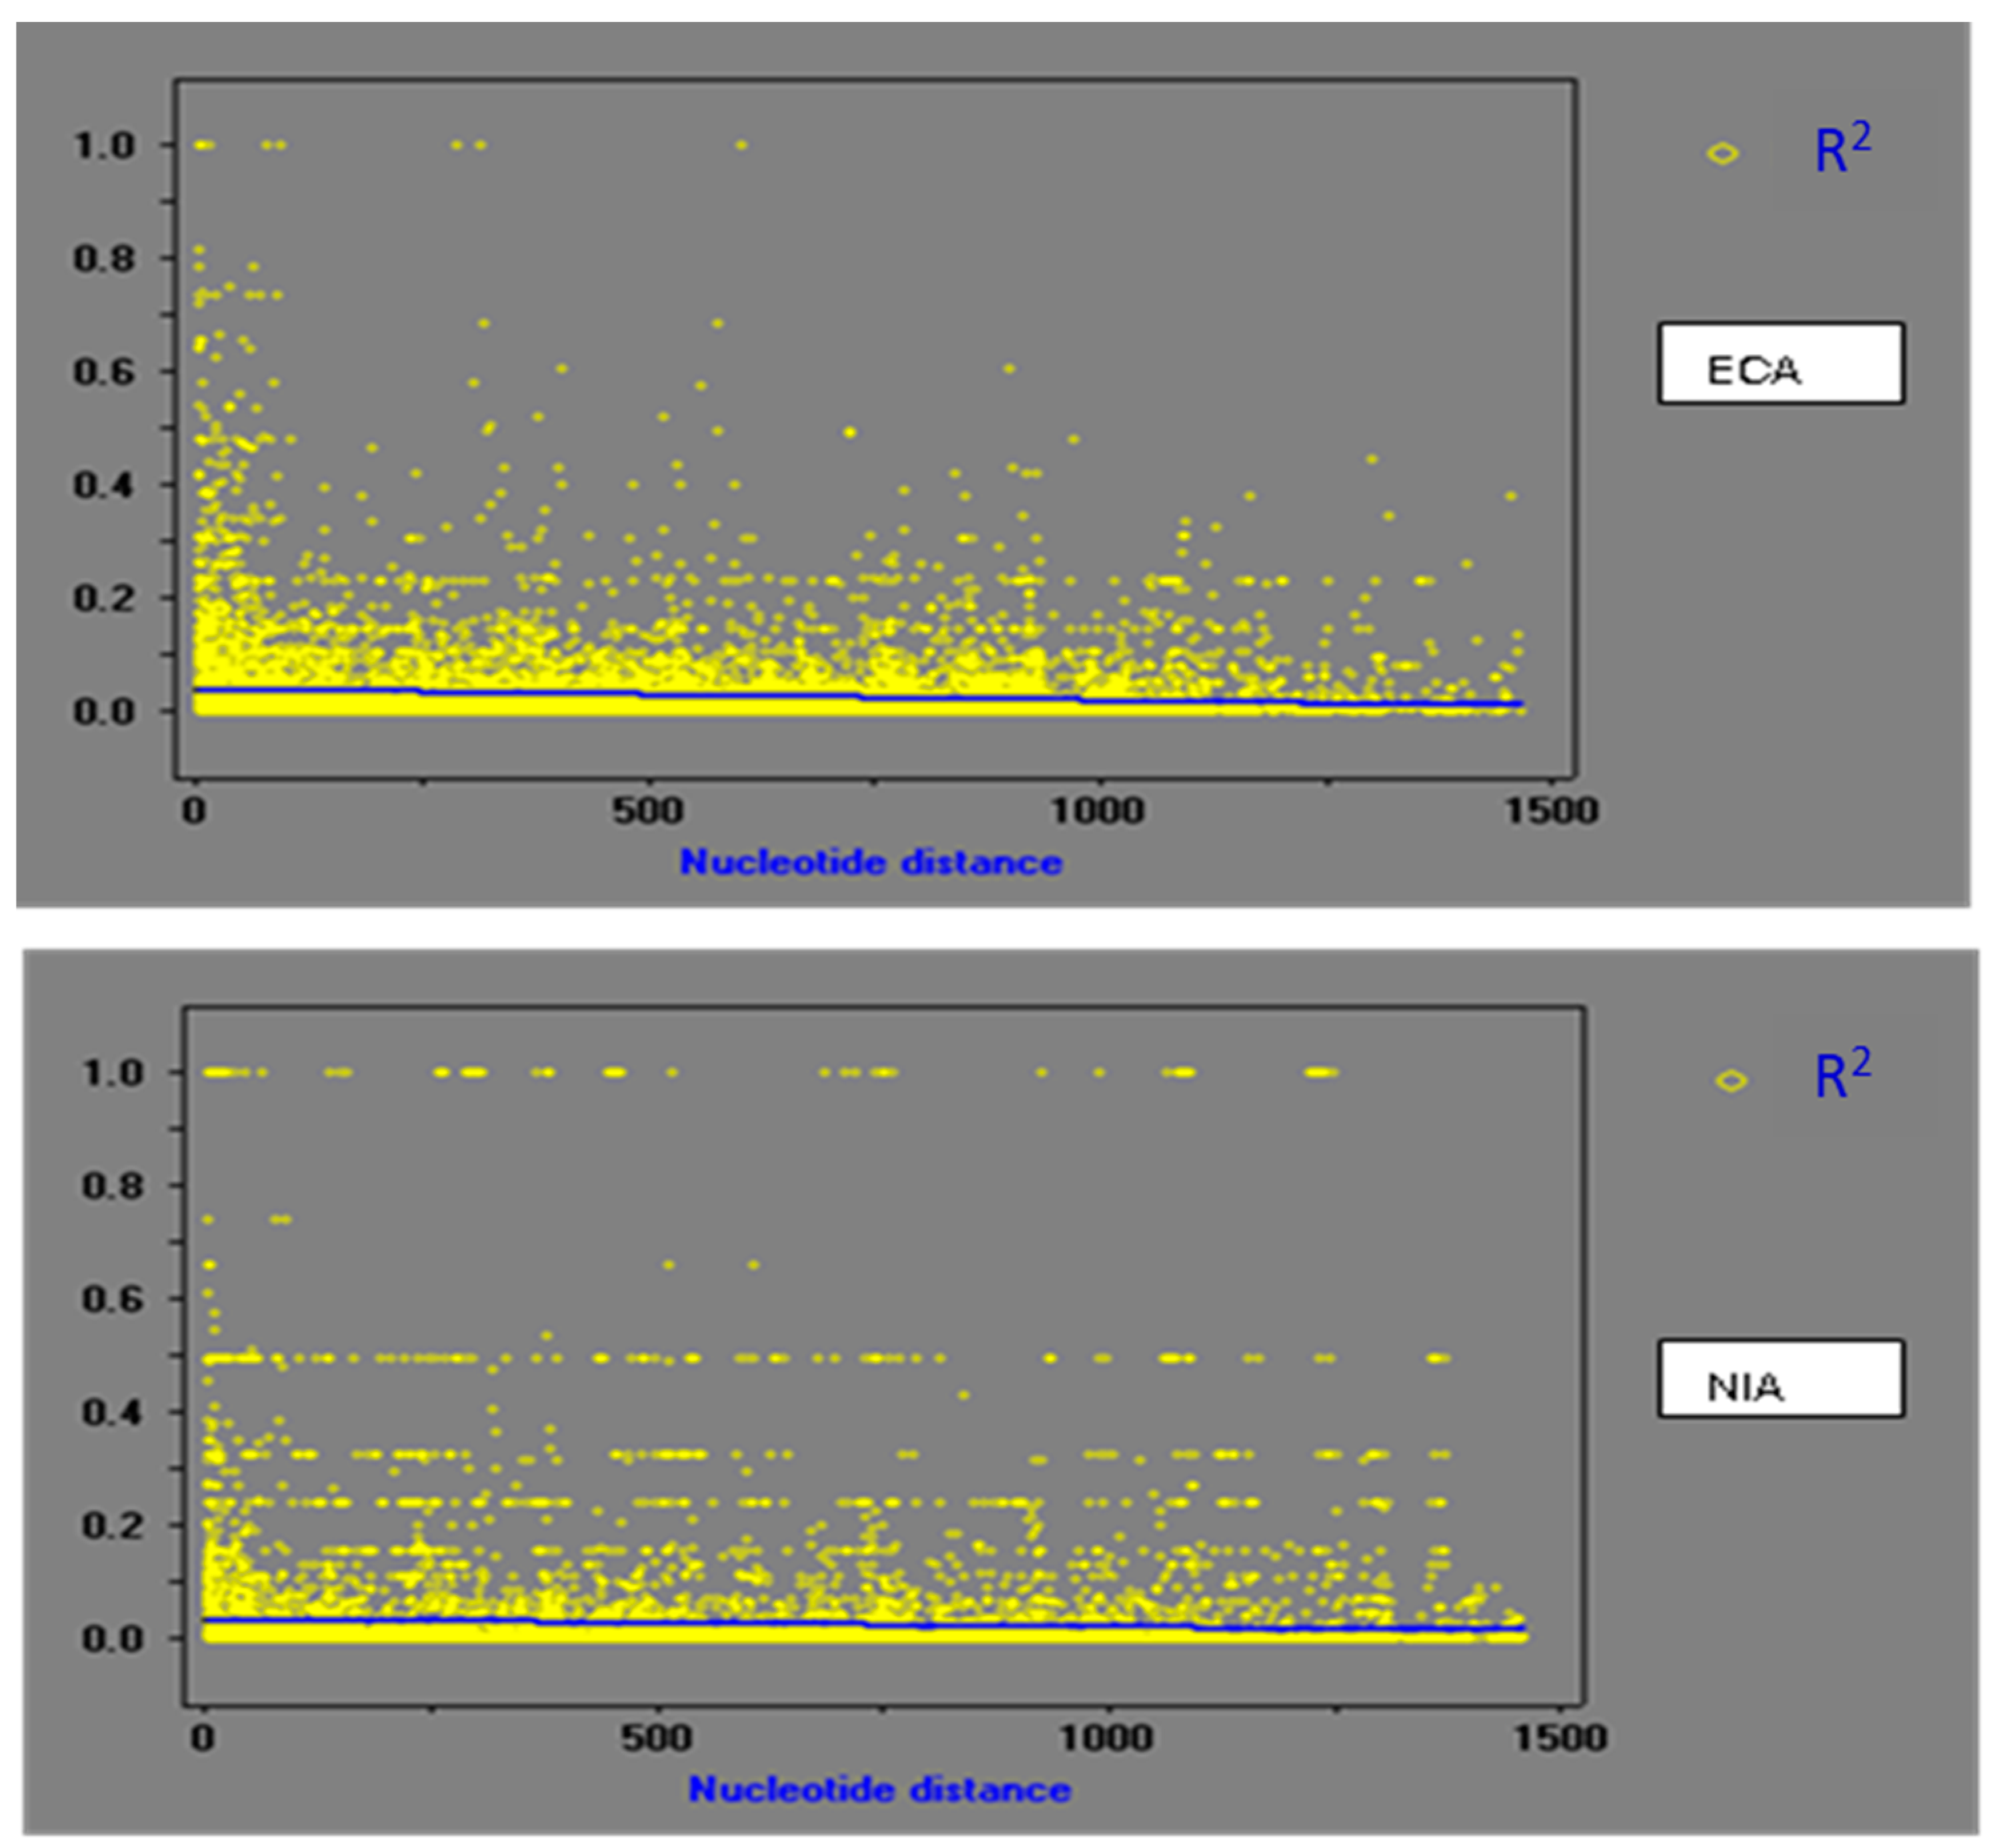
3.3. Population Recombination

Estimates of the population recombination parameter (ρ) based on Hudson [40] ranged from 0.129 to 1.173 (0.386 ± 0.315) in ECA and 0.087 to 1.196 (0.369 ± 0.336) in NIA. Similarly, the minimum number of recombination events ranged from 1 to 17 (9.400 ± 5.778) in ECA and 5 to 23 in NIA (11.100 ± 5.724), and Wall’s B ranged from 0 to 0.375 (0.093 ± 0.121) in ECA and 0 to 0.207 (0.068 ± 0.063) in NIA. There were no significant differences (p > 0.05) between the two groups for population recombination rates based on these three statistical tests.

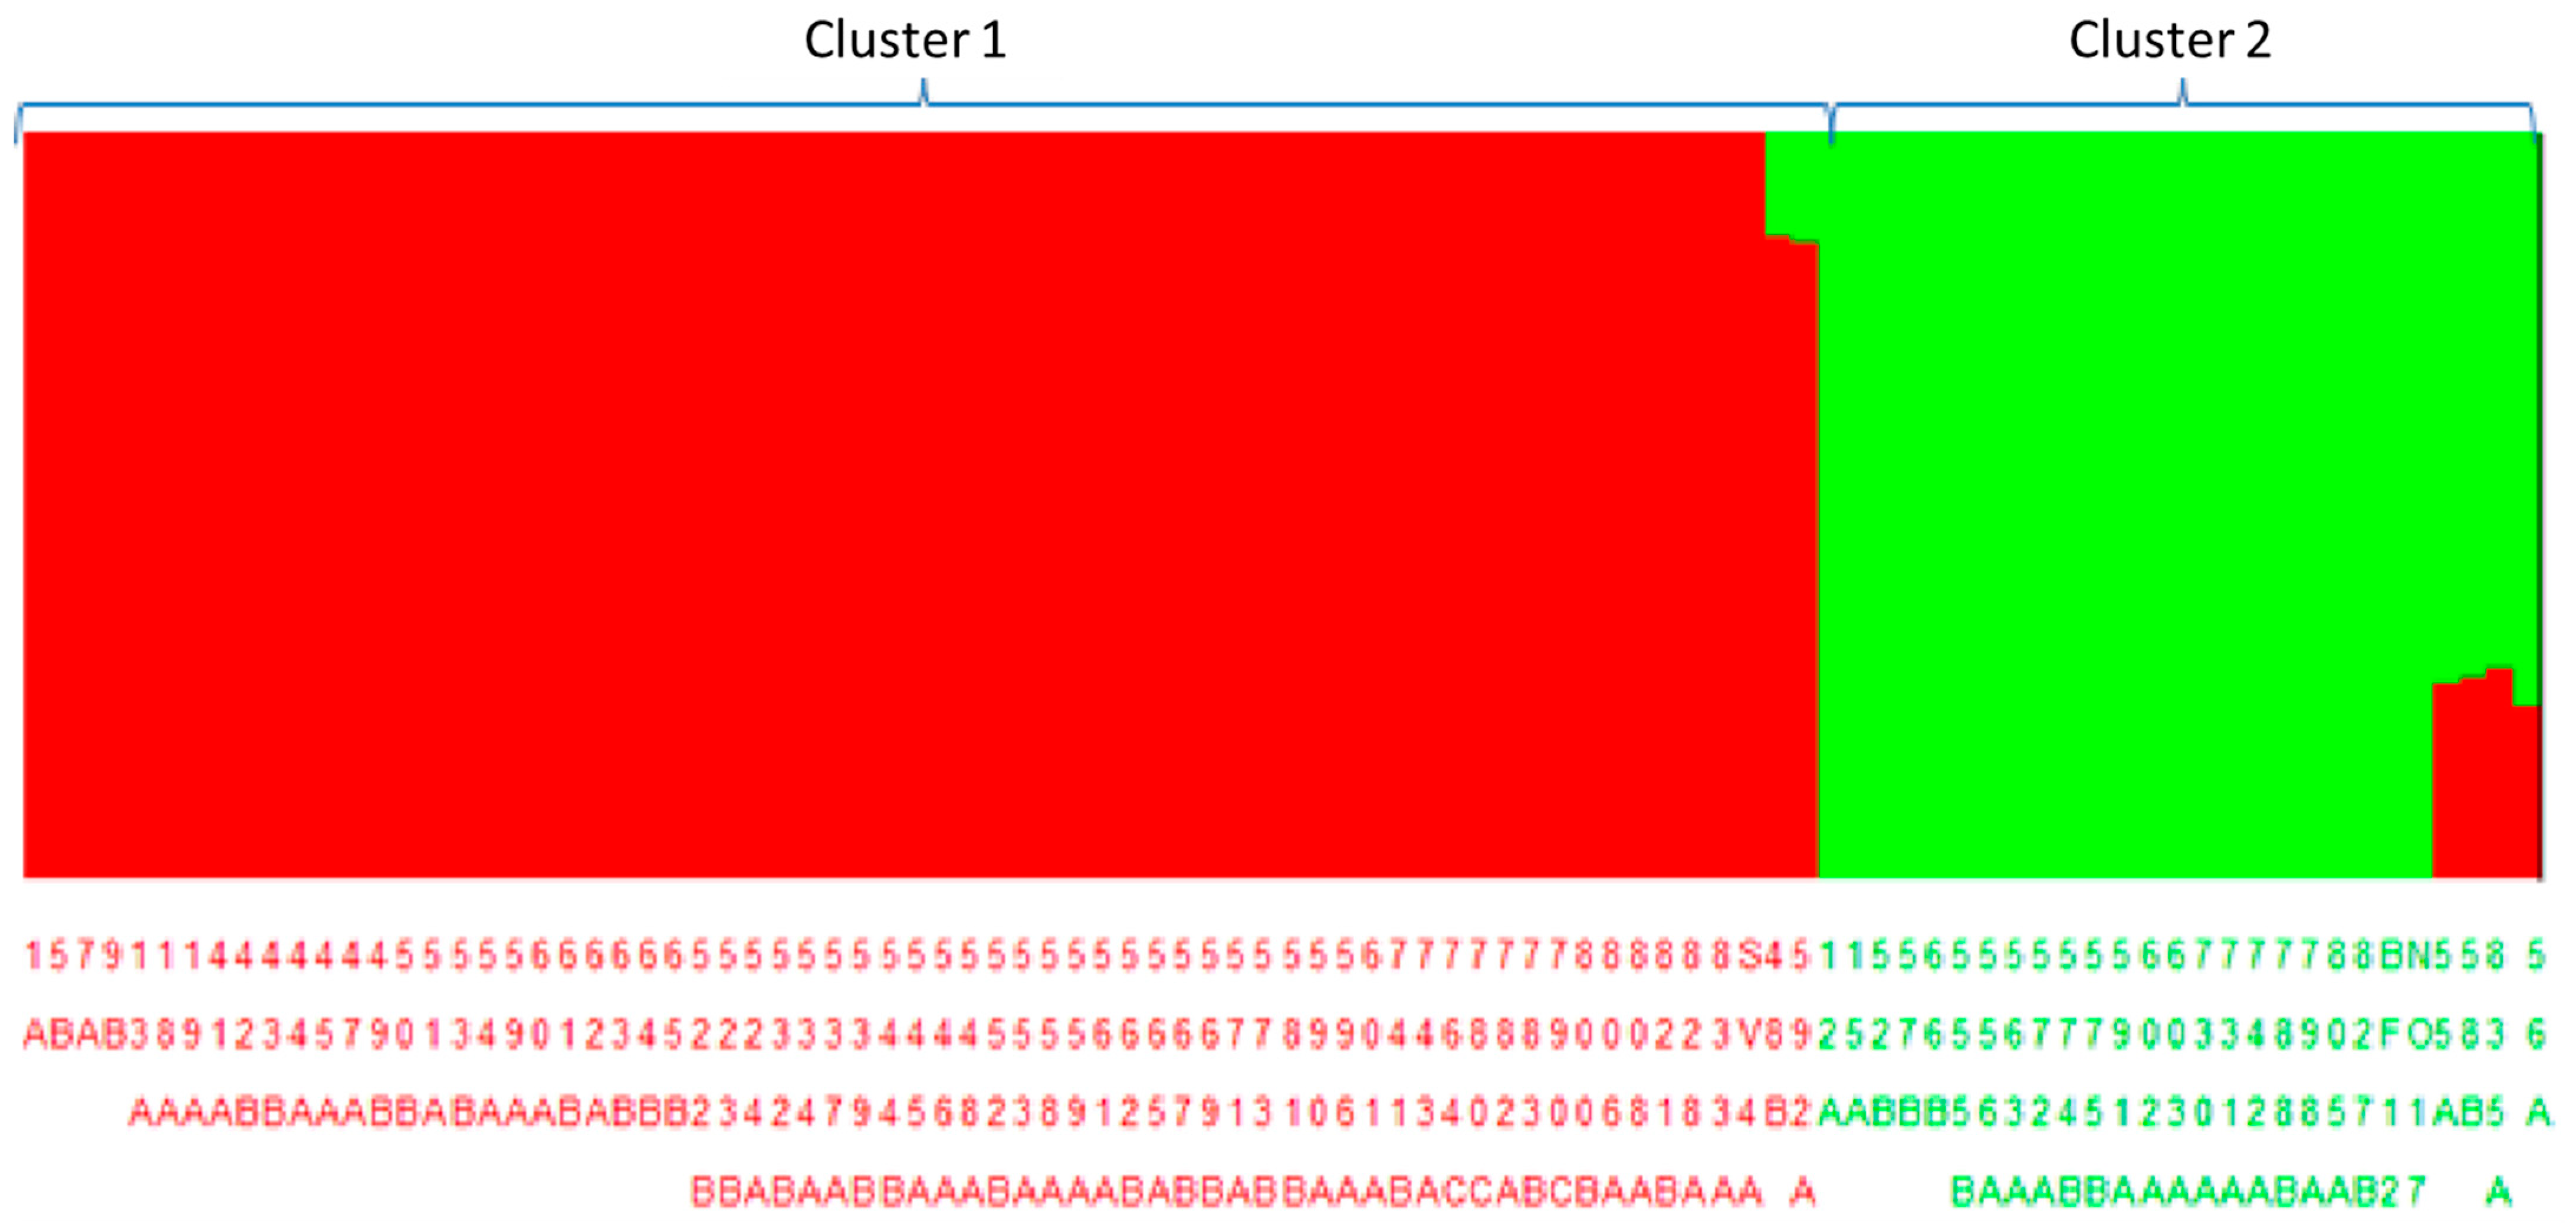
3.4. Population Structure and Demographic Analysis

The extent of geographic structure was estimated for ECA and NIA. FST values were obtained for nine of the ten loci used. Among the nine loci, FST varied between −0.0002 (MAA40) and 0.01095 (MAA251) with an overall mean of 0.0306 and revealed only slight differentiation among the two accession groups (Table 5). Significant (p < 0.05) values of Snn were detected in five loci (Table 5). Thus, at least 50% of loci demonstrated significant geographic structure. However, inspection of Bayesian clustering implemented by BAPS (Figure 2, did not show any distinction based on the assigned accession groups. Nevertheless, in both figures, two distinct clusters were formed among the accessions. They were classified as Cluster I, which contained 67 breadfruit accessions (66% of all accessions), and Cluster II, which contained 27 breadfruit accessions (27.8% of all accessions). Cluster I comprised 79% ECA and 21% NIA, while cluster II comprised 66.7% NIA and 33.3% ECA. Cluster I contained only triploid accessions that bore smooth or sandpapery-skinned fruit. Cluster II comprised all diploid (fertile and sterile) and all hybrid (A. altilis × A. mariannensis) accessions. However, cluster II also comprised rough-skinned triploid accessions.
Not all individuals with the same cultivar names (Table 1) shared the same cluster or sub-clusters (Figure 4). Most of the individuals in Cluster I did not form any sub-clusters. However, there were a few exceptions. A sub-cluster of eight individuals was formed with the newly introduced cultivar ‘Roiha’a’ and one unknown cultivar from the group of existing Caribbean accessions. Other individuals in this sub-cluster included two samples of the cultivar ‘Timor’, two samples of the cultivar ‘Yellow’ (one from Jamaica and one from Trinidad), two samples of the cultivar ‘White’ (one from Jamaica and one from Trinidad), and one ‘Captain Bligh’ from St. Vincent.
Most ECA with rough skin were grouped along with two newly introduced accessions, ‘Pu’upu’u’ and one unidentified sample. ‘Pu’upu’u’ is a NIA, which is a triploid, rough-skinned cultivar. The ECA in this sub-cluster were ‘Soursop’ and ‘Waterloo/Cotton’ from St. Vincent, ‘Macca’, ‘Couscous’, ‘Manbread’, ‘Brambram’, and ‘Monkey Breadfruit’ from Jamaica. Both ‘Choufchouf’ and ‘Kashee’ were both rough-skinned cultivars collected in Tobago and St. Vincent, respectively, and were unexpectedly not included in this cluster. The UWI breadfruit germplasm collection accession ‘Macca’ was also not included in this cluster but instead was grouped with smoothed-skinned triploid cultivars.
Four of five ‘Ma’afala’ samples were grouped together. The fifth sample was grouped with a sample called ‘Masunwa.’ Sample 58B, which is an unidentified diploid Pacific cultivar, formed a sub-cluster with the lone A. camansi sample. The three hybrids ‘Huehue’,‘Meinpadahk’ and ‘Piipiia’ were clustered together. The newly introduced diploid cultivars ‘Uluea’ and ‘Puou’ were grouped together (Figure 4).

4. Discussion

This study aimed to assess the level of genetic diversity of breadfruit at the molecular level and compare the diversity of existing Caribbean accessions (ECA) with newly introduced accessions (NIA) using SSR sequence. Based on sequence data, there was no significant difference between ECA and NIA, although the NIA had a slightly higher overall mean nucleotide diversity ( π T ) and the group of ECA had a slightly higher mean nucleotide polymorphism ( θ W ) (Table 3). The overall means for both nucleotide diversity and nucleotide polymorphism indicated a moderate but substantial genetic diversity for breadfruit in this study, but although there was considerable locus-to-locus variation among the 10 loci evaluated, there was no significant difference in the level of genetic variation between the two accession groups. This lack of significant differences in genetic diversity among the two accession groups was surprising given the fact that the group consisting of NIA included triploids, fertile diploids, and hybrid accessions and showed greater morphological variations compared to the ECA, which consisted of only triploids [11,24]. However, it is important to note that both accession groups were originally collected in the same sub-region of the Pacific, although they were collected at widely different times, and this could be a factor in the similarity observed in genetic diversity. In the first successful introduction of breadfruit to the Caribbean in 1793, all except one cultivar were collected in Tahiti, in Eastern Polynesia [41]. Many of the newly introduced accessions used in this study were also collected in Eastern Polynesia and maintained at the National Tropical Botanical Gardens (NTBG) in Hawaii, from where they were collected and brought to the Caribbean [29,42]. Furthermore, previous studies using SSR markers reported that A. altilis triploids, regardless of current distribution, and hybrids of A. altilis × A. marianensis were shown to belong to one genetic lineage and consist of a single genotype [22,24]. Also, although there have been several attempts, studies on breadfruit characterization have been unable to separate Caribbean triploids from triploids in Eastern Polynesia [22,24,26]. The diversity of breadfruit accessions in the Caribbean may reflect both its historical genetic base and the selection of types based on distinct sociocultural phenomena in this region [11].
Breadfruit showed higher genetic diversity than estimates for the outcrossing tropical tree species, avocado (Persea americana Mill) ( θ W = 0.007, π T = 0.0066) [43], and the highly outcrossed tree species Populus tremula ( π T = 0.0111) [44]. This higher level of genetic diversity for breadfruit compared with outcrossing species Persea americana and Populus tremula was unexpected, especially for existing Caribbean breadfruit accessions, which are propagated using vegetative means due to triploidy [9,24]. However, it is not unusual to find high levels of genetic diversity in triploid genotypes, which are vegetatively propagated. For example, within the genus Musa, triploid commercial cultivars, which are always propagated by vegetative means, showed higher levels of expected heterozygosity than wild diploid and improved hybrid diploid cultivars [45].
This is the first study that examined the genetic diversity of breadfruit based on the pattern of nucleotide diversity and nucleotide polymorphism using SSR amplicon sequence data. Nucleotide diversity is comparable to heterozygosity [46,47]. In a study on the genetic diversity of breadfruit in different regions of the world, Caribbean accessions showed the highest level of expected heterozygosity (He) (0.729) compared with those from East Polynesia (0.582), West Polynesia (0.659), Micronesia (0.684), Melanesia (0.686), and non-Oceania (0.677) [24]. The unexpectedly high He in Caribbean breadfruit germplasm was attributed to the small sample size (n = 5) in the Caribbean [24]. The high level of expected heterozygosity obtained in that study was also higher than the nucleotide diversity and nucleotide polymorphism reported in the present study, which used a much larger sample size of 65 existing Caribbean accessions. However, both studies suggest a higher-than-expected level of genetic diversity in existing Caribbean breadfruit accessions. Zerega, et al. [22] posit that a possible explanation for the high level of genetic diversity in triploid breadfruit is that the original triploid cultivars may have resulted from the capture of a wide diversity that became fixed and passed from generation to generation without genetic recombination. To further support this view, it has been shown that although most triploid breadfruit cultivars from Polynesia were derived solely from A. camansi, a significant number of cultivars also contained A. mariannensis-specific markers, which would likely have contributed to an increase in the overall genetic diversity of that sub-region [1].
Linkage disequilibrium is characterized as the nonrandom association of alleles at different loci and can be affected by most of the processes observed in population genetics, including mating pattern, frequency of recombination, and population history [48,49] Triploid and sterile breadfruit cultivars are propagated only by asexual methods such as cuttings and layering, while fertile diploids can reproduce sexually. The latter is expected to have an impact on the effective rate of recombination in populations where fertile diploid cultivars occur naturally [50]. Furthermore, breadfruit is an outcrossing species and hybridizes with A. mariannensis, which would support higher rates of recombination in populations or groups with fertile diploids compared to populations or groups having only triploids or sterile diploids [51,52]. For this reason, linkage disequilibrium, which is rarely used as a measure of genetic diversity in studies of asexually propagated species, was assessed in this study, in which the group of newly introduced accessions had four diploids and two hybrids (A. altilis × A. mariannensis) samples. The results showed no significant differences in the recombination events using the Hudson [53] recombination parameter and Wall’s B statistics between the two accession groups evaluated. Furthermore, the r2 was low, and the rate of decline in linkage disequilibrium was negligible in both accession groups. This result could also be a consequence of the A. mariannensis-specific marker in existing Caribbean breadfruit accessions. In other outcrossing species such as sunflower (Helianthus annus), Liu and Burke [54] reported extremely rapid decay of linkage disequilibrium to negligible levels at short distances. In contrast, Zhu, et al. [55] reported that there was little decay in linkage disequilibrium in the autogamous soybean (Glycine max).
The estimate of overall population differentiation between ECA and NIA using FST (0.0306) also indicated a strong similarity between both groups of accessions. Because most breadfruit cultivars are asexually reproduced, there is little or no opportunity for gene flow from one population to another; therefore, the similarity between both groups is most likely because of their common origin. This slight differentiation between both groups could also suggest that the duration of breadfruit cultivation in the Caribbean was not long enough to permit the development of Caribbean breadfruit germplasm with distinct genetic backgrounds. Similar results (FST = 0.04) have been reported for the outcrossing tropical tree Guaiacum sanctum, which suggests a high frequency of interpolation migration [56]. However, in a study with six breadfruit populations in the Western Ghats of India using five AFLP markers, Sreekumar, et al. [20] obtained a FST value of 0.574 and concluded that there was relatively high genetic differentiation between the populations studied. The use of AFLP markers in that study and the composition of the different breadfruit populations used are possible reasons for the high FST value reported.
The lack of separation of accessions based on the assigned groupings in the current study was also demonstrated in the clustering of accessions. The two main clusters that formed contained accessions from both accession groups. However, there was some differentiation of accessions, and some commonality could be observed among accessions within each cluster and sub-cluster. Based on previously reported ploidy and hybridization levels for accessions used in this study [22], it was observed that diploid and hybrid accessions formed tighter clusters and were more distinguishable from triploid accessions. Similar findings were also reported by Zerega, et al. [22]. In the present study, there were 12 diploid samples, which represented four cultivars and one A. camansi sample, and all the A. altilis samples were included in cluster II (Figure 4). Although cluster II also included some triploid cultivars, the diploid cultivars were grouped closer. The clustering of some triploid cultivars, along with diploid and hybrid cultivars, could possibly be linked to the existence of A. mariannensis specific markers in some triploid breadfruit cultivars because of their genetic background.
There was an inability to distinguish among many of the triploid accessions, including some that appeared morphologically distinct. For example, cultivars ‘Meitehid’, ‘Timor’, and ‘Cassava’, which showed clear differences in leaf shape, lobing, and leaf apex shape [11], were all grouped together in the same cluster. Zerega, et al. [22] also reported the inability of SSR markers to distinguish among many individual breadfruit accessions, which displayed clear differences in fruit and leaf morphological characteristics under the same growing conditions. Therefore, morphological diversity in breadfruit is not consistent with genetic diversity. Furthermore, previous studies, showed that many cultivars were misclassified based on discriminant analysis and other methods used to analyze the morphological data of breadfruit cultivars [11,12]. The UWI breadfruit germplasm collection accession ‘Macca’ was not grouped with other named ‘Macca’ cultivars collected throughout the Caribbean. It was felt that this accession was misnamed in the collection. Although not conclusive, the results of this study support the view that the accession in the UWI breadfruit germplasm collection called ‘Macca’ is different from other ‘Macca’ cultivars in the Caribbean. Ten SSR markers were used in this study, which is a relatively small number, and there is the possibility that they are not able to detect differences among many of these accessions at the genetic level. However, other researchers using a larger number of markers, also reported the inability to distinguish among some triploid breadfruit cultivars, which indicates that other factors must be considered for future assessments [22].
Cultivar names are essential in communicating plant species diversity. However, numerous names and synonyms can cause confusion and obscure the true diversity of a species. They can also contribute to wasteful duplication in gene banks and in conducting basic studies. In the current study, 43 cultivar names were used to represent the 94 breadfruit samples. Many of the cultivars, especially those recently introduced, were represented by a single sample, while others were deliberately represented by several samples. The inability to separate or distinguish among some cultivars could be based on the fact that, in some cases, there were different names representing the same cultivars [14]. The current study has helped to provide further insight into the genetic identities of breadfruit cultivars, especially those in the Caribbean. Yet, the inability to distinguish among some cultivars that are known to be morphologically distinct suggests that the markers were not targeting the genic regions of these morphological traits or were non-polymorphic in these regions. The negative estimates for Fu’s F test and Tajima’s D test in both ECA and NIA indicated an excess of alleles and of those rare alleles, respectively, following a population expansion after a bottleneck. This was corroborated by the low Harpending index. These findings are concomitant with a population size expansion after domestication by A. camansi. Furthermore, the inability to separate morphologically distinct cultivars may be linked to a few changes in the genome that govern these traits. Whole genome sequencing of triploid and diploid cultivars with variable morphological features should be undertaken to better understand the evolution of this tropical tree crop and identify SNP markers that would be useful for germplasm management and unambiguous cultivar identification.

5. Conclusions

The results of this study clearly showed that there was moderate but substantial genetic diversity in the breadfruit germplasm of both existing Caribbean accessions and newly introduced accessions. Some existing Caribbean accessions with clear morphological differences, as reported in previous studies [11,57], showed genetic similarity and remained unseparated in this study. Nevertheless, the results showed that microsatellite markers can be a useful tool in helping to map breadfruit genetic diversity and for linking genetic diversity to morphological and other phenotypic expressions. Understanding the genetic diversity along with morphological and other characteristics will assist with the selection of new cultivars to meet specific purposes. For example, it was determined that in terms of genetic diversity, newly introduced cultivars such as ‘Roiha’a’ were more genetically similar to the preferred local Caribbean cultivar ‘Yellow’ as compared to cultivars such as ‘Ma’afala.’ However, genetic similarity should not be the only basis for selecting new cultivars to add to the existing germplasm base for increased production and utilization of breadfruit. There are many factors that influence consumer choice and preference, and these are important for identifying new cultivars for commercial production and utilization.

Author Contributions

Conceptualization, O.O.D., A.T.A. and L.B.R.-N.; Data Curation, O.O.D.; Formal analysis, O.O.D.; Methodology, O.O.D., A.T.A. and L.A.M.; Supervision; L.B.R.-N. and A.T.A.; Writing (Original), O.O.D.; Writing (Review and Editing) O.O.D., A.T.A., L.B.R.-N. and L.A.M. All authors have read and agreed to the published version of the manuscript.

Funding

This research was funded by the Office of Graduate Studies and Department of Food Production, The University of the West Indies, St. Augustine Campus, Trinidad and Tobago (CRP.5.NOV11.6) and the Jamaica Agricultural Development Foundation (JADF) (Breadfruit FUND/ORG:11037/1151).

Data Availability Statement

Data supporting reported results can be requested by contacting the corresponding author. The data are not publicly available due to compliance with data protection regulations.

Acknowledgments

The authors would like to thank the Jamaica Agricultural Development Foundation (JADF) and the University of the West Indies (UWI) for their financial support in establishing and maintaining the breadfruit germplasm collection in Trinidad and Tobago.

Conflicts of Interest

The authors declare no conflicts of interest.

References

  1. Zerega, N.J.C.; Ragone, D.C.; Motley, T.J. Complex Origins of Breadfruit (Artocarpus altilis, Moraceae): Implications for Human Migrations in Oceania. Am. J. Bot. 2004, 91, 760–766. [Google Scholar] [CrossRef] [PubMed]
  2. Zerega, N.J.C.; Ragone, D.C.; Motley, T.J. Breadfruit Origins, Diversity, and Human-Facilitated Distribution. In Darwin’s Harvest: New Approaches to Origins, Evolution, and Conservation of Crop Plants; Motley, T.J., Zerega, N.J.C., Ragone, D.C., Cross, H., Eds.; Columbia University Press: New York, NY, USA, 2006; pp. 213–238. [Google Scholar]
  3. Roberts-Nkrumah, L.B. An Overview of Breadfruit (Artocarpus altilis) in the Caribbean. Acta. Hort. 2007, 757, 51–60. [Google Scholar] [CrossRef]
  4. Powell, D. The Voyage of the Plant Nursery, H.M.S. Providence, 1791–1793. Econ. Bot. 1977, 31, 387–431. [Google Scholar] [CrossRef]
  5. Jones, A.M.P.; Ragone, D.; Tavana, N.G.; Bernotas, D.W.; Murch, S.J. Beyond the Bounty: Breadfruit (Artocarpus altilis) for Food Security and Novel Foods in the 21st Century. Ethnobot. Res. Appl. 2011, 9, 129–149. [Google Scholar] [CrossRef]
  6. Roberts-Nkrumah, L.B. Enhancing Breadfruit Contribution to Food Security in the Caribbean Through Improved Supply. In Proceedings of the Caribbean Food Crop Society, Frigate Bay, Federation of St. Kitts and Nevis, 12–17 July 2009. [Google Scholar]
  7. Ragone, D. Breadfruit: Diversity, Conservation and Potential. Acta. Hort. 2007, 757, 19–30. [Google Scholar] [CrossRef]
  8. Zerega, N.J.C.; Ragone, D.C.; Motley, T.J. Systematics and Species Limits of Breadfruit (Artocarpus, Moraceae). Syst. Bot. 2005, 30, 603–615. [Google Scholar] [CrossRef]
  9. Ragone, D. Chromosome Numbers and Pollen Stainability of Three Species of Pacific Island Breadfruit (Artocarpus, Moraceae). Am. J. Bot. 2001, 88, 693–696. [Google Scholar] [CrossRef]
  10. Brantjes, N.B.M. Nectar and the Pollination of Breadfruit, Artocarpus altilis (Moraceae). Acta Bot. Neerl. 1981, 30, 345–352. [Google Scholar] [CrossRef]
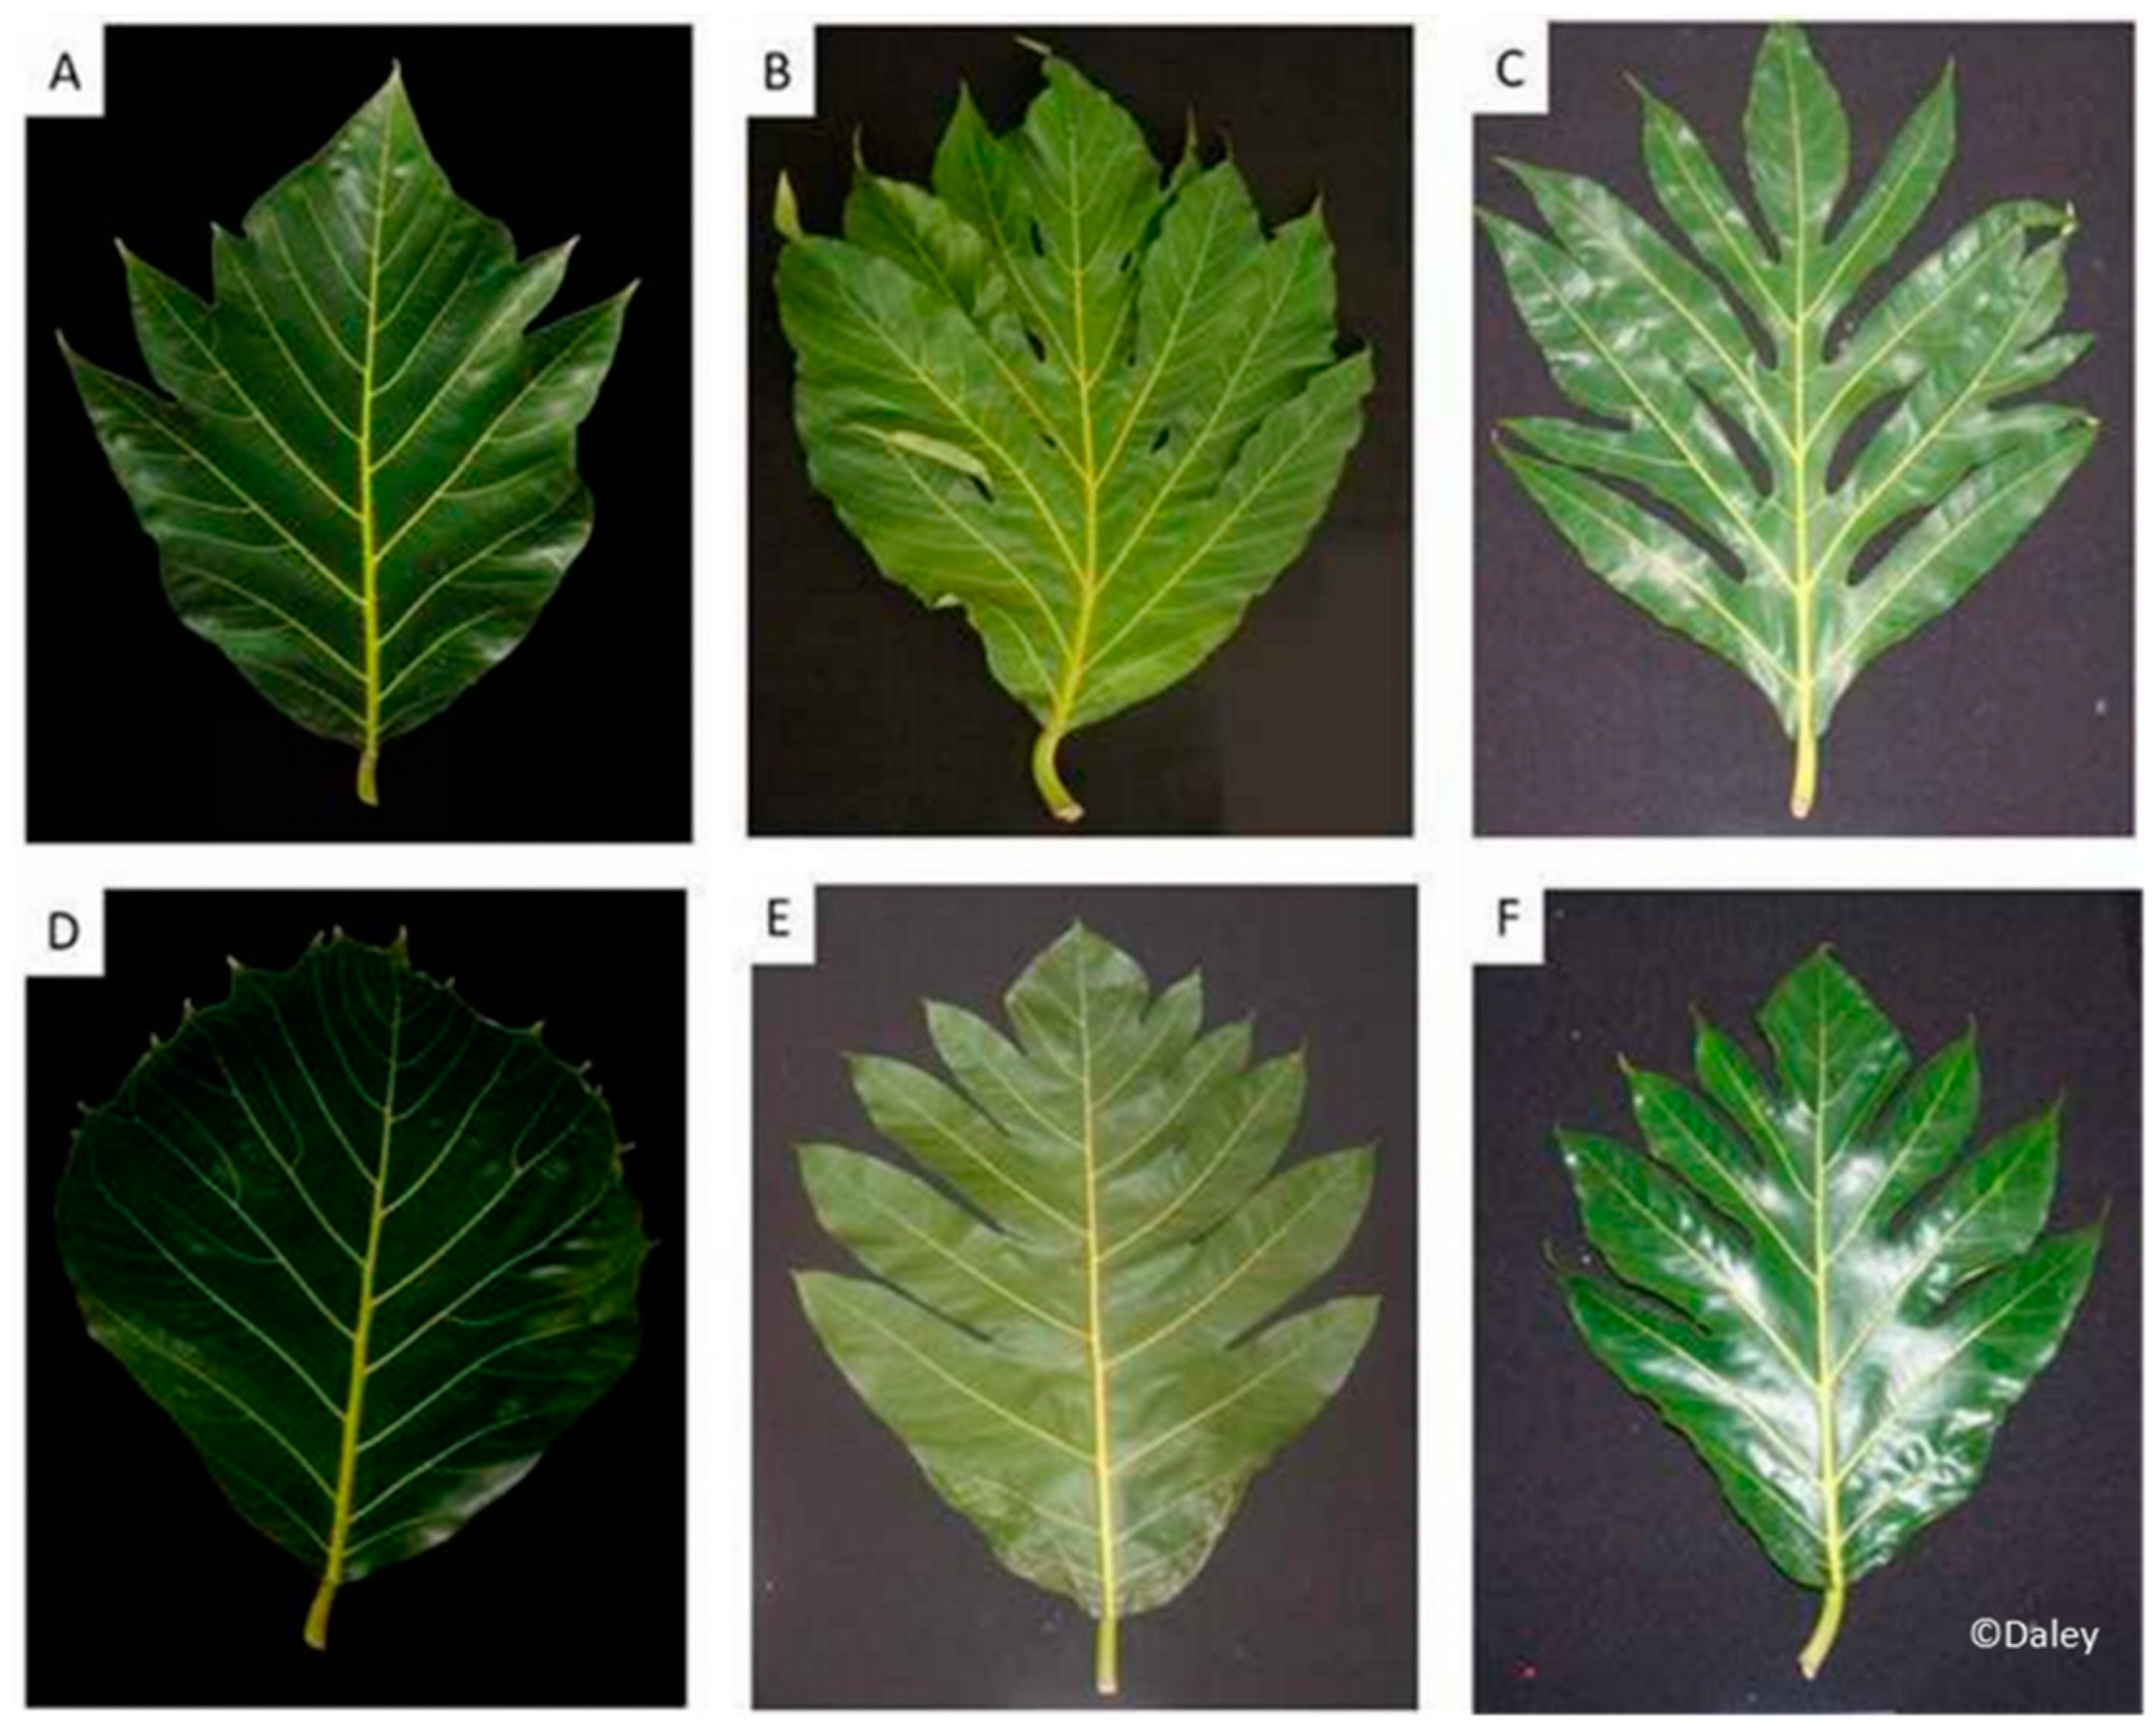
  11. Daley, O.O.; Roberts-Nkrumah, L.B.; Alleyne, A.T. Morphological diversity of breadfruit [Artocarpus altilis (Parkinson) Fosberg] in the Caribbean. Sci. Hort. 2020, 266, 109278. [Google Scholar] [CrossRef]
  12. Jones, A.M.P.; Murch, S.J.; Wiseman, J.; Ragone, D.C. Morphological Diversity in Breadfruit (Artocarpus, Moraceae): Insights into Domestication, Conservation, and Cultivar Identification. Genet. Resour. Crop Evol. 2013, 60, 175–192. [Google Scholar] [CrossRef]
  13. Ragone, D.C. Description of Pacific Island Breadfruit Cultivars. Acta. Hort. 1995, 413, 93–98. [Google Scholar] [CrossRef]
  14. Daley, O.O.; Roberts-Nkrumah, L.B.; Alleyne, A.T.; Gloster, M.C. Folk nomenclature and traditional knowledge of breadfruit [Artocarpus altilis (Parkinson) Fosberg] diversity in four Anglophone Caribbean countries. J. Ethnobiol. Ethnomed. 2022, 18, 65. [Google Scholar] [CrossRef]
  15. Ragone, D.; Tavana, G.; Stevens, J.M.; Stewart, P.A.; Stone, R.; Cox, P.M.; Cox, P.A. Nomenclature of Breadfruit Cultivars in Samoa: Saliency, Ambiguity and Monomiality. J. Ethnobiol. 2004, 24, 33–49. [Google Scholar]
  16. Korir, N.K.; Han, J.; Shangguan, L.; Wang, C.; Kayesh, E.; Zhang, Y.; Fang, J. Plant Variety and Cultivar Identification: Advances and Prospects. Crit. Rev. Biotechnol. 2013, 33, 111–125. [Google Scholar] [CrossRef] [PubMed]
  17. Biswas, M.K.; Xu, Q.; Mayer, C.; Deng, X. Genome Wide Characterization of Short Tandem Repeat Markers in Sweet Orange (Citrus sinensis). PLoS ONE 2014, 9, e104182. [Google Scholar] [CrossRef] [PubMed]
  18. Hoshino, A.A.; Bravo, J.P.; Morelli, K.A.; Nobile, P.M. Microsatellites as Tools for Genetic Diversity Analysis. In Genetic Diversity in Microorganisms; Caliskan, M., Ed.; INTECH Open Access Publisher: Rijeka, Croatia, 2012; pp. 149–170. [Google Scholar]
  19. Kanzaki, S.; Yonemori, K.; Sugiura, A.; Subhadrabandhu, S. Phylogenetic Relationships between the Jackfruit, the Breadfruit and Nine Other Artocarpus spp. from RFLP Analysis of an Amplified Region of cpDNA. Sci. Hort. 1997, 70, 57–66. [Google Scholar] [CrossRef]
  20. Sreekumar, V.B.; Binoy, A.M.; George, S.T. Genetic and Morphological Variation in Breadfruit (Artocarpus altilis (Park.) Fosberg) in the Western Ghats of India Using AFLP Markers. Genet. Resour. Crop Evol. 2007, 54, 1659–1665. [Google Scholar] [CrossRef]
  21. Witherup, C.; Ragone, D.; Wiesner-Hanks, T.; Irish, B.; Scheffler, B.; Simpson, S.; Zee, F.; Zuberi, M.I.; Zerega, N.J.C. Development of Microsatellite Loci in Artocarpus altilis (Moraceae) and Cross-Amplification in Congeneric Species. Appl. Plant Sci. 2013, 1, 1200423. [Google Scholar] [CrossRef] [PubMed]
  22. Zerega, N.J.C.; Wiesner-Hanks, T.; Ragone, D.; Irish, B.; Scheffler, B.; Simpson, S.; Zee, F. Diversity in the Breadfruit Complex (Artocarpus, Moraceae): Genetic Characterization of Critical Germplasm. Tree Genet. Genomes 2015, 11, 4. [Google Scholar] [CrossRef]
  23. Gardner, E.M.; Laricchia, K.M.; Murphy, M.; Ragone, D.; Scheffler, B.E.; Simpson, S.; Williams, E.W.; Zerega, N.J. Chloroplast Microsatellite Markers for Artocarpus (Moraceae) Developed from Transcriptome Sequences. Appl. Plant Sci. 2015, 3, 1500049. [Google Scholar] [CrossRef] [PubMed]
  24. Zerega, N.J.C.; Ragone, D. Toward a Global View of Breadfruit Genetic Diversity. Trop. Agr. 2016, 93, 77–91. [Google Scholar]
  25. De Bellis, F.; Malapa, R.; Kagy, V.; Lebegin, S.; Billot, C.; Labouisse, J.-P. New Development and Validation of 50 SSR Markers in Breadfruit (Artocarpus altilis, Moraceae) by Next-Generation Sequencing. Appl. Plant Sci. 2016, 4, 1600021. [Google Scholar] [CrossRef]
  26. Audi, L.; Shallow, G.; Robertson, E.; Bobo, D.; Ragone, D.; Gardner, E.M.; Jhurree-Dussoruth, B.; Wajer, J.; Zerega, N.J.C. Linking Breadfruit Cultivar Names across the Globe Connects Histories after 230 Years of Separation. Curr. Biol. 2023, 33, 287–297. [Google Scholar] [CrossRef]
  27. Barthe, S.; Gugerli, F.; Barkley, N.A.; Maggia, L.; Cardi, C.; Scotti, I. Always Look on Both Sides: Phylogenetic Information Conveyed by Simple Sequence Repeat Allele Sequences. PLoS ONE 2012, 7, e40699. [Google Scholar] [CrossRef]
  28. Estoup, A.; Jarne, P.; Cornuet, J.-M. Homoplasy and Mutation Model at Microsatellite Loci and Their Consequences for Population Genetics Analysis. Mol. Ecol. 2002, 11, 1591–1604. [Google Scholar] [CrossRef] [PubMed]
  29. Roberts-Nkrumah, L.B. The Breadfruit Germplasm Collection at the University of the West Indies, St Augustine Campus; University of the West Indies Press: Kingston, Jamaica, 2018. [Google Scholar]
  30. Roberts-Nkrumah, L.B. A Review of the Potential of Breadfruit Cultivar ‘Ma’afala’ for Commercial Production in Trinidad and Tobago. Trop. Agr. 2014, 91, 284–299. [Google Scholar]
  31. Kearse, M.; Moir, R.; Wilson, A.; Stones-Havas, S.; Cheung, M.; Sturrock, S.; Buxton, S.; Cooper, A.; Markowitz, S.; Duran, C.; et al. Geneious Basic: An Integrated and Extendable Desktop Software Platform for the Organization and Analysis of Sequence Data. Bioinformatics 2012, 28, 1647–1649. [Google Scholar] [CrossRef] [PubMed]
  32. Librado, P.; Rozas, J. DnaSP v5: A Software for Comprehensive Analysis of DNA Polymorphism Data. Bioinformatics 2009, 25, 1451–1452. [Google Scholar] [CrossRef] [PubMed]
  33. Hudson, R.R. A New Statistic for Detecting Genetic Differentiation. Genetics 2000, 155, 2011–2014. [Google Scholar] [CrossRef] [PubMed]
  34. Remington, D.L.; Thornsberry, J.M.; Matsuoka, Y.; Wilson, L.M.; Whitt, S.R.; Doebley, J.; Kresovich, S.; Goodman, M.M.; Buckler, E.S.T. Structure of Linkage Disequilibrium and Phenotypic Associations in the Maize Genome. Proc. Natl. Acad. Sci. USA 2001, 98, 11479–11484. [Google Scholar] [CrossRef]
  35. Vaidya, G.; Lohman, D.J.; Meier, R. SequenceMatrix: Concatenation Software for the Fast Assembly of Multi-Gene Datasets with Character set and Codon Information. Cladistics 2011, 27, 171–180. [Google Scholar] [CrossRef] [PubMed]
  36. Corander, J.; Marttinen, P.; Sirén, J.; Tang, J. Enhanced Bayesian Modelling in BAPS Software for Learning Genetic Structures of Populations. BMC Bioinform. 2008, 9, 1–14. [Google Scholar] [CrossRef] [PubMed]
  37. Corander, J.; Marttinen, P.; Sirén, J.; Tang, J. Baps: Bayesian Analysis of Population Structure; Department of Mathematics and Statistics, University of Helsinki: Helsinki, Finland, 2009; pp. 1–27. [Google Scholar]
  38. Swofford, D.L. PAUP* Version 4.0 b10. Phylogenetic Analysis Using Parsimony (* and Other Methods); Sinauer: Sunderland, MA, USA, 2002. [Google Scholar]
  39. Hudson, R.R.; Slatkin, M.; Maddison, W.P. Estimation of Levels of Gene Flow from DNA Sequence Data. Genetics 1992, 132, 583. [Google Scholar] [CrossRef] [PubMed]
  40. Hudson, R.R. Estimating the Recombination Parameter of a Finite Population Model without Selection. Genet. Res. 1987, 50, 245–250. [Google Scholar] [CrossRef] [PubMed]
  41. Bligh, W. The Log of H. M. S. Providence 1791–1793; Genesis Publications Limited: Guildford, UK, 1976. [Google Scholar]
  42. Ragone, D.C. Collection, Establishment, and Evaluation of a Germplasm Collection of Pacific Island Breadfruit. Ph.D. Thesis, University of Hawaiʻi at Manoa, Honolulu, HI, USA, 1991. [Google Scholar]
  43. Chen, H.; Morrell, P.L.; Cruz, M.d.l.; Clegg, M.T. Nucleotide Diversity and Linkage Disequilibrium in Wild Avocado (Persea americana Mill.). J. Hered. 2008, 99, 382–389. [Google Scholar] [CrossRef] [PubMed]
  44. Ingvarsson, P.K. Nucleotide Polymorphism and Linkage Disequilibrium within and among Natural Populations of European Aspen (Populus tremula L., Salicaceae). Genetics 2005, 169, 945–953. [Google Scholar] [CrossRef] [PubMed]
  45. Creste, S.; Tulmann Neto, A.; Vencovsky, R.; de Oliveira Silva, S.; Figueira, A. Genetic Diversity of Musa Diploid and Triploid Accessions from the Brazilian Banana Breeding Program Estimated by Microsatellite Markers. Genet. Resour. Crop Evol. 2004, 51, 723–733. [Google Scholar] [CrossRef]
  46. Hedrick, P.W. Genetics of Populations, 4th ed.; Jones and Bartlett Publishers: Sadbury, MA, USA, 2011. [Google Scholar]
  47. Hartl, D.L.; Clark, A.G. Principles of Population Genetics, 4th ed.; Sinaer Associates, Inc. Publishers: Sunderland, MA, USA, 2007. [Google Scholar]
  48. Garris, A.J.; McCouch, S.R.; Kresovich, S. Population Structure and its Effect on Haplotype Diversity and Linkage Disequilibrium Surrounding the xa5 Locus of Rice (Oryza sativa L.). Genetics 2003, 165, 759. [Google Scholar] [CrossRef]
  49. Flint-Garcia, S.A.; Thornsberry, J.M.; Buckler, E.S., IV. Structure of Linkage Disequilibrium in Plants. Annu. Rev. Plant Biol. 2003, 54, 357–374. [Google Scholar] [CrossRef]
  50. Bamberg, J.B.; del Rio, A.H. Genetic Heterogeneity Estimated by RAPD Polymorphism of Four Tuber-Bearing Potato Species Differing by Breeding System. Am. J. Pot Res. 2004, 81, 377–383. [Google Scholar] [CrossRef]
  51. Simko, I.; Haynes, K.G.; Jones, R.W. Assessment of Linkage Disequilibrium in Potato Genome with Single Nucleotide Polymorphism Markers. Genetics 2006, 173, 2237–2245. [Google Scholar] [CrossRef]
  52. Nordborg, M. Linkage Disequilibrium, Gene Trees and Selfing: An Ancestral Recombination Graph with Partial Self-Fertilization. Genetics 2000, 154, 923–929. [Google Scholar] [CrossRef]
  53. Hudson, R.R. Linkage Disequilibrium and Recombination. In Handbook of Statistical Genetics; Balding, D.J., Bishop, M., Cannings, C., Eds.; John Wiley and Sons, Ltd.: Chichester, UK, 2001. [Google Scholar]
  54. Liu, A.; Burke, J.M. Patterns of Nucleotide Diversity in Wild and Cultivated Sunflower. Genetics 2006, 173, 321–330. [Google Scholar] [CrossRef] [PubMed]
  55. Zhu, Y.L.; Song, Q.J.; Hyten, D.L.; Van Tassell, C.P.; Matukumalli, L.K.; Grimm, D.R.; Hyatt, S.M.; Fickus, E.W.; Young, N.D.; Cregan, P.B. Single-Nucleotide Polymorphisms in Soybean. Genetics 2003, 163, 1123–1134. [Google Scholar] [CrossRef] [PubMed]
  56. Fuchs, E.J.; Hamrick, J.L. Genetic Diversity in the Endangered Tropical Tree, Guaiacum sanctum (Zygophyllaceae). J. Hered. 2010, 101, 284–291. [Google Scholar] [CrossRef] [PubMed]
  57. Roberts-Nkrumah, L.B. Towards a Description of the Breadfruit Germplasm in St Vincent. Fruits 1997, 52, 27–35. [Google Scholar]
Figure 1. Some of the leaf morphological variations observed among cultivars in the UWI breadfruit germplasm collection. (A) ‘Timor’; (B) ‘Kashee Bread’; (C) ‘Cassava’; (D) ‘Meitehid’; (E) ‘Puou’ and (F) ‘Yellow’. Source: Daley, et al. [11].
Horticulturae 10 00253 g001
Figure 2. Some fruit morphological variations observed among cultivars in the UWI breadfruit germplasm collection. Smooth-skinned cultivars: [(A) ‘Yellow’; (B) ‘Afara’; (C) ‘Timor’]; Rough skinned cultivars: [(D) ‘Kashee Bread’; (E) ‘Toneno’ and (F) ‘Piipiia’]. Source: Daley, et al. [11].
Horticulturae 10 00253 g002
Figure 3. Plots of Linkage disequilibrium (LD) against the physical separation distance of existing Caribbean breadfruit accessions (ECA) and newly introduced breadfruit accessions (NIA).
Horticulturae 10 00253 g003
Figure 4. Clustering of 91 A. altilis and three A. altilis × A. mariannensis hybrid samples. Sample names run vertically, and their details are presented in Table 1. An optimal fit of K = 2 was found with Bayesian analysis in the software BAPS [36,37].
Horticulturae 10 00253 g004
Table 1. Accession data for breadfruit (Artocarpus altilis), breadfruit hybrid (A. altilis × A. mariannensis), and breadnut (A. camansi) samples used in the study.
No.Sample IDCultivar NameTaxon *Ploidy *Sample Collection SiteAccession Grouping
112AHuehueAa × Am3nUWINIA
213AHope MarbleAa3nUWIECA
315AUlu’eaAa2nUWINIA
418AMeitehidAa3nUWINIA
519AWhiteAa3nUWIECA
61AYellowAa3nUWIECA
741AMaccaAa3nUWIECA
842BYellow HeartAa3nUWIECA
943BYellow HeartAa3nUWIECA
1044AAveloloaAa3nUWINIA
1145ACreoleAa3nUWIECA
1247AWhiteAa3nUWIECA
1348BWhiteAa3nUWIECA
1449BWhiteAa3nUWIECA
1550BPorohitiAa3nUWINIA
1651APorohitiAa3nUWINIA
17522BCaptain BlighAa3nSVGECA
18523BUnidentfied 1Aa3nSVGECA
19524ACreoleAa3nSVGECA
2052BTonenoAa3nUWINIA
21532BSally YoungAa3nSVGECA
22534AWhiteAa3nSVGECA
23537AHog PenAa3nSVGECA
24539BDessertAa3nSVGECA
2553BRoiha’aAa3nUWINIA
26544BKashee BreadAa3nSVGECA
27545AHope MarbleAa3nSVGECA
28546ALawyer CaineAa3nSVGECA
29548ADessertAa3nSVGECA
3054ATapeha’aAa3nUWINIA
31552BSally YoungAa3nSVGECA
32553AWhiteAa3nSVGECA
33555BWaterloo/CottonAa3nSVGECA
34556ASoursopAa3nSVGECA
35558ALiberalAa3nSVGECA
36559AYellow HeartAa3nJAMECA
3755APiipiiaAa × Am3nUWINIA
38561ATimorAa3nJAMECA
38562BYellow HeartAa3nJAMECA
40563ACouscousAa3nJAMECA
41565ATimorAa3nJAMECA
42567BYellow HeartAa3nJAMECA
43569BYellow HeartAa3nJAMECA
4456AMeinpadahkAa × Am3nUWINIA
45571ATimorAa3nJAMECA
46572ACouscousAa3nJAMECA
47573BWhite HeartAa3nJAMECA
48574BMaccaAa3nJAMECA
49575BBrambramAa3nJAMECA
5057BMomolegaAa2nUWINIA
51581BYellow HeartAa3nJAMECA
5258BUnidentified 2Aa3nUWINIA
53590AWhite HeartAa3nJAMECA
54591AMonkey BreadfruitAa3nJAMECA
55592AMonkey BreadfruitAa3nJAMECA
56596ABanjamAa3nJAMECA
5759APua’aAa3nUWINIA
585BMeitehidAa3nUWINIA
59601APortland BreadfruitAa3nJAMECA
60602AMan BreadAa3nJAMECA
61603AMa’afalaAa2nJAMNIA
6260AUnidentified 3Aa-UWI-
6361BMahaniAa3nUWINIA
6462AAfaraAa3nUWINIA
6563BFafaiAa3nUWINIA
6664BYellowAa3nUWINIA
6765BOteaAa3nUWINIA
6866BPuouAa2nUWINIA
6969ABreadnut/ ChataigneAc2nUWIECA
70730AMasunwaAa2nTRINIA
71731AMa’afalaAa2nTRINIA
72741BYellowAa3nTRIECA
73742AMa’afalaAa2nTRINIA
74743AWhiteAa3nTRIECA
75764CUnidentified 4Aa3nSKNECA
76780CUnidentified 5Aa3nSKNECA
77782AUnidentified 6Aa3nTOBECA
78783BButter BreadfruitAa3nTOBECA
79788BChoufchoufAa3nTOBECA
80790CUnidentified 7Aa3nTOBECA
81798AMa’afalaAa2nTRINIA
827ATimorAa3nUWIECA
83800 BWhiteAa3nTOBECA
84805 APu’upu’uAa3nTOBNIA
85806 AMeitehidAa3nTOBECA
86808 ATimorAa3nTOBECA
87821 BWhiteAa3nTOBECA
88827 BMa’afalaAa2nTOBECA
89828 ALocal YellowAa3nTOBECA
90833ALocal YellowAa3nTRIECA
91835AMa’afalaAa2nTRINIA
929BCassavaAa3nUWIECA
93BF12Unidentfied 8Aa-UWINIA
94NO.17 BPu’upu’uAa3nUWINIA
95SV4ACocobreadAa3nUWIECA
Taxon (Aa = Artocarpus altilis; Ac = Artocarpus camansi; Am = Artocarpus mariannensis; Aa × Am = A. altilis × A. mariannensis hybrid); Ploidy (3n = Triploid; 2n = diploid; - = unknown); * Taxon and ploidy are based on previous publications [22,24,26]; Collection site (UWI = The University of the West Indies, St. Augustine Campus Breadfruit Germplasm Collection; TRI = Trinidad; TOB = Tobago; JAM = Jamaica; SVG = St. Vincent and the Grenadines; SKN = St. Kitts and Nevis); Accession grouping (ECA = Existing Caribbean Breadfruit Accessions; NIA = Newly Introduced Breadfruit Accessions).
Table 2. Characteristics of microsatellite loci used to amplify breadfruit (Artocarpus altilis), breadfruit hybrid (A. altilis × A. mariannensis), and breadnut (A. camansi) samples used in the study.
LocusPrimer Sequence (5′--3′)Repeat Motif a
MAA40F: AGCATTTCAGGTTGGTGAC
R: TTGTTCTGTTTGCCTCATC
(TG)16
MAA54aF: AACCTCCAAACACTAGGACAAC
R: AGCTACTTCCAAAACGTGACA
(CA)5,(AT)4
MAA71F: TTCCTATTTCTTGCAGATTCTC
R: AGTGGTGGTAAGATTCAAAGTG
(CT)11(CA)19
MAA85F: TCAGGGTGTAGCGAAGACA
R: AGGGCTCCTTTGATGGAA
(CA)11
MAA96F: GGACCTCAAGGATGTGATCTC
R: ACACGGTCTTCTTTGGATAGC
(CA)14(TA)7(TG)3(GT)
MAA140F: CCATCCCCCATCTTTCCT
R: TCCTCGTTTGCCACAGTG
(CT)25
* MAA178aF: GATGGAGACACTTTGAACTAGC
R: CACCAGGGTTTAAGATGAAAC
(GT)3,(GT)6,(GT)3,(GA)3,(GA)10
* MAA178bF: GATGGAGACACTTTGAACTAGC
R: CACCAGGGTTTAAGATGAAAC
(GT)3,(GT)3,(GA)3,(GA)11
MAA182F: TACTGGGTCTGAAAAGATGTCT
R: CGTTTGCGTTTGGATAAAT
(CT)19
MAA251F: ATCGTCTTTGTCACCACCAC
R: ATAGCCGAGTAACTGGATGGA
(ATC)10
a Comma indicates the presence of nonrepeating nucleotides between repeats. * Primers amplified two separate loci. Source: Witherup, et al. [21].
Table 3. Summary statistics of nucleotide variability for existing Caribbean breadfruit accessions (ECA) and newly introduced breadfruit accessions (NIA).
Microsatellite
Locus
GroupSNP
(Parsimony
Informative)
Nucleotide
Diversity
( π T )
Nucleotide
Polymorphism ( θ W )
Tajima’s
D Test
Fu’s F TestHarpending Index
MAA40Total40 (9)0.3340.16−1.709−2.3380.004
ECA50 (7)0.3230.204−1.269−1.2660.002
NIA61 (22)0.3490.182−1.181−2.2850.004
MAA54ATotal50 (7)0.3280.154−0.536−2.4680.046
ECA51 (8)0.3380.171−0.398−2.5180.032
NIA56 (30)0.1930.1−2.069−2.6090.065
MAA71Total46 (8)0.2760.141−0.643−2.8150.010
ECA70 (13)0.340.2390.911−1.4320.002
NIA37 (19)0.1850.108−1.29−2.2210.021
MAA85Total55 (1)0.3030.2531.48−0.4510.001
ECA60 (3)0.2860.251−0.426−0.3290.002
NIA72 (9)0.3250.2971.4790.3030.004
MAA96Total66 (13)0.3050.1710.021−1.9690.002
ECA71 (17)0.2970.163−1.567−1.4910.003
NIA90 (27)0.3240.2090.172−1.6930.005
MAA140Total25 (10)0.3010.087−2.236−3.6850.019
ECA33 (23)0.3020.096−2.287−4.7520.030
NIA54 (27)0.3040.154−1.853−2.5980.014
MAA178ATotal57 (12)0.330.181−1.498−1.5450.003
ECA62 (12)0.3370.202−1.392−1.5020.003
NIA63 (17)0.280.192−1.182−1.3960.007
MAA178BTotal83 (18)0.2590.176−1.081−1.8740.001
ECA86 (26)0.230.167−0.953−1.7980.002
NIA106 (36)0.2770.206−0.978−1.7150.004
MAA182Total0 (0)0000 ND
ECA10 (0)0.3830.247−1.0840.1670.082
NIA39 (1)0.3330.3480.1640.0750.006
MAA251Total64 (500.3550.269−0.805−1.3560.001
ECA67 (8)0.2840.233−0.625−0.9740.001
NAC71 (14)0.3970.3−0.927−1.2220.004
AverageTotal48.6 (8.3)0.1590.279−0.701−1.8500.010
ECA56 (11.7)0.1970.312−0.909−1.5900.016
NIA64.9 (20.2)0.2100.297−0.767−1.5360.013
Table 4. Summary of the observed number of unique haplotypes and haplotype diversity (h) within the existing Caribbean and newly introduced breadfruit accessions, as well as estimates of the minimum number of recombination events (RM),) estimate of population recombination (ρ), and Wall’s B statistic.
LociAccession GroupNo. of Unique HaplotypesHaplotype
Diversity (h)
RMρWalls’ B Statistic
MAA40ECA580.996 ± 0.004100.2250.000
NIA310.998 ± 0.00870.4040.000
MAA54AECA280.836 ± 0.03970.6230.000
NIA130.843 ± 0.04351.1960.000
MAA71ECA621.000 ± 0.00390.1640.125
NIA200.950 ± 0.02480.5590.071
MAA85ECA610.999 ± 0.003170.1290.000
NIA321.000 ± 0.008230.1380.024
MAA96ECA560.992 ± 0.007100.4580.129
NIA310.998 ± 0.008110.2860.075
MAA140ECA290.914 ± 0.02411.1730.375
NIA250.956 ± 0.02950.5340.207
MAA178AECA590.998 ± 0.00370.3430.174
NIA321.000 ± 0.008130.1720.091
MAA178BECA621.000 ± 0.003170.2410.125
NIA321.000 ± 0.008160.1540.127
MAA182ECA280.955 ± 0.01110.1710.000
NIA310.998 ± 0.008150.0870.044
MAA251ECA600.999 ± 0.003150.3320.000
NIA321.000 ± 0.00880.1560.044
AverageECA50.3 ± 5.2680.969 ± 0.0559.400 ± 5.7780.386 ± 0.3150.093 ± 0.121
NIA27.900 ± 6.5740.974 ± 0.05011.100 ± 5.7240.369 ± 0.3360.068 ± 0.063
Table 5. Estimate of FST and test of genetic differentiation in existing Caribbean and newly introduced breadfruit accessions.
LocusAll Accessions (n = 94)
FST aSnn b
MAA40−0.00020.6084
MAA54A0.01050.5533
MAA710.01470.6008
MAA850.01780.7018 ***
MAA960.03320.6939 ***
MAA1400.05130.6024 **
MAA178A0.00350.5829
MAA178B0.03580.7128 **
MAA182--
MAA2510.10950.6720 **
Average (n = 9)0.03060.6365
Significant at ** p < 0.01, *** p < 0.001; a Wright’s fixation index [39]. b Statistical test of genetic differentiation [33].
Disclaimer/Publisher’s Note: The statements, opinions and data contained in all publications are solely those of the individual author(s) and contributor(s) and not of MDPI and/or the editor(s). MDPI and/or the editor(s) disclaim responsibility for any injury to people or property resulting from any ideas, methods, instructions or products referred to in the content.

