Article

Impact of Dry Processing on Secondary Metabolites in the Petals of Marigold (Tagetes spp.) Cultivar

1
Graduate School of Green-Bio Science, College of Life Sciences, Kyung Hee University, Yongin 17104, Republic of Korea
2
Smart Farm Science, College of Life Sciences, Kyung Hee University, Yongin 17104, Republic of Korea
*
Author to whom correspondence should be addressed.
These authors contributed equally to this work.
Horticulturae 2024, 10(4), 382; https://doi.org/10.3390/horticulturae10040382
Submission received: 7 March 2024 / Revised: 8 April 2024 / Accepted: 8 April 2024 / Published: 9 April 2024

Abstract

:
The edible flowers of marigold (Tagetes spp.) are cultivated for their aesthetic appeal and high utility as functional health food ingredients. Carotenoid and flavonoid contents in marigold petals highlight the importance of selecting the appropriate cultivar and its processing methods for their industrial applications. The comparative understanding of the effects of dry processing on functional components across different marigold cultivars is still lacking. Therefore, this study investigated functional compound changes in the dry processing effect on four marigold cultivars with distinct flower shapes (Durango, Inca) and colors (yellow, orange). The petals in hot air drying (HAD) with 30, 60, and 90 °C applications were analyzed for the measurement of their individual secondary metabolite contents, total phenolic and flavonoid contents, and antioxidant activities. In freeze drying (FD), the lutein content varied significantly based on flower color, exhibiting higher levels in cultivars with orange petals. Otherwise, the levels of quercetin derivatives displayed distinct differences based on varieties other than color, with Inca cultivars demonstrating higher levels of quercetin 7-O-glucoside (Q7G) than Durango cultivars. In HAD, the lutein levels show a tendency to increase above 60 °C regardless of the cultivar. The content of quercetin glycosides decreased, while the aglycone increased in HAD treatments, regardless of the temperatures. Correlation and PCA results highlighted the impact of phenol compounds on antioxidant activity. Overall, these findings underscore the significance of variety and color in determining the chemical composition and antioxidant properties of marigold flowers.

1. Introduction

Marigold (Tagetes spp.) is a valuable ornamental as a widely cultivated edible flower renowned for its vibrant colors and diverse species range [1]. The flowers are used raw in salads and dried products for tea or powder [2,3,4]. Among its over 56 species, the French marigold (Tagetes patula) and African marigold (Tagetes erecta) are the two most commonly found species [5]. The various marigold plants provide a rich array of options for various industrial applications due to variability in their secondary metabolites across cultivars [6]. Previous studies have demonstrated noticeable variations in the contents of carotenoids and phenolic compounds among marigold cultivars [7,8,9]. Among the metabolites of marigold petals, lutein acts as a crucial indicator for determining the quality of raw materials [10]. Lutein plays a critical role in supporting eye health and protecting vision. Specifically, lutein content has been reported to exhibit significant differences based on flower color [11,12]. Moreover, a recent study emphasized the role of quercetin derivatives in the antioxidant activity of marigold petals [13]. The primary flavonoids in marigolds show notable variations among cultivars, largely attributed to genetic factors rather than external physical characteristics [14]. The chemical composition of marigold flowers holds significant importance in multiple industries, including cosmetics and health-promoting foods [15].
To preserve bioactive compounds, these flowers undergo processing techniques, such as drying. Among numerous drying methods, freeze-drying (FD) stands out as a dehydration method that allows for the preservation of characteristics such as pigments and metabolites found in raw materials. This method, based on the sublimation of frozen products, offers superior water removal and yields the highest quality products due to anti-deterioration in the absence of liquid water and low processing temperatures [16]. However, its limited application in the industry is attributed to its higher cost compared to other drying methods [17]. On the other hand, hot air drying (HAD) is one of the most commonly used methods due to its affordability and simplicity [18]. Similar to FD, HAD effectively eliminates moisture from the petals, thereby extending their shelf life and broadening utility across diverse industries [18,19].
Although the drying process applied to post-harvest marigolds was effective at preserving quality, its effect on the chemical composition is still unclear. Flowers treated with different drying methods, such as fan drying, cabinet drying, and vacuum drying, exhibited lower total phenol contents and antioxidant activity [20]. Additionally, Tagetes erecta that dried at temperatures ranging from 55 to 70 °C showed higher xanthophyll degradation [21]. In a report by Siriamornpun et al. [22], lutein content in Tagetes erecta L. flowers treated with HAD at 60 °C for 4 h decreased by over 50% compared to that in FD. In another study, the conversion of high molecular glycosyl flavonoids in Tagetes patula flowers into aglycones or intermediate flavonoid glycosides through the drying process was reported [23]. From these results, the effects of thermal drying on the chemical properties of marigold flowers, particularly in different cultivars, highlight the need for investigation.
Therefore, this study aimed to investigate the effects of HAD on the chemical composition and antioxidant activity of marigold flowers, with a focus on variations across different shapes and colors. Through this research, we seek to elucidate the impact of drying on marigold flowers, aiming to offer valuable insights into optimal cultivars and drying conditions for various applications.

2. Materials and Methods

2.1. Chemicals and Plant Materials

All solvents used in the experiments, including acetone, water, and acetonitrile, were of analytical high-performance liquid chromatography (HPLC) grade (Daejung Chemical & Metals Co., Shiheung, Republic of Korea). Quercetin (ChemFaces Biochemical Co., Ltd., Wuhan, China) and lutein (Extrasynthese, Genay, France) were employed as standards.
The seeds of four marigold cultivars, namely Durango yellow (DY), Durango orange (DO), Inca yellow (IY), and Inca orange (IO), were produced by Asia Seeds (Seoul, Republic of Korea). These seeds were planted in plastic pots filled with horticultural soil (Baroker, Seoul Bio, Eumseong, Republic of Korea) and cultivated under natural light in a glass greenhouse at Kyung Hee University (Yong-in, Republic of Korea). Irrigation was performed 3 to 4 times per week to grow marigolds. The seedling was allowed to grow until the shoot length exceeded 20 cm. Fully bloomed flowers were harvested from 30 plants of each cultivar (Figure 1). The harvesting process was repeated three times, with each harvest considered as one repetition, resulting in a total of three repetitions.

2.2. Dry Processing

The harvested flower petals were separated from other organs and subjected to drying. For drying, all samples were spread out in a single layer on a wire mesh rack set at each temperature (30, 60, and 90 °C). Marigold petals underwent drying with an air velocity of 6 m/s using a hot air dryer (Koencon Co., Ltd., Hanam, Republic of Korea) until they were fully dried (Figure S1). The drying of petals was conducted at 30 °C for one day, at 60 °C for 6 h, and at 90 °C for 1 h. As a control, the harvested marigold petals were frozen at −80 °C and subsequently lyophilized using a freeze dryer (Freeze Drier, Ilshin Biobase Co., Seoul, Republic of Korea). Following drying, the samples were ground using a commercial mixer and used for further experimentation.

2.3. Determination of Individual Metabolites Using HPLC

2.3.1. Determination of Carotenoid by Reverse-Phase HPLC

The ground petals (20 mg) from each of the four marigold cultivars were extracted using 1 mL of 80% acetone for 8 h at 24 °C in a shaking incubator described by [24] with some modification. The solvents were stored in dark conditions and subsequently loaded onto an HPLC system (Waters 2695 Alliance HPLC, Waters, Milford, MA, USA) after filtration through a 0.45 μm membrane filter (Futecs Co., Ltd., Daejeon, Republic of Korea). The filtered extracts were subsequently subjected to the reverse-phase HPLC analysis of individual carotenoids using a modified version of the method described by Lim et al. [18]. Carotenoids were analyzed employing a prontosil 5.0 μm 120-5-C18-SH column (4.6 × 250 mm; Bischoff, Leonberg, Germany). The column temperature was maintained at 25 °C. The flow rate was set at 1 mL min−1, and the injection volume was 20 μL. The mobile phase consisted of (A) 90% acetonitrile with 0.1% formic acid and (B) ethyl acetate with 0.1% formic acid. The gradient elution was as follows: 0–10 min, 0–60% B; 10–25 min, 60% B; 25–26 min, 60–100% B; 26–27 min, 100–0% B. The eluents were monitored at 450 nm using a Waters 996 photodiode array detector (Waters Inc., Milford, MA, USA).

2.3.2. Determination of Flavonoid by Reverse-Phase HPLC

Individual flavonoids in marigold petal extracts were determined using a previously published method [13]. In summary, 20 mg of the ground sample underwent extraction using a mixture of water, methanol, and formic acid (28:70:2 v/v). Flavonoids were analyzed using a prontosil 5.0 μm 120-5-C18-SH column (4.6 × 150 mm; Bischoff, Leonberg, Germany) with the temperature set at 25 °C. The mobile phase consisted of Solvent A (water with 0.1% formic acid) and Solvent B (acetonitrile with 0.1% formic acid). The gradient program proceeded as follows: 0–10 min, 1–30% B; 10–23 min, 30–90% B; 23–25 min, 90% B; 25–27 min, 90–1% B; 27–30 min, 1% B. The injection volume was 10 µL, and the flow rate was 1.0 mL∙min−1. The peaks were monitored at 350 nm. Each compound was quantified using quercetin as a standard. The extracts used for individual flavonoid HPLC analysis were stored at 4 °C for the determination of total phenolic content (TPC), total flavonoid content (TFC), and antioxidant activities.

2.4. Measurements of TFC and TPC

The total flavonoid and phenolic contents were determined following the methods described by Lim et al. [25]. Sample extracts (500 µL) were mixed with 0.15 mL of 5% NaNO2 and 3.2 mL of distilled water. After 5 min, 150 µL of 10% AlCl3 and 100 µL of 1 M NaOH were added. The absorbance of the mixture was measured immediately at 510 nm using a spectrophotometer (S-4100; Scinco Co., Seoul, Republic of Korea). The TF content was calculated as mg catechin equivalents (CAE) per g dry weight (D.W.) using the standard curve equation (y = 0.0019x + 0.0016).
The total phenolic content was determined according to the Folin–Ciocalteu method. Briefly, 50 μL of the sample extract was combined with 650 μL of distilled water and 50 μL of the Folin–Ciocalteu phenol reagent (Sigma-Aldrich Co., St. Louis, MO, USA). After 6 min, 500 μL of 7% Na2CO3 was added, and the mixture was left to incubate at room temperature for 90 min. The absorbance was measured at 750 nm. The total phenolics content was quantified and expressed as mg of gallic acid equivalents (GAE) per g D.W. using the standard curve equation (y = 0.0034x − 0.0364).

2.5. Measurements of Antioxidant Activities

The antioxidant activity of marigold petal extracts after dry processing was assessed using 2,2-diphenyl-1-picrylhydrazyl (DPPH) and 2,2′-azino-bis (3-ethylbenzothiazoline-6-sulfonic acid (ABTS) radical scavenging activity assays, as described by the previously published report [25]. The absorbance of each mixture was measured using a spectrophotometer at 517 nm and 734 nm, respectively. The DPPH and ABTS radical scavenging activities were expressed as mg of ascorbic acid equivalents (AAE) per g D.W. using the standard curve equation (y = 0.0024x − 0.0051 and y = 0.0028x + 0.0294, respectively).

2.6. Statistical Analysis

All data were presented as the mean ± standard error of three replicates. Statistical analyses were performed using SAS software (Enterprise Guide 7.1 version; SAS Institute Inc., Cary, NC, USA). The statistical differences between treatments based on marigold cultivar and drying temperature were determined using Tukey’s studentized test (HSD) at p < 0.05. Pearson’s correlation coefficients were calculated to analyze the correlation between antioxidant activities and individual metabolites using SAS software. Principal component analysis (PCA) score plots were generated using the same software based on the data utilized for correlation analysis.

3. Results and Discussion

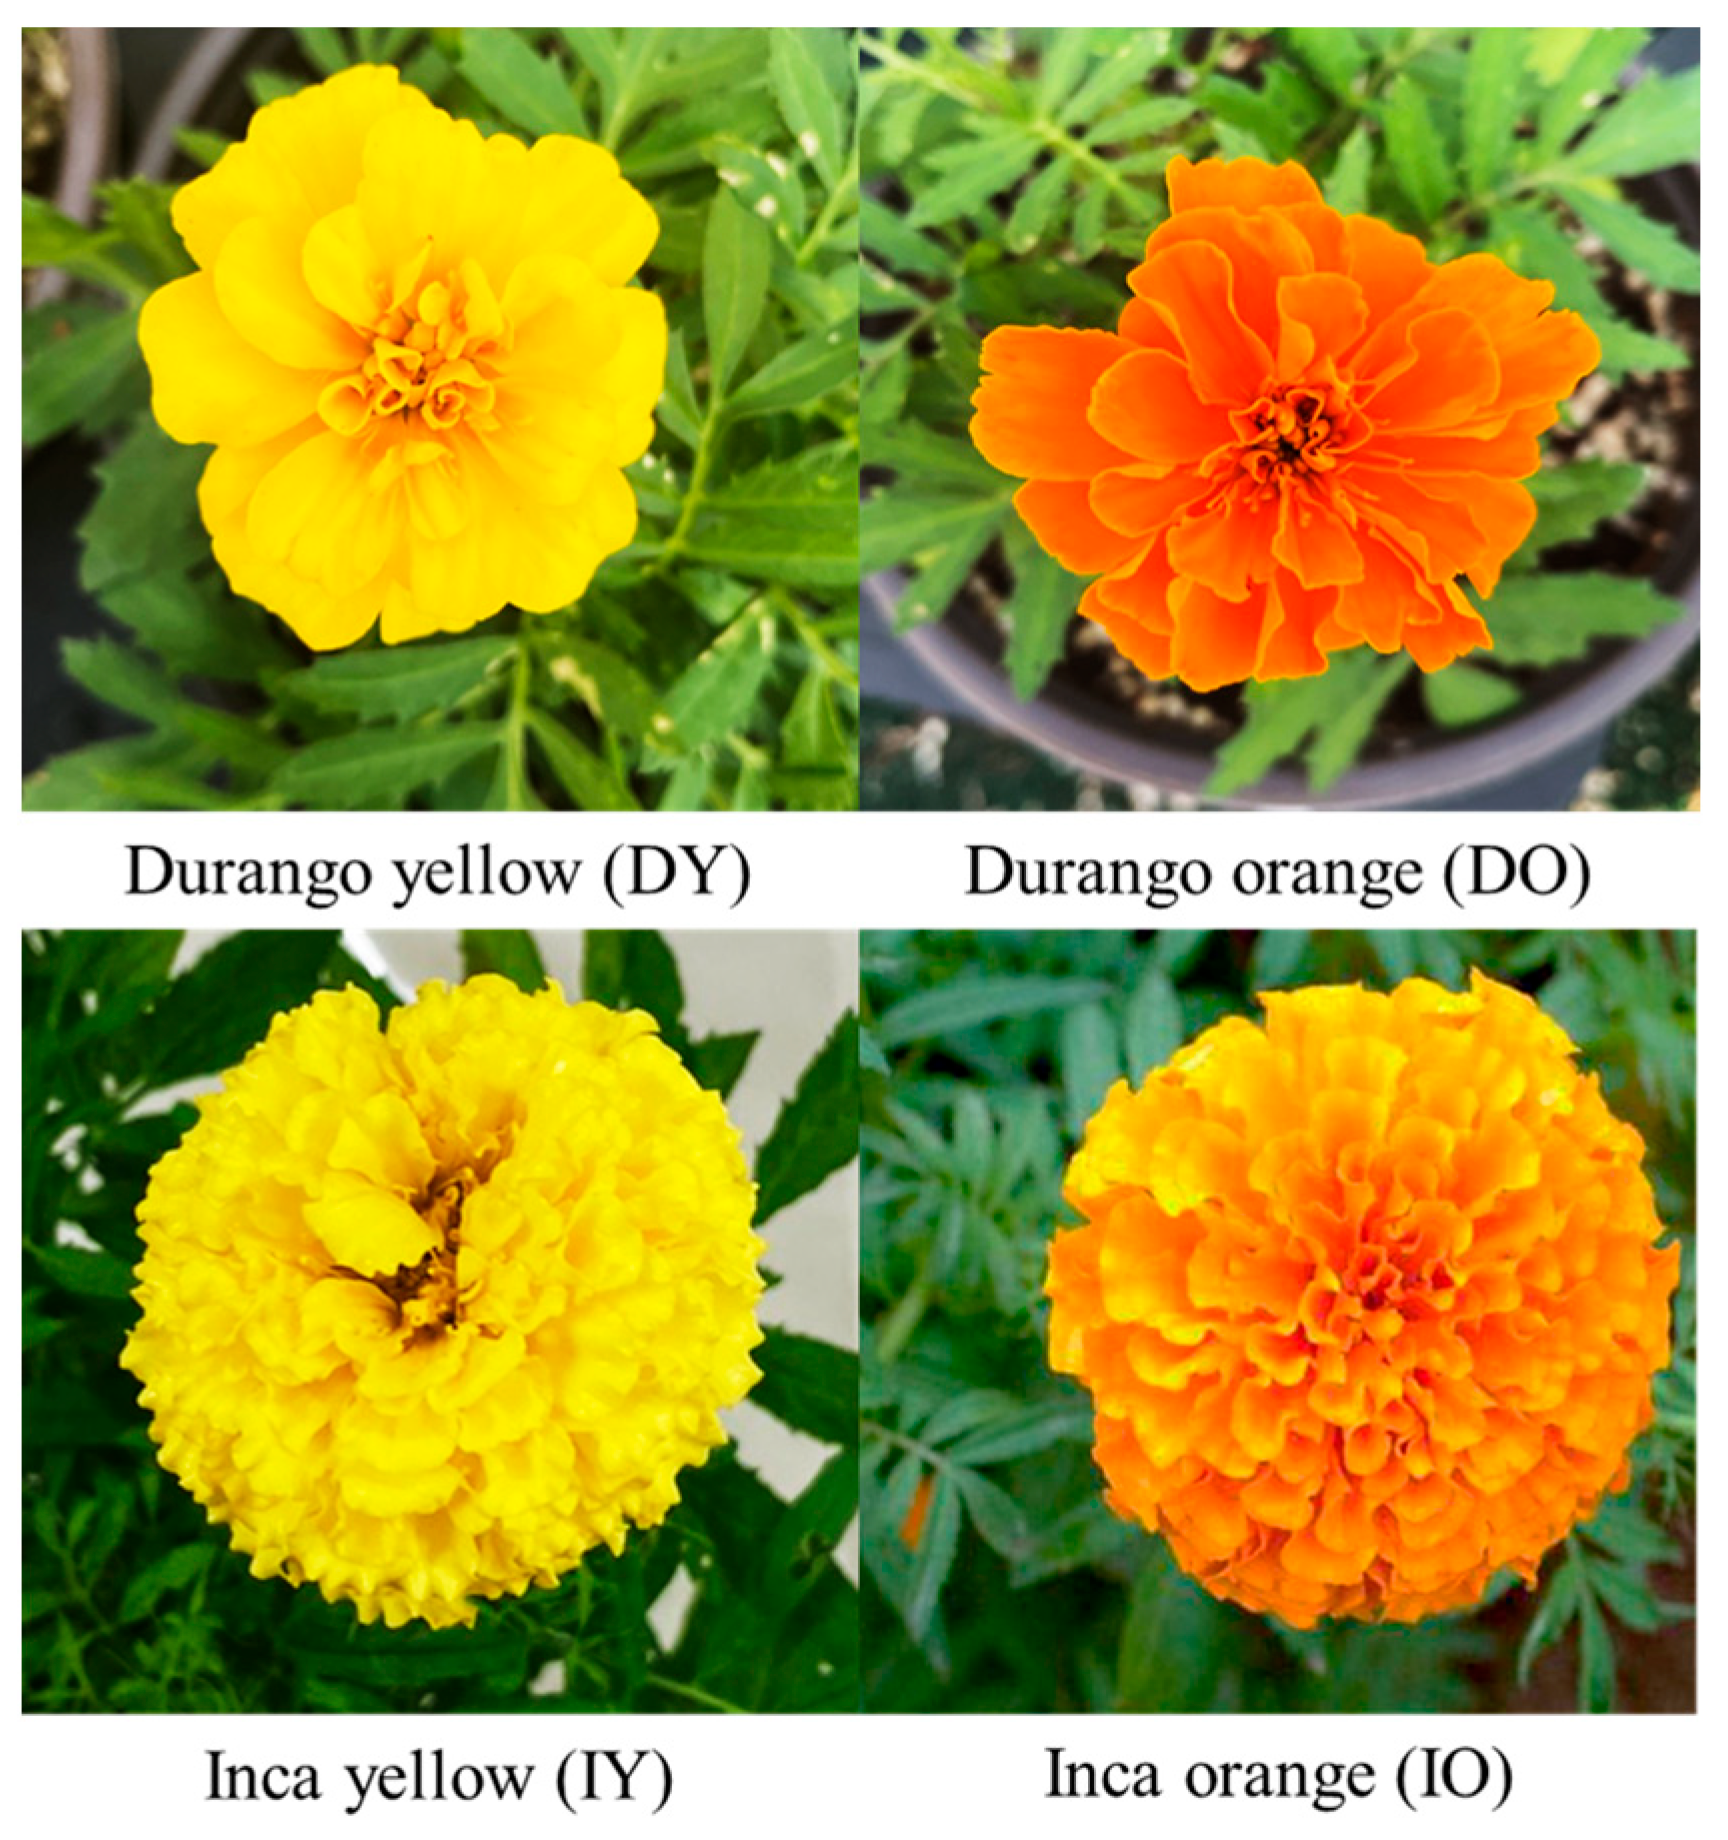
3.1. Morphological Appearances and Characteristics of Four Marigold Cultivars

Figure 1 illustrates the morphology of the four marigold cultivars. DY and IY exhibited yellow petals, whereas DO and IO exhibited orange petals. The Durango cultivars, including DY and DO, featured approximately 0.05 m blooms with a 2–3-layer shape. The flowers of the Durango cultivars were smaller than those of Inca cultivars, including IY and IO, which have about 0.07–0.10 m blooms with sturdy and compact petals forming a spherical flower shape. The two cultivars, Durango and Inca, were distinguished not only by flower shape but also by the content and composition of secondary metabolites (Table 1). In non-HAD (FD), lutein content, the major carotenoid detected in marigold petals, displayed significant differences depending on flower color, with orange cultivars exhibiting a higher level. Similar differences based on flower color were also observed in TPC and ABTS radical scavenging activities. The TPC and ABTS radical scavenging activities of the orange cultivars were 1.1–1.2 times higher than those of the yellow cultivars. On the other hand, the TFC and DPPH radical scavenging activity were distinguished by cultivars rather than color. The quercetin-7-O-glucoside (Q7G) was approximately 10–20 times higher in the Inca cultivars than in the Durango cultivars. Otherwise, quercetin-3-O-glucoside and quercetin contents were distinctly higher in the Durango cultivars. The composition of the quercetin derivatives served as a key indicator for classifying the characteristics of the four marigold cultivars.

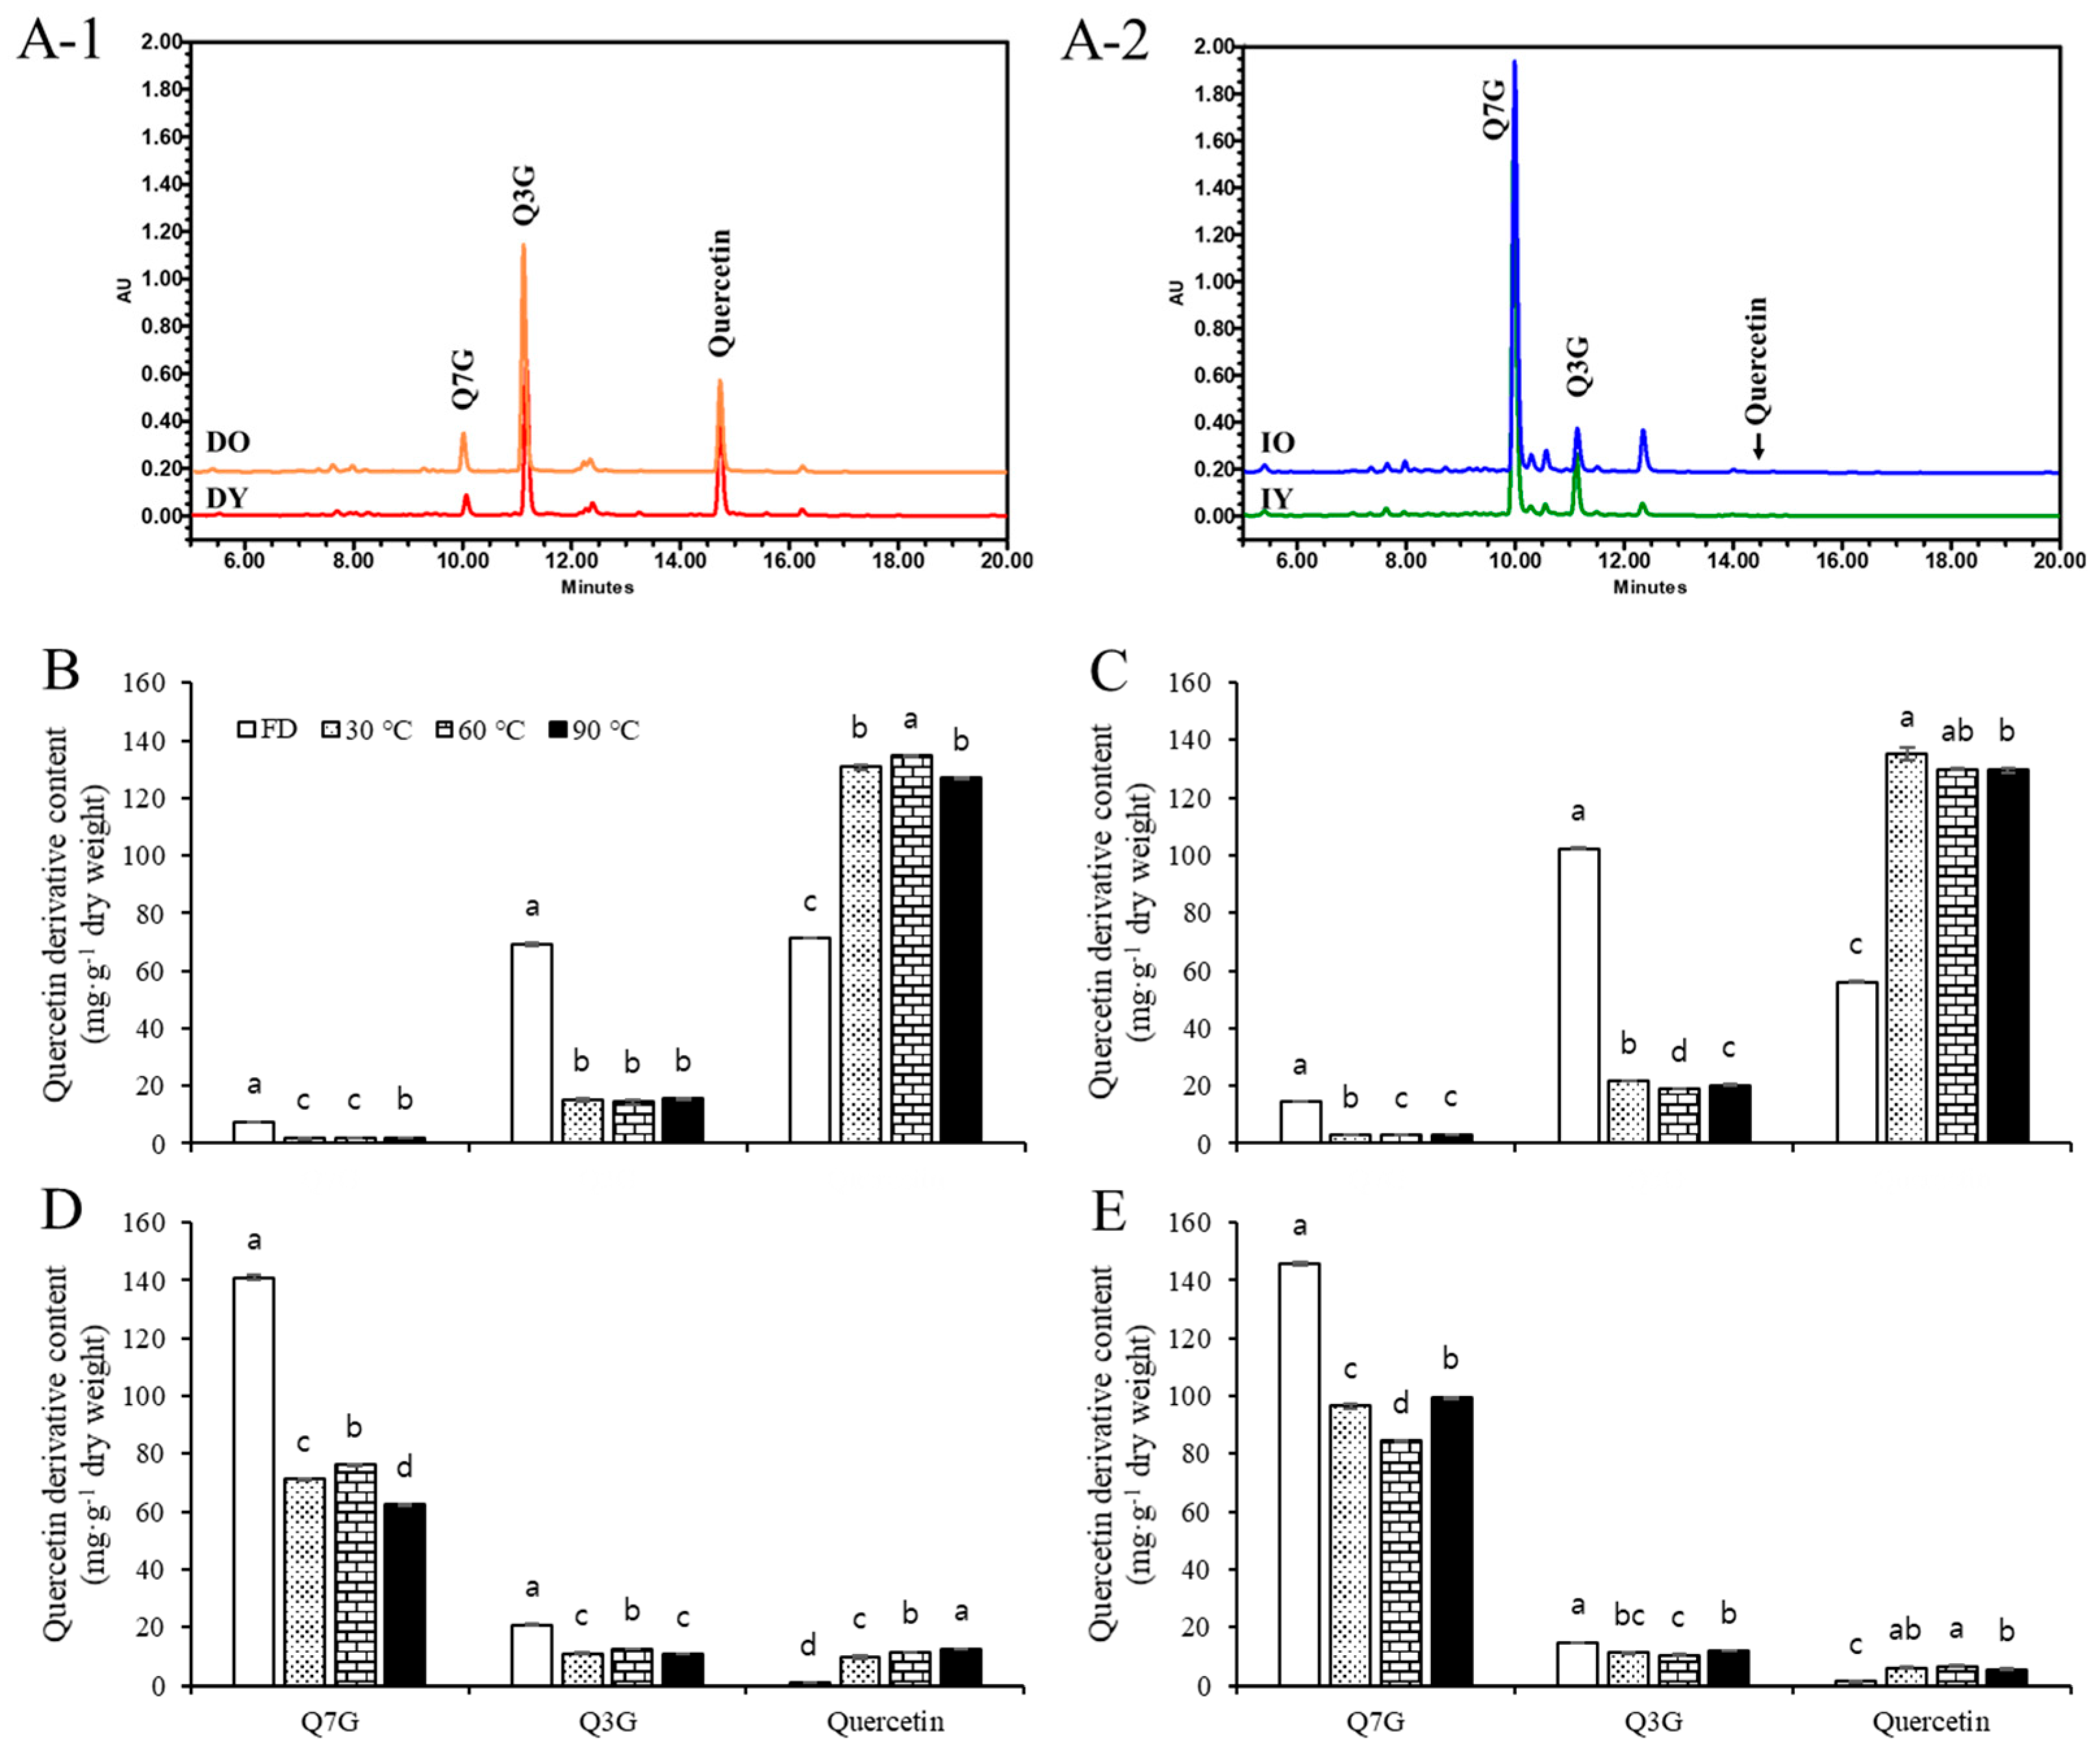
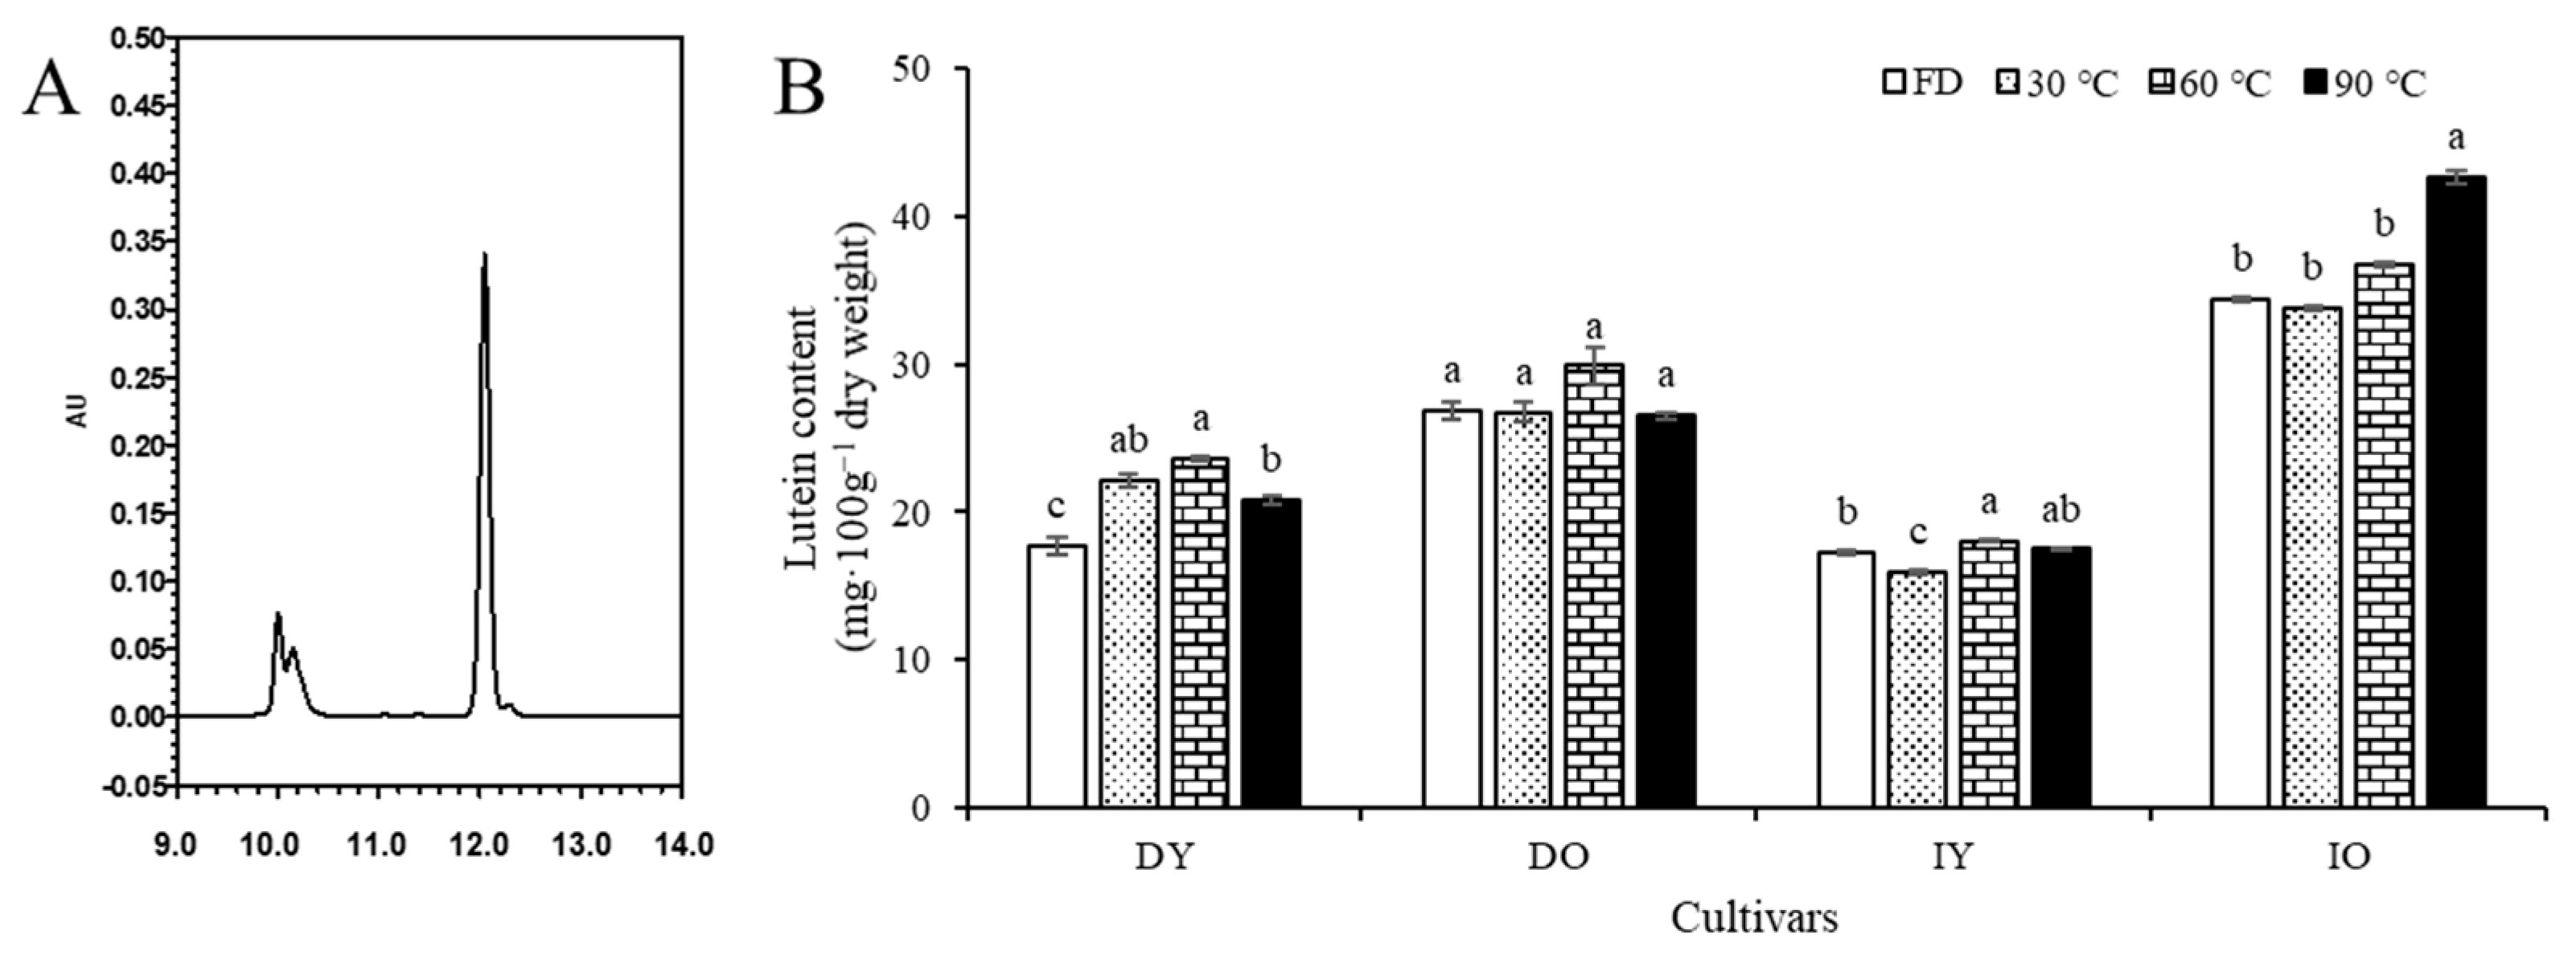
3.2. Individual Carotenoid Content

The chromatogram in Figure 2A depicts lutein in marigold petals detected through HPLC analysis, peaking at a retention time of 12.1 min. In FD, the highest lutein content was observed in the IO, exhibiting a value of 34.45 mg·100 mg−1 D.W. The content is followed by DO, DY, and IY. Regarding the lutein content (Figure 2B), three cultivars, with the exception of IO, experienced an increase in content until subjected to 60 °C HAD before the content decreased at 90 °C HAD, which was the highest temperature. In particular, DY and IY treated at 60 °C exhibited the highest values, statistically differing from other HAD temperature treatments. Meanwhile, the lutein content in IO steadily increased up to 90 °C HAD, reaching approximately 42 mg·100 mg−1 of D.W. Notably, the lutein content was higher in the orange cultivars than in the yellow cultivars regardless of drying treatments.
In various studies, it has been reported that darker-colored flowers tend to contain high levels of carotenoids, which contribute significantly to their vibrant yellow, orange, and red pigments [6,26]. Lutein, identified as the primary carotenoid within marigold petals, corroborates findings from previous studies [7]. Our results further underscored how cultivars with orange petals exhibited relatively higher levels of lutein compared to those with yellow petals, highlighting the significance of lutein in determining flower coloration. Moreover, we observed a distinct trend in the lutein content concerning the drying process (Figure 2). Interestingly, we observed a progressive increase in lutein levels up to certain drying temperatures. This phenomenon was particularly evident in cultivars DY, DO, and IY at 60 °C and in cultivar IO at 90 °C. This observation suggests that lutein accumulation has a temperature-dependent effect during drying. Similar increasing patterns via processing were observed in previous studies [22,27], indicating a strong tendency for drying treatment-induced isomerization. The increase suggests a strong tendency for heat treatment-induced isomerization [27].

3.3. Individual Flavonoid Content

Quercetin and two quercetin derivatives, Q7G and Q3G, were detected in marigold petal extracts through HPLC (Figure 3A). In FD samples, Durango cultivars, regardless of flower color, exhibited relatively higher Q3G (DY: 69.40 mg·g−1 D.W., DO: 102.44 mg·g−1 D.W.) and quercetin (DY: 71.19 mg·g−1 D.W., DO: 56.07 mg·g−1 D.W.) contents (Figure 3B,C). In the HAD, the content of quercetin derivatives (Q7G and Q3G) in the Durango cultivars was significantly reduced depending on the HAD treatment. This reduction led to an increase in the aglycone (quercetin) content by approximately 1.8 and 2.3 times, respectively. Inca cultivars treated with FD also showed consistent compositions across different flower colors. The Q7G content was relatively higher in Inca cultivars compared to the Durango cultivars, exhibiting 140.93 mg·g−1 D.W. in IY and 145.80 mg·g−1 D.W. in IO. Nevertheless, the Q7G content decreased as the HAD temperature increased. A similar downward trend was noted in the Q3G content. Interestingly, the quercetin content in the Inca cultivars increased with drying treatment, although not to the same extent as the decrease in glycosides.
Individual flavonoids, such as Q7G, Q3G, and quercetin, were detected in all cultivars. These differences in contents emerged as key characteristics distinguishing the Durango and Inca cultivars and supporting the classification of the two cultivars based on their varieties rather than color. Additionally, dry processing led to a reduction in glycoside content and an increase in aglycone content. The conversion of glycosides to aglycone following dry processing was observed not only in marigolds but also in other crops [28,29]. However, this phenomenon appears to be relatively insensitive to the temperature of HAD. This could be attributed to factors such as the changes in pH during HAD or variations in the drying time [21].

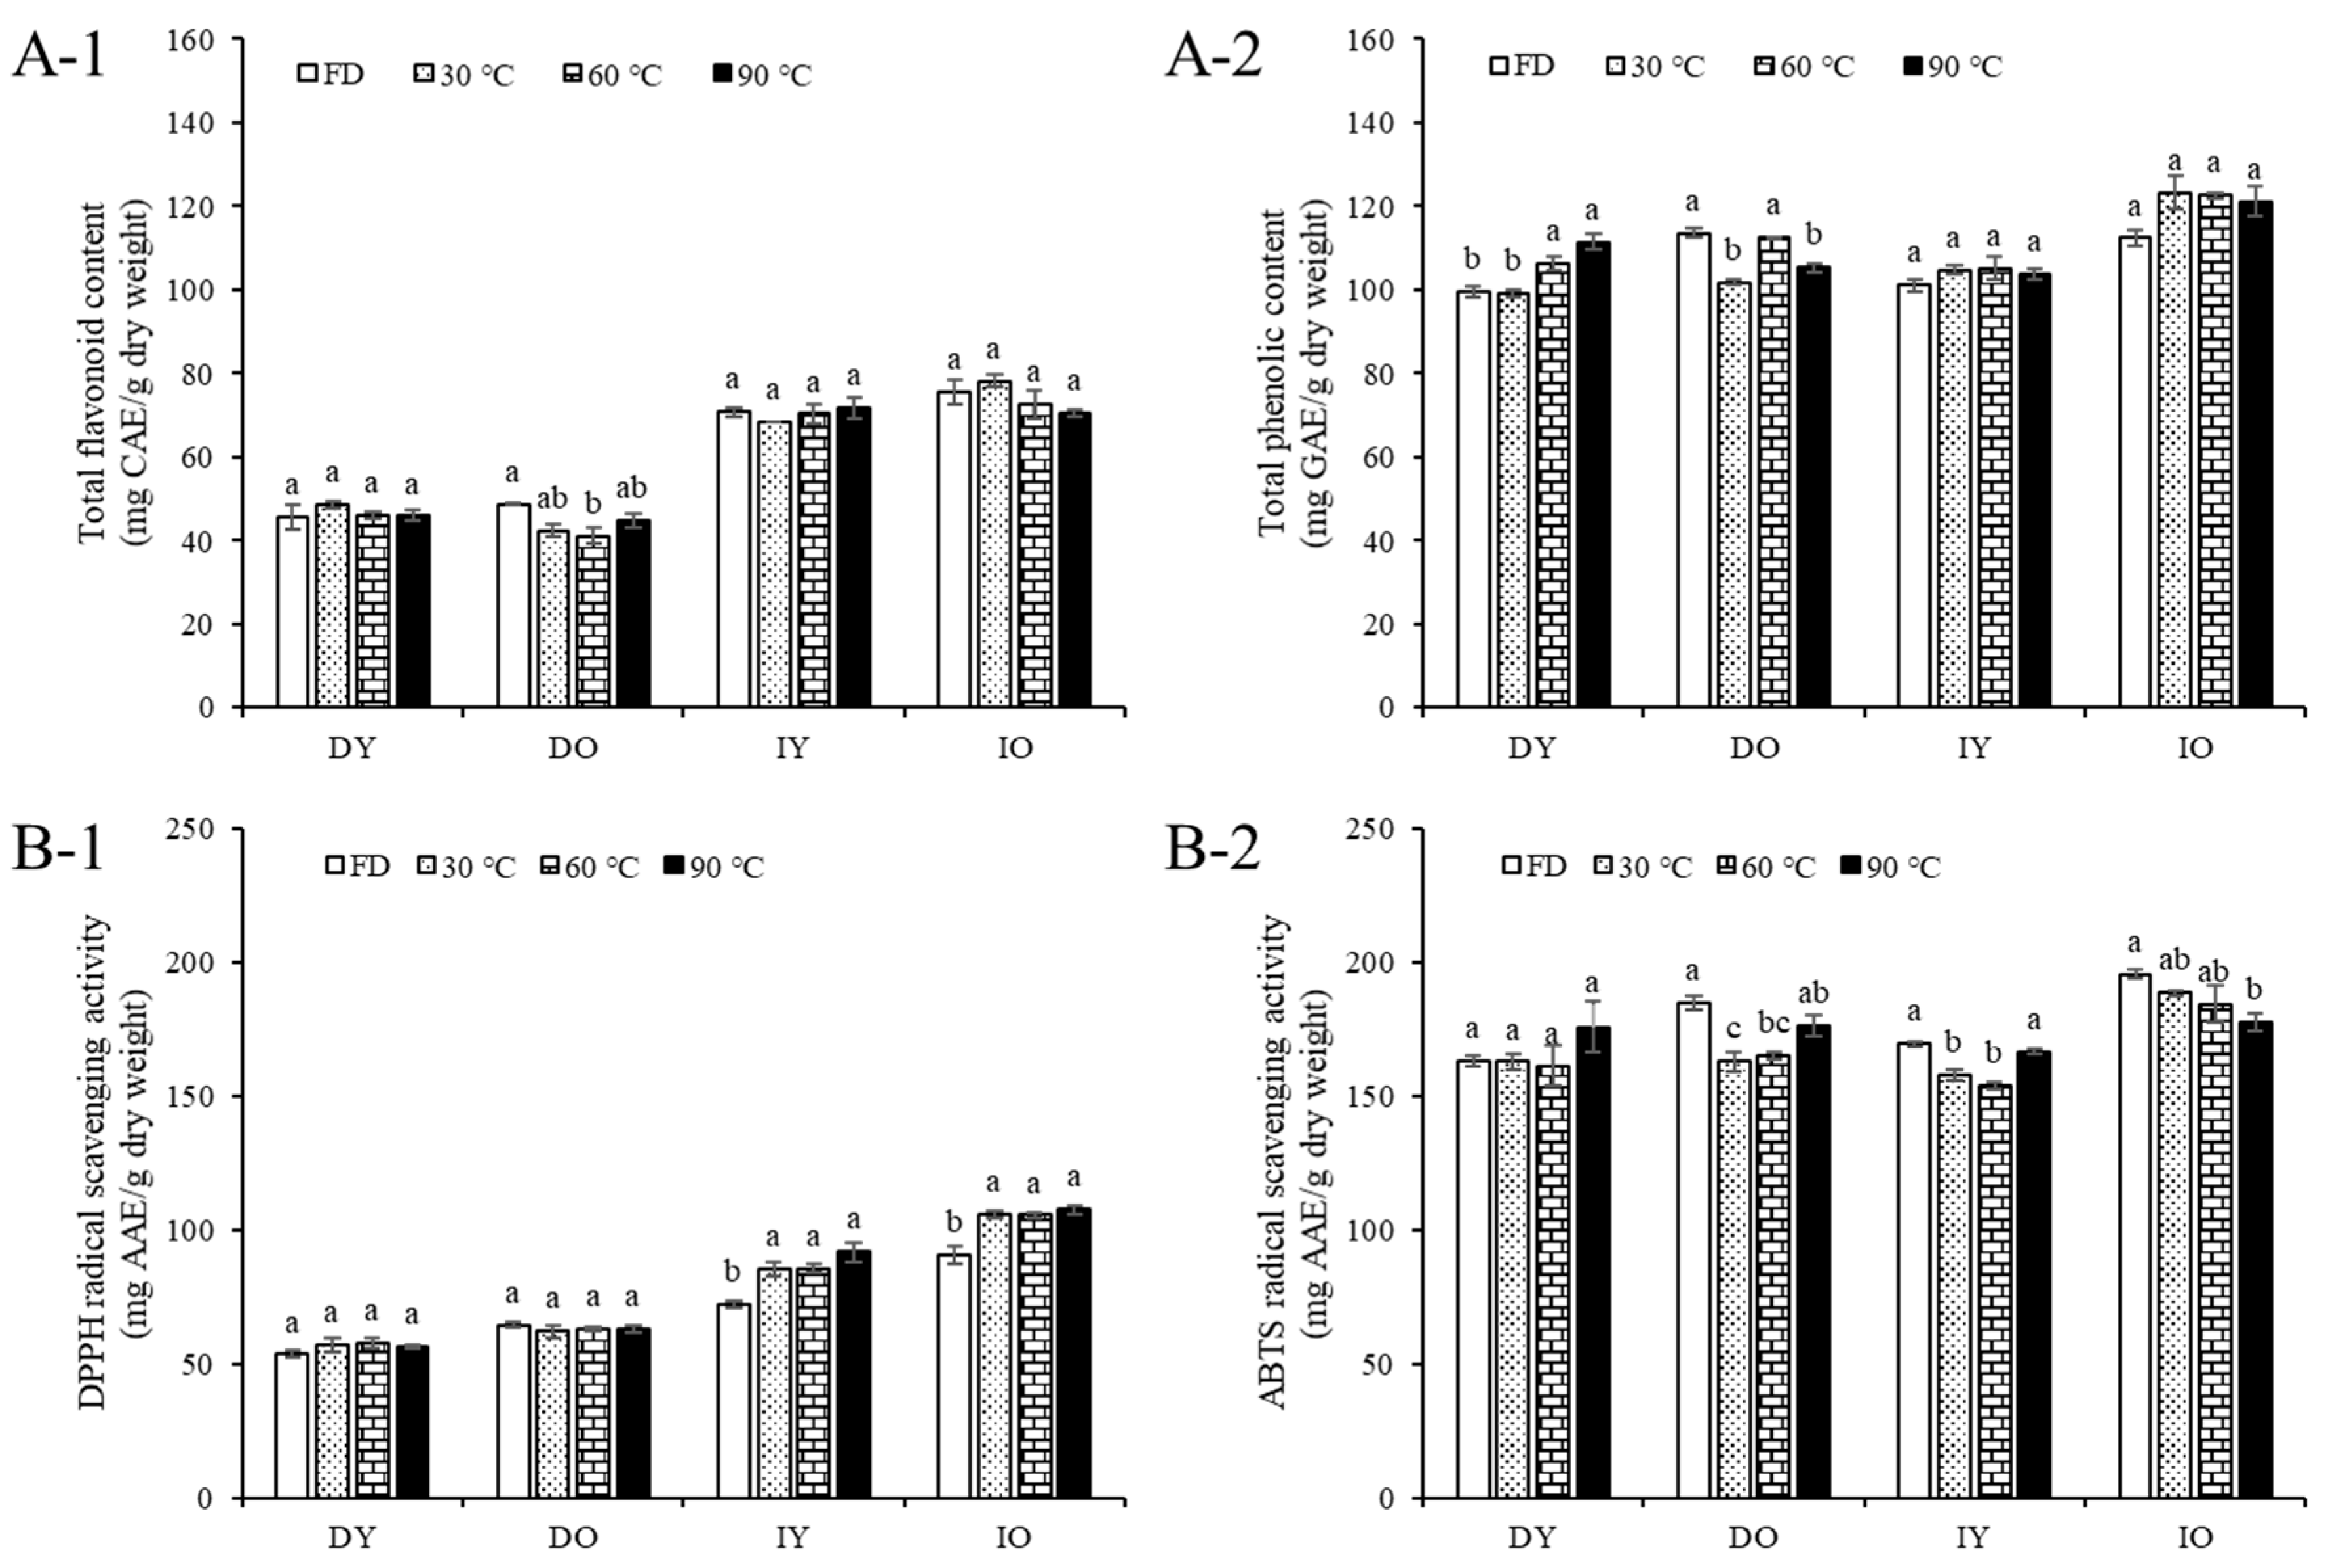
3.4. Total Flavonoids and Phenolics

The results of TFC and TFC analysis, including individual quercetin derivatives, are presented in Figure 4A. The TFC of the Durango cultivars was relatively lower than that of Inca, regardless of the drying temperature (Figure 4A-1). Specifically, the TFC of Durango ranged from 41.05 to 48.49 mg CAE·g−1 D.W. while that of the Inca cultivars ranged from 68.32 to 78.23 mg CAE·g−1 D.W. The contents of all marigold cultivars remained stable and did not exhibit significant changes with variations in drying temperature. Interestingly, the TFC remained unchanged compared to the FD in all cultivars subjected to HAD at different temperatures (Figure 4). The contents of DY and DO were primarily contributed by the sum of the individual flavonoids. However, the IY and IO contents exceeded the sum detected by HPLC analysis. These differences can be attributed to the presence of other flavonoids. In other words, Inca cultivars contained higher levels of flavonoids other than Q7G, Q3G, and quercetin than Durango cultivars.
The TPC did not show distinct differences among the cultivars, ranging from 99.16 to 123.27 mg GAE·g−1 D.W (Figure 4A-2). However, variations in the contents due to the drying temperature exhibited clear differences among the cultivars. The DY content increased with the increasing drying temperature, whereas the DO content decreased. The TPC of the Inca cultivars, irrespective of flower color, was not affected by the dry-processing temperature. In addition, the TPC of Durango cultivars either increased or decreased, whereas that of the Inca cultivars remained unchanged. This discrepancy in phenolic content could be attributed to the fact that flavonoids found in Inca petals account for the majority of phenolic compounds. Contrastingly, Durango may contain other phenolic compounds, such as phenolic acids. This speculation aligns with previous studies that have identified the presence of phenolic acids, including vanillic, syringic, quinic, and ferulic acids, in marigold petals [7].

3.5. Antioxidant Activities

Figure 4B and Table S1 show the antioxidant activities of the methanol extracts from the four marigold cultivars dried at different temperatures. The DPPH radical scavenging activity of Durango cultivars was lower compared to that of the Inca cultivars, with values ranging from 53.40 to 64.28 mg AAE·g−1 D.W (Figure 4B-1). Interestingly, the activities of the two Durango cultivars remained unchanged across different drying temperatures. Conversely, the activity of the Inca cultivars increased with drying treatment, regardless of the drying temperature. Notably, the activity of IY and IO was maximized at 90 °C HAD, reaching values of 91.69 and 107.63 mg AAE·g−1 D.W., respectively.
In contrast, the ABTS radical scavenging activity of all cultivars did not demonstrate distinct patterns in response to the drying treatment, unlike the DPPH radical scavenging activity (Figure 4B-2). The activities of the three cultivars, excluding DY, exhibited a decreasing trend as the drying temperature increased, although no statistical differences were observed. However, the activity of DY increased with drying, rising from 163.08 mg AAE·g−1 D.W. at FD to 175.69 mg AAE·g−1 D.W. at 90 °C HAD.

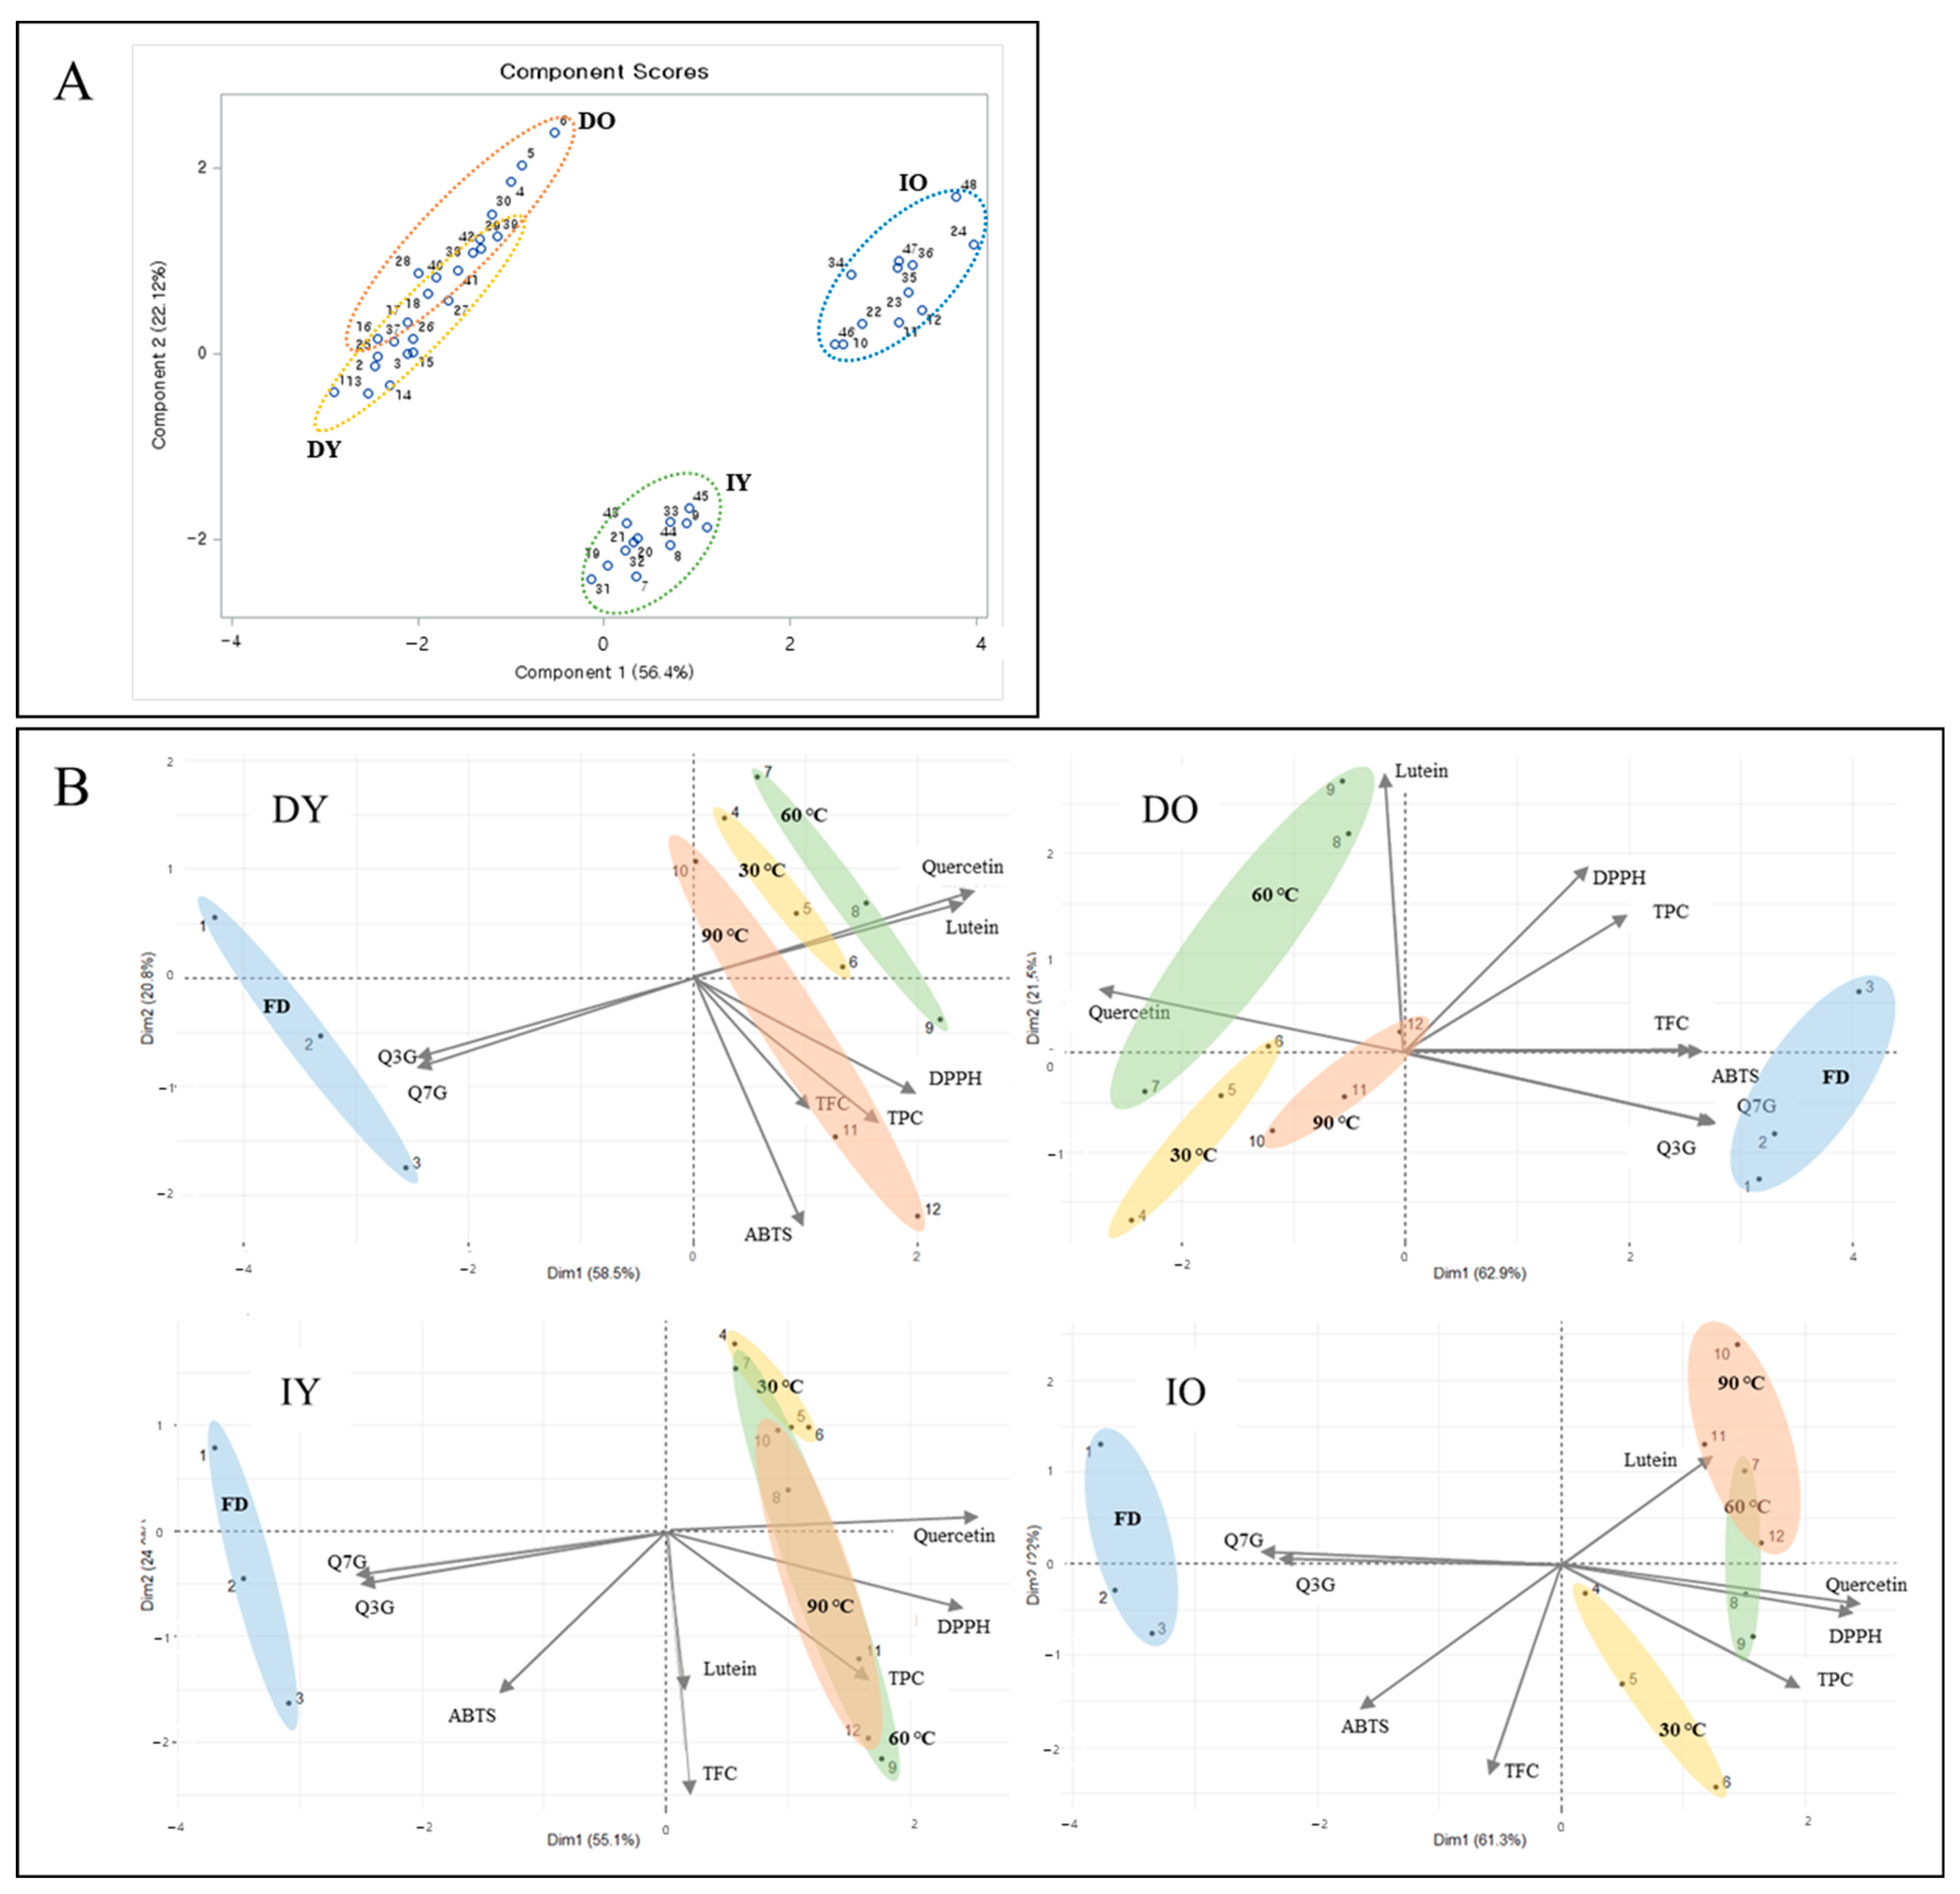
3.6. Correlation Analysis and PCA

The correlation between the antioxidant activities and metabolites was analyzed to identify the predominant compound groups contributing to the antioxidant activity in each cultivar (Table 2). DPPH radical scavenging activity was positively correlated with TFC in the Durango cultivars. Conversely, the activity showed a strong positive correlation with the quercetin content in Inca cultivars, with r = 0.91 (p < 0.001) for IY and r = 0.92 (p < 0.001) for IO. The observed increase in DPPH radical scavenging activity was especially apparent in the Inca cultivars following HAD treatment, regardless of the drying temperature (Figure 4). This increase is consistent with the increase in the quercetin content observed in the cultivars. The clear positive correlation between DPPH activity and quercetin content, shown in Table 2, further substantiates this relationship. This positive correlation can be attributed to the inherent properties of the DPPH radical, which reacts with hydrophobic compounds such as quercetin [30]. These differences across cultivars may result in the fact that other components contribute to antioxidant properties rather than those we analyzed.
The correlation of DPPH activity was categorized based on varieties, whereas ABTS radical scavenging activity was distinguished by petal color. The activities of the DY and IY cultivars, characterized by yellow petals, exhibited a positive correlation with TPC and quercetin, respectively, with IY showing a notably strong correlation with quercetin (r = 0.91, p < 0.001). The ABTS activity of cultivars with orange petals showed a positive correlation with TFC, including individual quercetin glycosides. Specifically, the activity of DO was strongly correlated with TFC, Q7G, and Q3G but inversely and negatively correlated with quercetin aglycone. However, it is noteworthy that the ABTS radical scavenging activity displayed a declining pattern in the Inca cultivars. Despite the rise in hydrophobic compounds, such as quercetin, our findings indicated a reduction in hydrophilic compounds due to HAD [31]. This decreasing trend was also observed in the DO cultivar. This phenomenon indicated that ABTS activity was not correlated with the measured compounds or was strongly correlated with quercetin glycosides, as described in Table 2. Consistent with our findings, the unique characteristics of the radicals involved contributed to the variations observed in the DPPH and ABTS radical scavenging activities [32,33].
PCA score plots, generated from the correlation data, offer an overview of the distinctions in antioxidant activities and metabolites within each cultivar (Figure 5). To validate the grouping of the four cultivars, a comprehensive PCA was conducted using data from all temperatures at which the four marigold cultivars were HAD-treated (Figure 5A). The four marigold cultivars were differentiated, with Durango and Inca separated along component 1. Furthermore, within the Inca cultivars, IO and IY were differentiated by component 2. The freeze-dried cultivars were segregated based on the HAD treatments along component 1. These were further categorized into DY, DO, IY, and IO using components 2 and 3. However, the HAD treatments, except for IY, did not separate into their components. The FD treatment in each cultivar was segregated from the other HAD treatments (30, 60, and 90 °C) by component 1 (Figure 5B). No distinct separation of drying treatments within each cultivar was observed along component 2.
In the PCA score plots for the four marigold cultivars, component 1 distinguished the Durango and Inca cultivars (Figure 5). In addition, within the Inca cultivars, IY and IO were separated by component 2. However, this distinction was not evident in the Durango cultivars. Component 2 seemed to play a crucial role in differentiating the cultivars based on petal color. Additionally, component 3 contributed to the segregation between the FD and HAD treatments. Therefore, the four marigold cultivars were separated based on their metabolites and antioxidant activities, considering both varieties and color. In particular, lutein and quercetin are assumed to be key components distinguishing variations between FD and HAD treatments.

4. Conclusions

This study provides insights into the antioxidant activity and components of four marigold cultivars with varying shapes and colors. Each cultivar contained distinct components, including lutein and quercetin derivatives. The lutein content displayed notable differences between orange and yellow petals, indicating a substantial influence on petal color. Conversely, quercetin derivatives appeared to be more affected by varieties than by color, suggesting their potential utility as distinct criteria for distinguishing between the Inca and Durango cultivars. Additionally, heat treatment emerged as a viable method for increasing marigold lutein content, considering the sprocessing temperature. Our study establishes that quercetin derivatives have the potential to enhance DPPH radical scavenging activity in Inca cultivars by promoting greater aglycone formation post-HAD treatment. While critical changes in antioxidant activity and related compounds within the designated temperature range were not observed, we identified distinct patterns in the component contents based on the varieties and colors of the flowers. In summary, our study offers valuable insights into optimizing marigold cultivars and processing conditions for specific purposes. Ultimately, the chemical composition of different marigold cultivars can serve as a criterion for distinguishing between cultivars while also offering insights into antioxidant activity and related compounds for their utilization. Moreover, considering the antioxidant activity and lutein content in the IO cultivar, drying above 60 °C may be regarded as a suitable process for optimizing moisture content and thermal conversion for bioactive compounds. Thus, these findings could be used to provide practical guidance for the processing and utilization of marigold flowers in numerous industries, including food, pharmaceuticals, and cosmetics.

Supplementary Materials

The following supporting information can be downloaded at: https://www.mdpi.com/article/10.3390/horticulturae10040382/s1, Figure S1: Changes of relative water contents of four marigold cultivars during dry processing. A–D indicate DY (Durango yellow), DO (Durango orange), IY (Inca yellow), and IO (Inca orange), respectively. Table S1: The EC50 (mg·mL−1) for the antioxidant activity in marigold petals dried at different temperatures.

Author Contributions

Conceptualization, S.H.E.; methodology, J.H.K., Y.J.L. and S.H.E.; software, J.H.K.; validation, S.H.E.; formal analysis, J.H.K. and J.-H.K.; investigation, J.H.K., Y.J.L. and J.-H.K.; resources, S.H.E.; data curation, J.H.K. and Y.J.L.; writing—original draft preparation, J.H.K. and Y.J.L.; writing—review and editing, S.H.E.; visualization, J.H.K.; supervision, S.H.E.; funding acquisition, S.H.E. All authors have read and agreed to the published version of the manuscript.

Funding

This research was funded by the National Research Foundation of Korea (NRF; Grant NRF-2022R1A2C100769512) and by the BK21 FOUR program of Graduate School, Kyung Hee University (SG-1-JO-NON-2022607).

Data Availability Statement

Data are contained within the article and Supplementary Materials.

Conflicts of Interest

The authors declare no conflicts of interest.

References

  1. Sowbhagya, H.B.; Sampathu, S.R.; Krishnamurthy, N. Natural colorant from marigold-chemistry and technology. Food Rev. Int. 2004, 20, 33–50. [Google Scholar] [CrossRef]
  2. Chitrakar, B.; Zhang, M.; Bhandari, B. Edible flowers with the common name “marigold”: Their therapeutic values and processing. Trends Food Sci. 2019, 89, 76–87. [Google Scholar] [CrossRef]
  3. Mlcek, J.; Plaskova, A.; Jurikova, T.; Sochor, J.; Baron, M.; Ercisli, S. Chemical, nutritional and sensory characteristics of six ornamental edible flowers species. Foods 2021, 10, 2053. [Google Scholar] [CrossRef] [PubMed]
  4. Dorozko, J.; Kunkulberga, D.; Sivicka, I.; Kruma, Z. The influence of various drying methods on the quality of edible flower petals. CABI 2019, 32, 182–187. [Google Scholar]
  5. Sowbhagya, H.B.; Sushma, S.B.; Rastogi, N.K.; Naidu, M.M. Effect of pretreatments on extraction of pigment from marigold flower. J. Food Sci. Technol. 2013, 50, 122–128. [Google Scholar] [CrossRef] [PubMed]
  6. Sommano, S.; Suksathan, R.; Colelli, G.; Kumpuan, W. Potentials of Thai tropical edible flowers as fresh cut salad mix. ISHS 2016, 1194, 1187–1194. [Google Scholar] [CrossRef]
  7. Park, Y.J.; Park, S.Y.; Valan Arasu, M.; Al-Dhabi, N.A.; Ahn, H.G.; Kim, J.K.; Park, S.U. Accumulation of carotenoids and metabolic profiling in different cultivars of Tagetes flowers. Molecules 2017, 22, 313. [Google Scholar] [CrossRef] [PubMed]
  8. Sing, Y.; Gupta, A.; Kannojia, P. Tagetes erecta (Marigold)—A review on its phytochemical and medicinal properties. Curr. Med. Drugs Res. 2020, 4, 201. [Google Scholar] [CrossRef]
  9. Bhattacharyya, S.; Datta, S.; Mallick, B.; Dhar, P.; Ghosh, S. Lutein content and in vitro antioxidant activity of different cultivars of Indian marigold flower (Tagetes patula L.) extracts. J. Agric. Food Chem. 2010, 58, 8259–8264. [Google Scholar] [CrossRef]
  10. Calvo, M.M. Lutein: A valuable ingredient of fruit and vegetables. Crit. Rev. Food Sci. Nutr. 2005, 45, 671–696. [Google Scholar] [CrossRef]
  11. Bhattacharyya, S.; Roychowdhury, A.; Ghosh, S. Lutein content, fatty acid composition and enzymatic modification of lutein from marigold (Tagetes patula L.) flower petals. J. Indian Chem. Soc. 2008, 85, 942–944. [Google Scholar]
  12. Piccaglia, R.; Marotti, M.; Grandi, S. Lutein and lutein ester content in different types of Tagetes patula and T. erecta. Ind. Crops Prod. 1998, 8, 45–51. [Google Scholar] [CrossRef]
  13. Kim, J.H.; Duan, S.; Lim, Y.J.; Eom, S.H. Changes in quercetin derivatives and antioxidant activity in marigold petals (Tagetes patula L.) Induced by Ultraviolet-B irradiation and methyl jasmonate. Plants 2022, 11, 2947. [Google Scholar] [CrossRef] [PubMed]
  14. Akshaya, H.R.; Namita, N.; Singh, K.P.; Saha, S.; Panwar, S.; Bharadwaj, C. Determination and correlation of carotenoid pigments and their antioxidant activities in marigold (Tagetes sp.) flowers. Indian J. Agric. Sci. 2017, 87, 390–396. [Google Scholar] [CrossRef]
  15. Mir, R.A.; Ahanger, M.A.; Agarwal, R.M. Marigold: From mandap to medicine and from ornamentation to remediation. Am. J. Plant Sci. 2019, 10, 309. [Google Scholar] [CrossRef]
  16. Ratti, C. Hot air and freeze-drying of high-value foods: A review. J. Food Eng. 2001, 49, 311–319. [Google Scholar] [CrossRef]
  17. Kurniawan, J.M.; Yusuf, M.M.; Azmi, S.S.; Salim, K.P.; Utami Prihastyanti, M.N.; Indrawati, R.; Heriyanto; Shioi, Y.; Limantara, L.; Panintingjati Brotosudarmo, T.H. Effect of drying treatments on the contents of lutein and zeaxanthin in orange-and yellow-cultivars of marigold flower and its application for lutein ester encapsulation. IOP Conf. Ser. Mater. Sci. Eng. 2019, 509, 012060. [Google Scholar] [CrossRef]
  18. Zhao, L.; Fan, H.; Zhang, M.; Chitrakar, B.; Bhandari, B.; Wang, B. Edible flowers: Review of flower processing and extraction of bioactive compounds by novel technologies. Food Res. Int. 2019, 126, 108660. [Google Scholar] [CrossRef] [PubMed]
  19. Rathod, P.; Vala, M.; Maitreya, B. Drying techniques of some selected ornamental flowers—A reviews. EPRA Int. J. Res. Dev. (IJRD) 2021, 6, 180–186. [Google Scholar] [CrossRef]
  20. Ahluwalia, P.; Kaur, A.; Dhillon, G.K. Effect of different drying methods on chemical and functional properties of marigold petals. Int. J. Food Nutr. Sci. 2012, 3, 53–59. [Google Scholar]
  21. Buser, M.D.; Stone, M.L.; Brusewitz, G.H.; Maness, N.O.; Whitelock, D.P. Thin-layer drying of marigold flowers and flower components for petal removal. Trans. ASAE 1999, 42, 1367–1374. [Google Scholar] [CrossRef]
  22. Siriamornpun, S.; Kaisoon, O.; Meeso, N. Changes in colour, antioxidant activities and carotenoids (lycopene, β-carotene, lutein) of marigold flower (Tagetes erecta L.) resulting from different drying processes. J. Funct. Foods 2012, 4, 757–766. [Google Scholar] [CrossRef]
  23. Bhave, A.; Schulzová, V.; Mrnka, L.; Hajšlová, J. Influence of harvest date and postharvest treatment on carotenoid and flavonoid composition in French marigold flowers. J. Agric. Food Chem. 2020, 68, 7880–7889. [Google Scholar] [CrossRef] [PubMed]
  24. Lim, Y.J.; Eom, S.H. The different contributors to antioxidant activity in thermally dried flesh and peel of astringent persimmon fruit. Antioxidants 2022, 11, 597. [Google Scholar] [CrossRef] [PubMed]
  25. Lim, Y.J.; Kwon, S.J.; Qu, S.; Kim, D.G.; Eom, S.H. Antioxidant contributors in seed, seed coat, and cotyledon of γ-ray-induced soybean mutant lines with different seed coat colors. Antioxidants 2021, 10, 353. [Google Scholar] [CrossRef] [PubMed]
  26. Zhang, H.; Zhang, S.; Zhang, H.; Chen, X.; Liang, F.; Qin, H.; Zhang, Y.; Cong, R.; Xin, H.; Zhang, Z. Carotenoid metabolite and transcriptome dynamics underlying flower color in marigold (Tagetes erecta L.). Sci. Rep. 2020, 10, 16835. [Google Scholar] [CrossRef]
  27. Rubio-Diaz, D.E.; Santos, A.; Francis, D.M.; Rodriguez-Saona, L.E. Carotenoid stability during production and storage of tomato juice made from tomatoes with diverse pigment profiles measured by infrared spectroscopy. J. Agric. Food Chem. 2010, 58, 8692–8698. [Google Scholar] [CrossRef]
  28. Muliterno, M.M.; Rodrigues, D.; de Lima, F.S.; Ida, E.I.; Kurozawa, L.E. Conversion/degradation of isoflavones and color alterations during the drying of okara. LWT 2017, 75, 512–519. [Google Scholar] [CrossRef]
  29. Chaaban, H.; Ioannou, I.; Chebil, L.; Slimane, M.; Gérardin, C.; Paris, C.; Charbonnel, C.; Chekir, L.; Ghoul, M. Effect of heat processing on thermal stability and antioxidant activity of six flavonoids. J. Food Process. Preserv. 2017, 41, e13203. [Google Scholar] [CrossRef]
  30. Ozdemir, M.; Gungor, V.; Melikoglu, M.; Aydiner, C. Solvent selection and effect of extraction conditions on ultrasound-assisted extraction of phenolic compounds from galangal (Alpinia officinarum). J. Appl. Res. Med. 2024, 38, 100525. [Google Scholar] [CrossRef]
  31. Kim, J.H.; Duan, S.; Park, Y.R.; Eom, S.H. Tissue-specific antioxidant activities of germinated seeds in lentil cultivars during thermal processing. Antioxidants 2023, 12, 670. [Google Scholar] [CrossRef]
  32. Elfalleh, W.; Nasri, N.; Marzougui, N.; Thabti, I.; M’rabet, A.; Yahya, Y.; Lachiheb, B.; Guasmi, F.; Ferchichi, A. Physico-chemical properties and DPPH-ABTS scavenging activity of some local pomegranate (Punica granatum) ecotypes. Int. J. Food Sci. Nutr. 2009, 60, 197–210. [Google Scholar] [CrossRef]
  33. Zhang, H.; Yang, Y.F.; Zhou, Z.Q. Phenolic and flavonoid contents of mandarin (Citrus reticulata Blanco) fruit tissues and their antioxidant capacity as evaluated by DPPH and ABTS methods. J. Integr. Agric. 2018, 17, 256–263. [Google Scholar] [CrossRef]
Figure 1. Morphological appearance of four marigold cultivars.
Horticulturae 10 00382 g001
Figure 2. Chromatogram of lutein standard (A) and content (B) of lutein extracted from four marigold cultivars processed at different temperatures. Different letters above each bar indicate a significant difference at p < 0.05 using Tukey’s studentized range (HSD) test.
Horticulturae 10 00382 g002
Figure 3. Chromatograms (A) and contents (BE) of quercetin derivatives in four marigold cultivars subjected to different drying temperatures. Panels (A-1,A-2) indicate chromatograms in Durango and Inca, respectively. Panels (BE) correspond to Durango yellow, Durango orange, Inca yellow, and Inca orange, respectively. Different letters above each bar denote significant differences at p < 0.05 using Tukey’s studentized range (HSD) test.
Horticulturae 10 00382 g003
Figure 4. Total flavonoid and phenolic contents (A-1,A-2) and antioxidant activities (B-1,B-2) in four marigold cultivars dried at different temperatures. Different letters above each bar indicate a significant difference at p < 0.05 using Tukey’s studentized range (HSD) test. CAE, catechin equivalents; GAE, gallic acid equivalents; DPPH, 2,2-diphenyl-1-picrylhydrazyl radical scavenging activity; ABTS, 2,2′-azino-bis (3-ethylbenzothiazoline-6-sulphonic acid radical scavenging activity; AAE, ascorbic acid equivalents.
Horticulturae 10 00382 g004
Figure 5. Principal component analysis (PCA) plots generated from compound contents and the antioxidant activity data of four marigold cultivars. (A) The grouping of the variables in the first two principal components within four marigold cultivars dried at all temperatures and (B) classification according to the temperature treatment within each cultivar. The numbers in the plots in graph (B) represent the scores for FD (1−3), 30 °C (4−6), 60 °C (7−9), 90 °C (10−12).
Horticulturae 10 00382 g005
Table 1. Individual compounds, total flavonoids, total phenolic contents and antioxidant activities in the freeze-dried marigold.
AntioxidantsCultivar
DYDOIYIO
CarotenoidLutein17.70 ± 0.63 c26.84 ± 0.63 b17.20 ± 0.17 c31.45 ± 0.15 a
FlavonoidQ7G7.65 ± 0.04 d14.44 ± 0.03 c140.93 ± 0.69 b145.80 ± 0.49 a
Q3G69.40 ± 0.52 b102.44 ± 0.05 a20.82 ± 0.19 c14.57 ± 0.11 d
Quercetin71.19 ± 0.07 a56.07 ± 0.22 b0.59 ± 0.03 d1.19 ± 0.25 c
Total flavonoids 45.73 ± 3.01 b48.63 ± 0.19 b70.81 ± 0.98 a75.60 ± 3.00 a
Total phenolics 99.48 ± 1.19 b113.66 ± 0.92 a101.16 ± 1.51 b112.44 ± 1.87 a
Antioxidant activityDPPH53.40 ± 1.30 d64.28 ± 1.01 c72.13 ± 1.28 b90.60 ± 3.51 a
ABTS163.08 ± 2.10 c184.57 ± 2.47 b169.33 ± 0.87 c195.50 ± 1.67 a
The contents of carotenoids and flavonoids were expressed as mg·100 mg−1 D.W. and mg·g−1 D.W., respectively. The total flavonoid and phenolic contents were expressed as mg catechin equivalents·g−1 of dry weight and mg gallic acid equivalents·g−1 of dry weight, respectively. The antioxidant activity was expressed as mg ascorbic acid equivalents·g−1 of dry weight. Different letters on same row indicate significant differences (p < 0.05) according to Tukey’s studentized range (HSD) test. Q7G, quercetin 7-O-glucoside; Q3G, quercetin-3-O-glucoside; DPPH, 2,2-diphenyl-1-picrylhydrazyl radical scavenging activity; and ABTS, 2,2′-azino-bis (3-ethylbenzothiazoline-6-sulphonic acid radical scavenging activity.
Table 2. Correlation coefficients between antioxidant activities and compounds in four marigold cultivars.
CultivarsVariablesDPPHABTSTPCTFCLuteinQ7GQ3GQuercetin
DYDPPH1
ABTS0.48 ns1
TPC0.48 ns0.73 *1
TFC0.63 *0.31 ns0.04 ns1
Lutein0.68 *0.00 ns0.36 ns0.37 ns1
Q7G−0.50 ns−0.13 ns−0.44 ns−0.16 ns−0.86 **1
Q3G−0.52 ns−0.16 ns−0.48 ns−0.15 ns−0.86 **1.00 ***1
Quercetin0.55 ns0.12 ns0.45 ns0.18 ns0.90 ***−0.99 ***−0.99 ***1
DODPPH1
ABTS0.60 *1
TPC0.43 ns0.51 ns1
TFC0.67 *0.91 ***0.38 ns1
Lutein0.48 ns−0.11 ns0.49 ns−0.12 ns1
Q7G0.31 ns0.78 **0.60 *0.74 *−0.23 ns1
Q3G0.31 ns0.76 **0.59 *0.73 *−0.23 ns1.00 ***1
Quercetin−0.30 ns−0.77 **−0.64 *−0.71 *0.21 ns−1.00 ***−0.99 ***1
IYDPPH1
ABTS−0.2 ns1
TPC0.69 *−0.13 ns1
TFC0.32 ns0.48 ns0.55 ns1
Lutein0.14 ns0.07 ns0.13 ns0.42 ns1
Q7G−0.89 ***0.53 ns−0.46 ns0.07 ns0.04 ns1
Q3G−0.88 **0.55 ns−0.46 ns0.40 ns0.11 ns1.00 ***1
Quercetin0.91 ***−0.53 ns0.50 ns0.00 ns0.13 ns−0.98 ***−0.97 ***1
IODPPH1
ABTS−0.51 ns1
TPC0.89 **−0.10 ns1
TFC0.03 ns0.61 *0.25 ns1
Lutein0.51 ns−0.51 ns0.30 ns−0.42 ns1
Q7G−0.85 **0.59 *−0.70 *0.20 ns−0.30 ns1
Q3G−0.76 **0.57 ns−0.61 *0.25 ns−0.20 ns0.99 ***1
Quercetin0.92 ***−0.54 ns0.78 **−0.07 ns0.31 ns−0.98 ***−0.95 ***1
DY, Durango yellow; DO, Durango orange; IY, Inca yellow; IO, Inca orange; TPC, total phenolic content; TFC, total flavonoid content; Q7G, quercetin-7-O-glucoside; Q3G, quercetin-3-O-glucoside. Asterisks indicate significance (ns no significance, * p < 0.05, ** p < 0.01, *** p < 0.001) determined by Pearson’s correlation analysis.
Disclaimer/Publisher’s Note: The statements, opinions and data contained in all publications are solely those of the individual author(s) and contributor(s) and not of MDPI and/or the editor(s). MDPI and/or the editor(s) disclaim responsibility for any injury to people or property resulting from any ideas, methods, instructions or products referred to in the content.

