Article

Growth, Physiological, and Biochemical Responses of a Medicinal Plant Launaea sarmentosa to Salinity

1
Faculty of Biology and Environmental Science, The University of Da Nang—University of Science and Education, Da Nang City 550000, Vietnam
2
NTT Hi-Tech Institute, Nguyen Tat Thanh University, Ho Chi Minh City 700000, Vietnam
3
Department of Plant Pathology, Faculty of Agriculture, Sher-e-Bangla Agricultural University, Dhaka 1207, Bangladesh
*
Authors to whom correspondence should be addressed.
Horticulturae 2024, 10(4), 388; https://doi.org/10.3390/horticulturae10040388
Submission received: 5 March 2024 / Revised: 8 April 2024 / Accepted: 10 April 2024 / Published: 11 April 2024

Abstract

:
Launaea sarmentosa is a valuable medicinal plant with adaptability in saline areas, but it is still unclear how it responds to salinity. For the first time, the present study examined the plant’s changes under different soil salinities generated by 50, 100, 200, and 400 mM NaCl in order to elucidate its responses in terms of growth, photosynthesis, water uptake, osmotic adjustment, ion homeostasis, and oxidative stress defense to salinity. The results showed that the plant’s growth was enhanced by 50 mM NaCl with an 18.07% increase in dry biomass compared to the control, whereas higher salinity levels reduced its growth with a 6.39–54.85% decrease in dry biomass. The plant’s growth response indicates that it had tolerance to salinity levels up to 400 mM NaCl. The accumulation of photosynthetic pigments, including chlorophylls (a + b) and carotenoids, was enhanced under salinity, except for a reduced accumulation under 400 mM NaCl. Relative water content decreased while proline content increased in the salt-stressed plants. Moreover, the salt-stressed plants reduced their K+ and NO3 content along with increases in Na+ and Cl content. The high salt stress level also caused oxidative stress in the plants, which was revealed through the accumulation of malondialdehyde and hydrogen peroxide content. In addition, the salt-stressed plants had increased total phenolic content and the activities of antioxidant enzymes such as catalase, peroxidase, and superoxide dismutase. These physiological and biochemical changes suggest that L. sarmentosa evolved adaptive mechanisms in photosynthesis, osmotic adjustment, ion homeostasis, and antioxidant defense for growing under salt stress.

1. Introduction

Soil salinity degradation, attributed to the predominant accumulation of NaCl salt in soils, has become one of the most important challenges for agricultural productivity and sustainability owing to its adverse effects on seed germination, growth, and yield of crops. Soils are salinized mainly by natural processes and anthropogenic activities. According to estimates, salt-affected soils can occupy more than 20% of the world’s arable area [1]. High levels of soil salinity create different pressures on plants, such as osmotic stress, ion toxicity, nutritional imbalance, oxidative stress, disordered metabolism, and even genotoxicity [2,3]. Together, these detrimental effects interrupt physiological and, metabolic processes in plants that will hinder their growth and development and in extreme cases, cause plants to die [3]. Thus, changes in morphology, growth of organs, as well as physiological and biochemical properties, such as photosynthesis, water uptake, ion and metabolite accumulation, activity of enzymes, etc., are indicators for plants’ responses to salt, from which the effects of salt and tolerance mechanisms of plants may be identified [4,5,6].
Because most crops are susceptible to salinity, improving their tolerance and developing plants that tolerate high salinity as alternative crops are considered potential strategies for maintaining sustainable agriculture production [7,8]. For these strategies, understanding the salt tolerance mechanisms of salt-tolerant plants is required. It was reported that salt-tolerant plants have evolved diverse mechanisms at organ, cell, and even molecular levels that mitigate the effects of salinity [2,9]. For example, adjustment of intercellular osmotic potential to maintain water uptake, salt sequestration into vacuoles or organs to reduce ion toxicity, and reducing salt-induced reactive oxygen species (ROS) by antioxidant systems are found to be successful adaptations of many salt-tolerant plants to salinity [9,10,11]. Although a large variety of previous studies have been conducted to elucidate the salt tolerance mechanisms of various plants, the mechanisms may vary depending on plant species [11]. Thus, it needs more effort to clearly understand the salt tolerance mechanisms of plants.
Launaea sarmentosa (syn. Launaea pinnatifida) is a perennial stoloniferous herb belonging to the Asteraceae family. It is morphologically characterized by a filamentous stem creeping to 1 m long, leaves in oblanceolate denticulate shape forming in a rosette at the stem base or inter nodes, flowers with 12–20 yellow florets per capitulum, achenes with grey to brown color and 3.5–5 mm long, and a semi-woody taproot and adventitious roots emerging at the inter nodes [12]. This species is natively distributed in littoral sandy regions in East Africa, India, the Indian Ocean Islands, and Southeast Asia [13]. In Asian countries such as India, Thailand, and Vietnam, it is used not only as a folk medicine for the cure against many diseases, such as rheumatoid arthritis, gout, skin injuries, abdominal disorders, urinary infections, inflammation, fever, sore throats, and jaundice [13,14,15,16], but also as a nutritious vegetable [13,14]. The root is also used as a galactagogue that improves the milk production of mothers after childbirth [15]. Previous phytochemical analyses reported the presence of bioactive compounds such as alkaloids, steroids, saponins, and flavonoids in L. sarmentosa aerial parts and roots [16,17]. Recently, Nguyen et al. isolated two new compounds (sarmentosin A and B) and 14 known compounds for the first time from the aerial parts [17]. The leaf and root extract also exhibited anti-inflammatory, antimicrobial, antioxidant, analgesic, antipyretic, and hepatoprotective activities in vitro assays [15,18]. In recent years, L. sarmentosa has been established for commercial cultivation by local farmers and companies in Thailand and Vietnam for both uses as medicinal material and food with high commercial value [13]. Remarkably, it was proposed that the plant has an adaptability to salinity due to its native habitat, which can be affected by salt spray and the intrusion of sea water [13,19]. However, how the plant responds to salinity is still not studied.
Thus, for the first time, the present study examined changes in growth, and physiological and biochemical parameters, which are associated with biomass, photosynthesis, water uptake, ion accumulation, osmotic adjustment, and antioxidant activity, of the plants imposed on different salinity levels to understand the plant’s tolerance capacity and typical responses to salt. From the plant’s responses, its salt tolerance mechanism was also discussed.

2. Materials and Methods

2.1. Plant Material and Growth Conditions

L. sarmentosa seeds were sown in a plastic tray filled with a mixture of coco peat, vermiculite, and perlite with a respective ratio of 2:1:1 [20]. pH values and electrical conductivity (salinity) of the mixture ranged from 6.0 to 6.1 and 0.10 to 0.14 dS/m, respectively. The seed was germinated in greenhouse conditions with air temperature and humidity ranging from 25 to 30 °C and 80 to 90%, respectively. Three two-week-old seedlings were transplanted into a 0.5-L pot containing the same mixture. The pots were placed in a growth chamber (CMP6010-Conviron, Canada) with an established condition such as temperature/photoperiod regime with 28 °C/14 h light and 25 °C/10 h dark, 75% relative humidity, and 10.000 lux light intensity. The seedlings were irrigated with a half-strength Hoagland nutrient solution (no. 2) for 3–4 weeks before the onset of salt treatments.

2.2. Salt Treatment and Sample Collection

The healthy seedlings with four true leaves were irrigated with the half-strength Hoagland nutrient solutions supplied with 0 (control), 50, 100, 200, and 400 mM NaCl. The salt irrigation was carried out by a procedure as described by Sahin et al. [20], in which the plants were exposed to increasing salt concentrations before being treated with the designated concentration to avoid osmotic shocks. In brief, on the first day, the plants were irrigated with 50 mM NaCl, and then the 100–400 NaCl-designated plants were irrigated with 100 mM NaCl on the second day. On the third day, the 200–400 NaCl-designated plants were irrigated with 200 mM NaCl, and the 400 mM NaCl-designated plants were irrigated with 400 mM on the fourth day. On the following days, the treated plants were irrigated with the designated salt concentrations. The salt-treated plants were under saline conditions for a total of 14 days after the onset of the 50 mM NaCl treatment. In each irrigation, the salt solutions were applied continuously to the mixture until an outflow occurred from the bottom with a minimum amount that was approximate to the pot’s volume. The irrigation was repeated each day during the treatment period. For the study’s purpose, growth parameters were observed on day 14 of the treatment, while the physiological and biochemical parameters of the leaves were examined on day 7, which showed obvious effects of the salt treatments.

2.3. Determination of Growth Parameters

The plants were carefully removed from the pots to determine the fresh weight (FW) of the whole plant, aerial parts (assigned as shoots), and roots. The samples were then dried at 70 °C for 48 h in a drying oven and weighed for dry weight (DW) [20].

2.4. Determination of Photosynthetic Pigment Content

The contents of chlorophyll a (chl a), chlorophyll b (chl b), and carotenoids were determined based on the method described by Wellburn [21]. In brief, the leaf samples (ca. 100 mg) were homogenized with 10 mL of 80% acetone. The extract was centrifuged at 5000 rpm for 10 min. The supernatant was determined with absorbance (A) at 645, 663, and 470 nm wavelengths using a spectrometer (Jasco V730 UV-VIS) for calculating pigment concentration (µg mL–1) according to established equations below [21]. The pigment content was expressed based on the FW.
Chl a = 12.25 × A663 − 2.79 × A645;
Chl b = 21.5 × A645 − 5.11 × A663;
Carotenoids = (1000 × A470 − 1.82 × Chl a − 85.02 × Chl b)/198.

2.5. Determination of Relative Water Content, Proline and Total Phenolic Content

The relative water content (RWC) was determined based on the method described by González and González-Vilar [22]. The leaf samples were floated in a petri dish containing deionized water at a cool temperature for at least 4 h, and then removed from the water to determine the turgid weight (TW). Then, the DW of leaf samples was measured after drying them in an oven at 70 °C for 48 h. The RWC was calculated with the equation: RWC (%) = [(FW − DW)/(TW − DW)] × 100.
The proline content was determined according to a method as described by Bates et al. [23]. In brief, the leaf sample (ca. 50 mg) was homogenized in 2 mL of 3% sulfosalicylic acid and then centrifuged at 12,000× g for 15 min at 4 °C. A reaction mixture consisting of each (2 mL) of the supernatant, ninhydrin acid, and acetic acid was incubated at 100 °C for 60 min. Then, the reacted mixture was quickly stopped by cooling on an ice bath and mixed with 4 mL of toluene. The toluene fraction was measured at absorbance with a 520 nm wavelength, and the proline content was calculated based on a prepared standard curve.
The total phenolic content (TPC) was estimated according to the Folin–Ciocalteu (FC) method as described by Kiani et al. [24], with minor modifications. Briefly, the leaf sample (ca. 100 mg) was mixed with 10 mL of 80% methanol and incubated in an orbital shaker (150 rpm), at 25 °C for 24 h. The extract was filtered using Whatman filter paper. Then, the filtrate (0.5 mL) was reacted with 2.5 mL of the 10-fold diluted FC reagent and 2 mL of 7.5% sodium carbonate. The reacted mixture was heated at 45 °C for 15 min and measured absorbance with a 765 nm wavelength. Gallic acid was used as a standard for TPC quantification, and the TPC content was expressed on the basis of gallic acid equivalent (GAE).

2.6. Determination of Ion Content

The potassium (K+), sodium (Na+), chloride (Cl), and nitrate (NO3) contents were determined according to a procedure described by Tran et al. [7]. The dried leaf sample was finely ground and soaked with 10 mL of deionized water at room temperature for 24 h. The extract was filtered using a 0.45 μm syringe filter and centrifuged at 18,000× g for 20 min to eliminate particles before determining ion concentration. The ion content was determined using the Dionex ICS-3000 ion chromatography system (USA) with standard ion solutions.

2.7. Determination of Malondialdehyde and Hydrogen Peroxide Content, and Electrolyte Leakage

The malondialdehyde (MDA) content was determined according to a procedure as described by Senthilkumar et al. [25], with minor modifications. The leaf sample (ca. 50 mg) was homogenized with 5 mL of 0.1% trichloracetic acid (TCA) and centrifuged at 12,000× g for 10 min. The supernatant was mixed with 0.5% thiobarbituric acid (prepared in a 20% TCA solution) and reacted at 95 °C for 25 min. After cooling in an ice box, the reacted mixture was measured for absorbance at 532 and 600 nm wavelengths. The MDA content was determined with an extinction coefficient of 155 mmol L–1 cm–1.
The hydrogen peroxide (H2O2) content was determined according to a method reported by Alexieva et al. [26], with minor modifications. The leaf sample (ca. 50 mg) was homogenized with 2 mL of 0.1% TCA on ice, and the extract was centrifuged at 12,000× g for 15 min at 4 °C. A mixture of the supernatant (0.5 mL), 10 mM potassium phosphate buffer (0.5 mL), and 1 M KI (1 mL) was reacted at room temperature in darkness for 1 h. The reacted mixture was measured for absorbance at a 350 nm wavelength [27]. The H2O2 content was determined using a prepared standard curve.
The electrolyte leakage (EL) was determined according to the procedure described by Sahin et al. [20]. The leaf discs were washed with deionized water and then incubated with 30 mL of deionized water for 24 h, at room temperature in darkness. After the incubation, the sample was heated at 95 °C for 20 min in a water bath and cooled to room temperature. The EL was calculated as the rate of electric conductivity of the bathing solution before and after the heating.

2.8. Assays for the Enzymatic Activity of Catalase, Peroxidase, and Superoxide Dismutase

Crude leaf extracts were prepared according to a procedure described by Poli et al. [28], with minor modifications. The frozen leaf samples (ca. 100 mg) were homogenized with 2 mL of an extraction buffer (0.1 M sodium phosphate buffer (pH 7.5) containing 0.5 mM EDTA) on ice. The extract was centrifuged at 12,000× g for 15 min at 4 °C, and the supernatant was used for assaying enzymatic activity.
The catalase (CAT) activity was estimated according to a procedure described by Poli et al. [28]. A mixture of the crude extract (0.05 mL), 0.1 M sodium phosphate buffer (pH 7.0) (1.5 mL), 30 mM H2O2 (0.5 mL) (prepared in 0.1 M sodium phosphate buffer), and distilled water (0.95 mL) was prepared to react at room temperature, and absorbances at 240 nm were recorded during the reaction for 30 s. The CAT activity was expressed as the absorbance decreases (units) per second per gram FW (units s–1 g–1 FW).
The peroxidase (POD) activity was estimated according to a procedure described by Poli et al. [28]. A mixture of the crude extract (0.1 mL), 60 mM sodium phosphate buffer (pH 6.1) (1 mL), 16 mM guaiacol (0.5 mL), 2 mM H2O2 (prepared in 60 mM sodium phosphate buffer) (0.5 mL), and distilled water (0.9 mL) was prepared to react at room temperature, and the mixture was recorded absorbances at 470 nm during the reaction for 30 s. The POD activity was expressed as the absorbance increase (units) per second per gram FW (units s–1 g–1 FW).
The superoxide dismutase (SOD) activity was estimated based on a procedure described by Dhindsa et al. [29]. A mixture of the crude extract (0.1 mL), 100 mM sodium phosphate buffer (pH 7.8) (2.3 mL), 200 mM methionine (0.2 mL), 3 mM EDTA (0.2 mL), 2.25 mM nitroblue tetrazolium (0.1 mL), and 60 µM riboflavin (0.1 mL) was mixed to react under light at room temperature for 15 min. The reacted mixture was measured for absorbance at 560 nm. The SOD activity was expressed as the number of units per gram FW (units g–1 FW). One SOD activity unit was defined as enzyme content inhibiting 50% of the photochemical reduction of NBT.

2.9. Experimental Design and Statistical Analysis

Each treatment was repeated randomly with five pots (replicates) (n = 10–15). The data were represented as mean values and standard deviations with α = 0.05. The statistically significant difference in parameters between the treatments was analyzed following Duncan’s multiple range test with a p-value ≤ 0.05. The statistical analyses were carried out using R software.

3. Results

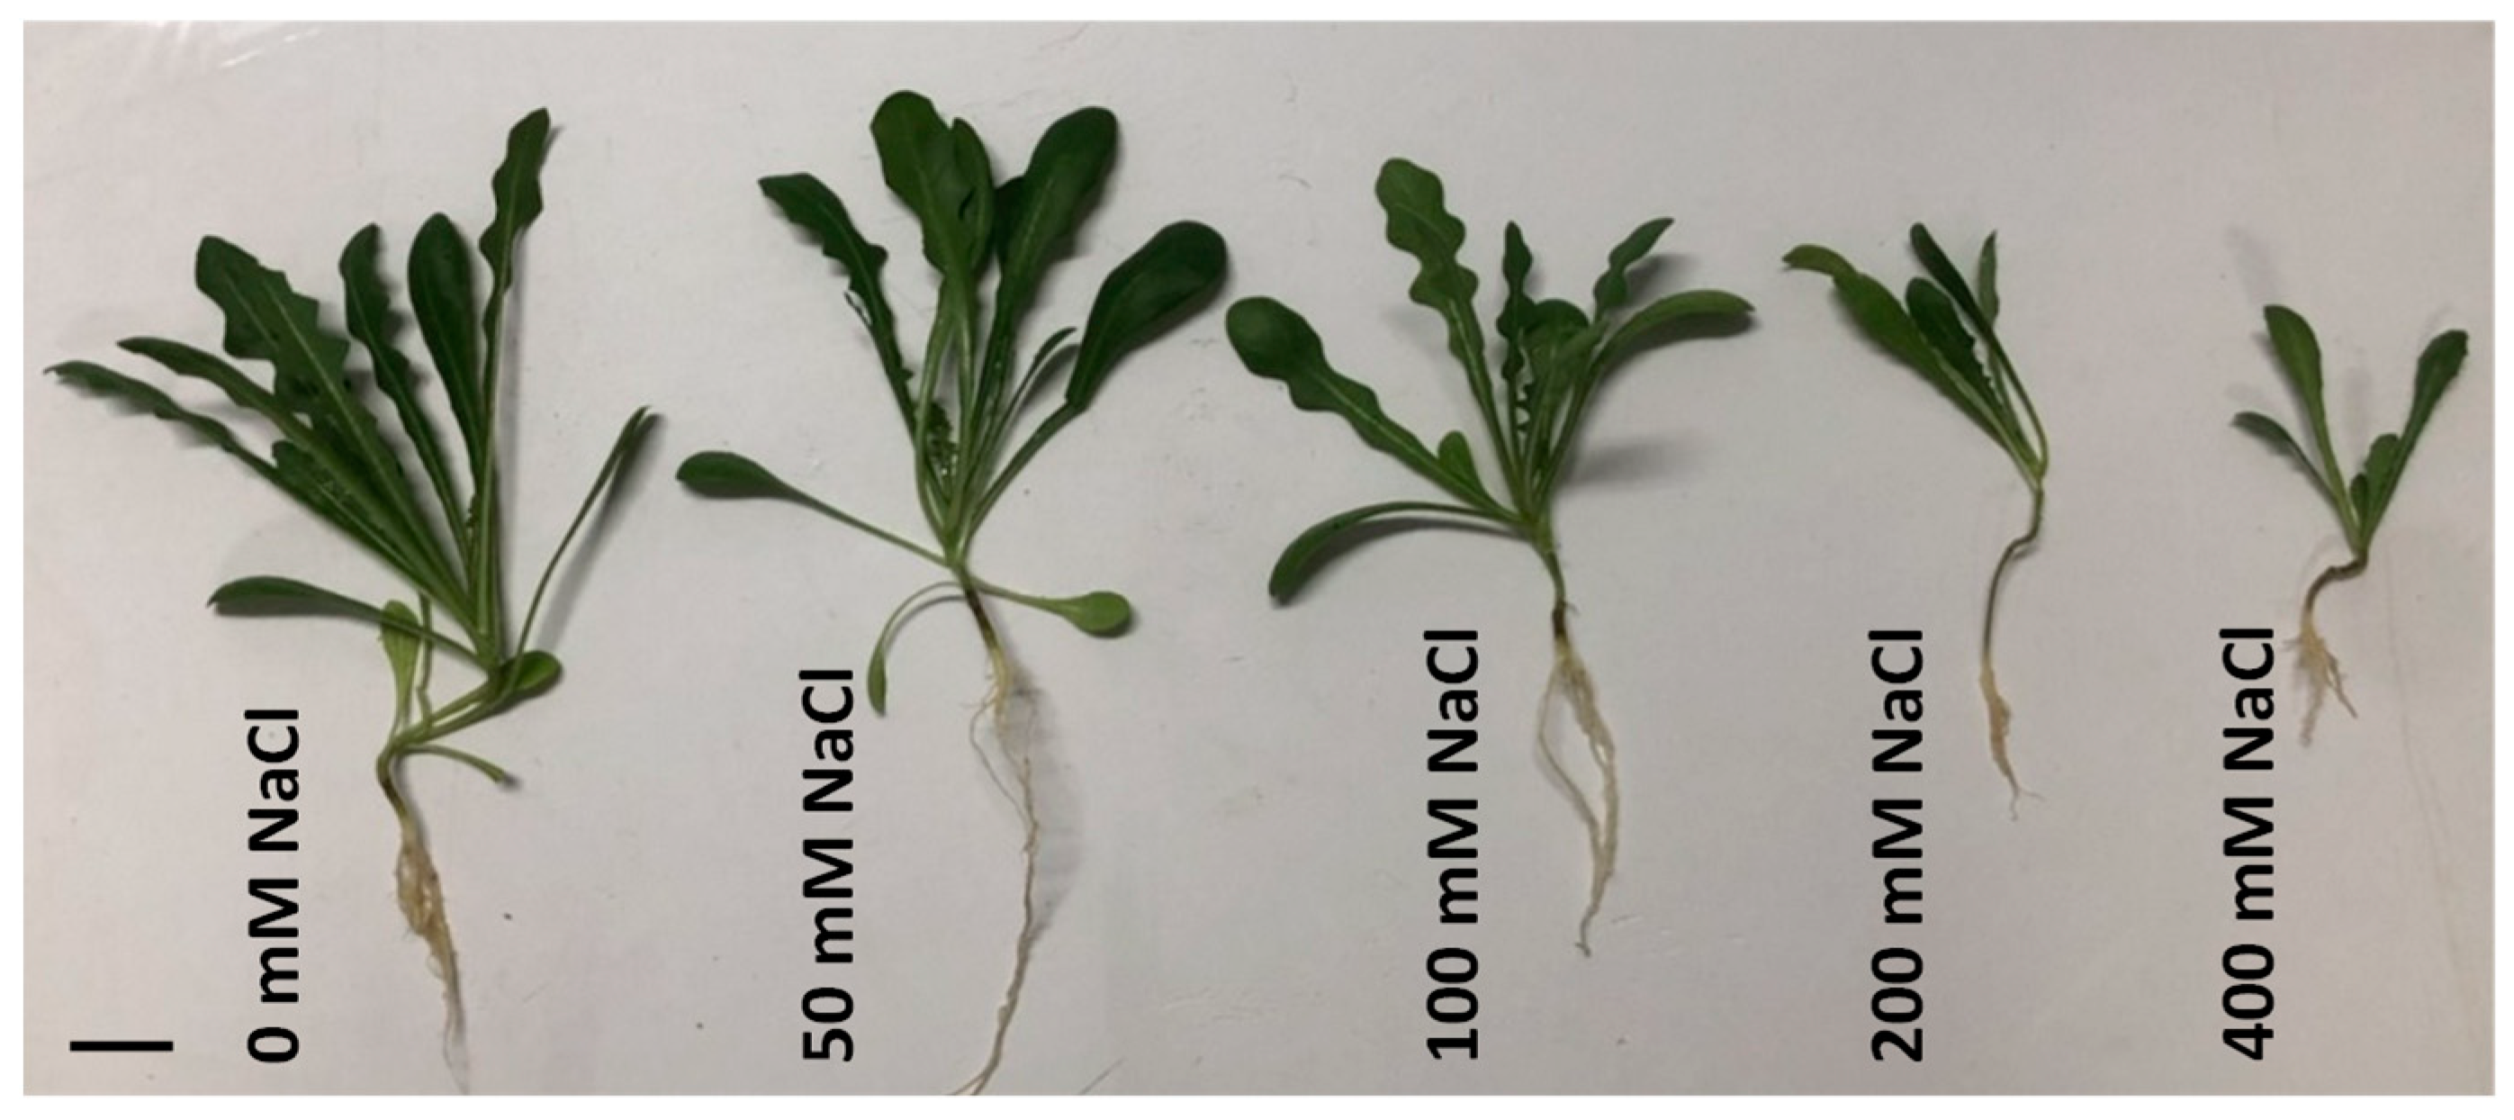
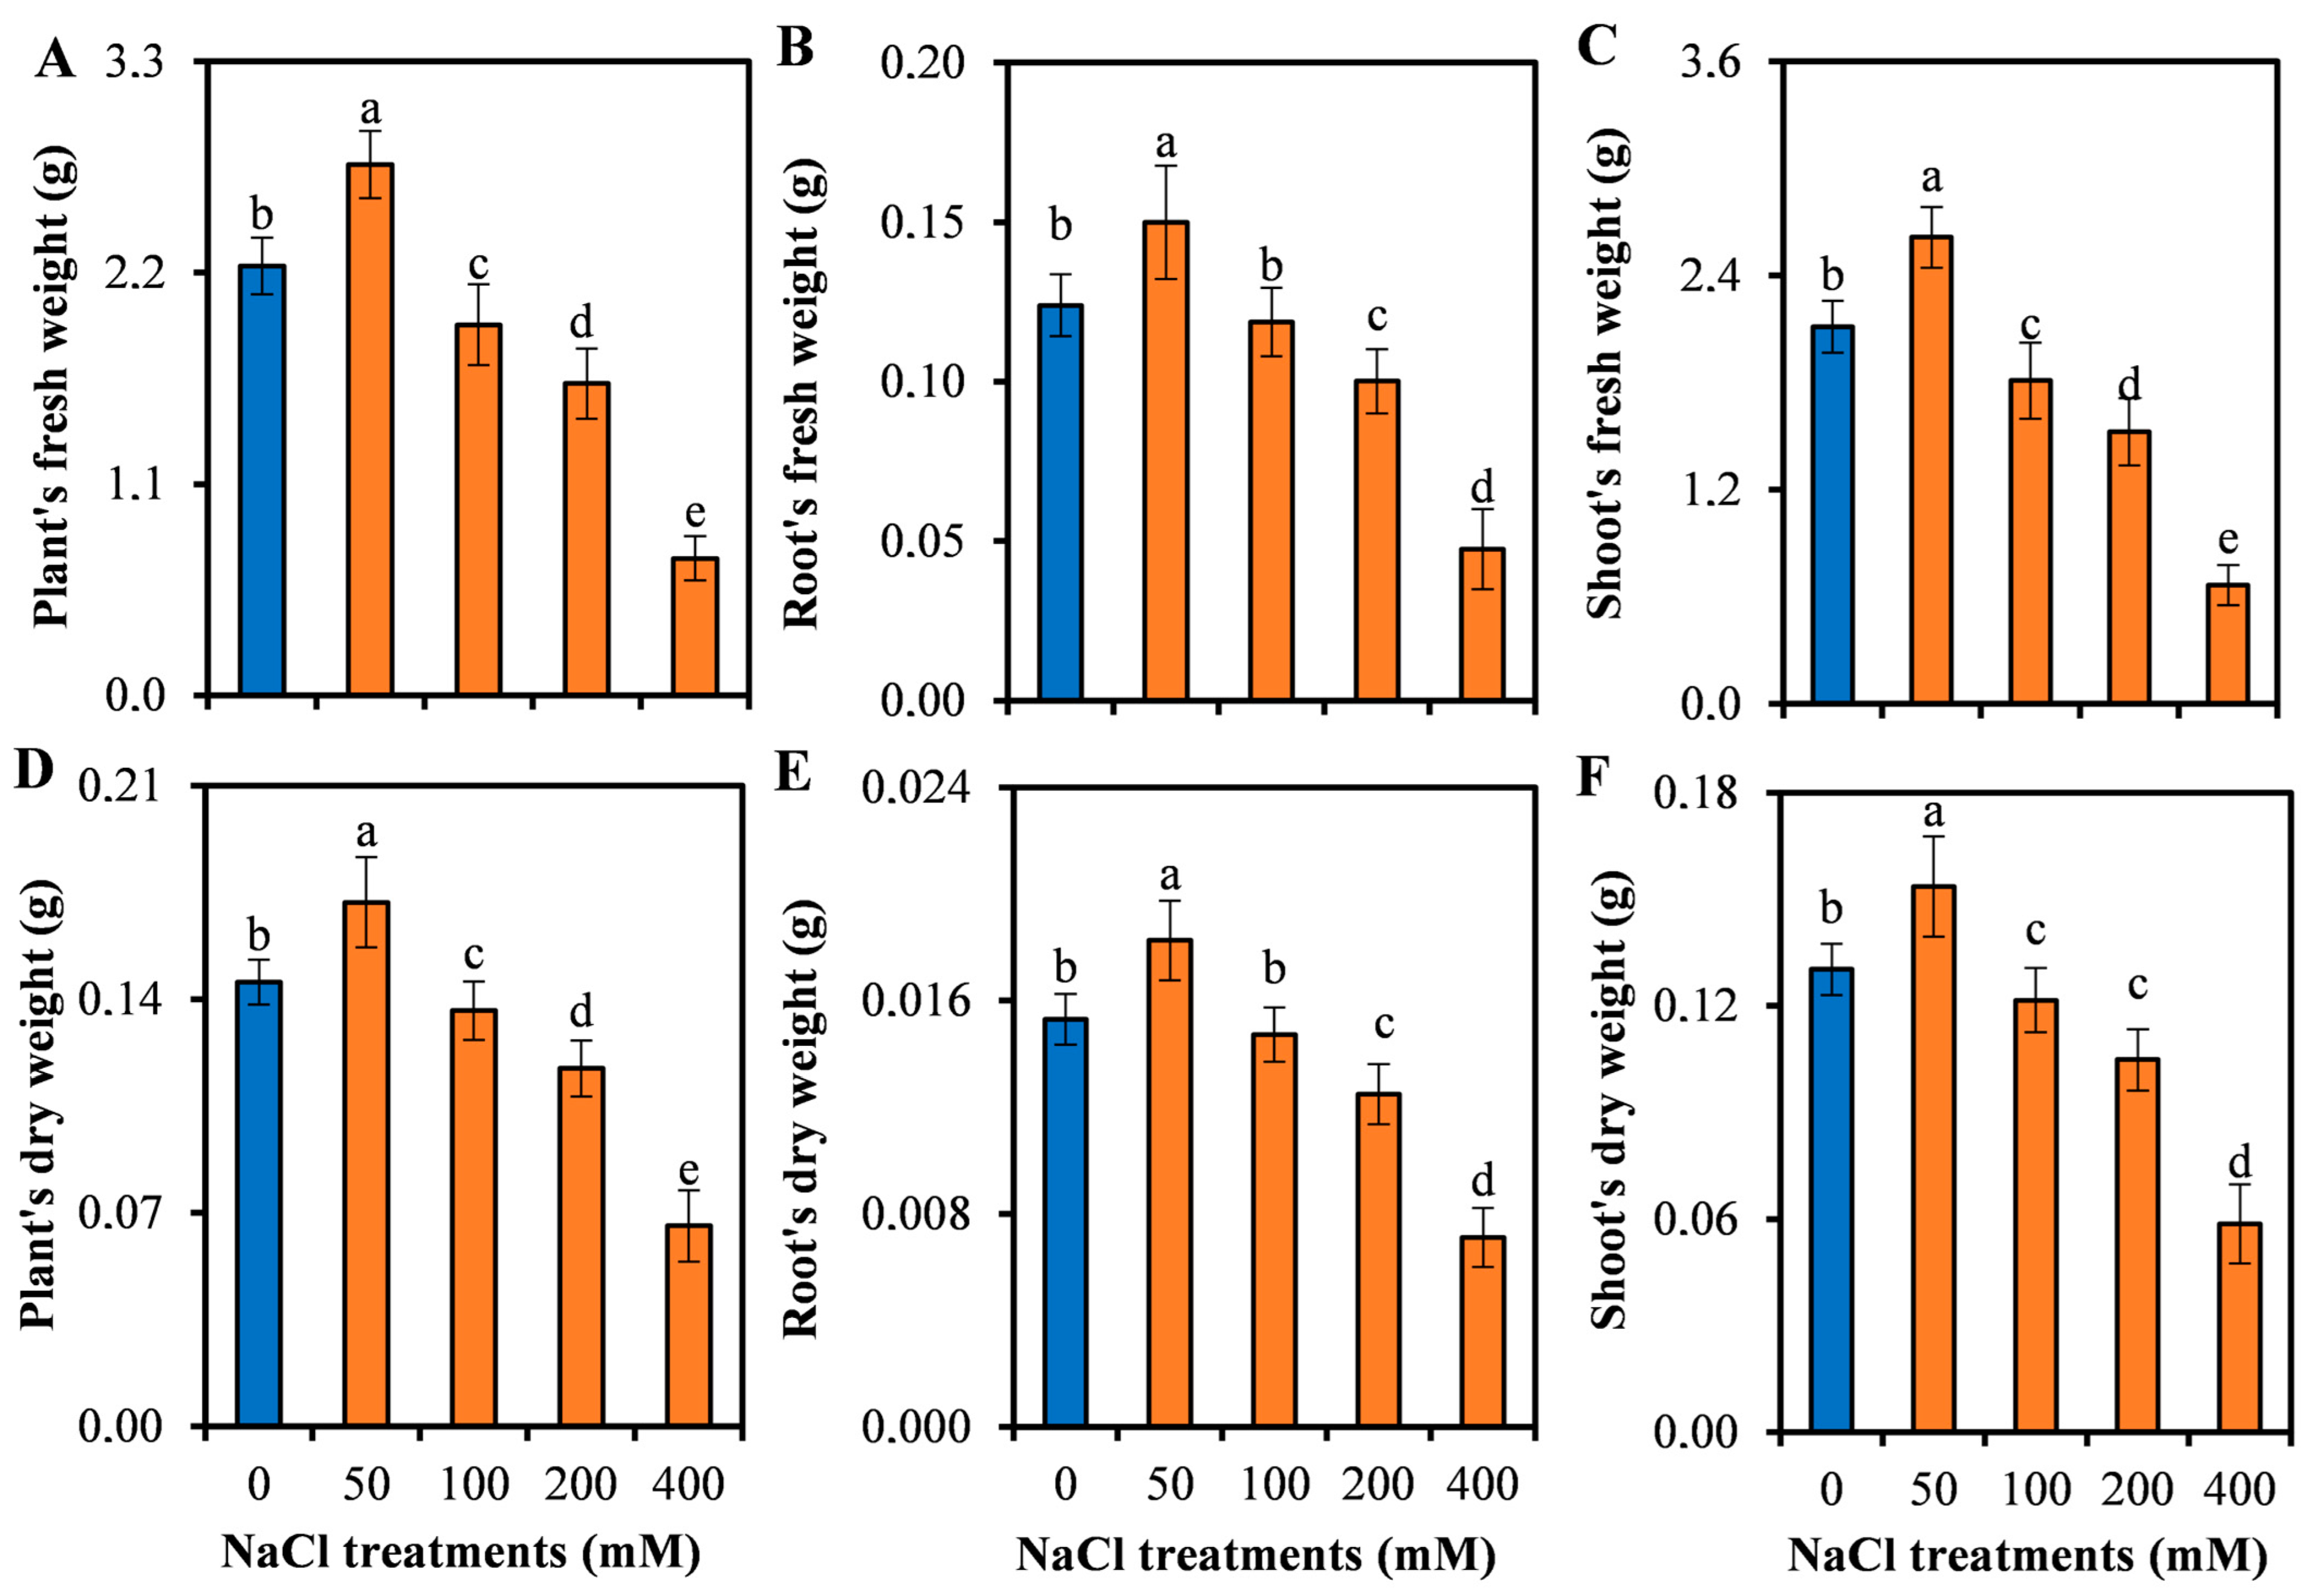
3.1. Growth Responses of L. sarmentosa to Salinity

The data showed that the plant’s biomass tended to gradually decrease with increasing salt concentrations, except that it was enhanced by 50 mM NaCl (Figure 1 and Figure 2). The FW and DW of the 50 mM NaCl-treated plants were increased by 23.62% and 18.07% compared to the control, respectively (Figure 2A,D). Meanwhile, the plant’s FW and DW significantly decreased by 13.72–68.14% in FW and 6.39–54.85% in DW compared to the control when the plants were treated with 100–400 mM NaCl (Figure 2A,D). Although the plant’s biomass was seriously decreased by 400 mM NaCl, which was by 68.14% in FW and 54.58% in DW compared to the control, the plants still formed new leaves and did not show any appearance of death (Figure 1).
To understand whether there were different growth responses between L. sarmentosa shoots and roots to salinity, their biomass was determined. The data showed that the shoot’s biomass similar to the plant’s biomass, in which their FW and DW increased with 50 mM NaCl and significantly decreased with 100–400 mM NaCl (Figure 2C,F). A similar expression was also observed in the case of the root’s biomass, but significant decreases in the root biomass only occurred with salinity above 100 mM NaCl (Figure 2B,E). These results suggest that the roots had a higher salt adaptation than the shoots. Notably, the 400 mM NaCl-treated plants tended to reduce their fresh biomass to a greater level than that of their dry biomass, where the shoot, root, and plant FW decreased respectively by 68.52, 61.66, and 68.14% compared to the control, while the DW decreased by 55.01, 53.48, and 54.85% (Figure 2B,E).

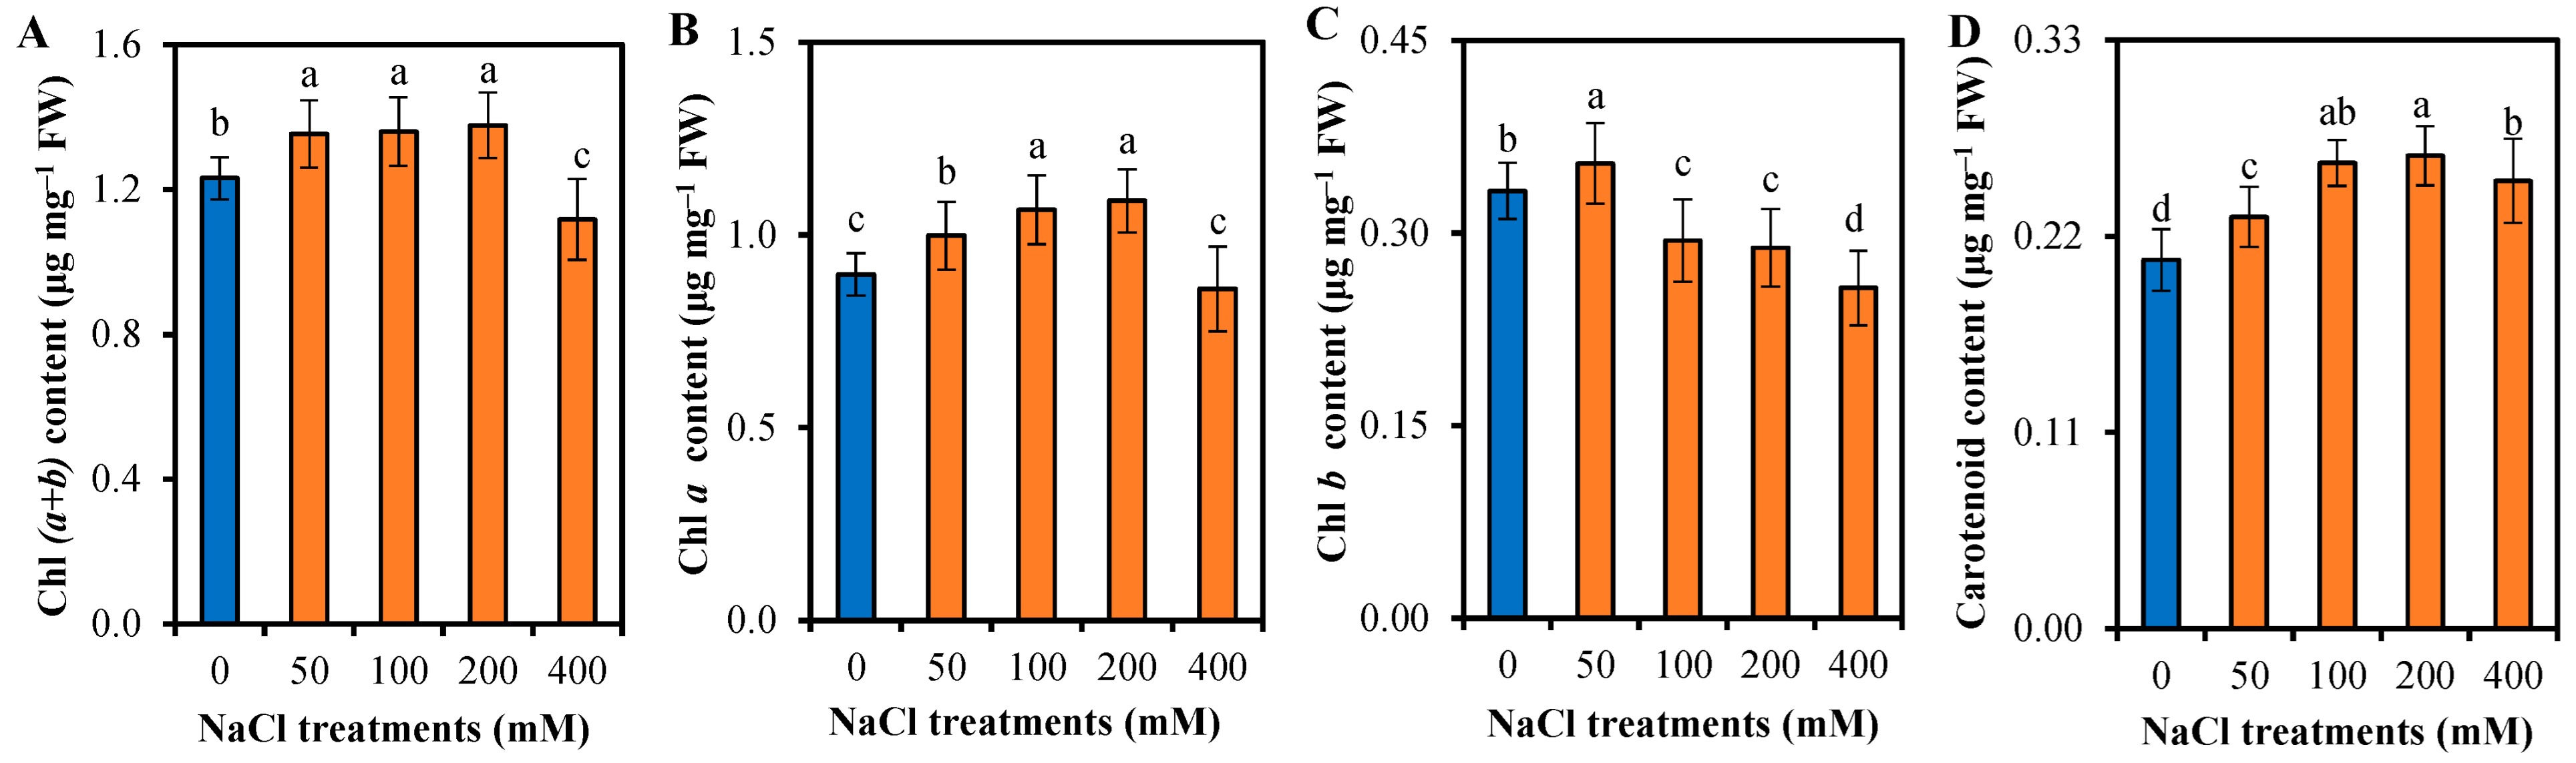
3.2. Photosynthetic Responses of L. sarmentosa to Salinity

In the present study, photosynthetic responses of the plant to salinity were examined through changes in pigment content in the leaves, including chl a, chl b, chl (a + b), and carotenoids. The data showed that the chl (a + b) content was 0.09–0.12 times higher in the plants treated with 50–200 mM NaCl than that of the control, but it decreased in the 400 mM NaCl-treated plants (Figure 3A). Among the two chls, the chl a content in the salt-treated plants expressed a similar trend to the chl (a + b) content, except for the higher levels of increases in the plants treated with 100–200 mM NaCl and a non-significant decrease in the 400 mM NaCl-treated plants (Figure 3B), whereas the chl b content decreased with increasing salt concentrations, except for a slight increase in the 50 mM NaCl-treated plants (Figure 3C). Moreover, the carotenoid content significantly increased in the salt-treated plants compared to the control, which gradually increased with increasing salt concentrations ranging from 50 to 200 mM and lessened with 400 mM NaCl (Figure 3D).

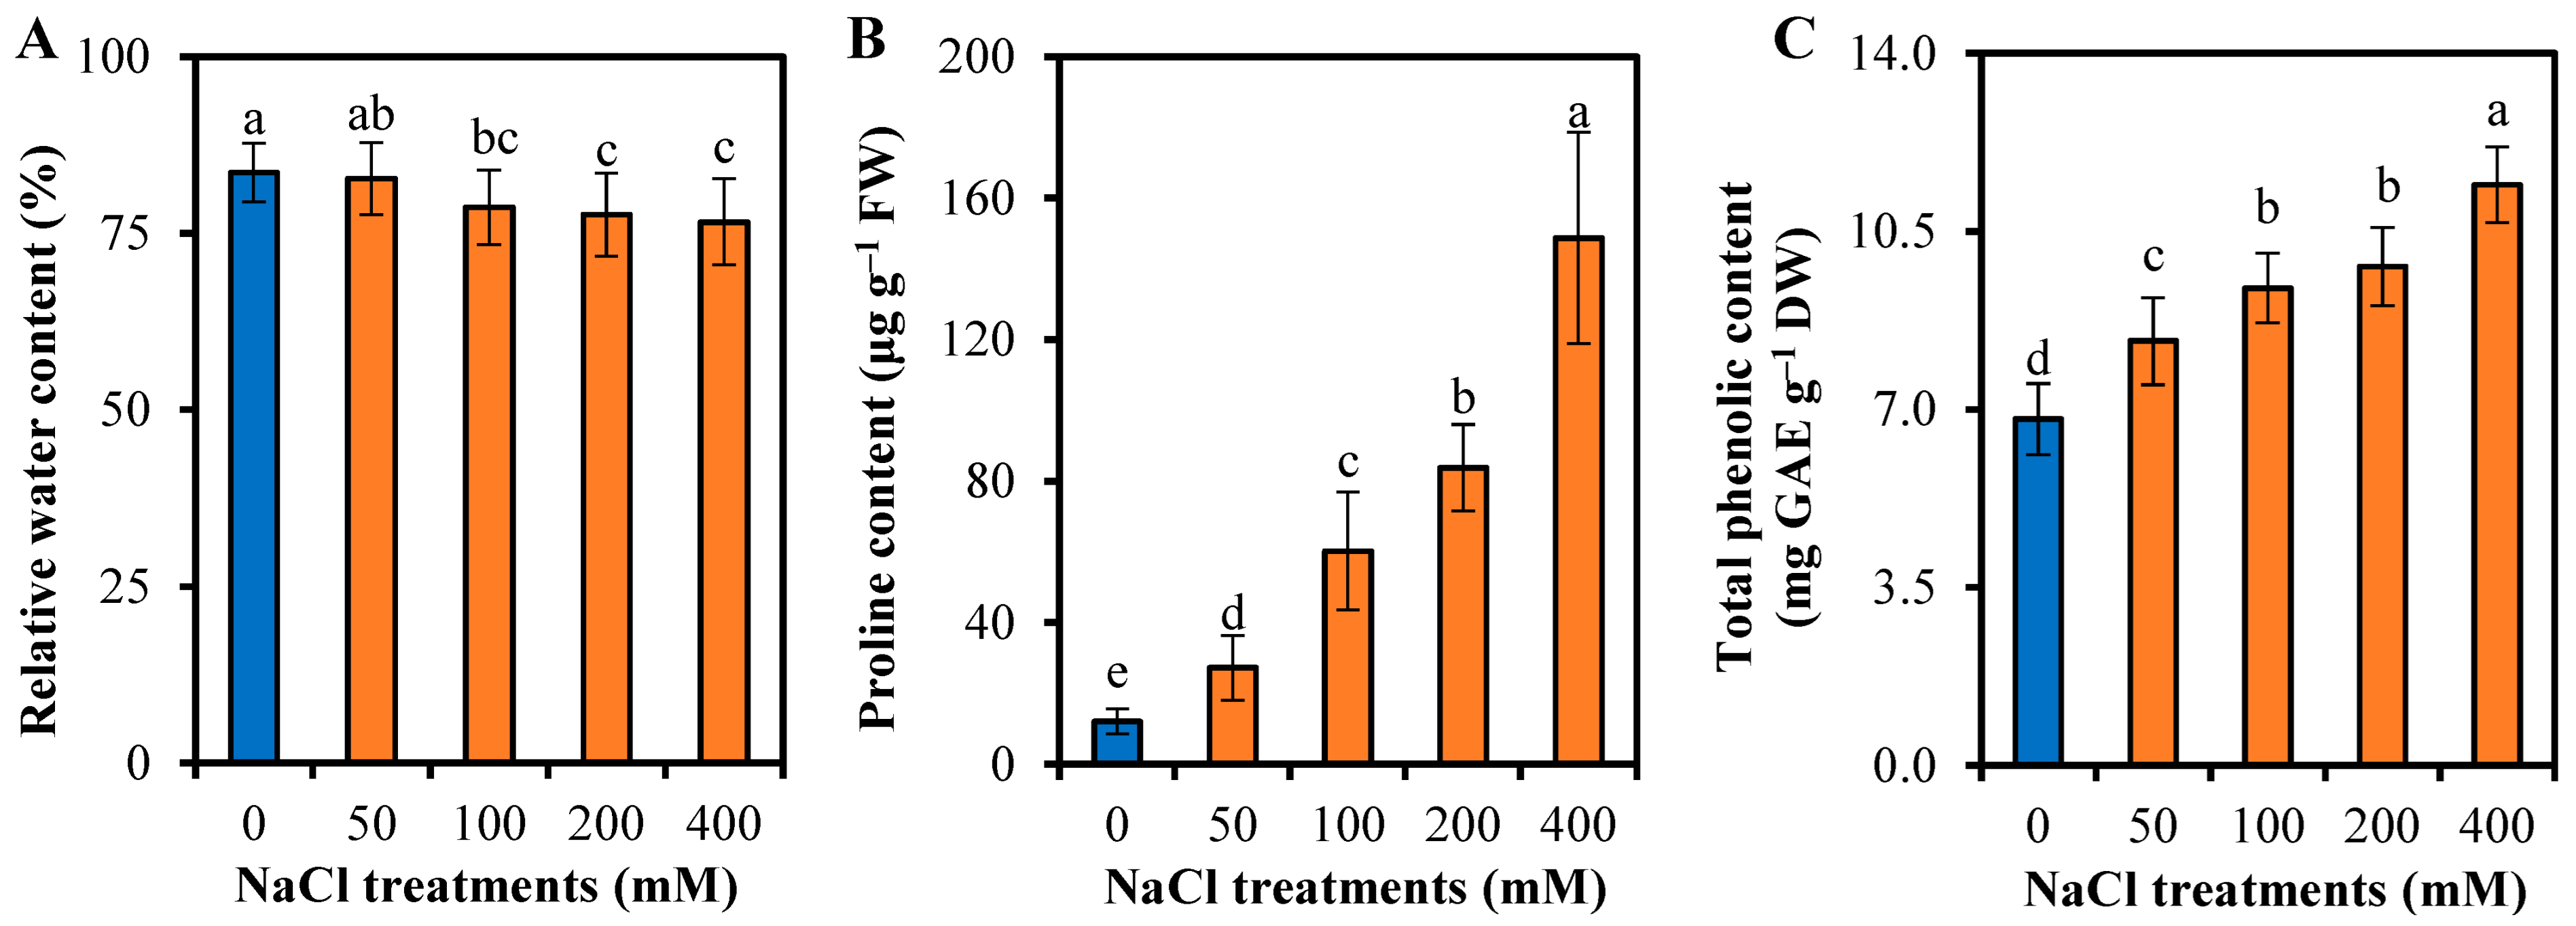
3.3. Reponses to Water Uptake and Osmotic Adjustment of L. sarmentosa to Salinity

The data showed that the 50 mM NaCl-treated plants unchanged their RWC compared to the control, but the RWC tended to gradually decrease (4.9–7.0%) in the plants treated with 100–400 mM NaCl (Figure 4A), suggesting that the plant’s water uptake was reduced by the salt stress. Data also showed that the proline content in the salt-treated plants gradually increased with increasing salt concentrations, by 2.25–12.26 times compared to the control (Figure 4B).

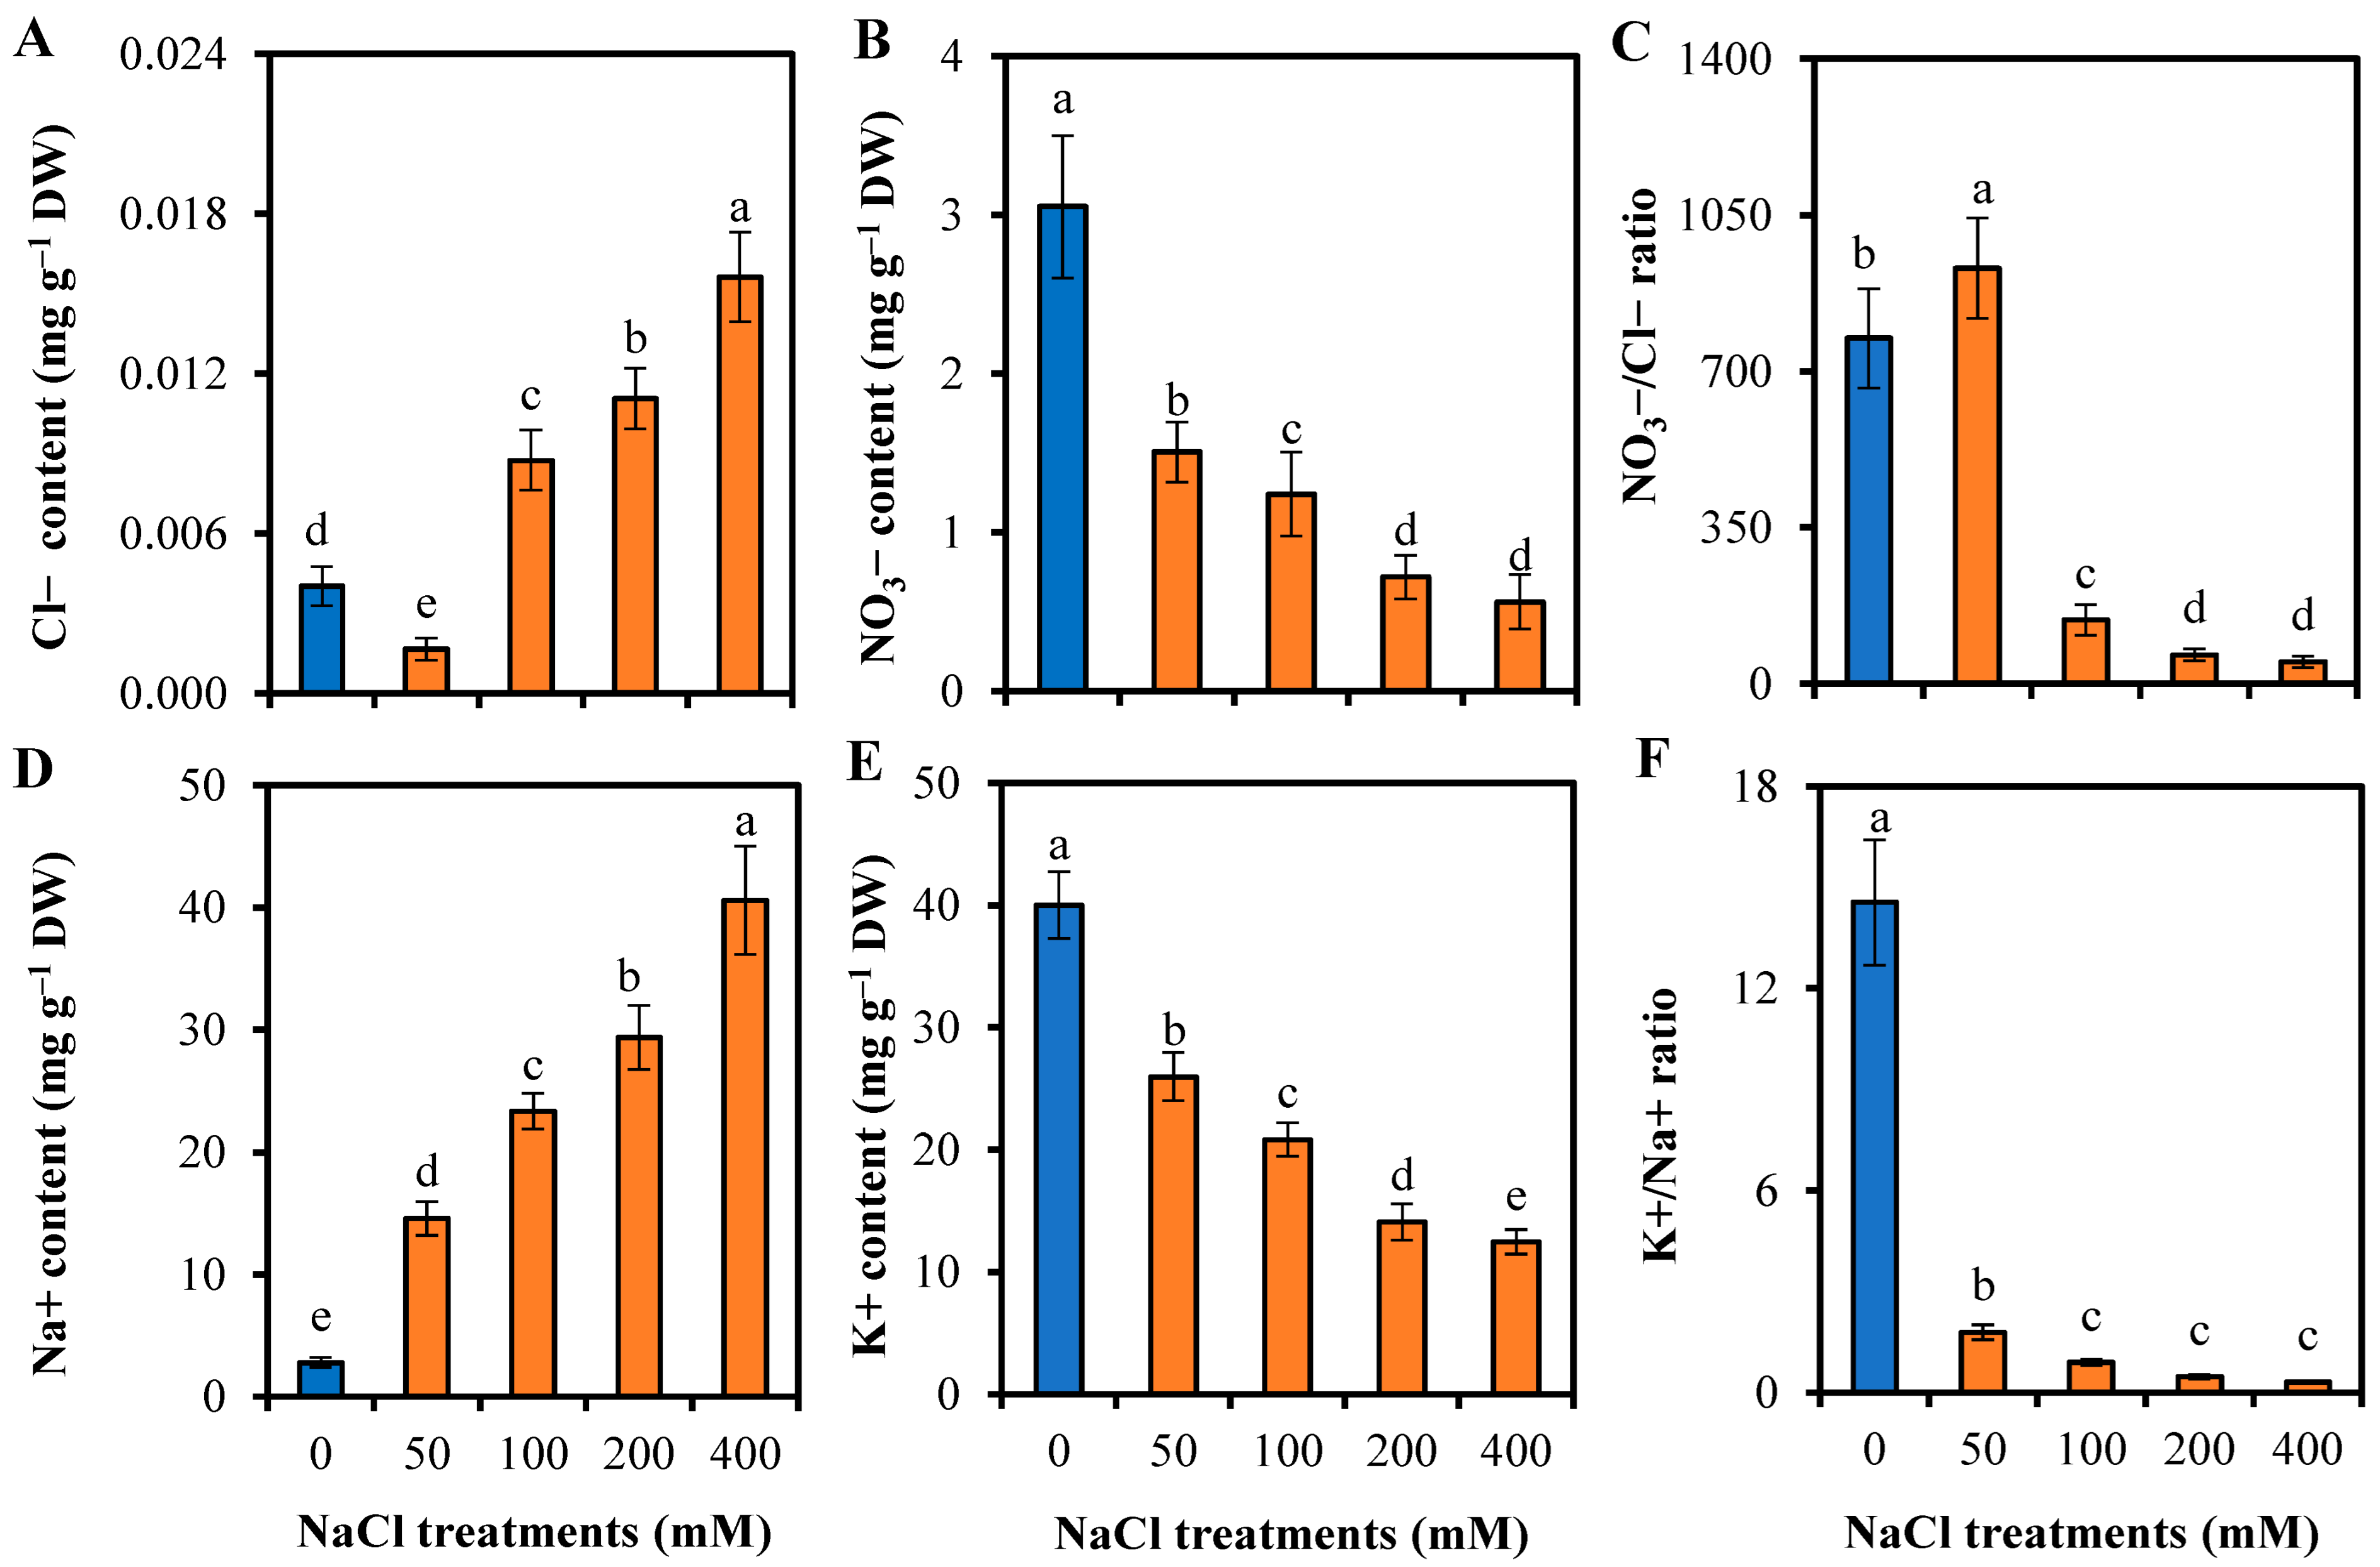
3.4. Responses to Ion Homeostasis of L. sarmentosa to Salinity

Our data showed that the ion content in the plants was varied by the salt treatments (Figure 5). The Cl content in the 50 mM NaCl-treated plants was decreased by 0.59 times compared to the control. However, the Cl content was gradually increased in the plants under 100–400 mM NaCl, and their Cl contents were 2.18–3.89 times compared to the control (Figure 5A). Whereas, the NO3 content in the salt-treated plants gradually decreased with increasing salt concentrations, ranging 0.49–0.18 times compared to the control (Figure 5B). In addition, the NO3/Cl content ratio in the 50 mM NaCl-treated plants increased by 0.2 times compared to the control, whereas the NO3/Cl ratios in the salt-stressed plants sharply reduced with the salt stress, ranging 0.19–0.06 times compared to the control (Figure 5C).
Similar trends were observed for the Na+ and K+ accumulations (Figure 5). The Na+ content was significantly increased with increasing salt concentrations, ranging 5.23–14.54 times compared to the control (Figure 5D). Meanwhile, the K+ content in the salt-treated plants decreased with increasing salt concentrations, ranging 1.54–3.2 times compared to the control (Figure 5E). Also, the K+/Na+ content ratio was strongly decreased by the salt treatments, ranging 8.11–16.19 times lower in the salt-treated plants than that in the control (Figure 5F).

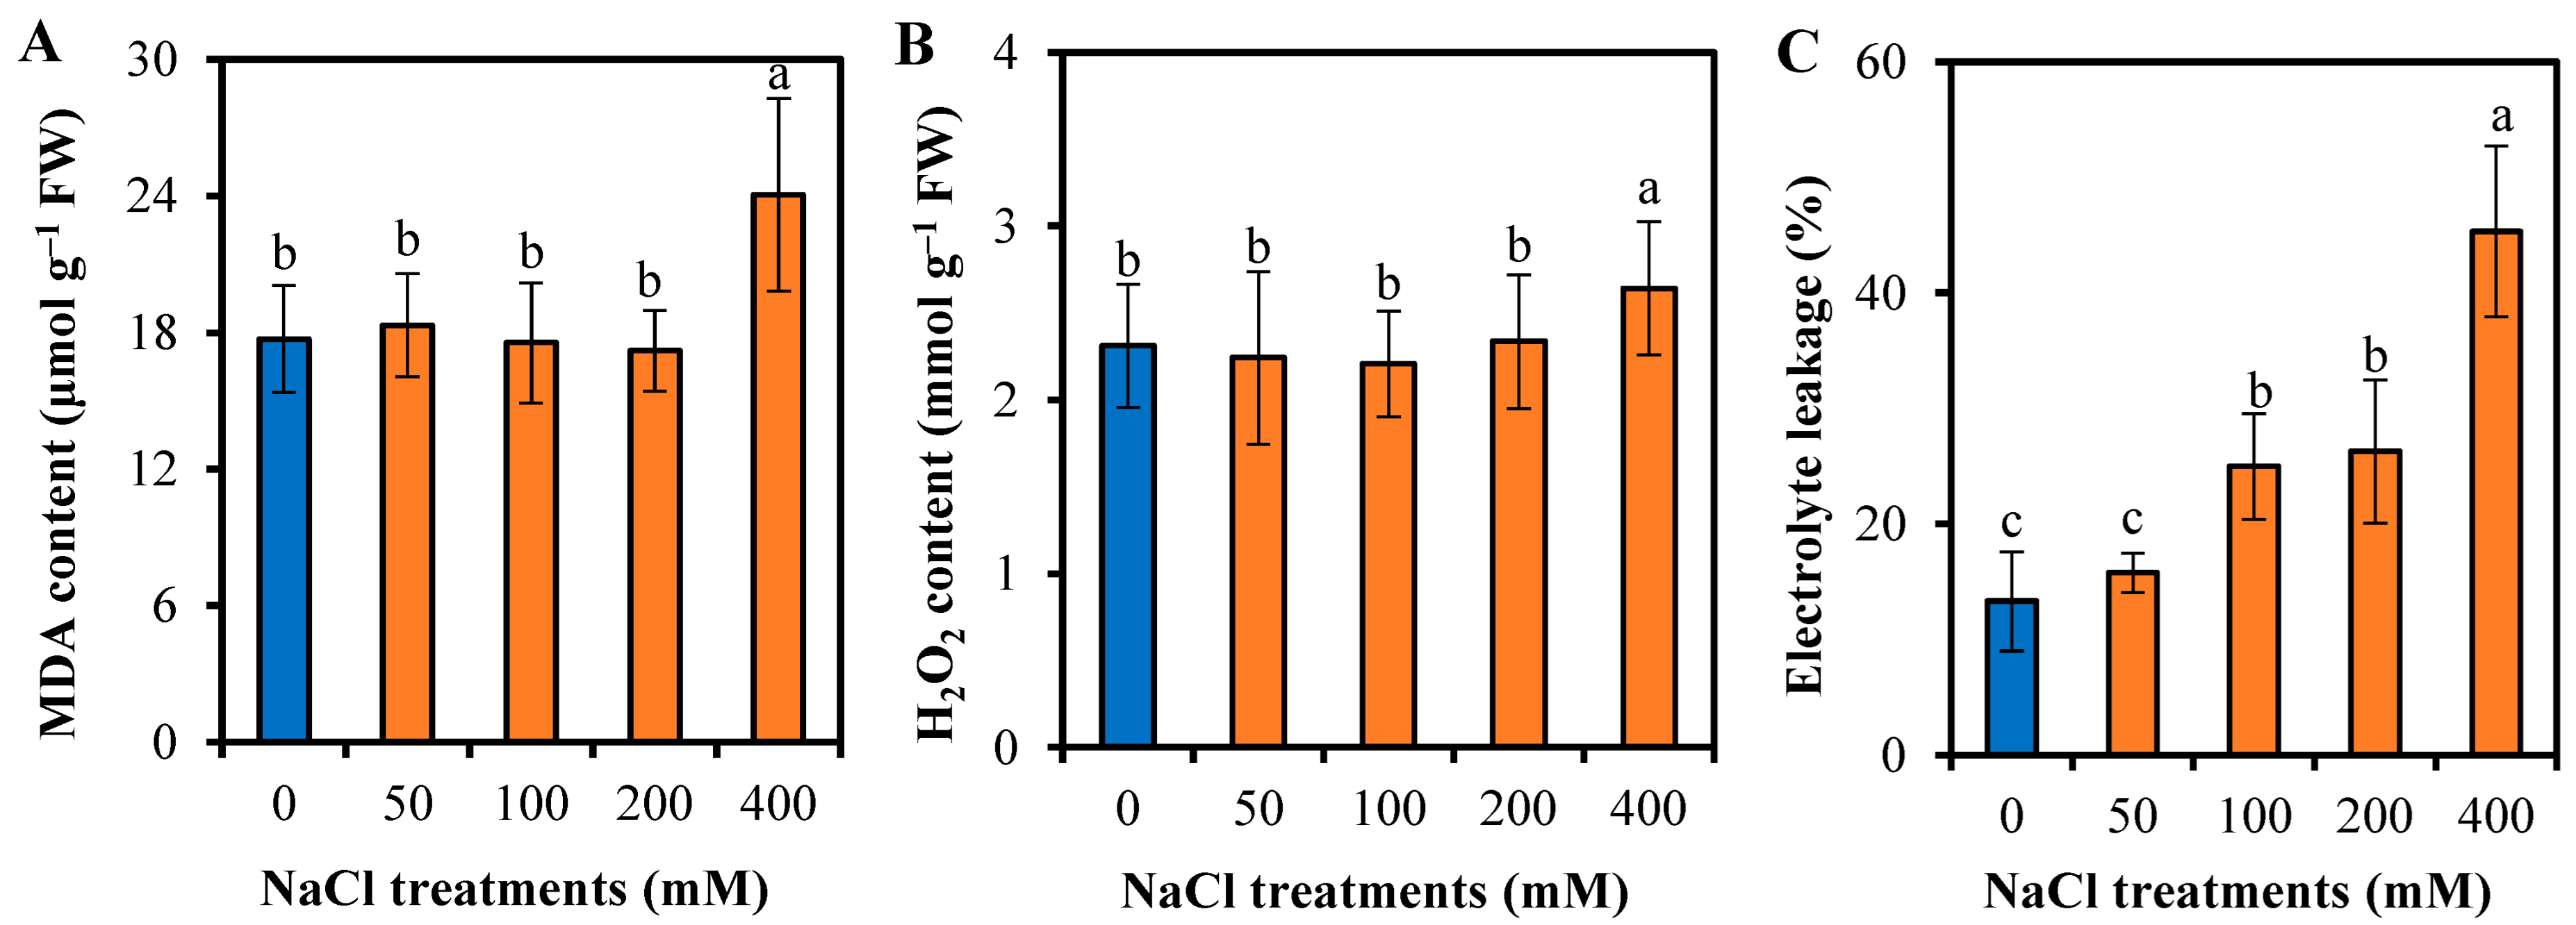
3.5. Responses of L. sarmentosa to Oxidative Stress and Antioxidative Activity to Salinity

Our data showed that the MDA content did not significantly change in the plants treated with 50–200 mM NaCl compared to the control, but it increased 1.14 times in the 400 mM NaCl-treated plants (Figure 6A). A similar trend was observed for the H2O2 content, which increased 1.34 times in the 400 mM NaCl-treated plants compared to that in the control (Figure 6B). Moreover, the EL was also unchanged in the 50 mM NaCl-treated plants compared to the control. The EL value gradually increased in the plants treated with increasing salt concentrations, and it reached a maximum value with 400 mM NaCl, ranging 1.88–3.41 times compared to the control (Figure 6C).
Moreover, the TPC in the salt-treated plants was gradually increased with increasing salt concentrations, ranging 1.23–1.68 times compared to that in the control (Figure 4C). Also, the enzymatic activity of POD, SOD, and CAT was enhanced with increasing salt concentrations (Figure 7). The SOD activity was 1.1–2.0 times higher in the salt-treated plants than the control, although the increase was not significant at 100 mM NaCl levels (Figure 7A). Meanwhile, the salt-treated plants obtained significant increases in POD and CAT activity (1.24–2.50 times) and (1.70–2.62 times) compared to the control, respectively (Figure 7B,C). The maximum values of enzymatic activities were observed for the 400 mM NaCl treatment.

4. Discussion

It was reported that soil salinity seriously reduced the growth of salt-susceptible plants and that they could not survive with salinity levels above 100 mM NaCl [30]. In our study, the L. sarmentosa plant’s biomass was also reduced by the salt treatments, but the salt stress only affected their biomass at high salinity levels above 100 mM NaCl (Figure 2). Moreover, the plants also survived with 400 mM NaCl, although their growth was reduced (Figure 1), indicating that L. sarmentosa was a salt-tolerant species with a high adaptation to salinity. Notably, the plant’s biomass was enhanced by 50 mM NaCl, which was also commonly observed in halophyte species [31]. In addition, the result showed that the plant’s dry biomass was under a less significant effect of the salt stress than the fresh biomass (Figure 2), which was explained by a serious reduction in water uptake caused by the osmotic effect of salt [10]. The plant’s salt tolerance capacity and growth response to salinity were similar to those of many salt-tolerant plants, e.g., sugar beet (Beta bulgaris) [32], sweet alyssum (Lobularia maritima) [33], lettuce (Lactuca sativa L.) [34], etc. We assumed that the plant may become a potential crop for salt-affected areas that have soil salinity equivalent to 50–200 mM NaCl because a higher salt tolerance of the plant can be achieved at its later growth stages [35]. The plant may also become a model plant to study the mechanisms of salt tolerance in plants.
Salinity has effects on photosynthetic components, leading to changes in the photosynthesis activity of plants [35]. Chlorophylls and carotenoids are two main groups of photosynthetic pigments with important roles in absorbing photon energy from sunlight, which is later converted to chemical energy in the form of organic compounds. As a result, changes in the content of these pigments may affect photosynthetic activity [4,6]. Our results showed that the chl (a + b) content in L. sarmentosa was enhanced by salinity up to 200 mM NaCl while it was deceased at the higher level (Figure 3A). Previous studies reported different responses to accumulating chlorophyll in plants under salt stress, which is considered to depend on plant species, stages in the life cycle, and stress level [35]. Under salt stress, a reduction in chlorophyll accumulation was observed for salt-susceptible plants, such as wheat cultivars (Triticum spp.) [36], beans (Phaseolus vulgaris) [37], and peppers (Capsicum annuum) [38]. Meanwhile, the accumulation was enhanced in salt-tolerant plants, such as halophytes (Kalidium foliatum) [39] and water dropwort (Oenanthe javanica) [6]. Our study also indicated the increased accumulation of total chlorophyll in the salt-stressed plants (Figure 3A), suggesting that it may be a typical trait in salt-tolerant plants. Remarkably, among the two tested chlorophylls, chl a mainly contributed to the increase in chl (a + b) content, whereas the contribution was not observed for chl b (Figure 3B,C). It was suggested that the salt stress could increase the number of chloroplasts in cells to improve energy production or to reduce ROS formation, which are required for salt adaptation [35,39,40]. However, if plants are under serious salt stress, the chlorophyll content may be reduced due to the increased activity of chlorophyllase, which promotes chlorophyll degradation [39]. We suggested that a similar response might occur in the plants stressed with 400 mM NaCl. Our results also showed that the carotenoid content was significantly enhanced in the salt-stressed plants (Figure 3D). In addition to their role as photon-absorbing pigments, carotenoids are also antioxidants that can protect chloroplasts from ROS-induced damage. Thus, the increased accumulation of carotenoids might also contribute to the plant’s salt adaptation, suggesting an important role of carotenoids that was also observed for many salt-tolerant plants [6,39,41]. The changes in pigments suggested an adaptive mechanism of photosynthesis in L. sarmentosa to salinity.
RWC is considered to be an indicator for the water status of plants [22]. The abundant presence of salt in soils will reduce the water potential of soil solutions, leading to the inhibition of water uptake that induces osmotic stress in plants [10]. In the present study, the RWC in the salt-stressed plants decreased with increasing salt stress (Figure 4A), indicating that the water uptake of L. sarmentosa was reduced by the salt stress. It was also suggested that the plants were under salt-induced osmotic stress. To cope with osmotic stress, plants trigger osmotic adjustment to maintain intercellular osmotic pressure that retains their water uptake. The osmotic adjustment is achieved by accumulating compatible osmolytes through de novo synthesis and/or by accumulating inorganic ions [2,7,8]. Among compatible osmolytes, glycine betaine, proline, polyamines, and soluble sugars are popularly utilized by various plant species for osmotic adjustment under salt stress [2,8,32,38,41]. Our results also showed an increasing accumulation of proline in L. sarmentosa shoots under salt stress, particularly in cases of high salt stress. This result also indicated the osmotic adjustment in the plant for reducing the osmotic effects (Figure 4B). In addition, proline might also contribute to osmoprotection as an antioxidant that reduces ROS formation caused by the salt stress [41].
It was reported that the accumulation of ions, including Na+, K+, Cl, and NO3 in plant cells is affected by salinity through changes in membrane transport [2,32]. High salt concentrations in soils induce Na+ and Cl uptake in plant cells through passive transport by voltage-dependent/independent ion channels and/or cation transporters in the plasma membrane [2,42]. Na+ influx will interrupt K+ uptake by competing for cation transporters and by promoting K+ efflux for electrochemical balance, reducing K+ accumulation and K+/Na+ ratios that may cause K+ deficiency in plants. This response was observed for both salt-susceptible plants and salt-tolerant plants grown under salinity, but the ion accumulation may be different depending on plant species [6,7,36,43,44]. In our study, the Na+ accumulation also increased in the salt-treated plants, while an opposite trend was observed for the K+ accumulation (Figure 5D,E). We suggested that the reduction of K+ accumulation might lead to nutrient deficiency that significantly inhibited the growth of plants under stress at 200–400 mM NaCl (Figure 2). An increase in Na+ accumulation in the cytosol may contribute to osmotic adjustment, but the abundance will be toxic to metabolisms [2]. To overcome this constraint, salt-tolerant plants have evolved mechanisms to reduce the Na+ accumulation, by which Na+ is secreted out of cells and/or sequestrated in vacuoles [2,8]. Thus, the high Na+ accumulation in the salt-stressed plants indicated a high tolerance to the ion’s detrimental effects at the cellular level. In addition, the K+/Na+ ratio also indicates the plant’s response to salinity. Reduction of K+/Na+ ratios in leaves under salinity was reported for many plants [7,8,43,44], and mechanisms that maintain the K+/Na+ ratio are considered to be important for salt tolerance. Our study also observed decreases in the K+/Na+ ratio in the salt-treated plants (Figure 5F).
Excess of Cl in the cytosol is also detrimental to cells, although its effect level and mechanisms are poorly understood [10]. An impact of Cl is the inhibition of absorbing NO3, by competition of Cl for nonselective anion transporters that cause NO3deficiency [7,8,10]. Also, a decrease in NO3 accumulation leads to a reduction of the NO3/Cl ratio in plants under salt stress [43]. In our study, a similar response was observed in the salt-stressed plants, in which the Cl uptake was increased and the NO3 accumulation was reduced (Figure 5C). It was reported that the Cl exclusion from shoots could be associated with the salt tolerance of salt-susceptible plants, but it does not hold for salt-tolerant plants that are capable of accumulating Cl ions at high levels in shoots [10]. We assumed that L. sarmentosa may have a high adaptation to toxic effects due to the Cl accumulation. Moreover, the NO3/Cl ratio in the salt-stressed plants was also accompanied by a decrease in NO3 content (Figure 5C). Remarkably, there was a reduction in Cl accumulation and an increase in the NO3/Cl ratio in the plants under 50 mM NaCl (Figure 5A,C), the level at which the plant’s growth was enhanced (Figure 2). This result suggested an involvement of Cl in the growth promotion of L. sarmentosa. In addition, the decrease in K+ and NO3 uptake may be the key factors influencing the plant’s growth under salt stress.
Accumulations of MDA, H2O2, and EL in plants are considered physiological parameters indicating salt-induced oxidative stress [45]. Both osmotic and ionic stress caused by salinity can impair photosynthetic and respiratory machinery, which leads to ROS formation in plants and, thus, oxidative stress [10]. At low accumulation, ROS acts as signaling molecules involved in many biological processes, but excessive ROS accumulation has several impacts on cellular structure and functions, such as lipid peroxidation in the cellular membrane, ion homeostasis, photosynthesis, respiration, and impairment of enzymatic activities [10,46]. H2O2 is one of the major ROS produced in plants under salt stress. In our study, the unchanged contents of H2O2 were observed in plants with stress by 50–200 mM NaCl (Figure 6B), but a significant increase of H2O2 occurred at the higher stress. This result suggested that L. sarmentosa effectively managed ROS formation, which reduced their effects on photosynthetic tissues. The MDA accumulation was also in a similar trend to that of H2O2 (Figure 6A), suggesting that the membrane lipid peroxidation was only induced by the 400 mM NaCl stress. It has been reported that salt-tolerant plants exhibit less lipid peroxidation compared to salt-susceptible plants, which is attributed to protective mechanisms or the high ROS scavenging capacity of salt-tolerant plants [6]. Nevertheless, the EL value increased with increasing salinity levels above 100 mM (Figure 6C), indicating that membrane stability was affected by the salt stress. It was reported that the EL increase is mainly related to K+ efflux from plant cells, which is mediated by ROS-activated outwardly rectifying K+ channels [24,47]. The ion channel-mediated K+ efflux can lead to K+ loss and thus limit the growth of plants. A similar mechanism may be available in L. sarmentosa, which was supported by the H2O2 accumulation and decreased K+ content (Figure 5E and Figure 6B).
It is reported that enzymes such as POD, SOD, CAT, and phenolic metabolites are involved in scavenging ROS formation induced by environmental stress in plants [8,10]. To scavenge ROS, increased accumulation of non-enzymatic antioxidants is an effective strategy contributing to ROS homeostasis in plants under salinity. Among antioxidant metabolites, phenolic compounds are reported to have high effectiveness in scavenging ROS in salt-stressed plants because of the presence of double covalent links in phenolic radicals [24,41,46,47]. Our results also showed high TPC accumulation in the salt-stressed plants (Figure 4A), suggesting its involvement in ROS scavenging in the adaptive response to oxidative stress. In addition, the accumulation of these metabolites might also contribute to the salt-induced osmotic adjustment of the plant. The Mehler in the PSI of chloroplast and the reduction of the ubiquinone pool during salt stress allow energy-high electrons to transfer to O2, resulting in the superoxide anion (O2•−). The enzyme SOD catalyzes O2•− to H2O2, while CAT and POD are required for the conversion of H2O2 into O2 [10]. In our study, the enzymatic activity of SOD, CAT, and POD was enhanced by salt (Figure 7), indicating that these enzymes might be involved in reducing ROS formation due to their high antioxidative activity. High enhancement of these non-enzyme and enzyme antioxidant systems was reported to increase salt stress tolerance in many salt-tolerant plants, such as Aegilops cylindrica [24], Portulaca spp. [41], and Lobularia maritima [33].

5. Conclusions

For the first time, the growth, physiological, and biochemical responses of L. sarmentosa to salinity were elucidated. The findings indicated that L. sarmentosa was a salt-tolerant plant that could survive salinity levels up to 400 mM NaCl, and its growth was even promoted by mild salinity (50 mM NaCl). Plant growth gradually decreased with increasing salt concentrations above 100 mM NaCl. The shoots and roots showed similar growth patterns, but their dry and fresh biomass was different in response to salinity. The plant had typical physiological and biochemical responses that could indicate the plant’s tolerance to salt stress. In summary, the synthesis of chl a and carotenoids in leaves was enhanced for maintaining photosynthetic activity under salinity. The plant’s water uptake slightly decreased with the salt stress, which might be due to the osmotic adjustment caused by proline accumulation. The salt stress changed the ion accumulation, in which the Na+ and Cl contents increased but the K+ and NO3 contents decreased, leading to the reduction of the K+/Na+ and NO3/Cl ratios. These changes suggested that the plant had a high capacity for adaptation to ion stress and ion homeostasis. Moreover, the salt stress might also impact membrane stability through lipid peroxidation and electrolyte leakage caused by salt-induced ROS accumulation. To cope with this constraint, the ROS-scavenging systems, phenolic metabolites, and antioxidant enzymes such as POD, CAT, and SOD were enhanced.

Author Contributions

D.Q.T. designed, conceived, executed the experiment and drafted the manuscript; A.C.P., T.T.T.N., T.C.V., H.D.V. and G.T.H. actively participated in the experiment; S.M.M. analyzed the data and edited and reviewed the manuscript. All authors have read and agreed to the published version of the manuscript.

Funding

This study was funded by the Ministry of Education and Training (Vietnam), code: B2021-DNA-10.

Data Availability Statement

All data are presented in this article.

Acknowledgments

The authors give thanks to who gave us useful help during the experimental work and the manuscript preparation.

Conflicts of Interest

The authors declare no conflicts of interest.

References

  1. Zaman, M.; Shahid, S.A.; Heng, L.; Shahid, S.A.; Zaman, M.; Heng, L. Soil Salinity: Historical Perspectives and a World Overview of the Problem. In Guideline for Salinity Assessment, Mitigation and Adaptation Using Nuclear and Related Techniques; Zaman, M., Shahid, S.A., Heng, L., Eds.; Springer: Cham, Switzerland, 2018; pp. 43–53. [Google Scholar]
  2. Flowers, T.J.; Munns, R.; Colmer, T.D. Sodium chloride toxicity and the cellular basis of salt tolerance in halophytes. Ann. Bot. 2015, 115, 419–431. [Google Scholar] [CrossRef] [PubMed]
  3. Safdar, H.; Amin, A.; Shafiq, Y.; Ali, A.; Yasin, R.; Shoukat, A.; Hussan, M.U.; Sarwar, M.I. A review: Impact of salinity on plant growth. Nat. Sci. 2019, 17, 34–40. [Google Scholar]
  4. Hnilickova, H.; Kraus, K.; Vachova, P.; Hnilicka, F. Salinity stress affects photosynthesis, malondialdehyde formation, and proline content in Portulaca oleracea L. Plants 2021, 10, 845. [Google Scholar] [CrossRef] [PubMed]
  5. Liang, W.; Ma, X.; Wan, P.; Liu, L. Plant salt-tolerance mechanism: A review. Biochem. Biophys. Res. Commun. 2018, 495, 286–291. [Google Scholar] [CrossRef] [PubMed]
  6. Kumar, S.; Li, G.; Yang, J.; Huang, X.; Ji, Q.; Liu, Z.; Ke, W.; Hou, H. Effect of salt stress on growth, physiological parameters, and ionic concentration of water dropwort (Oenanthe javanica) cultivars. Front. Plant Sci. 2021, 12, 660409. [Google Scholar] [CrossRef] [PubMed]
  7. Tran, D.Q.; Konishi, A.; Cushman, J.C.; Morokuma, M.; Toyota, M.; Agarie, S. Ion accumulation and expression of ion homeostasis-related genes associated with halophilism, NaCl-promoted growth in a halophyte Mesembryanthemum crystallinum L. Plant Prod. Sci. 2020, 23, 91–102. [Google Scholar] [CrossRef]
  8. Rahman, M.M.; Mostofa, M.G.; Keya, S.S.; Siddiqui, M.N.; Ansary, M.M.U.; Das, A.K.; Rahman, M.A.; Tran, L.S.-P. Adaptive mechanisms of halophytes and their potential in improving salinity tolerance in plants. Int. J. Mol. Sci. 2021, 22, 10733. [Google Scholar] [CrossRef] [PubMed]
  9. Balasubramaniam, T.; Shen, G.; Esmaeili, N.; Zhang, H. Plants’ response mechanisms to salinity stress. Plants 2023, 12, 2253. [Google Scholar] [CrossRef]
  10. Zhao, C.; Zhang, H.; Song, C.; Zhu, J.-K.; Shabala, S. Mechanisms of plant responses and adaptation to soil salinity. Innovation 2020, 1, 100017. [Google Scholar] [CrossRef] [PubMed]
  11. Van Zelm, E.; Zhang, Y.; Testerink, C. Salt tolerance mechanisms of plants. Annu. Rev. Plant Biol. 2020, 71, 403–433. [Google Scholar] [CrossRef] [PubMed]
  12. Beentje, H.J. Flora of Tropical East Africa: Compositae (Part 1), 1st ed.; Balkema: Rotterdam, The Netherlands, 2000; pp. 102–103. [Google Scholar]
  13. Ritchie, R.J.; Sma-Air, S.; Limsathapornkul, N.; Pranama, N.; Nakkeaw, M.; Kaewnam, P.; Thongchumnum, P.; Kanjanachatree, K. Photosynthetic electron transport rate (ETR) in the littoral herb Launaea sarmentosa known as mole crab in Thailand. Photosynth. Res. 2021, 150, 327–341. [Google Scholar] [CrossRef] [PubMed]
  14. Makwana, H.T.; Pandya, D.J. Launaea pinnatifida Cass. A species of the controversial drug Gojihva: Comprehensive review. Int. J. Pharmacogn. Phytochem. Res. 2019, 11, 240–243. [Google Scholar]
  15. Kamble, S.; Jadhav, R.; Vikhe, S. Phytochemical and pharmacological activities of Launaea sarmentosa: A review. Res. J. Pharmacogn. Phytochem. 2022, 14, 132–135. [Google Scholar]
  16. Gunde, M.C.; Wani, J.S.; Pethe, A.M. Pharmacognostic and phytochemical studies on leaves of Launaea sarmentosa (Willd.) Schultz-Bip. Ex Kuntze. Int. J. Ayurvedic Med. 2022, 13, 759–763. [Google Scholar] [CrossRef]
  17. Nguyen, T.T.; Nguyen, T.T.A.; Nguyen, T.M.; Nguyen, T.H.L.; Nguyen, T.H.; Vu, T.D.; Tran, H.T.; Nguyen, T.H.; Nguyen, M.K.; Do, T.H. Chemical constituents from the aerial parts of Launaea sarmentosa (Asteraceae). Biochem. Syst. Ecol. 2023, 110, 104706. [Google Scholar] [CrossRef]
  18. Nguyen, T.Q.; Binh, T.D.; Kusunoki, R.; Pham, T.L.; Nguyen, Y.D.; Nguyen, T.T.; Kanaori, K.; Kamei, K. Effects of Launaea sarmentosa extract on lipopolysaccharide-induced inflammation via suppression of NF-κB/MAPK signaling and Nrf2 activation. Nutrients 2020, 12, 2586. [Google Scholar] [CrossRef] [PubMed]
  19. Meksuwan, Y.; Sutthinon, P. In vitro propagation and histochemical analysis of Launaea sarmentosa (Willd.) Kuntze. Trends Sci. 2023, 20, 5729. [Google Scholar] [CrossRef]
  20. Sahin, U.; Ekinci, M.; Ors, S.; Turan, M.; Yildiz, S.; Yildirim, E. Effects of individual and combined effects of salinity and drought on physiological, nutritional and biochemical properties of cabbage (Brassica oleracea var. capitata). Sci. Hortic. 2018, 240, 196–204. [Google Scholar] [CrossRef]
  21. Wellburn, A.R. The spectral determination of chlorophylls a and b, as well as total carotenoids, using various solvents with spectrophotometers of different resolution. J. Plant Physiol. 1994, 144, 307–313. [Google Scholar] [CrossRef]
  22. González, L.; González-Vilar, M. Determination of Relative Water Content. In Handbook of Plant Ecophysiology Techniques; Manuel, J., Reigosa, R., Eds.; Springer: Dordrecht, The Netherlands, 2001; pp. 207–212. [Google Scholar]
  23. Bates, L.S.; Waldren, R.A.; Teare, I. Rapid determination of free proline for water-stress studies. Plant Soil 1973, 39, 205–207. [Google Scholar] [CrossRef]
  24. Kiani, R.; Arzani, A.; Mirmohammady, M.S. Polyphenols, flavonoids, and antioxidant activity involved in salt tolerance in wheat, Aegilops cylindrica and their amphidiploids. Front. Plant Sci. 2021, 12, 646221. [Google Scholar] [CrossRef]
  25. Senthilkumar, M.; Amaresan, N.; Sankaranarayanan, A.; Senthilkumar, M.; Amaresan, N.; Sankaranarayanan, A. Estimation of Malondialdehyde (MDA) by Thiobarbituric Acid (TBA) Assay. In Plant-Microbe Interactions; Springer Protocols Handbooks; Springer Humana: New York, NY, USA, 2021; p. 3412. [Google Scholar] [CrossRef]
  26. Alexieva, V.; Sergiev, I.; Mapelli, S.; Karanov, E. The effect of drought and ultraviolet radiation on growth and stress markers in pea and wheat. Plant Cell Environ. 2001, 24, 1337–1344. [Google Scholar] [CrossRef]
  27. Junglee, S.; Urban, L.; Sallanon, H.; Lopez-Lauri, F. Optimized assay for hydrogen peroxide determination in plant tissue using potassium iodide. Am. J. Analyt. Chem. 2014, 5, 730. [Google Scholar] [CrossRef]
  28. Poli, Y.; Nallamothu, V.; Balakrishnan, D.; Ramesh, P.; Desiraju, S.; Mangrauthia, S.K.; Voleti, S.R.; Neelamraju, S. Increased catalase activity and maintenance of photosystem II distinguishes high-yield mutants from low-yield mutants of rice var. Nagina22 under low-phosphorus stress. Front. Plant Sci. 2018, 9, 1543. [Google Scholar] [CrossRef] [PubMed]
  29. Dhindsa, R.S.; Plumb-Dhindsa, P.; Thorpe, T.A. Leaf senescence: Correlated with increased levels of membrane permeability and lipid peroxidation, and decreased levels of superoxide dismutase and catalase. J. Exp. Bot. 1981, 32, 93–101. [Google Scholar] [CrossRef]
  30. Khan, M.O.; Irfan, M.; Muhammad, A.; Ullah, I.; Nawaz, S.; Khalil, M.K.; Ahmad, M. A practical and economical strategy to mitigate salinity stress through seed priming. Front. Environ. Sci. 2022, 10, 991977. [Google Scholar] [CrossRef]
  31. Mann, A.; Lata, C.; Kumar, N.; Kumar, A.; Kumar, A.; Sheoran, P. Halophytes as new model plant species for salt tolerance strategies. Front. Plant Sci 2023, 14, 1137211. [Google Scholar] [CrossRef] [PubMed]
  32. Yamada, M.; Kuroda, C.; Fujiyama, H. Function of sodium and potassium in growth of sodium-loving Amaranthaceae species. Soil Sci. Plant Nutr. 2016, 62, 20–26. [Google Scholar] [CrossRef]
  33. Hsouna, A.B.; Ghneim-Herrera, T.; Romdhane, W.B.; Dabbous, A.; Saad, R.B.; Brini, F.; Abdelly, C.; Hamed, K.B. Early effects of salt stress on the physiological and oxidative status of the halophyte Lobularia maritima. Funct. Plant Biol. 2020, 47, 912–924. [Google Scholar] [CrossRef]
  34. Shin, Y.K.; Bhandari, S.R.; Jo, J.S.; Song, J.W.; Cho, M.C.; Yang, E.Y.; Lee, J.G. Response to salt stress in lettuce: Changes in chlorophyll fluorescence parameters, phytochemical contents, and antioxidant activities. Agronomy 2020, 10, 1627. [Google Scholar] [CrossRef]
  35. Hameed, A.; Ahmed, M.Z.; Hussain, T.; Aziz, I.; Ahmad, N.; Gul, B.; Nielsen, B.L. Effects of salinity stress on chloroplast structure and function. Cells 2021, 10, 2023. [Google Scholar] [CrossRef] [PubMed]
  36. Saddiq, M.S.; Iqbal, S.; Hafeez, M.B.; Ibrahim, A.M.; Raza, A.; Fatima, E.M.; Baloch, H.; Jahanzaib, W.P.; Ciarmiello, L.F. Effect of salinity stress on physiological changes in winter and spring wheat. Agronomy 2021, 11, 1193. [Google Scholar] [CrossRef]
  37. Taïbi, K.; Taïbi, F.; Abderrahim, L.A.; Ennajah, A.; Belkhodja, M.; Mulet, J.M. Effect of salt stress on growth, chlorophyll content, lipid peroxidation and antioxidant defense systems in Phaseolus vulgaris L. S. Afr. J. Bot. 2016, 105, 306–312. [Google Scholar] [CrossRef]
  38. Taffouo, V.D.; Nouck, A.E.; Nyemene, K.P.; Tonfack, B.; Meguekam, T.L.; Youmbi, E. Effects of salt stress on plant growth, nutrient partitioning, chlorophyll content, leaf relative water content, accumulation of osmolytes and antioxidant compounds in pepper (Capsicum annuum L.) cultivars. Not. Bot. Horti Agrobot. Cluj-Napoca 2017, 45, 481–490. [Google Scholar]
  39. Gong, D.; Wang, G.; Si, W.; Zhou, Y.; Liu, Z.; Jia, J. Effects of salt stress on photosynthetic pigments and activity of ribulose-1, 5-bisphosphate carboxylase/oxygenase in Kalidium foliatum. Russ. J. Plant Physiol. 2018, 65, 98–103. [Google Scholar] [CrossRef]
  40. Tsioli, S.; Koutalianou, M.; Gkafas, G.A.; Exadactylos, A.; Papathanasiou, V.; Katsaros, C.I.; Orfanidis, S.; Küpper, F.C. Responses of the Mediterranean seagrass Cymodocea nodosa to combined temperature and salinity stress at the ionomic, transcriptomic, ultrastructural and photosynthetic levels. Mar. Environ. Res. 2022, 175, 105512. [Google Scholar] [CrossRef]
  41. Borsai, O.; Hassan, M.A.; Negrușier, C.; Raigón, M.D.; Boscaiu, M.; Sestraș, R.E.; Vicente, O. Responses to salt stress in Portulaca: Insight into its tolerance mechanisms. Plants 2020, 9, 1660. [Google Scholar] [CrossRef]
  42. Joshi, S.; Nath, J.; Singh, A.K.; Pareek, A.; Joshi, R. Ion transporters and their regulatory signal transduction mechanisms for salinity tolerance in plants. Physiol. Plant. 2022, 174, e13702. [Google Scholar] [CrossRef]
  43. Ashrafi, E.; Razmjoo, J.; Zahedi, M. Effect of salt stress on growth and ion accumulation of alfalfa (Medicago sativa L.) cultivars. J. Plant Nutr. 2018, 41, 818–831. [Google Scholar] [CrossRef]
  44. Adolf, V.I.; Jacobsen, S.-E.; Shabala, S. Salt tolerance mechanisms in quinoa (Chenopodium quinoa Willd.). Environ. Exp. Bot. 2013, 92, 43–54. [Google Scholar] [CrossRef]
  45. Sarker, U.; Oba, S. The response of salinity stress-induced A. tricolor to growth, anatomy, physiology, non-enzymatic and enzymatic antioxidants. Front. Plant Sci. 2020, 11, 559876. [Google Scholar] [CrossRef] [PubMed]
  46. Alharbi, K.; Al-Osaimi, A.A.; Alghamdi, B.A. Sodium chloride (NaCl)-induced physiological alteration and oxidative stress generation in Pisum sativum (L.): A toxicity assessment. ACS Omega 2022, 7, 20819–20832. [Google Scholar] [CrossRef] [PubMed]
  47. Demidchik, V.; Straltsova, D.; Medvedev, S.S.; Pozhvanov, G.A.; Sokolik, A.; Yurin, V. Stress-induced electrolyte leakage: The role of K+-permeable channels and involvement in programmed cell death and metabolic adjustment. J. Exp. Bot. 2014, 65, 1259–1270. [Google Scholar] [CrossRef] [PubMed]
Figure 1. Morphological appearance of L. sarmentosa plants at 14 days after the onset of the NaCl treatments. Bar = 2 cm.
Horticulturae 10 00388 g001
Figure 2. Growth parameters of L. sarmentosa plants at 14 days after the onset of NaCl treatments. (AC) fresh weight; (DF) dry weight. Error bars indicate standard deviations. Different letters represented significant differences between the treatments with p-values ≤ 0.05.
Horticulturae 10 00388 g002
Figure 3. Photosynthetic pigment contents of L. sarmentosa leaves 7 days after the NaCl treatments. (A) chl (a + b); (B) chl a; (C) chl b; and (D) carotenoids. Error bars indicate standard deviations. Different letters represented significant differences between the treatments with p-values ≤ 0.05.
Horticulturae 10 00388 g003
Figure 4. Relative water content, proline content, and total phenolic content of L. sarmentosa leaves at 7 days after the onset of NaCl treatment. (A) Relative content of water; (B) proline; and (C) total phenolics. Error bars indicate standard deviations. Different letters represented significant differences between the treatments with p-values ≤ 0.05.
Horticulturae 10 00388 g004
Figure 5. Ion content of L. sarmentosa leaves at 7 days after the onset of NaCl treatments. (A) Cl; (B) NO3; (C) NO3/Cl ratio; (D) Na+; (E) K+; and (F) K+/Na+ ratio. Error bars indicate standard deviations. Error bars indicate standard deviations. Different letters represented significant differences between the treatments with p-values ≤ 0.05.
Horticulturae 10 00388 g005
Figure 6. Electrolyte leakage and MDA and H2O2 content of L. sarmentosa leaves 7 days after the NaCl treatments. (A) MDA; (B) H2O2; and (C) electrolyte leakage. Error bars indicate standard deviations. Different letters represented significant differences between the treatments with p-values ≤ 0.05.
Horticulturae 10 00388 g006
Figure 7. Enzymatic activities of antioxidant enzymes in L. sarmentosa leaves at 7 days after the onset of NaCl treatment. (A) SOD; (B) POD; and (C) CAT. Error bars indicate standard deviations. Different letters represented significant differences between the treatments with p-values ≤ 0.05.
Horticulturae 10 00388 g007
Disclaimer/Publisher’s Note: The statements, opinions and data contained in all publications are solely those of the individual author(s) and contributor(s) and not of MDPI and/or the editor(s). MDPI and/or the editor(s) disclaim responsibility for any injury to people or property resulting from any ideas, methods, instructions or products referred to in the content.

