Article

Ficus Genome Database: A Comprehensive Genomics and Transcriptomics Research Platform

1
School of Life Sciences, Qufu Normal University, Qufu 273165, China
2
School of Computer Science and Technology, Shandong Jianzhu University, Jinan 250101, China
3
Key Laboratory of Plant Resource Conservation and Sustainable Utilization, South China Botanical Garden, The Chinese Academy of Sciences, Guangzhou 510650, China
4
Plant Science & Technology College, Huazhong Agriculture University, Wuhan 430070, China
*
Authors to whom correspondence should be addressed.
Horticulturae 2024, 10(6), 613; https://doi.org/10.3390/horticulturae10060613
Submission received: 4 May 2024 / Revised: 4 June 2024 / Accepted: 5 June 2024 / Published: 9 June 2024
(This article belongs to the Section Genetics, Genomics, Breeding, and Biotechnology (G2B2))

Abstract

:
Ficus is a significant genus within the Moraceae family, primarily native to tropical and subtropical regions. It plays a crucial role in the study of co-evolution and genetics in the fig–fig wasp symbiosis. Advancements in sequencing technology have facilitated whole-genome sequencing of several Ficus species, accumulating vast amounts of genomic and transcriptomic data available in public databases. To streamline data integration, display, and analysis, we developed the Ficus Genome Database (FGD), a consolidated platform for the genomic data of five Ficus species, and self-assembled transcriptome data for 24 fig ostiolar bracts. The FGD is currently home to a diverse array of data, encompassing genome and gene sequences, annotations of genes, transcriptome analyses, biochemical pathways, non-coding RNA, and findings from comparative genomic studies, such as collinear blocks across different Ficus genome assemblies. To enhance translational and practical research concerning Ficus, FGD provides an extensive suite of accessible query interfaces, analytical instruments, and visualization options. These include the NCBI BLAST sequence search tool and the JBrowse/GBrowse genome browser. FGD also offers several distinct tools, including a genome Synteny Viewer, expression heatmap display, gene family identification, Gene Ontology terms enrichment, and pathway enrichment analysis.

1. Introduction

The genus Ficus, belonging to the family Moraceae, is highly specialized and comprises approximately 1000 known species worldwide [1]. Ficus species are characterized by distinctive inflorescences called figs or syconia [2]. They occupy various ecological niches and exist as standalone deciduous or evergreen trees, shrubs, herbs, climbers, or creepers. They are primarily distributed in tropical and subtropical regions, with a particular diversity in Southeast Asia [3]. Ficus species play crucial roles in ecosystems and are considered key species in tropical rainforests. They exhibit distinct traits including syconia, the ability to bear fruit, caprification, and differentiation based on sex [4]. Sexual systems, including those found in figs, are essential for species survival and are significant subjects in reproductive biology. Ficus fruits, roots, and leaves are used in traditional medicine to treat various ailments, including gastrointestinal and respiratory disorders [4,5]. Additionally, Ficus species have significant applications in horticulture [4,5].
Ficus and their pollinators have long served as examples of obligate symbiosis. Pollinating wasps are the sole organisms responsible for fig pollination. These wasps lay their eggs only inside fig syconia, entering through a tight, small hole [6]. Although most Ficus species are associated with only one wasp species, some Ficus species parasitize additional wasp species. Floral scents play a central role in attracting pollinators into nursery pollination systems. Specifically, fig wasps are drawn to the volatile organic compounds (VOCs) that are emitted by the figs, with terpenoids identified as key elements of these VOCs [7]. The process of terpenoid synthesis is facilitated by terpene synthases (TPSs) [8,9]. Histological studies have revealed that glands responsible for VOC emission are predominantly located in the ostiolar bracts, and for certain Ficus species, also on the epidermis of the fig wall [7]. This evidence points to the ostiolar bracts being a significant source of VOCs that attract wasps [7,10]. Therefore, completing and collecting the whole Ficus genome and fig bract transcriptome sequences have become areas of significant focus in co-evolutionary research to uncover the molecular mechanisms underlying fig–wasp mutualism [11].
Recently, various single-species genomic databases such as Citrus Genome Database (https://www.citrusgenomedb.org/, accessed on 8 April 2024), GDR (https://www.rosaceae.org/, accessed on 20 May 2024), GDV (https://www.vaccinium.org, accessed on 19 May 2024), Cottengen (https://www.cottongen.org/, accessed on 13 May 2024), and CuGenDB (http://cucurbitgenomics.org/v2/, accessed on 12 May 2024) [12,13,14,15,16] have emerged; yet, there is no reported genomic database for the genus Ficus. Following the release of the first Ficus genome sequence from Ficus carica L. in 2016 [4], massive Ficus omics data are currently stored in publicly accessible databases, and processing and extracting valuable information from this data pose significant challenges for many biologists lacking bioinformatics expertise. To address these challenges, we developed the Ficus Genome Database (FGD, http://www.ficusgd.com, accessed on 4 May 2024), the first dynamic database of Ficus genome draft sequences, transcriptome sequences, maps, and annotation datasets. FGD fills the gap in the currently unavailable publicly accessible Ficus genome database and provides a valuable resource for the global scientific community. This user-friendly database enables researchers to mine Ficus genome data, conduct comparative genomic analyses, and explore the expression profiles of Ficus using transcriptome data from different tissues and ecological environments. We anticipate that the development of the FGD will serve as a platform for data and resource sharing, communication, and analysis among researchers focusing on Ficus species and related ecological studies.

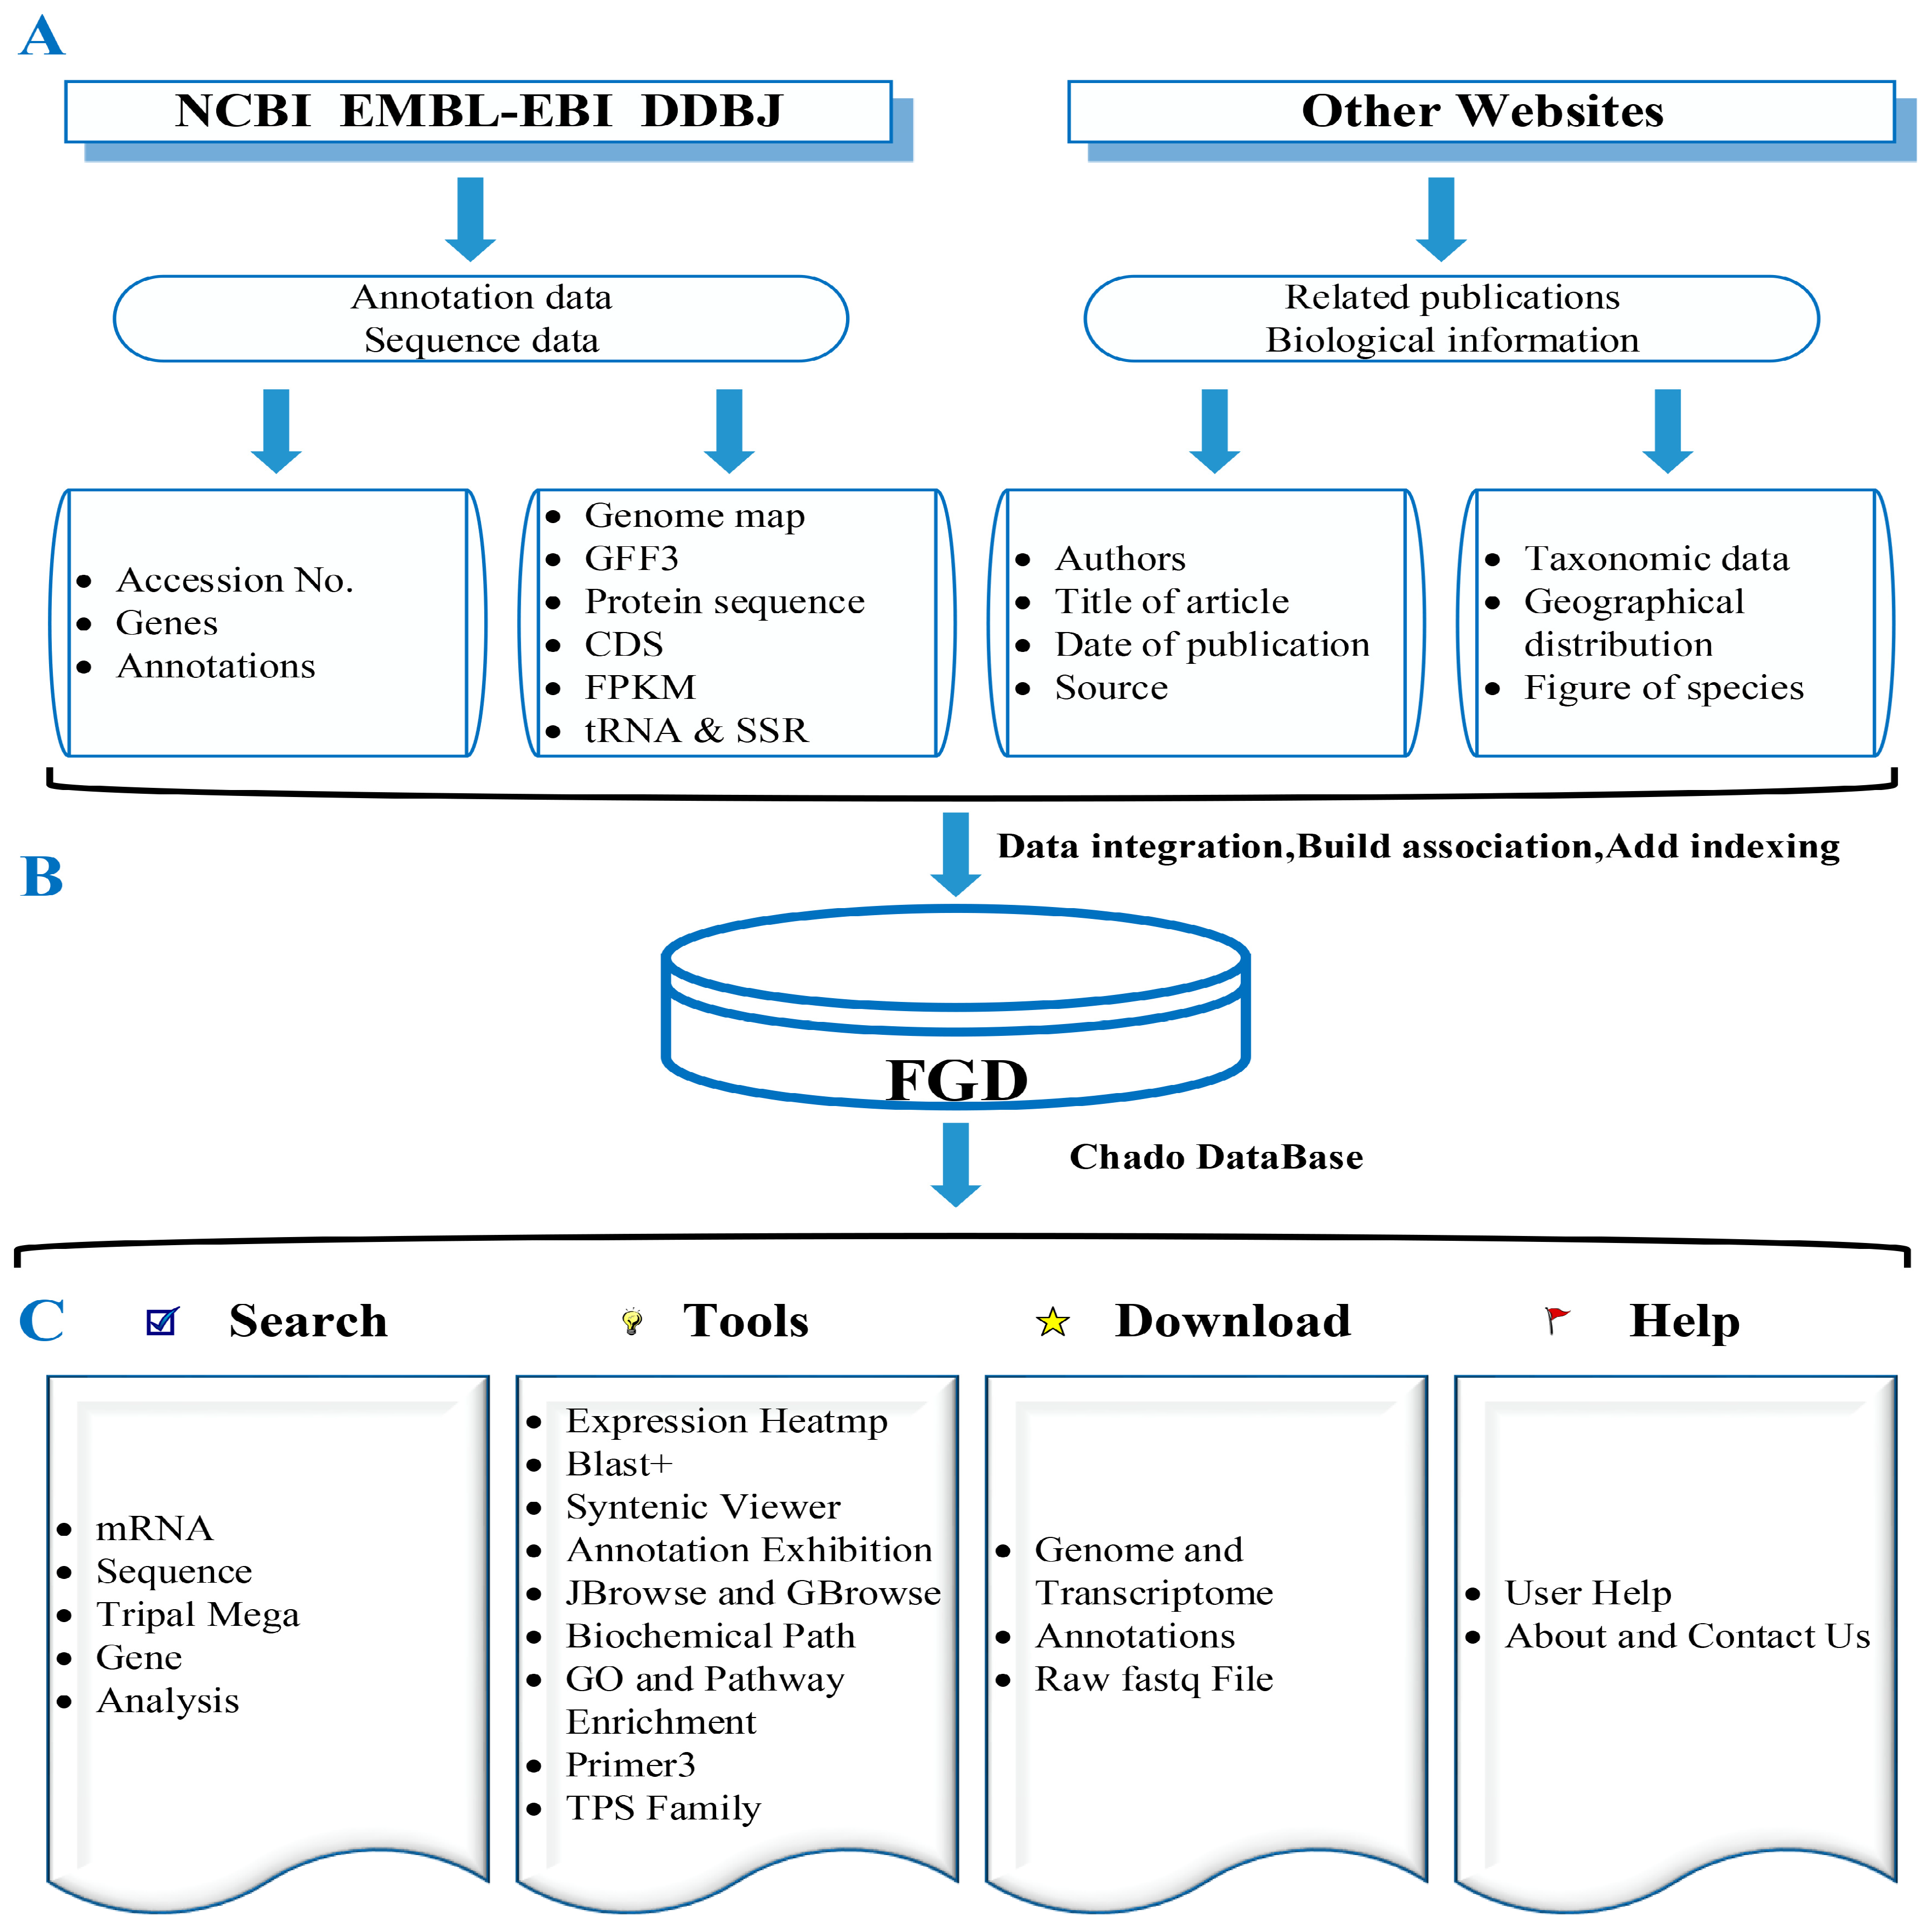
2. Construction and Content

2.1. Genome Data Source

We obtained high-quality whole-genome sequencing data for five Ficus species that have been fully sequenced (Table 1 and Table 2, Figure 1A). For the study of Ficus carica L. and Ficus erecta var. erecta, genomic, transcriptomic, and predicted protein sequences along with gene annotations in gff3 format were obtained from PlantGarden’s online platform (https://plantgarden.jp/ja/download/, accessed on 12 October 2023). The whole-genome sequences of Ficus hispida L.f., Ficus microcarpa L.f., and Ficus pumila var. pumila were downloaded from the National Center for Biotechnology Information (NCBI) database (https://www.ncbi.nlm.nih.gov/; accessed on 12 September 2023). Downloaded genome files were renumbered and formatted using an in-house Perl script. Consequently, each genome was organized into genome, gff3, coding sequence (CDS), and protein sequence files, which were formatted in a unified manner (http://www.ficusgd.com/node/3, accessed on 4 May 2024).
The assembled mRNA sequences of the five genomes were searched and annotated using BLASTN. Annotation comparisons were performed using the NCBI non-redundant nucleotide sequence (Nr) database. A cutoff E-value value of 10−5 was used [17]. Protein sequence files from the five genomes were annotated using BLASTP (E-value < 1 × 10⁻⁵) against a series of protein databases, including Nr (last updated March 2023), Swiss-Prot (version 2023-03), eggnog (version 5.0), InterPro (including the PANTHER database), Pfam (version 2023-05), KEGG (version 63.0), and KOG (version 2003-03) databases [18]. Blast2GO (https://www.blast2go.com/; accessed on 21 December 2023) was used to predict GO terms related to molecular functions, cellular components, and biological processes using Nr annotations [19]. Finally, annotation information for all five genomes (Nr, Swiss-Prot, Interpro, Pfam, KOG, eggNOG, GO, and KEGG) was obtained [20].

2.2. Transcriptome Data Source

From 24 Ficus species in Southern China and Southeast Asia (Figure S1 and Table 1), we collected samples from three plants of each type [21]. We removed the bracts from the male syconia’s ostiole and stored them in an RNAlater™ solution (Takara, Tokyo Japan) [21]. RNA was extracted using the CTAB method [21]. Novogene Bioinformatics Technology Co., Ltd. (Beijing, China) performed paired-end sequencing using Illumina’s HiSeq 4000 platform (Illumina, San Diego, CA, USA). The raw sequencing data were obtained from prior research conducted by our laboratory [21,22].
Using Trinity v2.9.1 (using default assembly parameters and a minimum coding length of 200 bases) and the De Bruijn graph algorithm, RNA-seq data from 24 Ficus were de novo assembled into contigs, from which unigenes were extracted via in-house Perl script [21,23]. A TransDecoder v5.5.0 with default parameters was utilized to predict the CDS for each gene isoform [21,24]. The raw and assembled sequence data were deposited in the FGD.

2.3. Genome Collinearity Analysis

We identified syntenic regions and homologous gene pairs within the genome sequences of the five Ficus species and compared them pairwise. Initially, the protein sequences were compared using BLASTP, which utilizes pairwise comparison. A significance threshold of 10−5 was used for the E-value and only up to five alignments were considered. Syntenic blocks were determined using MCScanX [25] with default parameters based on the results of BLASTP comparisons and gene positions. Among the five Ficus genomes, 17,727 collinear blocks and 425,439 homologous gene pairs were identified (Table 1). Between any two of the five genomes, there were 1700–2600 collinear blocks and 41,000–51,000 homologous genes [26,27].

2.4. Gene Expression Analysis

We analyzed expression levels using FASTQ sequence data procured from the Sequence Read Archive (SRA) database and evaluated the expression of our self-assembled transcriptome data for fig bracts using each corresponding Ficus reference genome. The relevant information and versions of the Ficus genomes are listed in Table 2.
Raw transcriptome sequencing data were downloaded from the NCBI SRA database (https://www.ncbi.nlm.nih.gov/sra/; accessed on 16 December 2023). The FastQC program with default parameters was used to assess the quality of the raw reads [28]. Paired-end reads were then subjected to low-quality base trimming using Trimmomatic v0.30 (parameters: ILLUMINACLIP:TruSeq3-PE-2.fa: 2:30:10 LEADING:5 TRAILING:5 SLIDINGWINDOW: 4:15 MINLEN:50) [29]. For subsequent analysis, we used Hisat2 v2.2.1 (parameters: --dta --very sensitive) [26] and StringTie v2.1.7 (parameters: -m 200 -f 0.3) [30] to compare the clean reads to the reference genome, thereby establishing gene expression profiles and conducting expression analysis. The software assembled the transcripts, including novel splice variants, and quantified their abundance in each sample. Toward the end of the analysis pipeline, we tabulated the read count for each gene and normalized it to fragments per kilobase transcript per million mapped reads (FPKM) values based on the alignment. Furthermore, we obtained the mean and standard error of the FPKM values for biological replicates.
We replicated the methodology described in Section 1 for a trio of distinct self-assembled bract transcriptome data corresponding to F. erecta var. erecta, F. hispida L.f., and F. microcarpa L.f. This involved employing tools such as FastQC v0.11.9, Trimmomatic v0.30, Hisat2 v2.2.1, and StringTie v2.1.7 for comprehensive analysis of the transcriptome data against the reference genome. Subsequently, a BAM file was generated and visualized using GBrowse v2.5.6 [20].

2.5. Noncoding RNA Analysis

We used a tRNAscan-SE 2.0 with default parameters [31] to predict tRNA genes in the nuclear genome of Ficus species (Table 1). The results were displayed and simultaneously downloaded using GBrowse.
Simple sequence repeats (SSRs) were predicted using MISA [32]. A combination of SSRs separated by a maximum distance of 100 bp was considered an SSR for compound formation [32].When performing SSR identification analysis, the local version of Primer3 was simultaneously called for batch primer design. The analysis results of the SSR and primer combinations obtained using Misa_primer3 with default parameters [33] were displayed in GBrowse.

2.6. Biochemical Pathways

We utilized the Pathway Tools software v20.0 [34] to predict biochemical pathways in the five Ficus species. Pathway Tools have PathoLogic components which can create a new Pathway/Genome Database (PGDB) containing the predicted metabolic pathways of an organism, given a Genbank entry as input. For each species, we considered the genome and individual gene sets, along with gene function descriptions provided by AHRD (https://github.com/groupschoof/AHRD, accessed on 10 May 2024), Blast2GO, and the Enzyme Committee (EC), as well as the relevant data from the UniProt (TrEMBL/Swiss-Prot) database. All this information was consolidated into a single file in PathoLogic format, and Pathway Tools was then used to predict the associated pathways. We annotated 395–400 biochemical pathways for each genome. In addition, we used the Pathway Tools web server to create the FicusCyc database. FicusCyc provides users with the ability to search, browse, and perform comparative and omics data analyses using the predicted pathways [20,35].

2.7. Database Construction

The FGD database was constructed using Tripal, a bioinformatics database construction toolkit, combined with the content management system Drupal (https://www.drupal.org, accessed on 5 May 2024) and the Chado database [36], a standardized biological relational database for backend storage (Figure 1B). Each function in the FGD has its own dedicated page (Figure 1C), and these functions are interconnected through sequence ontology relationships.
Tripal offers various models for enhancing the development of online genomic databases. The database was populated with genome sequences, predicted gene models, mRNA, and protein sequences using Tripal’s “data loader” function. Functional annotations, such as Nr and Swiss-Prot gene annotations, top BLASTP hits, and InterPro functional annotations for each gene were imported into the FGD through the “Tripal Analysis Extension” module [37].
The identified homologous genes and syntenic blocks were incorporated into the FGD using the “Synteny Viewer” module [38]. This module can generate a block diagram of the collinear regions between two selected scaffolds.
The “Tripal Analysis Expression” module was employed to upload expression data, including read counts and FPKM values, along with relevant experimental metadata to the FGD. This module specializes in organizing and showcasing gene expression profiles. Within the FGD, an “Expression Heatmap” feature on the homepage presents a heatmap of chosen gene expression patterns, offering a detailed inventory of all gathered data. This interface allows for the display of meta-information for specific RNA-seq items through mouse-over descriptions, enhancing user interaction and data accessibility. Additionally, every gene’s function page includes an “Expression” section to guide users in visualizing and exploring its expression datasets (Figure S2).
To meet user needs for multi-omics analysis, the FGD was developed with tool modules, such as GO enrichment and pathway enrichment, TPS Family, and Primer3, which can be used for enrichment analysis based on Ficus omics data, terpene synthase gene mining, and online primer design, respectively. These modules were developed using Perl v5.26/CGI software. Figure 1 shows the overall structural framework of the FGD.

3. Utility and Discussion

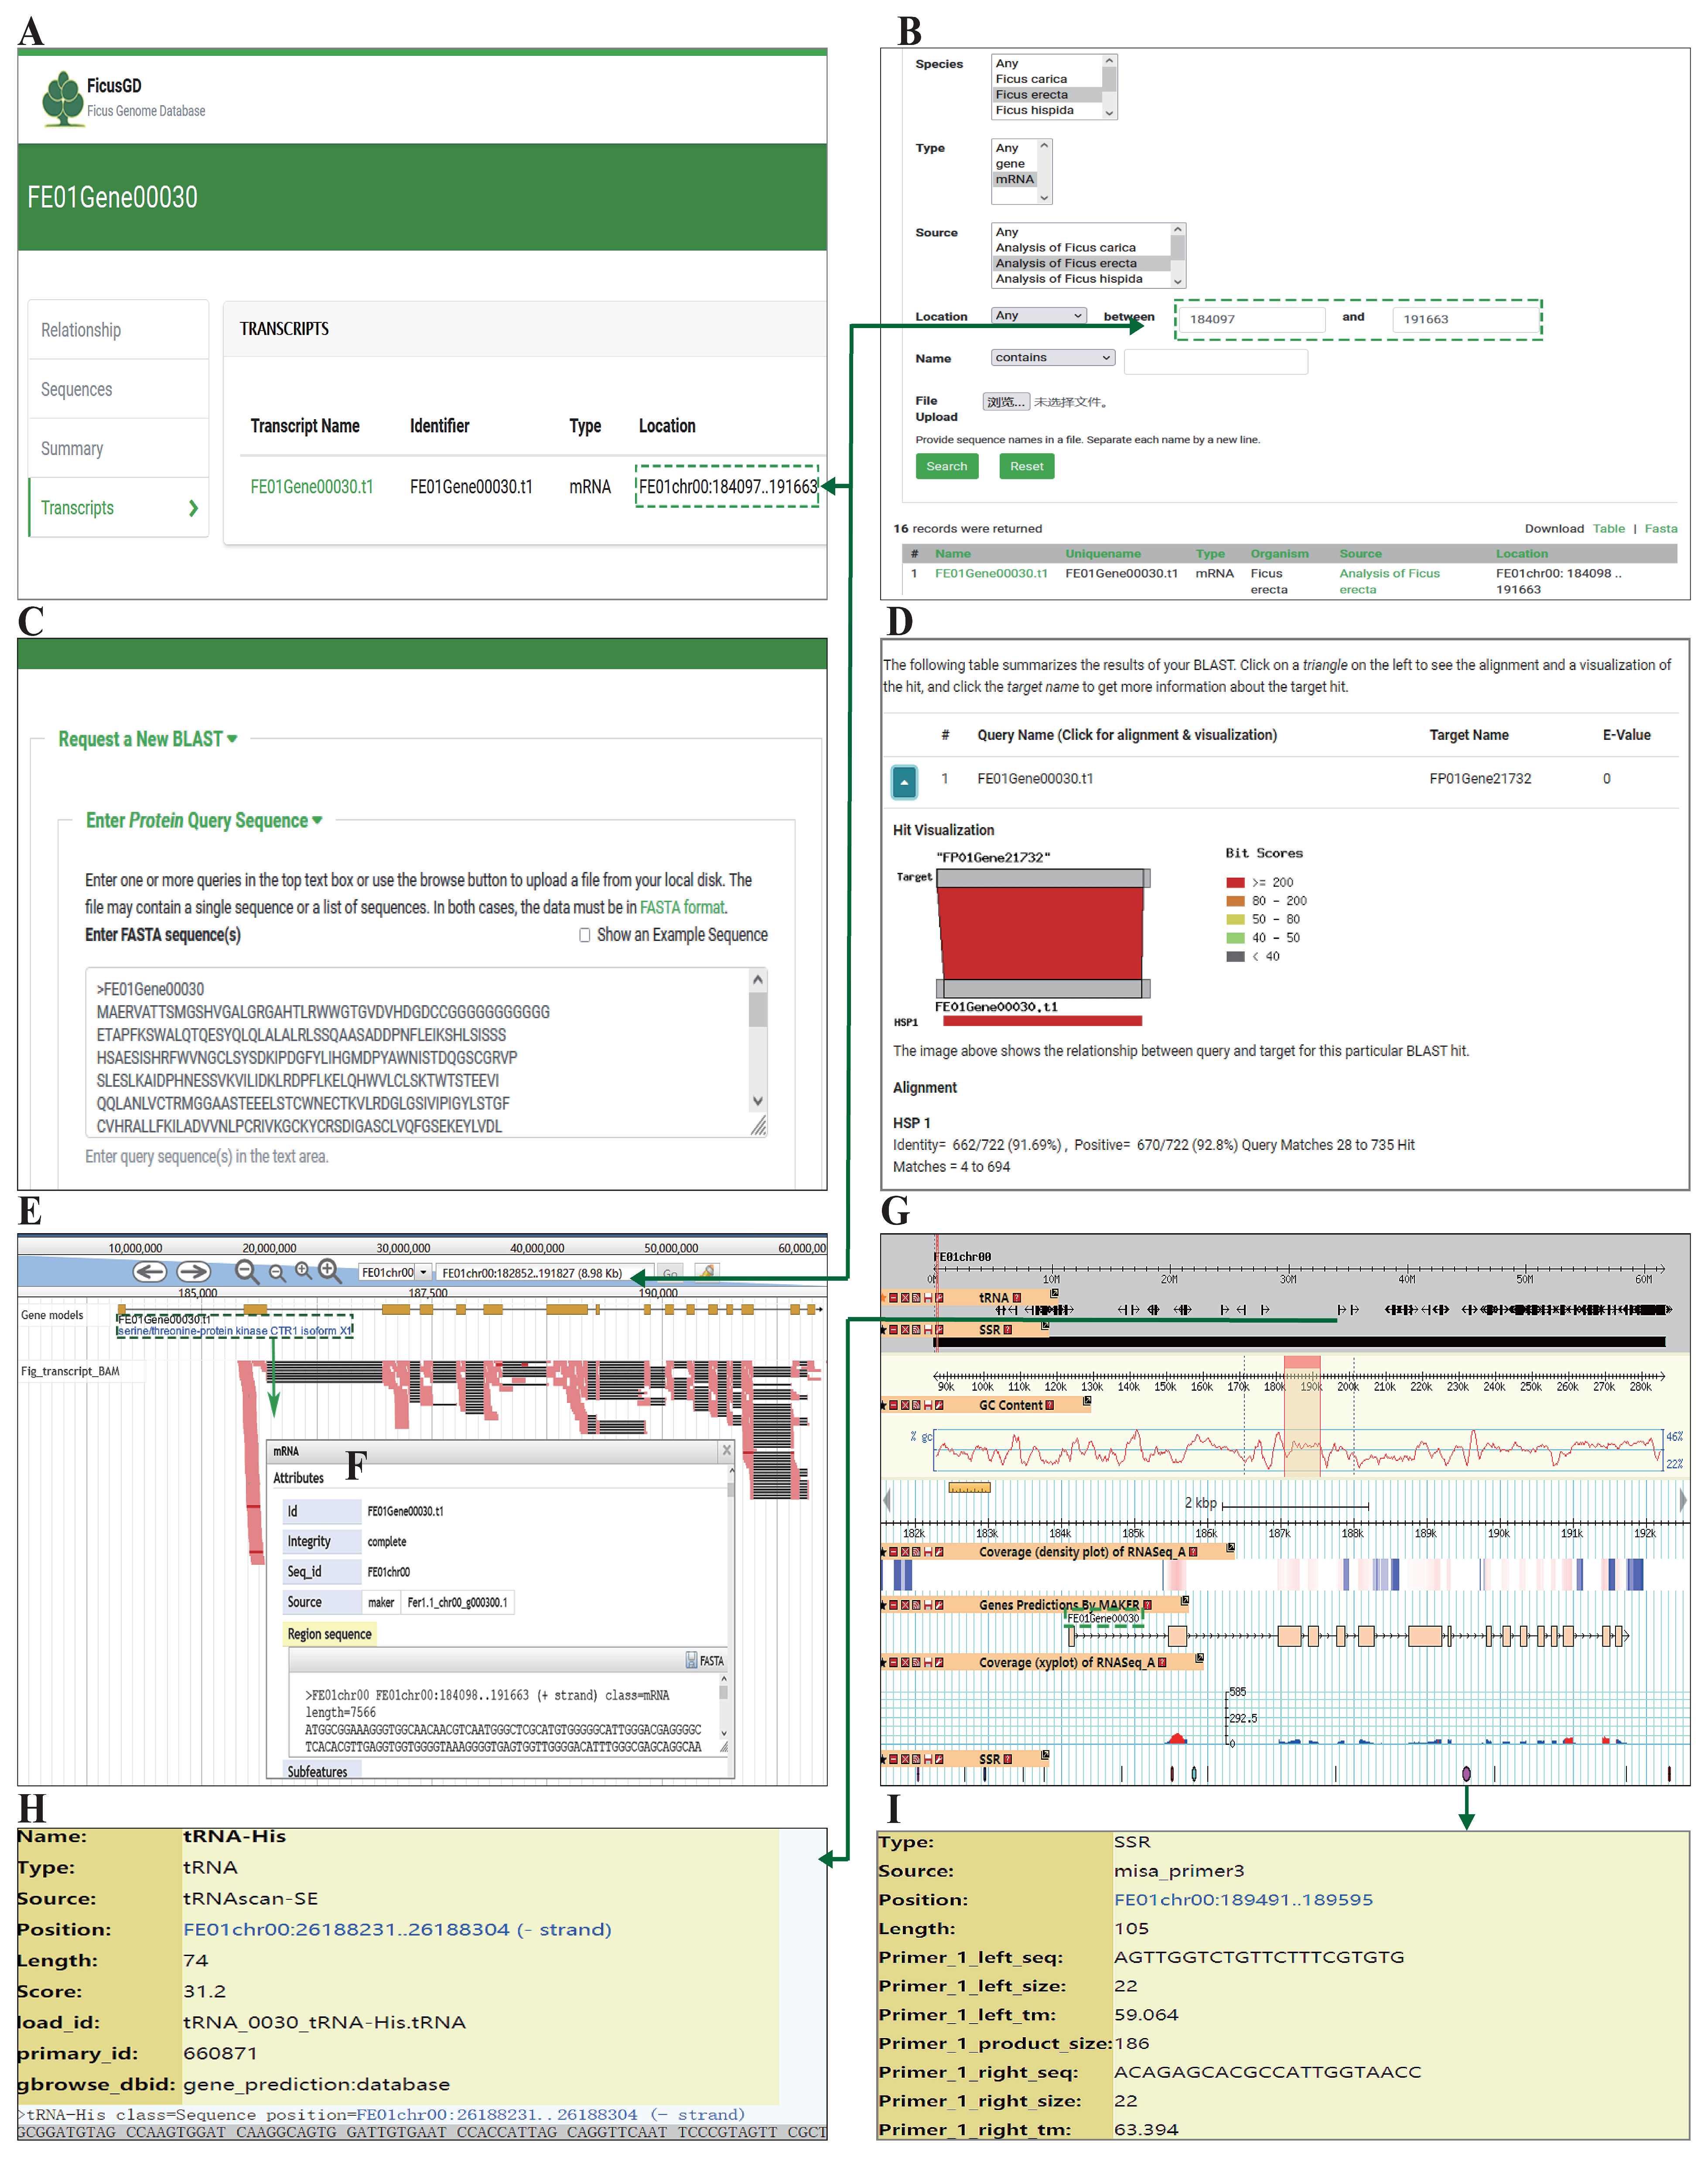
3.1. A Brief Introduction to FGD

The FGD features a streamlined structure with five main modules: Species, Search, Tools, Downloads, and Help. It is regularly updated with new genome sequences and annotation information, ensuring that it provides up-to-date reference genome data for the study of Ficus and related species. Additionally, it offers access to eleven bioinformatics tools online (Figure 1C), making it a comprehensive resource for analyzing, downloading, exploring, and visualizing genomic and transcriptomic data across Ficus species.

3.2. Search and Download

The FGD website offers search functions for various keywords, enabling users to locate relevant functions using the search menu on the main page. Fundamental search functions include gene and mRNA searches. Users can retrieve the relevant feature page using the gene or mRNA ID number or name as the search parameters. On the corresponding page, users can find information, such as the related nucleotide or protein sequences, functional annotations, and expression levels.
In addition to the fundamental search function, the FGD offers additional functionalities for bulk searches and downloads. It primarily comprises two functional modules: “Sequence Search” and “Tripal Mega Search”. The Sequence Search module enables batch searching of related sequences based on gene or mRNA names or location information, along with the provision of a batch download function (Figure 2A). Furthermore, the Tripal Mega Search not only facilitates searching for genes/transcripts but also supplies corresponding functional annotation information, while offering users a wide range of formats for downloading and browsing.

3.3. Homology Alignment and Searching

The Tripal BLAST UI extension module was installed in the FGD to enable the implementation of the homology search function. BLAST was used to compare the genome, mRNA, CDS, and protein sequences of all five Ficus species. Additionally, depending on the selection, the BLAST program automatically configures the reference database for different databases, such as BLASTN, BLASTP, BLASTX, tBLASTN, and tBLASTX (Figure 2C).
During homologous comparisons, users have the option of personalizing the E-value and specifying the maximum number of BLAST hits to be retrieved. The Tripal BLAST UI module offers three downloadable formats for comparison: HTML, TSV, and XML. These alignment result pages display a comprehensive list of all hits, with each hit linked to a graphical output that illustrates the alignment between the query and the coordinates. In addition, the alignment color-ranked bit scores between the hits are shown (Figure 2D).

3.4. Genome Browsers

To provide detailed visualization of the genome sequence and gene model structure, we implemented and customized JBrowse, a widely utilized genome browser, on the FGD website. All sequenced and published genomes and gene models of the five Ficus species were imported into JBrowse. The browser enables a graphical representation of detailed features and various structural information in the genome based on data from the genome annotation gff3 file. Furthermore, the JBrowse browser allows the presentation of other relevant information, including gene variations, polymorphisms, and expression data. Additionally, this information was incrementally imported into the FGD database and made available for display using JBrowse (Figure 2E,F).
Within the FGD, GBrowse was configured to enable the examination, visualization, and downloading of various types of expression information, such as transcriptome RNA-seq data, as well as tRNA and SSR details (Figure 2G). We categorized the five types of Ficus genomes into an aggregate of 3526 tRNAs, each possessing an average length of 75 bases, and discovered a sizable number of SSRs, totaling 563,787. Access to comprehensive information on each tRNA or SSR requires only one click on GBrowse (Figure 2H,I). The browser is also equipped to offer download features for these sequences along with their related information.

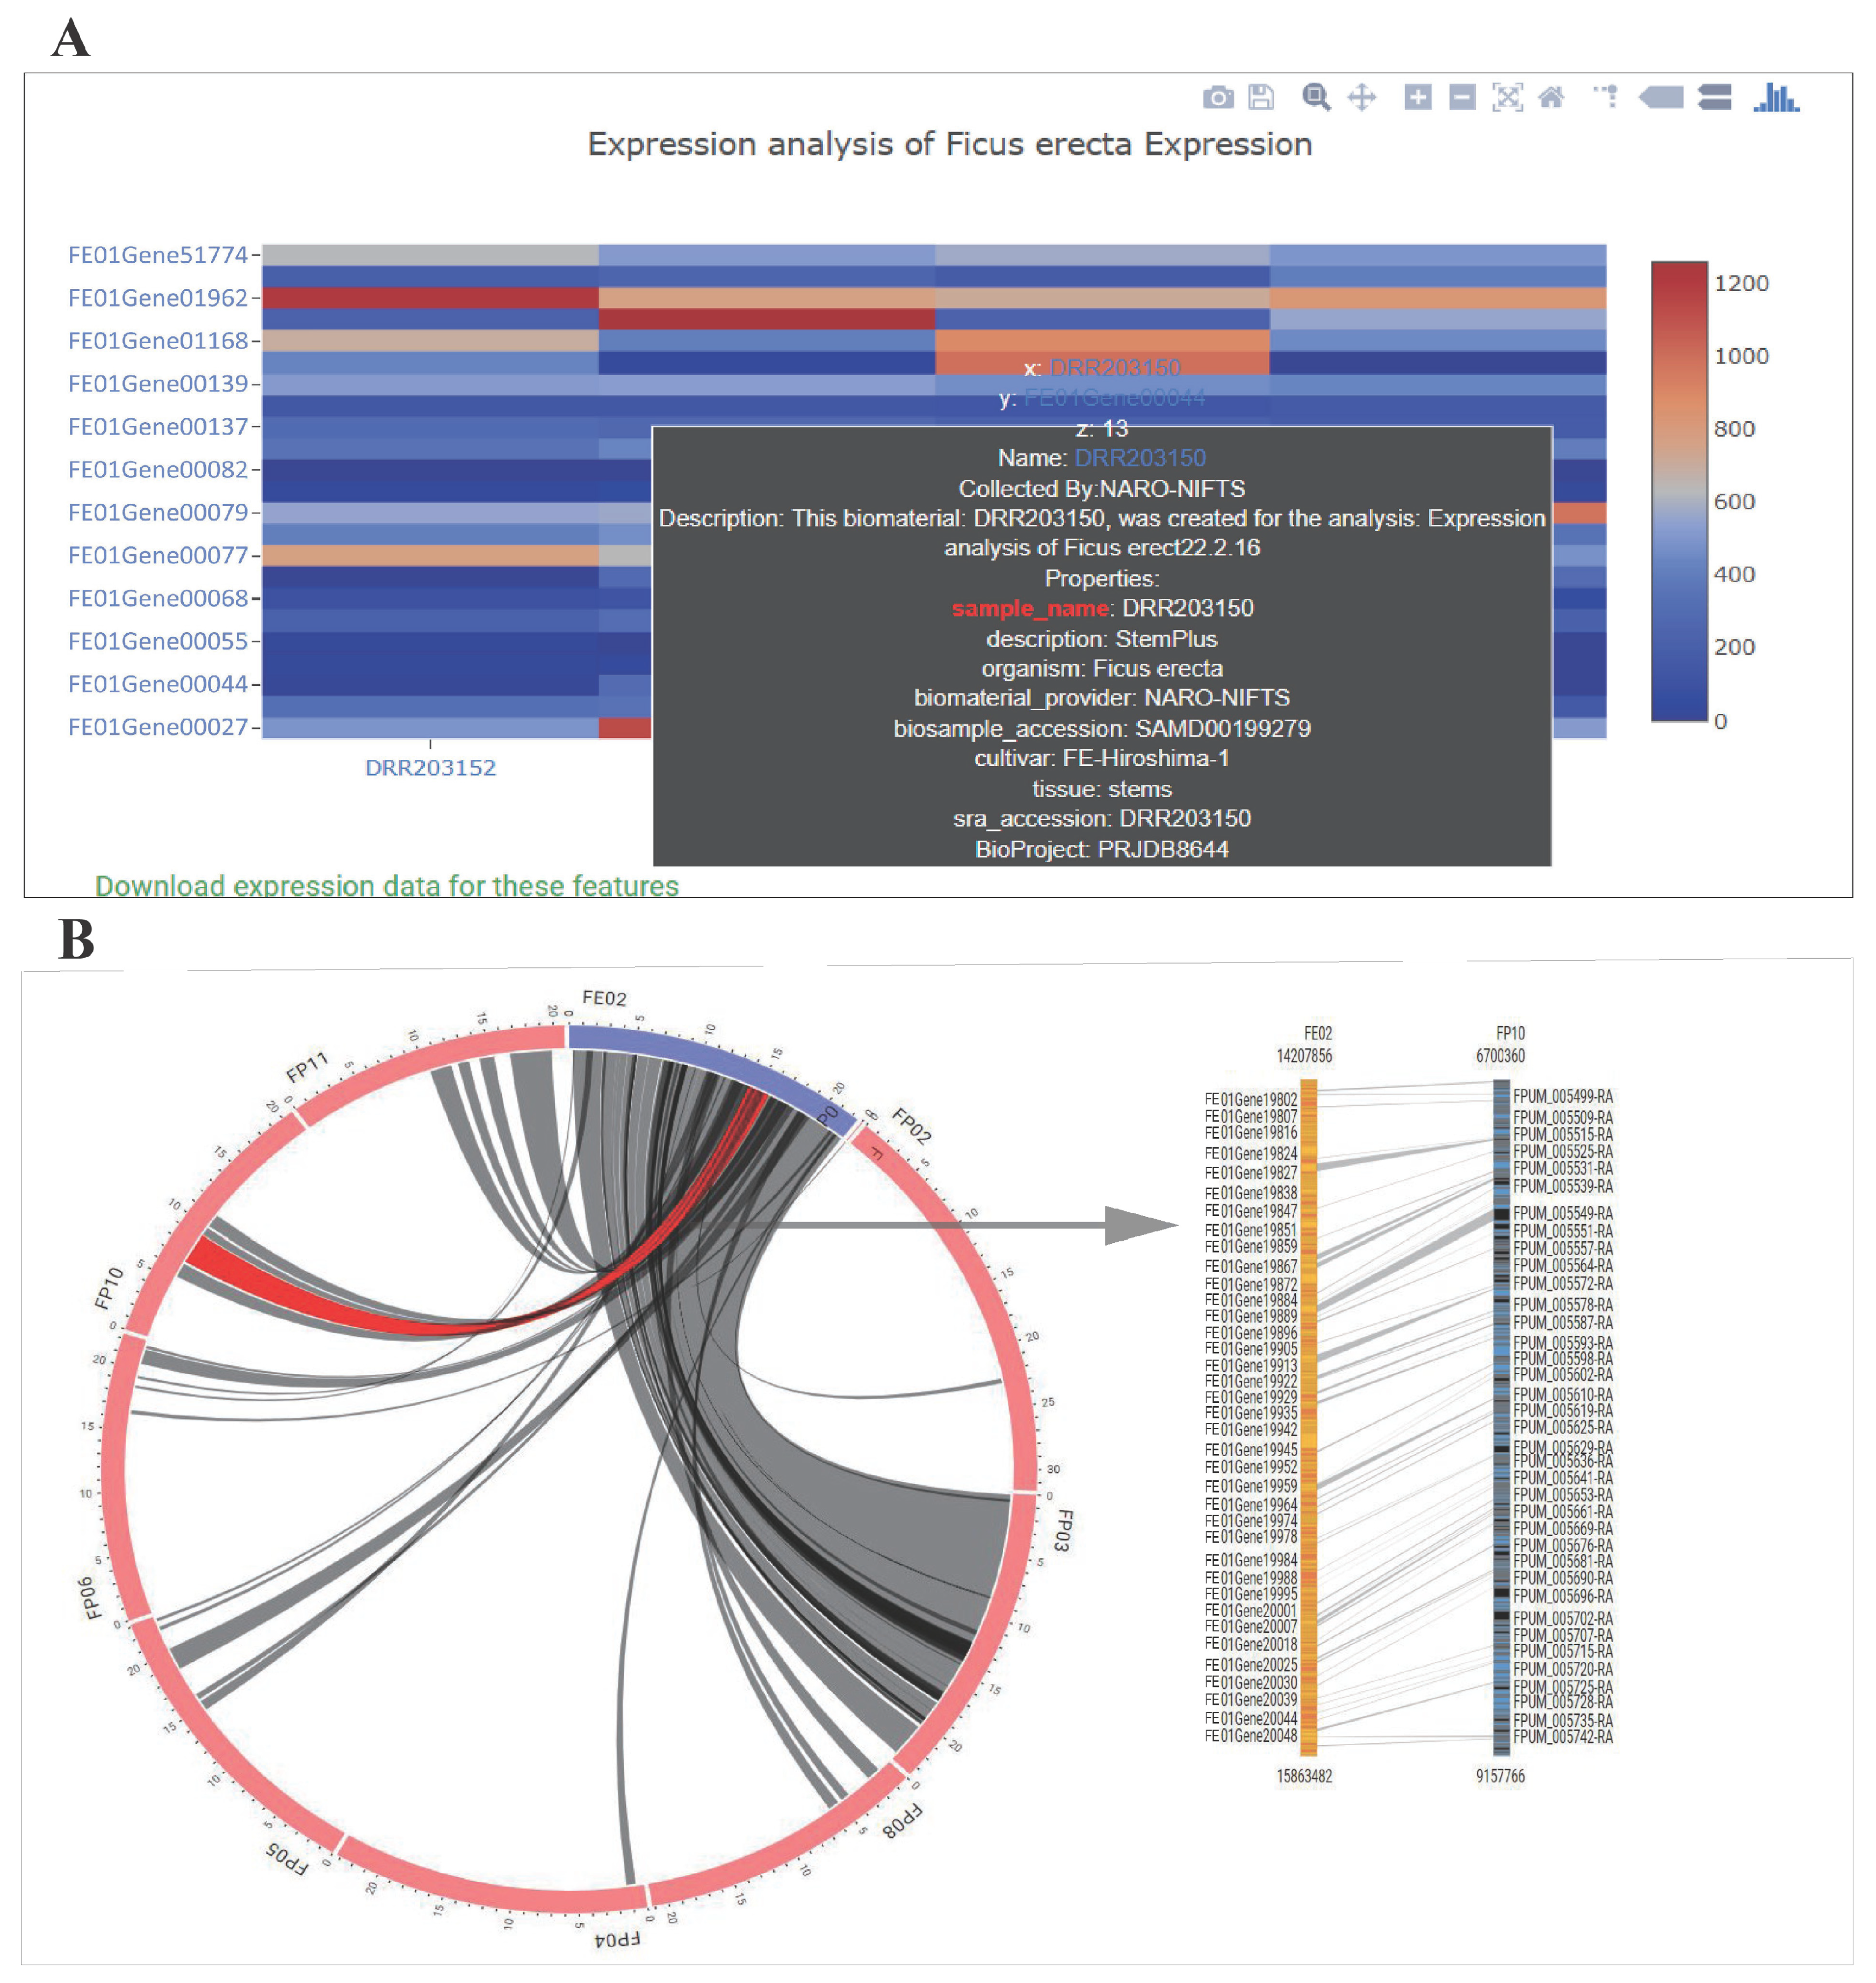
3.5. Expression Heatmap Exhibition

The FGD goes beyond merely housing RNA-seq data and gene expression datasets; it introduces the “Tripal Expression” module, crafted to facilitate the analysis of RNA-seq data, including pinpointing gene expression trends. This module offers a downloadable file feature, encompassing a comprehensive list of identified genes along with their pertinent details. For individual gene expression profiles, users can turn to the gene signature page. Moreover, the “Tripal Expression” module enhances user engagement through an interactive visualization tool. It employs a heatmap tool powered by Plotly’s JavaScript library (https://plot.ly, accessed on 23 September 2023), designed to graphically represent the expression profiles of a selected gene group (Figure 3A) [39]. All expression data, quantified by FPKM values, are pre-imported into the Chado database. The Plotly library leverages JavaScript to create interactive and dynamic charts and graphs, which can be integrated into web pages.

3.6. Synteny Viewer

The “Synteny Viewer” is an extension of Tripal that facilitates the import and display of collinear information from different species’ genomes. We integrated the Synteny Viewer module into the FGD. Using this integration, we were able to identify homologous gene pairs and collinear blocks in various Ficus species. In the FGD, users can manually select one or more chromosomes or scaffolds from their genome. Once selected, the Synteny Viewer module generates a collinearity block diagram based on the chosen scaffolds and provides a comprehensive list of collinearity blocks. Each collinearity block on the diagram is clickable, allowing users to access detailed information about homologous genes (Figure 3B). In response to a click, the Synteny Viewer module showcases a bar graph illustrating the homologous gene pairs, with the ability to zoom in or out using the mouse wheel. Furthermore, users can obtain detailed information for each gene by clicking on its name within the view. In summary, the Synteny Viewer module not only displays syntenic blocks but also aids in identifying and visualizing homology blocks between different Ficus genomes.

3.7. Enrichment Analysis

Extensive genomic research typically produces significant numbers of genes that capture interest. It is vital to interpret these gene compilations to grasp the regulatory dynamics governing crucial biological functions and metabolic pathways. A common and effective method for this interpretation is enrichment analysis, which pinpoints particular gene clusters or families that appear more frequently than expected within a biological dataset, such as GO terms or metabolic pathways. We previously created two specialized extension modules, “GO Enrichment“ and “Pathway Enrichment“, utilizing the hypergeometric test for this purpose (Figure 4A,B). These modules, integrated into the FGD, facilitate the identification of notably enriched GO terms and metabolic pathways based on genes supplied by users [40,41]. For visualizing enriched KEGG pathways, the “Pathway Enrichment” module employs R’s pathway package (Figure 4C).

3.8. Annotation Exhibition, FicusCyc, Primer3, and TPS Family

FGD offers an “Annotation Exhibition” tool that displays eight functional annotations of Ficus, facilitating user access and review. Additionally, users can query specific genes using sequence IDs to access detailed annotations.
Based on the annotation results of the pathway tools, the FicusCyc subsite can display various types of genomic information, such as the biochemical metabolic pathways of the five Ficus species. For example, Figure 4D shows the linalool biochemical synthetic pathway in Ficus microcarpa L.f.
The Primer3 tool was integrated into the FGD to generate primers for selected short tandem repeats (STRs). Users can select STRs using a radio button to specify the ones they want to use for primer design. The FGD also allows users to design primers for a selected STR locus by providing a template of approximately 1000 base pairs.
Terpenoids, a main component of VOCs released by syconia, play a crucial role in maintaining the fig–fig wasp symbiotic relationship. This necessitates providing an exploration tool for the terpene synthase gene to aid research into the molecular mechanisms of their mutualistic symbiosis. The FGD offers an online gene identification tool for members of the TPS gene family. Users have the option to either upload a local protein sequence file or enter the protein sequence in the provided online text dialog box and then click the submit button. The FGD sequence is then sent to the backend server, located at the backstage of the website, to invoke a Perl script (https://github.com/liliane-sntn/TPS, accessed on 13 May 2024). The Perl program can identify TPS’s gene family genes from the input protein sequences using the Hidden Markov Model (HMM) and protein families (Pfam) database [14,37].

3.9. Download and Help

The “Download” module comprises three main components: genome, transcriptome, and annotation data. The genome section offers users five types of genomic data for Ficus species, encompassing the complete genome, CDS, protein sequences, and the gff3 file. The transcriptome section provides information on 24 Ficus species, including raw transcriptome sequencing data, assembled sequence information, and gff3 files. Annotation data encompasses GO functional classification graphs for five Ficus species. The “Help” module offers users a comprehensive manual for navigating and utilizing the website.

4. Conclusions and Future Directions

The FGD website provides a platform to display the genomes of Ficus species and conduct correlation analyses of genomes and transcriptomes; it can be applied to multiple research areas including genomics, transcriptomics, bioinformatics analysis, genetic breeding, and the co-evolution of figs and fig wasps in the genus Ficus. In the future, we plan to continuously add the latest scientific research results of Ficus genome sequencing analyses and enhance the FGD by incorporating new features, such as the “CMap” gene linkage mapping functionality [42].
It needs to be emphasized that inherent limitations and potential errors exist within the current publicly available genetic databases, including large databases such as NCBI. Consequently, the construction of databases dedicated to single species or specific functions will facilitate researchers in utilizing genomic data more efficiently. The FGD was developed to overcome these challenges. FGD offers a user-friendly platform for Ficus genome analysis, featuring elements such as data submission, gene annotation, gene synteny analysis, and expression level analysis. At the same time, we have also developed and implemented new functional modules in the FGD, such as the “Pathway Enrichment“ and “TPS Family“ modules. The inception of the FGD is anticipated to generate increased interest in the scientific community for future genomic research on Ficus [43,44].
In conclusion, the FGD will be periodically updated and indexed as novel Ficus genomes, Ficus transcriptomes, and additional genetic datasets become available [12,38,45]. Moreover, we are committed to generating innovative extension modules for the benefit of the Tripal community. We strongly believe that the FGD will evolve into a versatile and global platform that will serve researchers and plant-breeding developers [12,46].

Supplementary Materials

The following supporting information can be downloaded at: https://www.mdpi.com/article/10.3390/horticulturae10060613/s1, Figure S1: geographical distribution of 24 species of Ficus used for transcriptome analysis.; Figure S2: the “Expression” section exhibits the expression profile on the individual gene function’s “Summary” page in FGD.

Author Contributions

P.S. and Y.B. conceived the research. P.S. and L.C. collected data and performed data analysis. P.S. wrote the original manuscript. Y.B., H.Y. and L.Y. revised the manuscript. All authors have read and agreed to the published version of the manuscript.

Funding

This work was supported by the National Natural Science Foundation of China (grant number: 32070246).

Data Availability Statement

The raw transcriptome data of 24 Ficus have been deposited in FGD.

Acknowledgments

The authors would like to express their sincere gratitude to Jinghong Wei, Han Su, and all other colleagues who contributed to this research. We also thank all those who provided technical support and constructive feedback throughout the study.

Conflicts of Interest

The authors declare no conflicts of interest.

References

  1. Bain, A.; Tzeng, H.Y.; Wu, W.J.; Chou, L.S. Ficus (Moraceae) and fig wasps (Hymenoptera: Chalcidoidea) in Taiwan. Bot. Stud. 2015, 56, 11. [Google Scholar] [CrossRef] [PubMed]
  2. Barolo, M.I.; Ruiz Mostacero, N.; Lopez, S.N. Ficus carica L. (Moraceae): An ancient source of food and health. Food Chem. 2014, 164, 119–127. [Google Scholar] [CrossRef] [PubMed]
  3. Deepa, P.; Sowndhararajan, K.; Kim, S.; Park, S.J. A role of Ficus species in the management of diabetes mellitus: A review. J. Ethnopharmacol. 2018, 215, 210–232. [Google Scholar] [CrossRef] [PubMed]
  4. Mori, K.; Shirasawa, K.; Nogata, H.; Hirata, C.; Tashiro, K.; Habu, T.; Kim, S.; Himeno, S.; Kuhara, S.; Ikegami, H. Identification of RAN1 orthologue associated with sex determination through whole genome sequencing analysis in fig (Ficus carica L.). Sci. Rep. 2017, 7, 41124. [Google Scholar] [CrossRef] [PubMed]
  5. Mawa, S.; Husain, K.; Jantan, I. Ficus carica L. (Moraceae): Phytochemistry, Traditional Uses and Biological Activities. Evid. Based Complement. Altern. Med. 2013, 2013, 974256. [Google Scholar] [CrossRef] [PubMed]
  6. Cruaud, A.; Ronsted, N.; Chantarasuwan, B.; Chou, L.S.; Clement, W.L.; Couloux, A.; Cousins, B.; Genson, G.; Harrison, R.D.; Hanson, P.E.; et al. An extreme case of plant-insect codiversification: Figs and fig-pollinating wasps. Syst. Biol. 2012, 61, 1029–1047. [Google Scholar] [CrossRef] [PubMed]
  7. Hu, R.; Sun, P.; Yu, H.; Cheng, Y.; Wang, R.; Chen, X.; Kjellberg, F. Similitudes and differences between two closely related Ficus species in the synthesis by the ostiole of odors attracting their host-specific pollinators: A transcriptomic based investigation. Acta Oecologica 2020, 105, 103554. [Google Scholar] [CrossRef]
  8. Hossaert-McKey, M.; Soler, C.; Schatz, B.; Proffit, M. Floral scents: Their roles in nursery pollination mutualisms. Chemoecology 2010, 20, 75–88. [Google Scholar] [CrossRef]
  9. Proffit, M.; Johnson, S.D. Specificity of the signal emitted by figs to attract their pollinating wasps: Comparison of volatile organic compounds emitted by receptive syconia of Ficus sur and F. sycomorus in Southern Africa. S. Afr. J. Bot. 2009, 75, 771–777. [Google Scholar] [CrossRef]
  10. Souza, C.D.; Pereira, R.A.S.; Marinho, C.R.; Kjellberg, F.; Teixeira, S.P. Diversity of fig glands is associated with nursery mutualism in fig trees. Am. J. Bot. 2015, 102, 1564–1577. [Google Scholar] [CrossRef]
  11. Salehi, B.; Prakash Mishra, A.; Nigam, M.; Karazhan, N.; Shukla, I.; Kieltyka-Dadasiewicz, A.; Sawicka, B.; Glowacka, A.; Abu-Darwish, M.S.; Hussein Tarawneh, A.; et al. Ficus plants: State of the art from a phytochemical, pharmacological, and toxicological perspective. Phytother. Res. 2021, 35, 1187–1217. [Google Scholar] [CrossRef] [PubMed]
  12. Jung, S.; Lee, T.; Cheng, C.H.; Buble, K.; Zheng, P.; Yu, J.; Humann, J.; Ficklin, S.P.; Gasic, K.; Scott, K.; et al. 15 years of GDR: New data and functionality in the Genome Database for Rosaceae. Nucleic Acids Res. 2019, 47, D1137–D1145. [Google Scholar] [CrossRef] [PubMed]
  13. Humann, J.L.; Cheng, C.H.; Lee, T.; Buble, K.; Jung, S.; Yu, J.; Zheng, P.; Hough, H.; Crabb, J.; Frank, M.; et al. Using the Genome Database for Vaccinium for genetics, genomics, and breeding research. In Proceedings of the XII International Vaccinium Symposium 1357, Debert, NS, Canada, 30 August–1 September 2021; ISHS: Bierbeek, Belgium, 2023; pp. 115–122. [Google Scholar]
  14. Yu, J.; Jung, S.; Cheng, C.H.; Ficklin, S.P.; Lee, T.; Zheng, P.; Jones, D.; Percy, R.G.; Main, D. CottonGen: A genomics, genetics and breeding database for cotton research. Nucleic Acids Res. 2014, 42, D1229–D1236. [Google Scholar] [CrossRef] [PubMed]
  15. Yu, J.; Wu, S.; Sun, H.; Wang, X.; Tang, X.; Guo, S.; Zhang, Z.; Huang, S.; Xu, Y.; Weng, Y.; et al. CuGenDBv2: An updated database for cucurbit genomics. Nucleic Acids Res. 2023, 51, D1457–D1464. [Google Scholar] [CrossRef] [PubMed]
  16. Yu, J.; Jung, S.; Cheng, C.-H.; Lee, T.; Zheng, P.; Buble, K.; Crabb, J.; Humann, J.; Hough, H.; Jones, D.; et al. CottonGen: The Community Database for Cotton Genomics, Genetics, and Breeding Research. Plants 2021, 10, 2805. [Google Scholar] [CrossRef]
  17. Chen, B.; Yu, T.; Xie, S.; Du, K.; Liang, X.; Lan, Y.; Sun, C.; Lu, X.; Shao, Y. Comparative shotgun metagenomic data of the silkworm Bombyx mori gut microbiome. Sci. Data 2018, 5, 180285. [Google Scholar] [CrossRef]
  18. Joshi, P.; Banerjee, S.; Hu, X.; Khade, P.M.; Friedberg, I. GOThresher: A program to remove annotation biases from protein function annotation datasets. Bioinformatics 2023, 39, btad048. [Google Scholar] [CrossRef]
  19. Conesa, A.; Gotz, S. Blast2GO: A comprehensive suite for functional analysis in plant genomics. Int. J. Plant Genom. 2008, 2008, 619832. [Google Scholar] [CrossRef]
  20. Feng, Y.; Zou, S.; Chen, H.; Yu, Y.; Ruan, Z. BacWGSTdb 2.0: A one-stop repository for bacterial whole-genome sequence typing and source tracking. Nucleic Acids Res. 2021, 49, D644–D650. [Google Scholar] [CrossRef]
  21. Sun, P.; Chen, X.; Chantarasuwan, B.; Zhu, X.; Deng, X.; Bao, Y.; Yu, H. Composition Diversity and Expression Specificity of the TPS Gene Family among 24 Ficus Species. Diversity 2022, 14, 721. [Google Scholar] [CrossRef]
  22. Liyanage, N.M.N.; Chandrasekara, B.; Bandaranayake, P.C.G. A CTAB protocol for obtaining high-quality total RNA from cinnamon (Cinnamomum zeylanicum Blume). 3 Biotech 2021, 11, 201. [Google Scholar] [CrossRef] [PubMed]
  23. Grabherr, M.G.; Haas, B.J.; Yassour, M.; Levin, J.Z.; Thompson, D.A.; Amit, I.; Adiconis, X.; Fan, L.; Raychowdhury, R.; Zeng, Q.; et al. Full-length transcriptome assembly from RNA-Seq data without a reference genome. Nat. Biotechnol. 2011, 29, 644–652. [Google Scholar] [CrossRef] [PubMed]
  24. Haas, B.J.; Papanicolaou, A.; Yassour, M.; Grabherr, M.; Blood, P.D.; Bowden, J.; Couger, M.B.; Eccles, D.; Li, B.; Lieber, M.; et al. De novo transcript sequence reconstruction from RNA-seq using the Trinity platform for reference generation and analysis. Nat. Protoc. 2013, 8, 1494–1512. [Google Scholar] [CrossRef] [PubMed]
  25. Wang, Y.; Tang, H.; Debarry, J.D.; Tan, X.; Li, J.; Wang, X.; Lee, T.H.; Jin, H.; Marler, B.; Guo, H.; et al. MCScanX: A toolkit for detection and evolutionary analysis of gene synteny and collinearity. Nucleic Acids Res. 2012, 40, e49. [Google Scholar] [CrossRef] [PubMed]
  26. Kim, D.; Langmead, B.; Salzberg, S.L. HISAT: A fast spliced aligner with low memory requirements. Nat. Methods 2015, 12, 357–360. [Google Scholar] [CrossRef]
  27. You, Q.; Xu, W.; Zhang, K.; Zhang, L.; Yi, X.; Yao, D.; Wang, C.; Zhang, X.; Zhao, X.; Provart, N.J.; et al. ccNET: Database of co-expression networks with functional modules for diploid and polyploid Gossypium. Nucleic Acids Res. 2017, 45, D1090–D1099. [Google Scholar] [CrossRef] [PubMed]
  28. Brown, J.; Pirrung, M.; McCue, L.A. FQC Dashboard: Integrates FastQC results into a web-based, interactive, and extensible FASTQ quality control tool. Bioinformatics 2017, 33, 3137–3139. [Google Scholar] [CrossRef] [PubMed]
  29. Sewe, S.O.; Silva, G.; Sicat, P.; Seal, S.E.; Visendi, P. Trimming and Validation of Illumina Short Reads Using Trimmomatic, Trinity Assembly, and Assessment of RNA-Seq Data. Methods Mol. Biol. 2022, 2443, 211–232. [Google Scholar] [CrossRef]
  30. Pertea, M.; Kim, D.; Pertea, G.M.; Leek, J.T.; Salzberg, S.L. Transcript-level expression analysis of RNA-seq experiments with HISAT, StringTie and Ballgown. Nat. Protoc. 2016, 11, 1650–1667. [Google Scholar] [CrossRef]
  31. Chan, P.P.; Lin, B.Y.; Mak, A.J.; Lowe, T.M. tRNAscan-SE 2.0: Improved detection and functional classification of transfer RNA genes. Nucleic Acids Res. 2021, 49, 9077–9096. [Google Scholar] [CrossRef]
  32. Tang, H.; Saina, J.K.; Long, Z.C.; Chen, J.; Dai, C. De novo transcriptome assembly using Illumina sequencing and development of EST-SSR markers in a monoecious herb Sagittaria trifolia Linn. PeerJ 2022, 10, e14268. [Google Scholar] [CrossRef] [PubMed]
  33. Beier, S.; Thiel, T.; Munch, T.; Scholz, U.; Mascher, M. MISA-web: A web server for microsatellite prediction. Bioinformatics 2017, 33, 2583–2585. [Google Scholar] [CrossRef]
  34. Caspi, R.; Altman, T.; Billington, R.; Dreher, K.; Foerster, H.; Fulcher, C.A.; Holland, T.A.; Keseler, I.M.; Kothari, A.; Kubo, A.; et al. The MetaCyc database of metabolic pathways and enzymes and the BioCyc collection of Pathway/Genome Databases. Nucleic Acids Res. 2014, 42, D459–D471. [Google Scholar] [CrossRef] [PubMed]
  35. Langmead, B.; Salzberg, S.L. Fast gapped-read alignment with Bowtie 2. Nat. Methods 2012, 9, 357–359. [Google Scholar] [CrossRef]
  36. Papanicolaou, A.; Heckel, D.G. The GMOD Drupal Bioinformatic Server Framework. Bioinformatics 2010, 26, 3119–3124. [Google Scholar] [CrossRef] [PubMed]
  37. Chen, M.; Henry, N.; Almsaeed, A.; Zhou, X.; Wegrzyn, J.; Ficklin, S.; Staton, M. New extension software modules to enhance searching and display of transcriptome data in Tripal databases. Database 2017, 2017, bax052. [Google Scholar] [CrossRef]
  38. Yue, J.; Liu, J.; Tang, W.; Wu, Y.Q.; Tang, X.; Li, W.; Yang, Y.; Wang, L.; Huang, S.; Fang, C.; et al. Kiwifruit Genome Database (KGD): A comprehensive resource for kiwifruit genomics. Hortic. Res. 2020, 7, 117. [Google Scholar] [CrossRef]
  39. Elsik, C.G.; Tayal, A.; Diesh, C.M.; Unni, D.R.; Emery, M.L.; Nguyen, H.N.; Hagen, D.E. Hymenoptera Genome Database: Integrating genome annotations in HymenopteraMine. Nucleic Acids Res. 2016, 44, D793–D800. [Google Scholar] [CrossRef] [PubMed]
  40. Buble, K.; Jung, S.; Humann, J.L.; Yu, J.; Cheng, C.H.; Lee, T.; Ficklin, S.P.; Hough, H.; Condon, B.; Staton, M.E.; et al. Tripal MapViewer: A tool for interactive visualization and comparison of genetic maps. Database 2019, 2019, baz100. [Google Scholar] [CrossRef]
  41. Jung, S.; Cheng, C.H.; Buble, K.; Lee, T.; Humann, J.; Yu, J.; Crabb, J.; Hough, H.; Main, D. Tripal MegaSearch: A tool for interactive and customizable query and download of big data. Database 2021, 2021, baab023. [Google Scholar] [CrossRef]
  42. Youens-Clark, K.; Faga, B.; Yap, I.V.; Stein, L.; Ware, D. CMap 1.01: A comparative mapping application for the Internet. Bioinformatics 2009, 25, 3040–3042. [Google Scholar] [CrossRef] [PubMed]
  43. Liu, N.; Zhang, L.; Zhou, Y.; Tu, M.; Wu, Z.; Gui, D.; Ma, Y.; Wang, J.; Zhang, C. The Rhododendron Plant Genome Database (RPGD): A comprehensive online omics database for Rhododendron. BMC Genom. 2021, 22, 376. [Google Scholar] [CrossRef] [PubMed]
  44. Sanderson, L.A.; Ficklin, S.P.; Cheng, C.H.; Jung, S.; Feltus, F.A.; Bett, K.E.; Main, D. Tripal v1.1: A standards-based toolkit for construction of online genetic and genomic databases. Database 2013, 2013, bat075. [Google Scholar] [CrossRef] [PubMed]
  45. Gui, S.; Yang, L.; Li, J.; Luo, J.; Xu, X.; Yuan, J.; Chen, L.; Li, W.; Yang, X.; Wu, S.; et al. ZEAMAP, a Comprehensive Database Adapted to the Maize Multi-Omics Era. iScience 2020, 23, 101241. [Google Scholar] [CrossRef]
  46. Memczak, S.; Jens, M.; Elefsinioti, A.; Torti, F.; Krueger, J.; Rybak, A.; Maier, L.; Mackowiak, S.D.; Gregersen, L.H.; Munschauer, M.; et al. Circular RNAs are a large class of animal RNAs with regulatory potency. Nature 2013, 495, 333–338. [Google Scholar] [CrossRef]
Figure 1. FGD database organization and architecture. (A) Collection and preprocessing of genomic, transcriptomic, and related data. (B) Data formatting and indexing and import into Chado database. (C) FGD menu framework and primary functions.
Horticulturae 10 00613 g001
Figure 2. Search, JBrowse, and GBrowse browser functions of the FGD database website. (A) Gene page for FE01Gene00030, displaying gene details and chromosomal location information. (B) Ability to perform batch searches for multiple genes based on their location using Sequence Search feature. (C) Use of FGD Blast+ tool for cross-species BLAST searches using sequence information of FE01Gene00030. (D) Identification of protein sequences homologous to FE01Gene00030 in Ficus pumila. (E) Exploration of gene structure and BAM expression data for FE01Gene00030 using JBrowse browser, based on location information. (F) Access to detailed gene sequence information, including UTR and CDS regions. (G) Discovery of SSRs and tRNA in vicinity of the gene using GBrowse browser. (H) Detailed information on tRNA. (I) Detailed information on SSR.
Horticulturae 10 00613 g002
Figure 3. The Tripal expression and syntenic viewer function module of the FGD database. (A) The Tripal expression module can dynamically generate the expression heatmap according to the input sequence name and download the image and the original expression data online. (B) The Synteny Viewer module can generate collinear graphs between different chromosomes and scaffolds. Users can click the collinear bands to obtain the specific homologous gene pairs and even the specific sequence position information of each gene.
Horticulturae 10 00613 g003
Figure 4. An analysis module of Pathway Enrichment and the biochemical pathway module in FGD database. (A) After selecting the background genome, users can input the sequence name to be analyzed in the text input box (or upload the file), set the p-value parameter, and then submit. (B) Enrichment analysis results were obtained (table on webpage). (C) ko03060 KEGG pathway diagram was rendered by the Pathview package inherited in the “Pathway Enrichment” module of FGD. (D) A metabolic pathway map for linalool synthesis in the PGDB metabolic pathway database.
Horticulturae 10 00613 g004
Table 1. Numbers of FGD entries by data type (until 10 April 2024).
Data TypeEntries No.Details
 Species26 Origin, genome group, germplasm, sequences and libraries, specific species pages with hyperlinks to various data and tools.
 Genome5 Whole genome assemblies and annotations from five Ficus *.
 Transcriptome24 Ositolar bracts transcriptome assemblies from 24 Ficus receptive figs **.
 Unigenes702,402 All assembled unigenes from 24 Ficus transcriptome.
 Gene and mRNA171,752 genes and 171,867 mRNAs Genes and mRNAs from five Ficus * whole genome assemblies and parsed from NCBI nucleotide sequences.
 Annotations5 Nr and Swissprot, 1 Interpro Annotated to Nr and Swissprot for five Ficus *, Interpro Annotation for F. erecta var. erecta, imported into the Chado database.
 SRA project3 PRJNA623468, PRJNA397979, PRJDB8644 Project of SRA database.
 Syntenic blocks425,439 425,439 homologous gene pairs of five Ficus * genomes.
 tRNA3526 tRNA for five Ficus * species.
 SSRs563,787 Simple Sequence Repeats (SSRs) for five Ficus * species.
* The five Ficus are designated as F. carica L., F. erecta var. erecta, F. hispida L.f., F. microcarpa L.f. and F. pumia var. pumila, respectively. ** Twenty-four species of Ficus were collected from South China and Southeast Asia, as detailed in Figure S1.
Table 2. Statistics for genome assembly and database data number of 5 Ficus species in FGD.
SpeciesGenome
Version
Assembled Size (Mb)PloidyScaffold N50 Busco V5 (%)Gene
No.
mRNA
No.
Protein
No.
SRA Project
F. carica L.V1247.12n = 2x = 26166.1 kb95.136,10736,11536,115PRJNA623468
PRJNA397979
F. erecta var. erectaV201909595.82n = 2x = 26/94.651,80151,82651,826PRJDB8644
F. hispida L.f.V202209369.82n = 2x = 2824.1 Mb97.227,20727,24727,247/
F. microcarpa L.f. V202209426.62n = 2x = 2629.3 Mb94.828,45328,47828,478/
F. pumila var. pumilaV202105315.72n = 2x = 262.3 Mb96.628,18428,20128,201/
Disclaimer/Publisher’s Note: The statements, opinions and data contained in all publications are solely those of the individual author(s) and contributor(s) and not of MDPI and/or the editor(s). MDPI and/or the editor(s) disclaim responsibility for any injury to people or property resulting from any ideas, methods, instructions or products referred to in the content.

