Article

Transcriptomic Analysis Reveals Dynamic Changes in Glutathione and Ascorbic Acid Content in Mango Pulp across Growth and Development Stages

1
School of Breeding and Multiplication (Sanya Institute of Breeding and Multiplication), School of Tropical Agriculture and Forestry, Hainan University, Sanya 572025, China
2
School of Tropical Agriculture and Forestry, Hainan University, Haikou 570228, China
3
College of Ecology and Environment, Hainan University, Haikou 570228, China
*
Author to whom correspondence should be addressed.
These authors contributed equally to this work.
Horticulturae 2024, 10(7), 694; https://doi.org/10.3390/horticulturae10070694
Submission received: 24 May 2024 / Revised: 22 June 2024 / Accepted: 27 June 2024 / Published: 1 July 2024
(This article belongs to the Section Genetics, Genomics, Breeding, and Biotechnology (G2B2))

Abstract

:
Mango (Mangifera indica) is a highly valuable horticultural crop known for its quality and productivity. This study investigates the dynamic changes in physicochemical properties and glutathione and ascorbic acid metabolic pathways in mango pulp across various growth and development stages over two consecutive years (2021–2022 and 2022–2023) by transcriptomic analysis. Overall, the results demonstrate that during different ripening periods, the pulp shows increased levels of total soluble solids, relative conductivity, glutathione, and enzymes, while titratable acidity, malondialdehyde, reactive oxygen species, and ascorbic acid contents decreased. Moreover, transcriptomic analysis identified key differentially expressed genes from the glutathione and ascorbic acid metabolic pathways and validated them with qRT-PCR. In different comparisons, a total of 1776, 2513, and 828 DEGs were identified in 30 vs. 60, 30 vs. 90, and 60 vs. 90 days after flowering, respectively. Among them, seven DEGs were primarily enriched in relevant pathways, which included ascorbate peroxidase, ascorbate oxidase, glutathione peroxidase, gamma-glutamyl transferase, glutathione transferases, and glucose-6-phosphate dehydrogenase. The upregulation of these genes indicates that glutathione and AsA respond well to scavenging reactive oxygen species and maintain normal functioning in plants. This research sheds light on the molecular mechanisms of glutathione and ascorbic acid dynamic changes in mango pulp, providing valuable insights into the regulation of antioxidant and metabolic pathways during fruit growth and development.

1. Introduction

Mango (Mangifera indica), known as the “king of tropical fruits”, is a significant tropical cash crop of the Anacardiaceae family, ranking fifth globally among fruits and is nutritionally rich with proteins, carbohydrates, organic acids, lipids, vitamins, and bioactive compounds [1,2]. It is consumed fresh and also processed into various products, including nectar, juice, jellies, jam, and powder [3]. China is the world’s second-largest producer of mangoes, and the main growing regions are Hainan, Guangxi, Yunnan, and Sichuan [4]. Mango has a domestication history spanning over 4000 years in the Indo-Burmese and Southeast Asia regions and has been spreading globally since the fourteenth century [5]. Despite abiotic and biotic challenges, its cultivation is a vital source of income due to its texture, delightful taste, nutritional profile, shape, and exceptional flavor [6]. It is rich with essential nutrients, including minerals, vitamins, carotenoids, flavonoids, fibers, and exhibits a climacteric ripening pattern, and holds substantial commercial values [7]. In addition to its fresh consumption, the mango processing industry generates waste materials such as peels and seeds [8].
Fruit senescence is closely linked to the accumulation of reactive oxygen species (ROS) [9]. During ripening, oxidative stress increases, leading to the buildup of hydrogen peroxide (H2O2) [10] in fruits like peaches, tomatoes, and grape berries as their skin color changes, acting as positive signals for development, maturation and ripening [11]. The glutathione (GSH) pathway is vital in scavenging ROS and protecting plant cells from oxidative damage [12]. GSH enhances antioxidant capacity in strawberries and protects loquat fruit against chilling stress [13]. The ascorbate-glutathione cycle also scavenges H2O2 using ascorbic acid (AsA) and GSH, along with enzymes like ascorbate peroxidase (APX), ascorbate oxidase (AO), glutathione-S-transferase (GST), and glutathione peroxidase (GPX). AsA, an important water-soluble antioxidant, helps reduce chilling injury in loquat and mango fruits [14,15]. Its levels can vary with genetics, cultivation practices, and environmental conditions, with organic and shade-grown methods yielding higher AsA levels. ROS peaks occur at the onset of ripening and overripening, and higher APX, activity in peaches under oxidative stress [16,17].
ROS plays a crucial role in regulating fruit ripening processes. Maintaining a balance between ROS production and antioxidant capacity is essential; moderate ROS facilitates ripening, while excessive levels cause oxidative damage and accelerate overripening [18]. Fruit ripening involves alterations in ROS homeostasis, including superoxide ion (O2−), hydroxyl radical (OH), and H2O2 [19]. Antioxidant enzymes like APX and non-enzymatic antioxidants such as AsA and GSH are involved in ROS scavenging [20]. Recent progress has identified key genes involved in AsA metabolisms in fruit, such as PbrAPX8/10 and PbrAO3 in ‘Yali’ pear fruit [21]. Enzymes like G6PD produce NADPH needed for the AsA-GSH cycle, which is important for ROS scavenging [22]. Enzymes GPX and GST also play crucial roles in reducing H2O2 within plant tissues, converting reduced GSH to oxidized glutathione (GSSG), and protecting biological membranes from oxidative damage [23]. In Arabidopsis, the AtGPX8 gene protects cell components from oxidative damage [24]. Moreover, Kato and Esaka [25] suggested that AO potentially regulates cell expansion by influencing transport mechanisms across the plasma membrane. Additionally, the enzyme likely participates in stress responses by modulating ascorbic acid levels and altering cellular redox balance. This capability could enable plant cells to effectively sense environmental cues and respond accordingly, contributing significantly to stress management [26].
Transcriptome analysis is a powerful method for exploring functional genes and regulatory networks related to plant stress tolerance, providing comprehensive transcriptional information at specific developmental stages or under various physiological conditions [27]. This identified numerous genes related to flowering and fruiting in Vaccinium ashei [28], elucidated the molecular mechanisms of fruit ripening in Pyrus bretschneideri [29], and been applied to other fruit trees such as Prunus armeniaca and Rosa roxburghii [30,31]. However, systematic analysis and determination of GSH and AsA pathways have not been reported well. Therefore, this study used transcriptome sequencing technology to analyze samples from different stages of fruit growth and development of mango. This study examines the accumulation of GSH and AsA during different growth stages concerning ROS damage in mango pulp. It also evaluates how these stages affect pulp properties and the ripening process. The purpose is to enhance cultivation techniques and improve senescence resistance in mangoes and other crops.

2. Materials and Methods

2.1. Material and Experiment Site

Mango (15-year-old) “Tainong 1” orchard with vigorous growth and robustness grafted on “Changjiang Tumang” rootstock located in Shengchang village, Haitang District, Sanya city, Hainan province (18°25′ N 109°46′ E) were selected as experimental materials. This region experiences an average annual precipitation of approximately 1700 mm and an average temperature of around 25 °C, with the garden soil being brick-red sandy. Production period adjustment technology was applied in late July to ensure mango availability during the Chinese spring festival. The main phenological stages (2021–2022) were as follows: flower bud differentiation (August–September), flower bud emergence (early October), flowering (mid to late October), physiological flower and fruit drop (early to mid-November), fruit expansion (December–January of the following year), and fruit harvest (early to mid-February). Each phenological stage was advanced by one month in the subsequent year (2022–2023).
Sampling occurred every ten days during these periods, with five healthy, uniformly sized fruits from the middle canopy periphery of a single tree plot serving as biological repeats with five replicates at each interval. In 2021, samples were taken 30 days after flowering (DAF) (18 December) to 90 DAF (17 February 2022). To align with actual production needs for the Spring festival in the following year, sampling was adjusted to 40 DAF (1 December 2022) to 90 DAF (21 January 2023), with samples taken every ten days over seven and six times, respectively. After sampling, the fruits were peeled, cut into small pieces, and immediately placed in liquid nitrogen, then stored at −80 °C for future analysis.

2.2. Fruit Ripening Index

Total soluble solids (TSS) and titratable acidity (TA) were measured using a digital refractometer (RX 5000, ATAGO, Tokyo Tech, Minato City, Japan). The prism was cleaned with ethanol, juice was applied, and the lid closed. Readings were taken in Brix (°Brix) at room temperature [32] The TSS/TA ratio was calculated by dividing the TSS value by the percentage of TA (°Brix ÷ %Acid).

2.3. Lipid Peroxidation

Lipid peroxidation levels were assessed using the quantification of malondialdehyde (MDA) content [33]. The 1.0 g sample was ground in 5% trichloroacetic acid (TCA), centrifuged, and supernatants were mixed with equal volumes of 5% TCA containing 0.67% thiobarbituric acid. After heating and cooling, absorbance was measured, and MDA content was calculated as MDA = [6.45 (OD532 − OD600) − 0.560 × OD450], expressed as mol·kg−1 fresh weight.

2.4. Ion Leakage

Ion leakage was assessed according to the method of Khaliq et al. [34] with minor adjustments. The 5.0 g sample was placed in a glass tube containing 25 mL of deionized water and shaken at 1.7 s−1 for 30 min at 24 °C. Conductivity was measured using a DDS-11A conductivity meter (Shanghai, China). Subsequently, the glass tube was heated at 98 °C for 15 min in boiling water. After cooling, conductivity was measured again. Ion leakage was determined using the formula. RC was calculated as RC = S1/S2 × 100%.

2.5. ROS Ascertainment

Hydrogen peroxide (H2O2), hydroxyl ion (OH), and superoxide anion (O2) contents were determined by kit (Catalog No. ADS-W-YH001, ADS-W-KY006, ADS-W-YH008, Jiangsu Kete Biotechnology Co., Ltd., Yancheng, China).

2.6. Glutathione Content

The glutathione content was quantified using the GSH measurement kit (GSH-1-W, Suzhou Keming Biotechnology Co., Ltd., Suzhou, China). The 0.2 g frozen samples were processed according to the kit’s prescribed protocol. UV absorbance (A1) at 412 nm was recorded relative to the absorbance of the blank solution (A2), with the difference denoted as ΔA (ΔA = A2 − A1) for each sample. The GSH content was then determined using the formula (mol·g−1) = 0.667 × (A2 − A1)/W, where W represents the weight of the sample.

2.7. AsA Content

According to the method of Rao and Deshpande, the 2,6-dichlorophenol indophenol (DCPIP) titration technique was used to determine the ascorbic acid content [35]. In a 100 mL conical flask, 5 mL of the ascorbic acid working standard (500 µg/5 mL) was mixed with 10 mL of 4% oxalic acid. This mixture was titrated with the dye solution until a faint pink color persisted (V1). Similarly, 5 mL of the test sample was titrated with the dye solution (V2).

2.8. Measurement of Enzymatic Activity

The 0.1 g sample was homogenized and then centrifuged at 8000× g at 4 °C for 10 min. The supernatant was removed and tested on ice. Glutathione peroxidase (GPX), gamma-glutamyl transferase (GGT), glutathione-S-transferase (GST), glucose-6-phosphate dehydrogenase (G6PD), ascorbate peroxidase (APX), and ascorbate oxidase (AO) enzymes were determined by kit (Catalog No. GT-2-W, GST-2-W, GPX-2-W, G6PDH-2-Y, APX-2-W, and AAO-2-W, respectively; Suzhou Keming Biotechnology Co., Ltd., Suzhou, China).

2.9. Transcriptome Sequencing

Three mango pulp samples (30, 60, and 90 DAF) were used for the transcriptome analysis. Each sample contains three biological replicates. The collected pulp samples were transferred to Shanghai Bioengineering Co., Ltd. (Shanghai, China) for Rna-seq of the generated cDNA library on the Illumina HiSeq platform. Trimmomatic data processing consisted of the following steps: The following steps were taken: removing sequences with N bases, removing the connector sequence from reads, removing low mass bases (Q < 20) from reads 3′ to 5′, using the sliding window method to remove bases with a mass value below 20 at the tail of reads (5 bp window size), and removing reads and paired reads that were less than 35 nt in length. Using HISAT2, the quality control sequence was compared with the reference genome (https://www.ncbi.nlm.nih.gov/genome/?term=mango (accessed on 26 June 2024)), and RSeQc was used to compare the findings statistically. DESeq2 was used to analyze the read count table for differential expression analysis. TPM ≥ 5 in one sample or group and q ≤ 0.05 and |log2 (fold change)| ≥ 1 were the differentially expressed gene (DEG) screening criteria [36].

2.10. qRT-PCR Analysis

Total RNA was isolated from fruit samples using the Trizol method, following standard manufacturer protocols. The concentration of RNA was assessed using a Nanodrop 2000 spectrophotometer (Thermo, Dreieich, Germany). To ensure RNA quality and purity, agarose gel electrophoresis was conducted. Subsequently, the RNA was reverse-transcribed into cDNA using a PCR machine (T100TM Thermal Cycler; BIORAD Inc., Hercules, CA, USA) and the HiScript II first-strand cDNA synthesis kit (Novizan Biotechnology Co., Ltd., Nanjing, China). For qRT-PCR analysis, the qTOWER3 QPCR system (Analytik Jena AG, Jena, Germany) and Tolo Biotech 2 × Q3 SYBR qPCR Master mix were utilized with 96-well plates, following the manufacturer’s instructions. Primers were designed using Primer Premier 6 software. The internal reference gene Actin was employed for normalization, and gene expression levels were quantified using the 2−ΔΔCt method [37] in Supplementary Table S1.

2.11. Statistical Analysis

The data were evaluated using the statistical software SAS 9.4 (SAS Institute Inc., Cary, NC, USA). A randomized complete block design (RCBD) was used in the study. One-way ANOVA was employed to analyze variance in the dynamic changes. Multiple comparisons at different time points were conducted using the Duncan method, and graphs were created using GraphPad Prism 8.0.1. The differential gene heatmap was drawn with TBtools-II software (v2.096) [38].

3. Results

3.1. Mango Pulp Physiochemical Responses

3.1.1. TSS, TA, and TSS/TA Ratio

Total soluble solids (TSS), titratable acidity (TA), and sugar–acid ratio notably influence mango fruit ripening. These parameters undergo dynamic changes during the ripening process over two years (2021–2022 and 2022–2023), in Figure 1a–c. During the first year (2021–2022), the TSS content exhibited notable fluctuations, and maximum TSS contents were detected, particularly between 30 and 70 DAF, compared to other time intervals. Conversely, in the second year (2022–2023), TSS content remained relatively stable initially but showed a significant increase between 80 and 90 DAF. Regarding TA content, a significant decrease was observed between 70 and 90 DAF in the first year, while in the second year, a gradual decline was noted from 40 to 60 DAF. The sugar–acid ratio displayed consistent trends during the early stages of both years. However, there was an evident increase in the sugar–acid ratio during the later stages in both years.

3.1.2. MDA and Relative Conductivity

The dynamic changes in malondialdehyde (MDA) and relative conductivity (RC) in mango pulp over two years are depicted in Figure 2a,b, respectively. During (2021–2022), the MDA content fluctuated, initially decreasing and rising from 30 to 70 DAF, followed by a subsequent decline. Conversely, in the subsequent year (2022–2023), there was an initial increase in MDA content, followed by a decline starting from 50 DAF, which eventually stabilized later. Regarding relative conductivity, in the (2021–2022) timeframe, a significant increase was observed from 30 to 40 DAF and remained stable during later stages. In contrast, during 2022–2023, relative conductivity was significantly increased from 40 to 90 DAF.

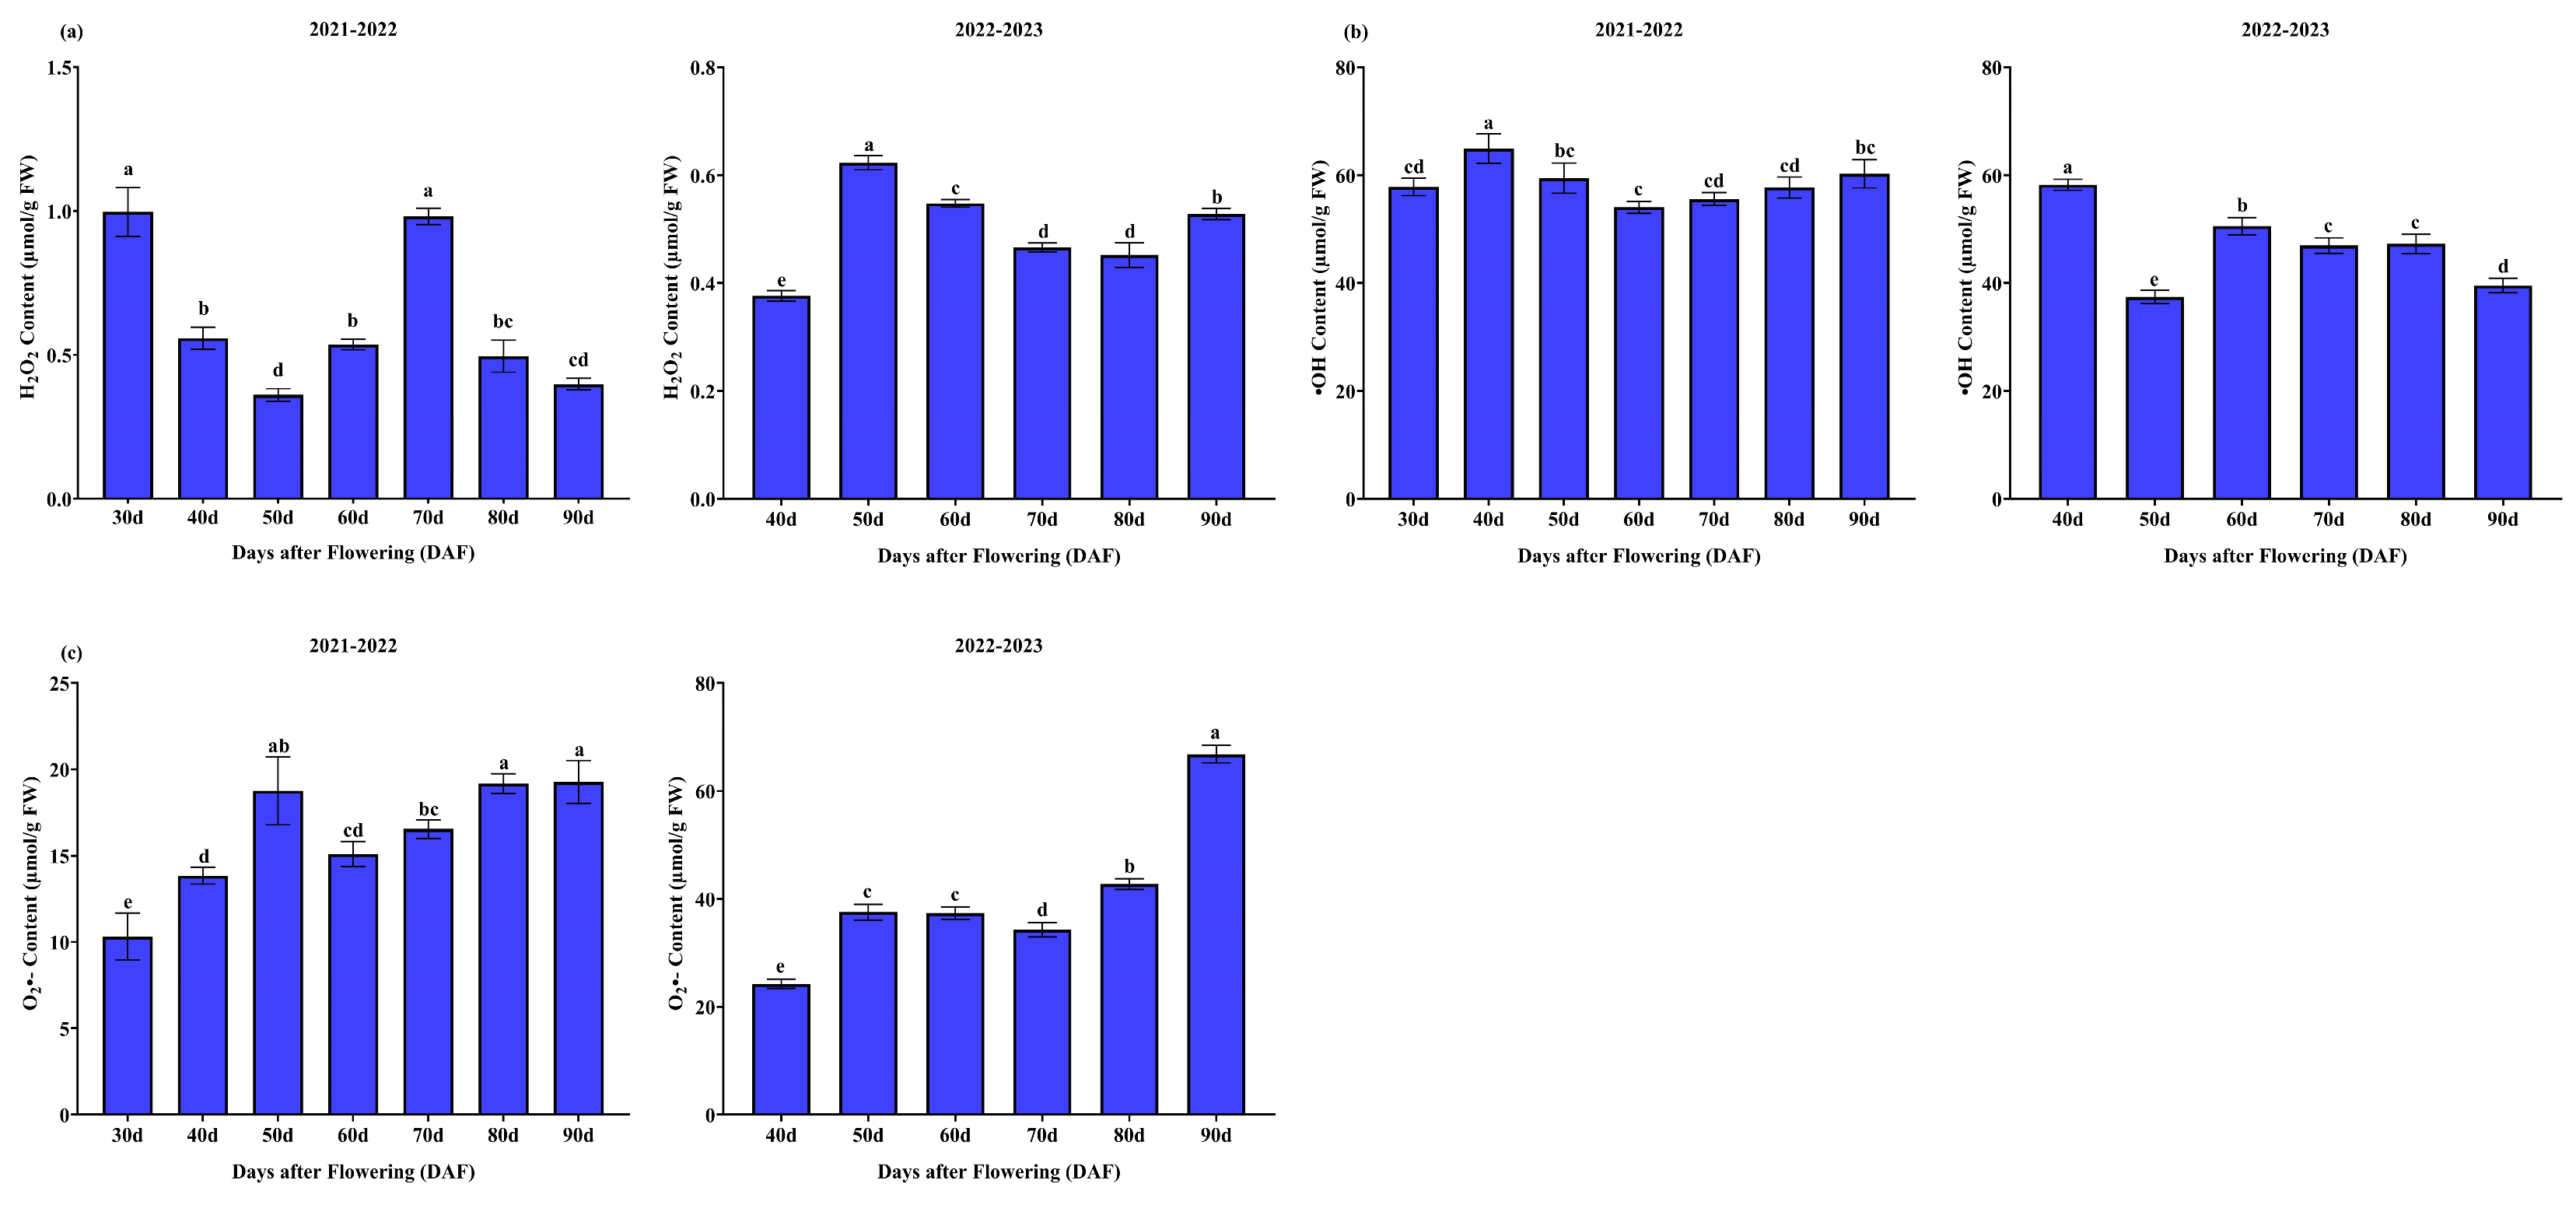
3.1.3. Reactive Oxygen Species

The variations in reactive oxygen species ROS levels within mango pulp over two consecutive years are depicted in Figure 3a–c. During the period of (2021–2022), there was a fluctuating pattern in the hydrogen peroxide (H2O2) content, with an initial decrease followed by a subsequent rise from 30 to 70 DAF, then decreased at later stages. Conversely, in the following year (2022–2023), the H2O2 content fluctuated from 40 to 90 DAF. Throughout (2021–2022), the hydroxyl radical (OH) content fluctuated between 30 and 50 DAF, and remained stable afterwards. Conversely, in the following period from (2022–2023), OH content showed a significant difference between 40 and 80 DAF and then decreased later. Furthermore, the superoxide anion (O2) content observed a distinct upward trend during both years.

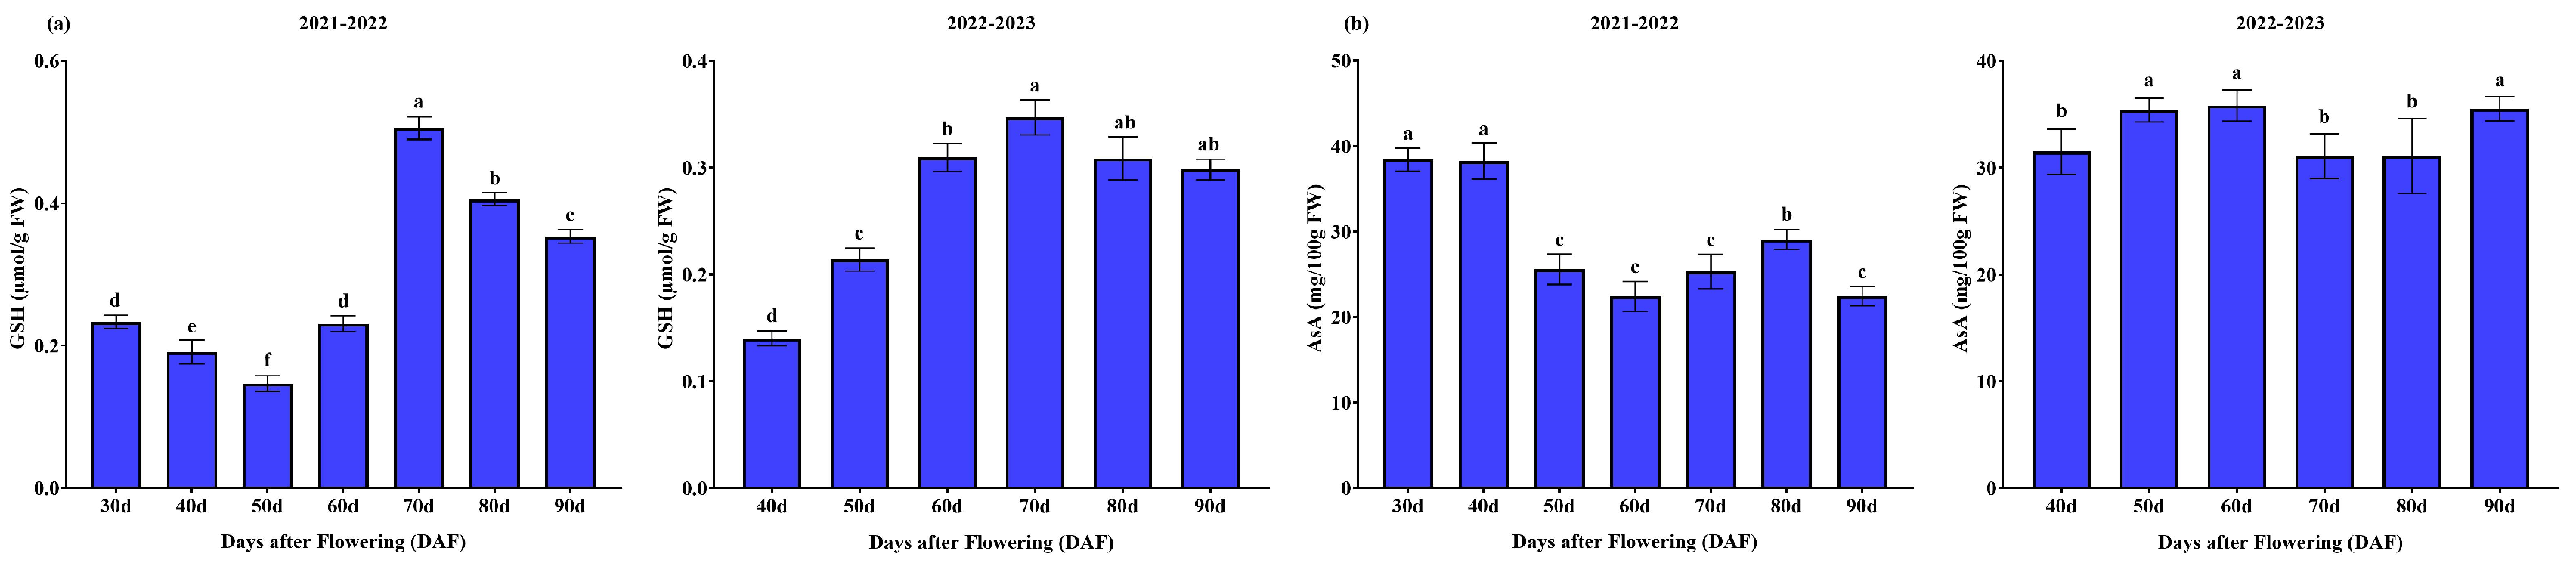
3.1.4. GSH and ASA Contents

The dynamic changes in glutathione (GSH) and ascorbic acid (AsA) levels in mango pulp over the two years are depicted in Figure 4a,b. In the first year, GSH content fluctuated from 30 to 70 DAF and then slightly decreased from 70 to 90 DAF. However, in the second year, there is a gradual increase throughout the period. During the first year, there was an overall decline in AsA content from 30 to 90 DAF. In contrast, the AsA content exhibited a fluctuating pattern of increase and decrease in the second year (2022–2023).

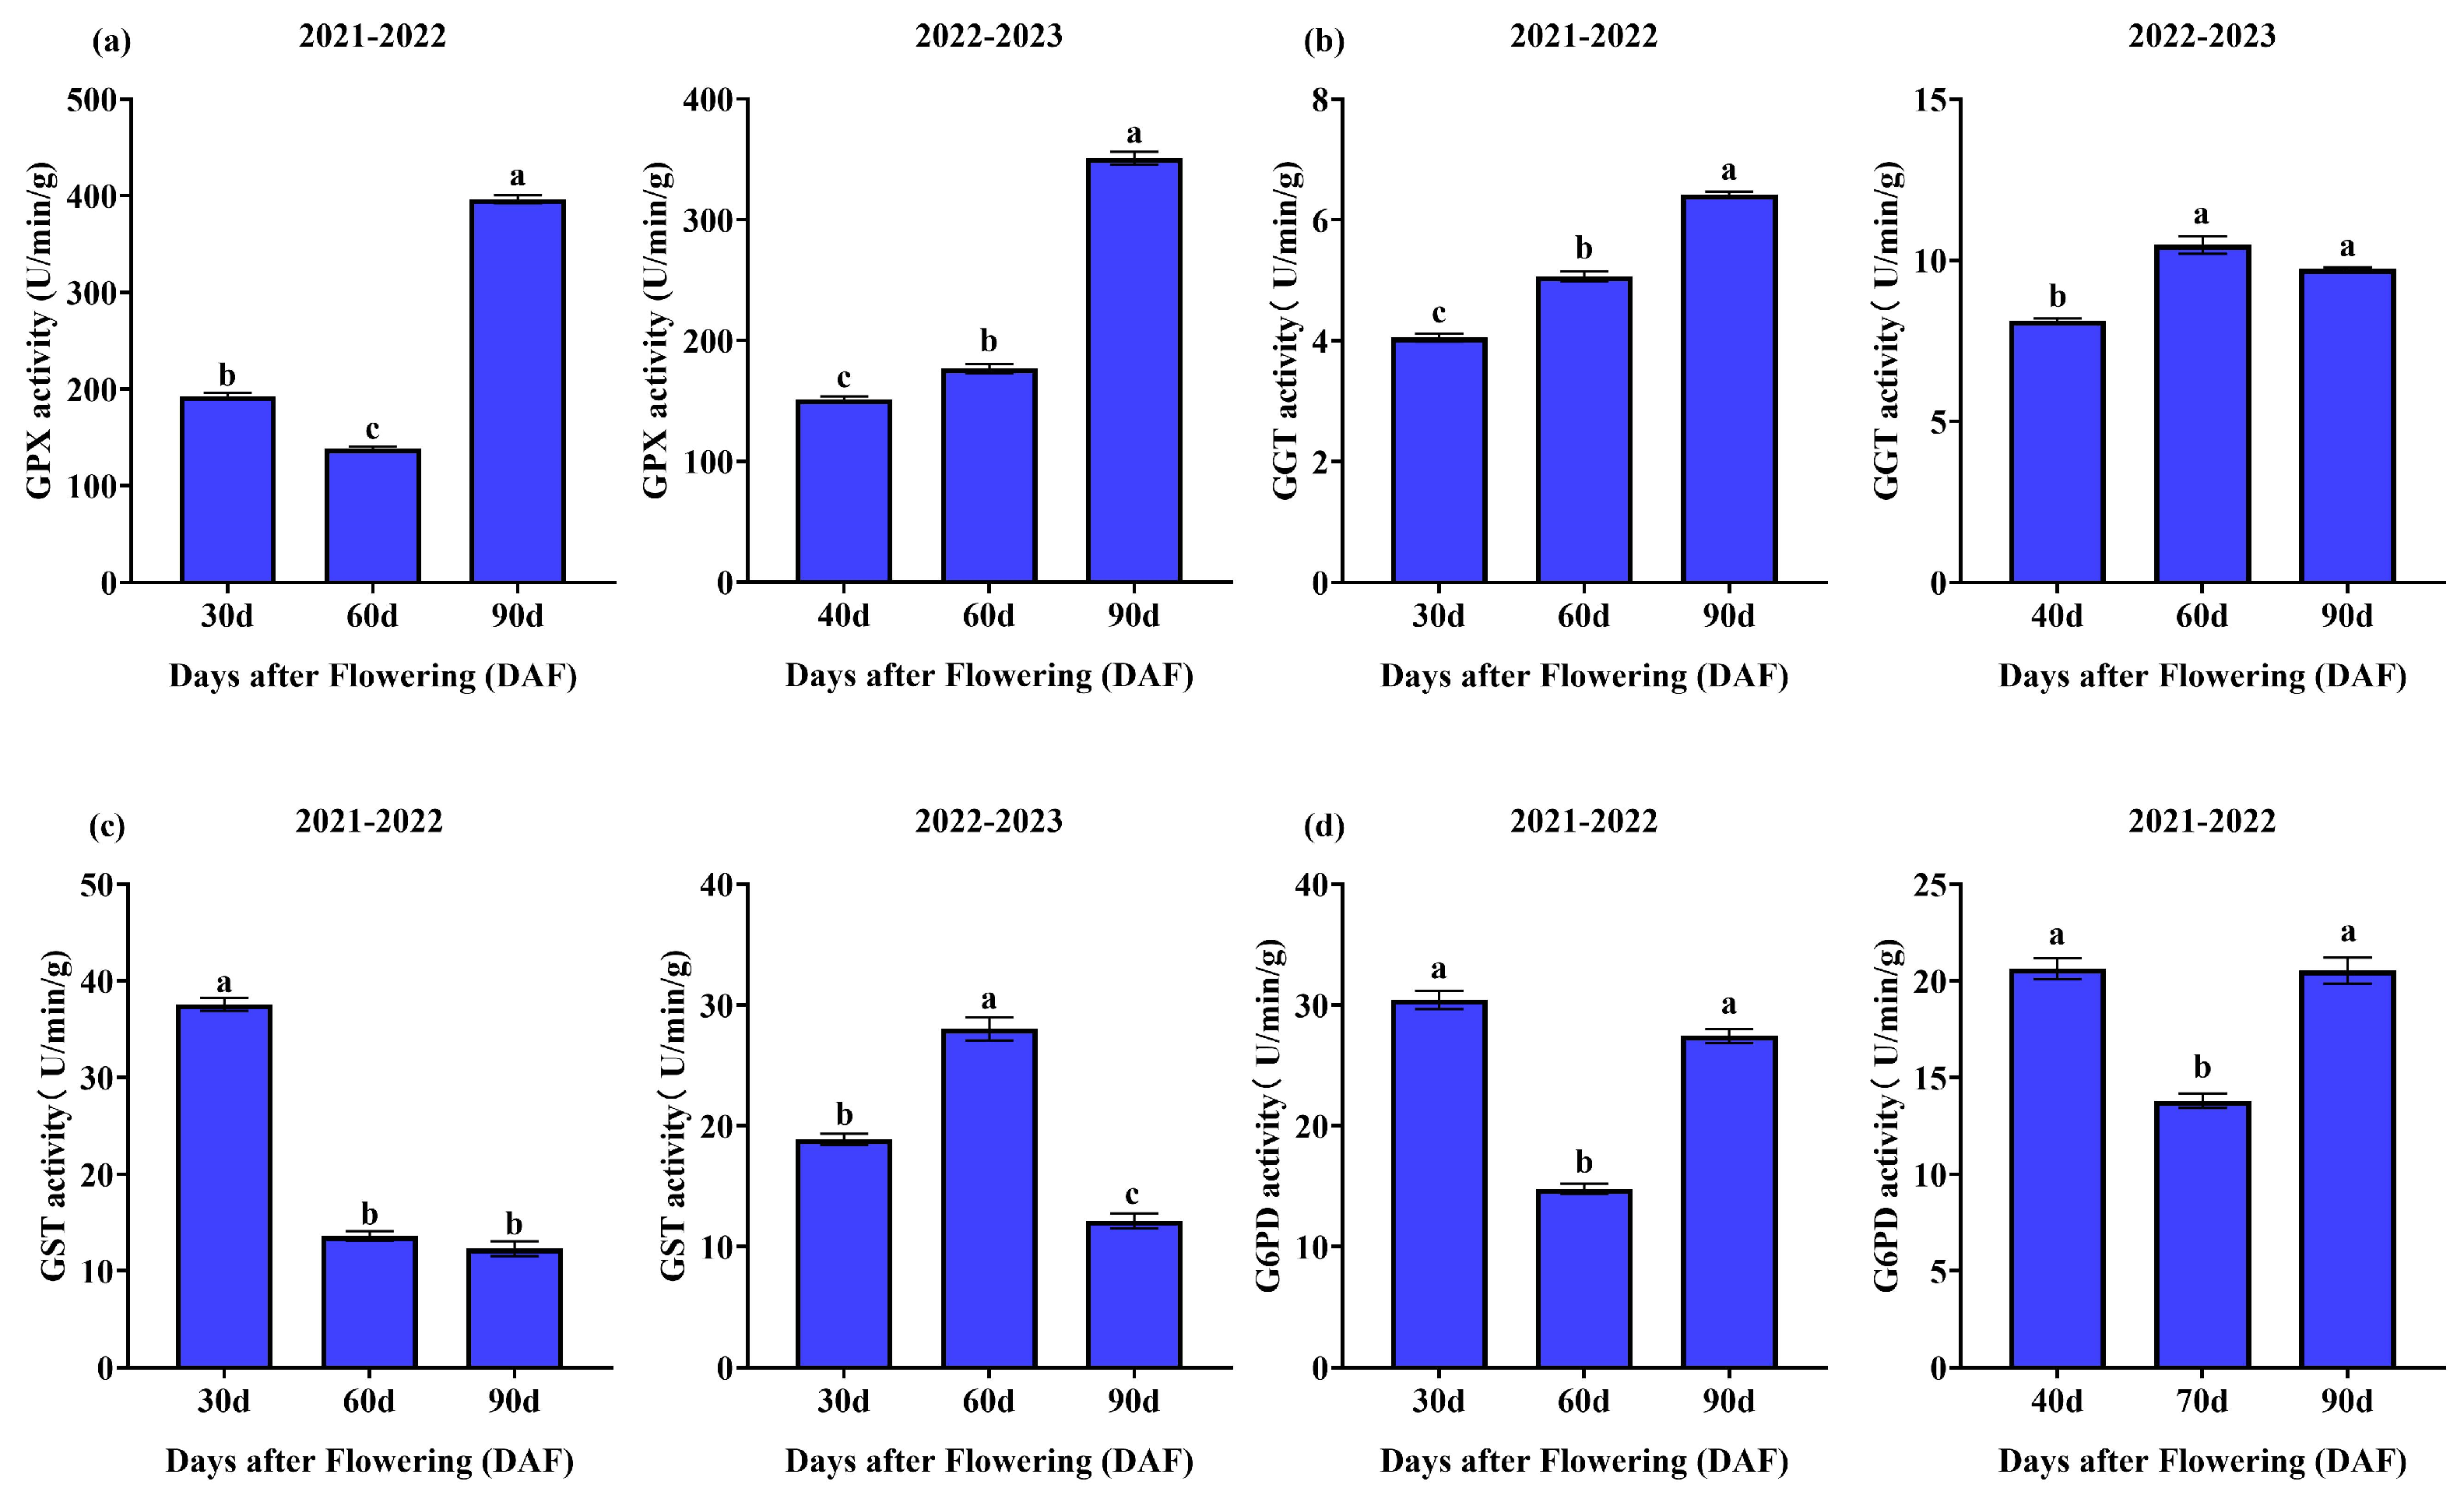
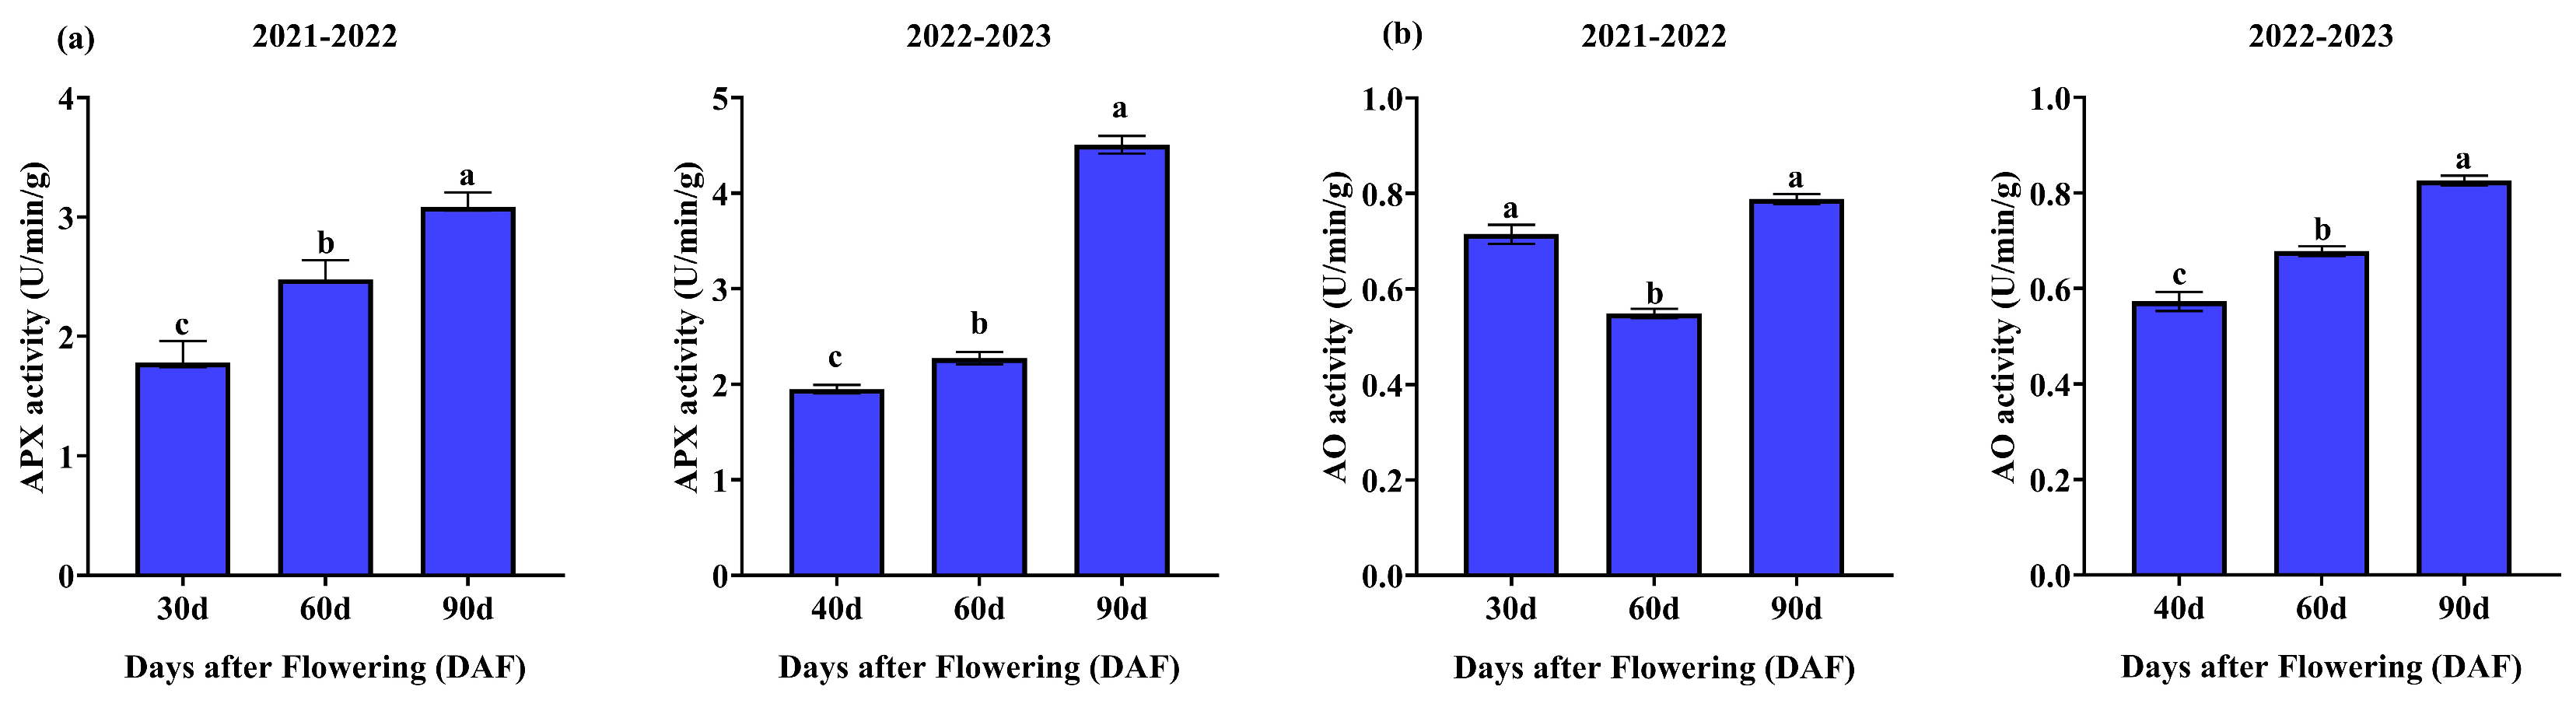
3.1.5. Enzyme Activities

The enzymatic activity of GPX, GGT, GST, and G6PDH in mango pulp exhibited dynamic changes over two years, as shown in Figure 5a–d. The enzymatic activity of GPX showed an initial decrease in 2021–2022, followed by a significant increase from 60 to 90 DAF. In 2022–2023, GPX activity steadily increased from 40 to 90 DAF. GGT activity significantly increased from 30 to 90 DAF in 2021–2022. There was an initial increase from 40 to 60 DAF, and then it decreased at a later stage. GST activity gradually decreased at first in the first year, whereas in 2022–2023, it showed an increasing and decreasing trend. In 2021–2022, G6PD activity decreased initially, then increased significantly from 60 to 90 DAF in both years.
The dynamic changes in the enzymatic activity of APX and AO in mango pulp over the two years are shown in Figure 6a,b. In 2021–2022, The enzymatic activity of APX showed a significant increasing trend in both years, While AO activity decreased at first in 2021–2022, then increased significantly from 60 to 90 DAF, but in the second year, there was a significant increasing trend from 40 to 90 DAF.

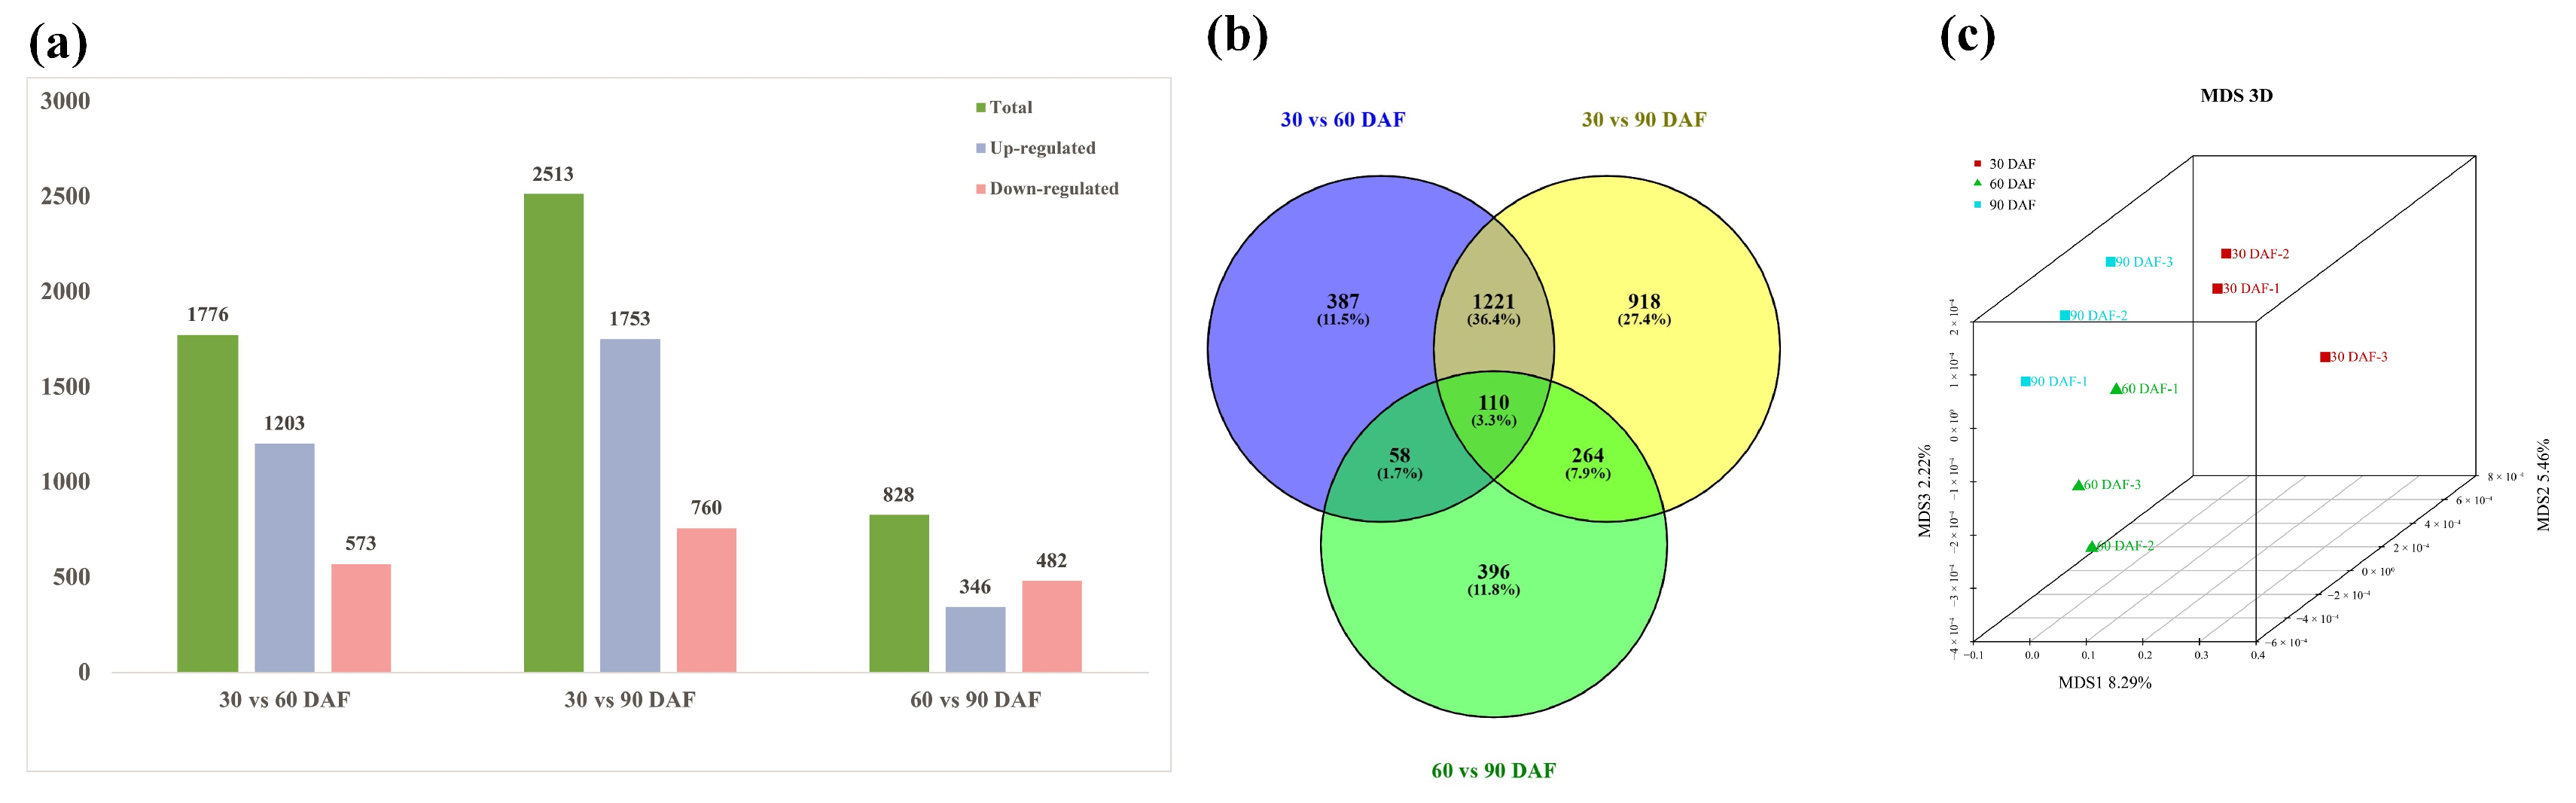
3.2. RNA Sequencing Analysis

Transcriptome sequencing of mango provided valuable information, and key properties of the RNA-seq are summarized in Supplementary Table S2. After carefully screening the raw data, a robust set of clean reads, ranging from 36 to 59 million, was obtained, with a consistent GC content of 45–46%. Specifically, when comparing 30 and 60 DAF, 1776 genes showed differential expression, with 1203 genes upregulated and 573 genes downregulated. Similarly, when comparing 30 and 90 DAF, 2513 genes exhibited differential expression, with 1753 genes upregulated and 760 genes downregulated. Additionally, in the comparison between 60 and 90 DAF, 828 genes displayed differential expression, including 346 upregulated genes, and 482 genes were downregulated, as shown in Figure 7a. A detailed list of DEGs for each comparison can be found in Supplementary Tables S1 and S2. Furthermore, Figure 7b revealed that 110 genes were differentially expressed across all three groups, while 396 genes exhibited unique differential expression in the 60 vs. 90 DAF comparison. Notably, the comparison between 30 and 90 DAF had the highest number of DEGs, while the 60 vs. 90 DAF comparison had the lowest. This difference in DEG showed the dynamic nature of gene expression during different stages of fruit growth and development. Meanwhile, Figure 7c represents the distance between the samples at different time intervals, and this plot shows the similarities and dissimilarities between the samples.

3.3. GO and KEGG Pathway Enrichment Analysis of DEGs

GO enrichment analysis was conducted on the differentially expressed genes, and the 67 GO terms with the lowest q-values were selected for representation. The results are shown in Figure 8. The DEGs in all groups were categorized into three main groups. Among these groups, 13 GO terms were significantly enriched among the DEGs. In the cellular component category, photosynthetic membrane, GO: 0034357; cytoplasm, GO: 0005737; extracellular region, GO: 0005576; and cell, GO: 0005623. While, biological process, developmental process, GO: 0032502; organic substance metabolic process, GO: 0071704; response to stimulus, GO: 0050896; metabolic process, GO: 0008152; biological process, GO: 0008150; and monosaccharide metabolic process, GO: 0005996. Similarly, in molecular function categories, oxidoreductase activity, GO: 0016491; protein binding, GO: 0005515; catalytic activity, GO: 0003824; and molecular transducer activity, GO: 0060089.
Additionally, in Figure 9, KEGG enrichment analysis was performed on the DEGs in 30 vs. 60 DAF, 60 vs. 90 DAF, and 60 vs. 90 DAF, and the 14 pathways were selected based on their relevance with our Wedesired pathways. The p-values were further employed to investigate the significantly enriched pathways. These selected pathways, including; “Plant hormone signal transduction, ko04075”, “Glutathione metabolism, ko00480”, “Glycolysis/Gluconeogenesis, ko00010”, “Glycerophospholipid metabolism, ko00564”, “Cyanoamino acid metabolism, ko00460”, “Citrate cycle (TCA cycle), ko00020”, “Pentose phosphate pathway, ko00030”, “Pyruvate metabolism, ko00620”, “Ascorbate and aldarate metabolism, ko00053, “Starch and sucrose metabolism, ko00500, “Carotenoid biosynthesis, ko00906”, “Flavonoid bio-synthesis, ko00941”, “Ribosome, ko03010”, “MAPK signaling pathway, ko04016” were highly enriched in the all these comparison.

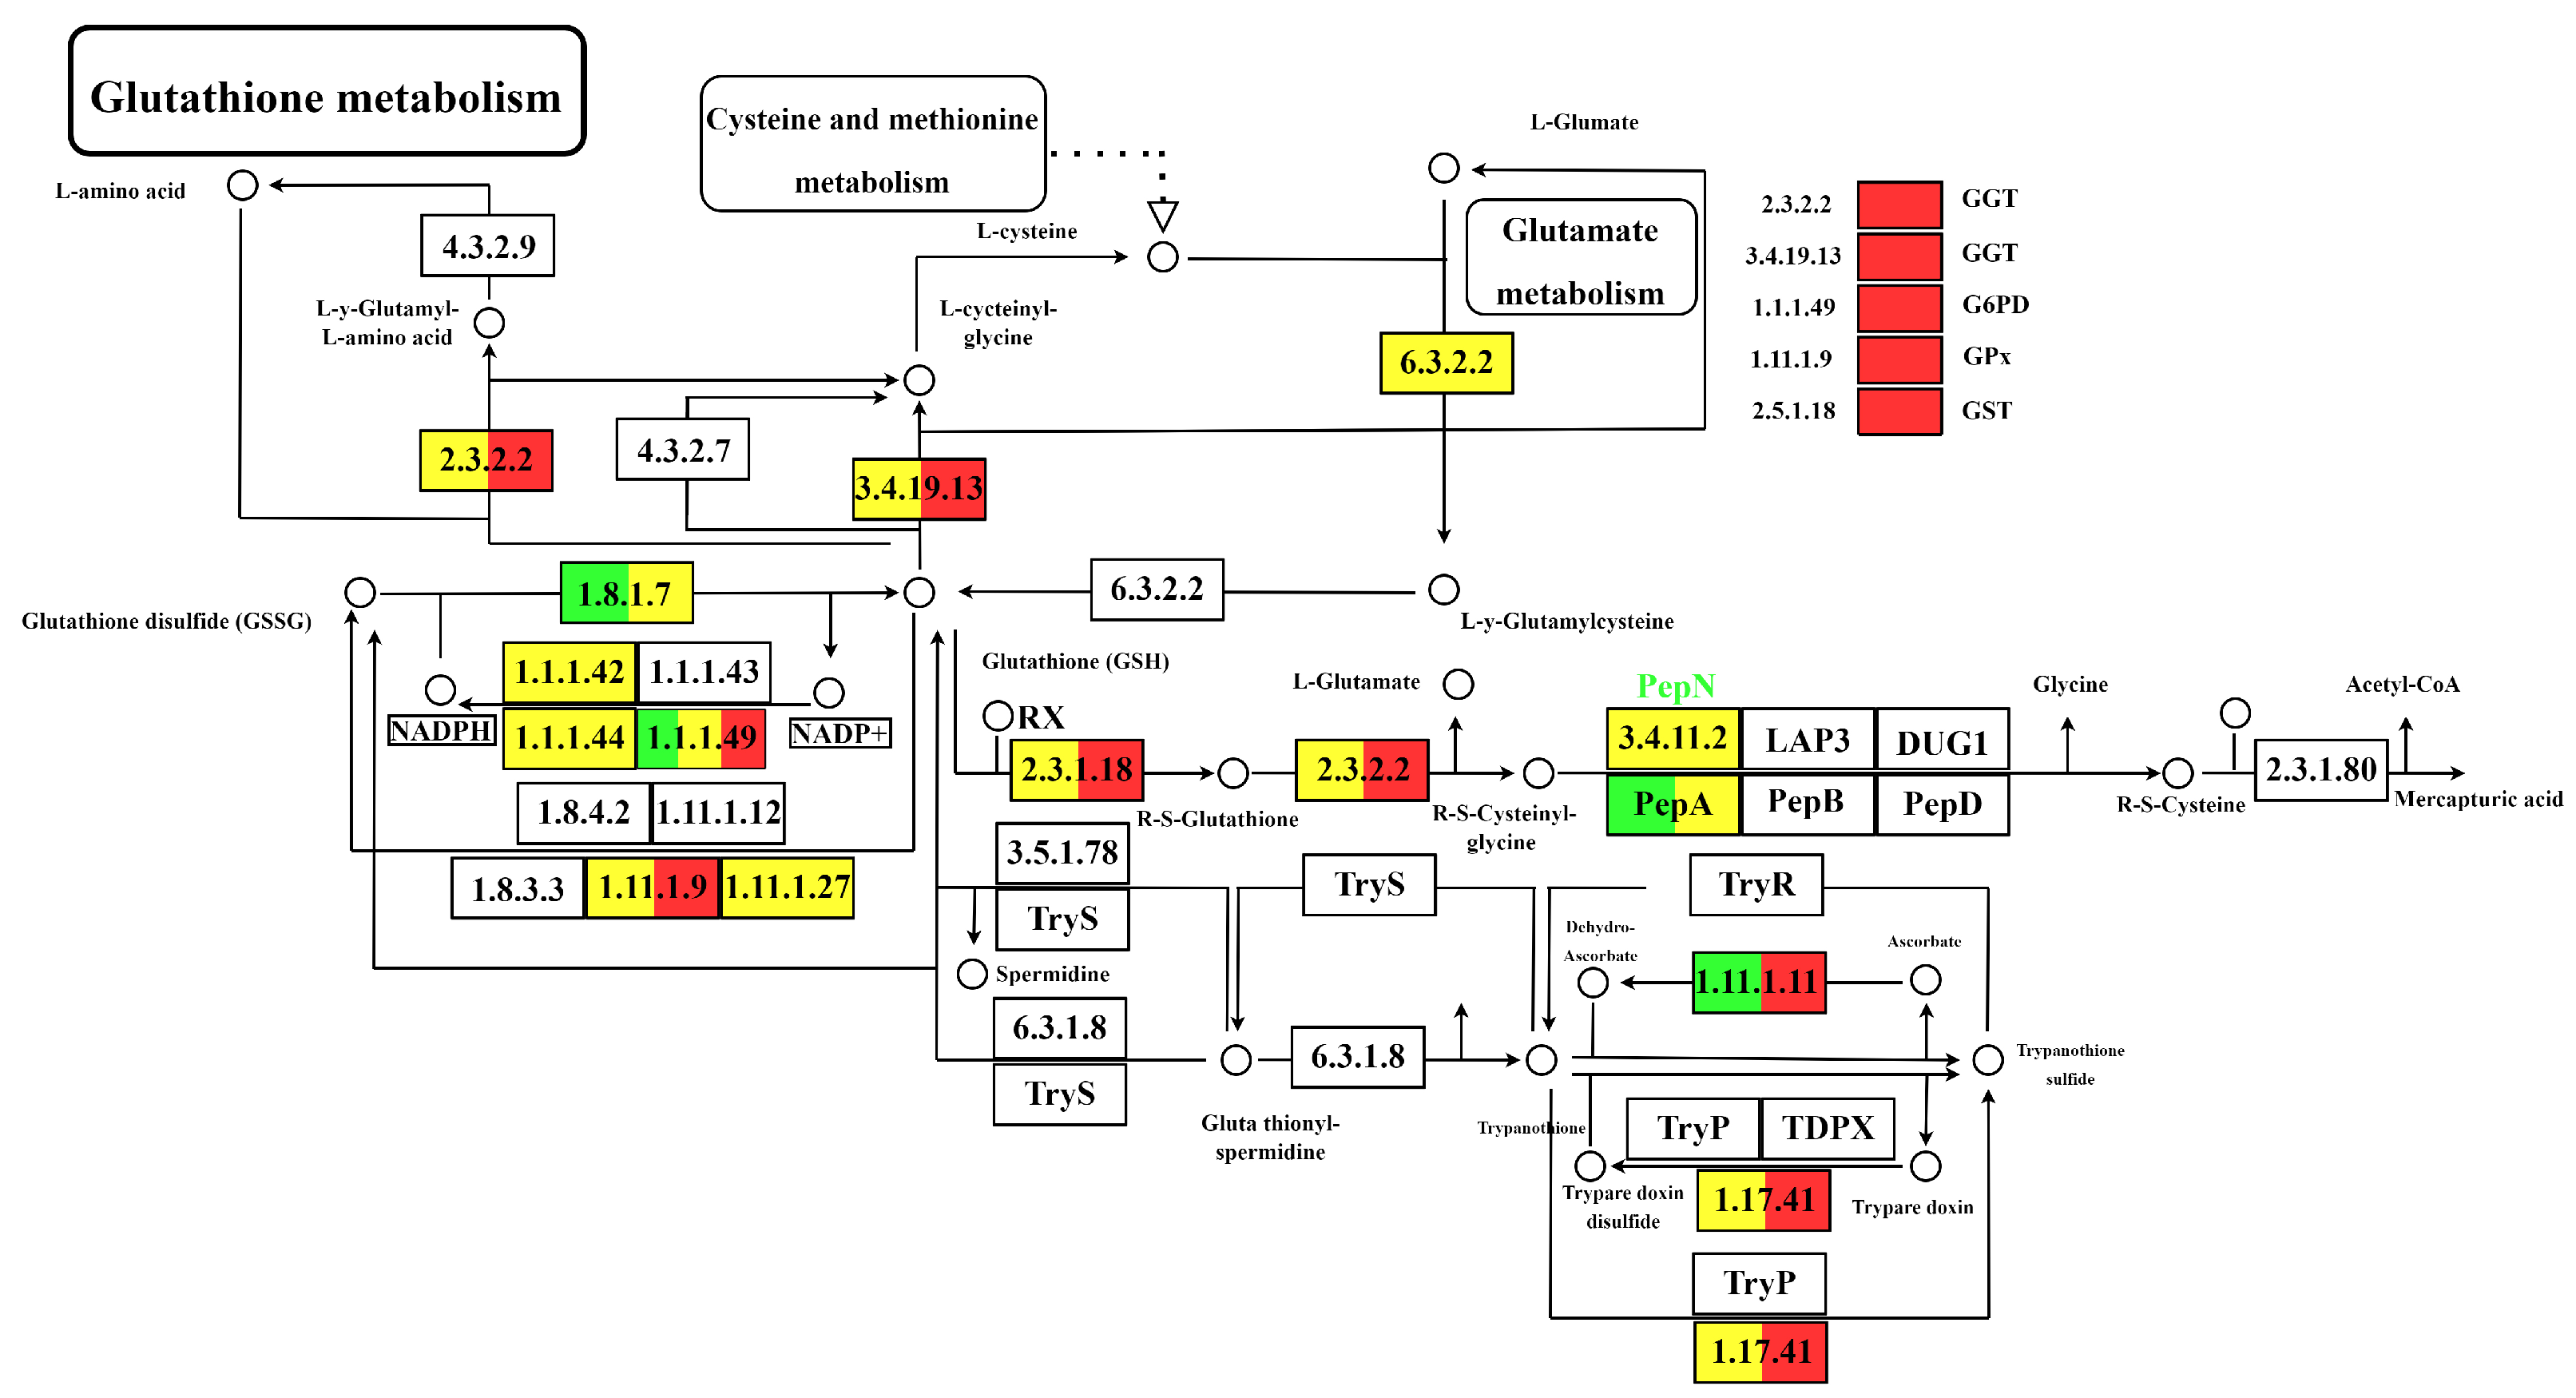
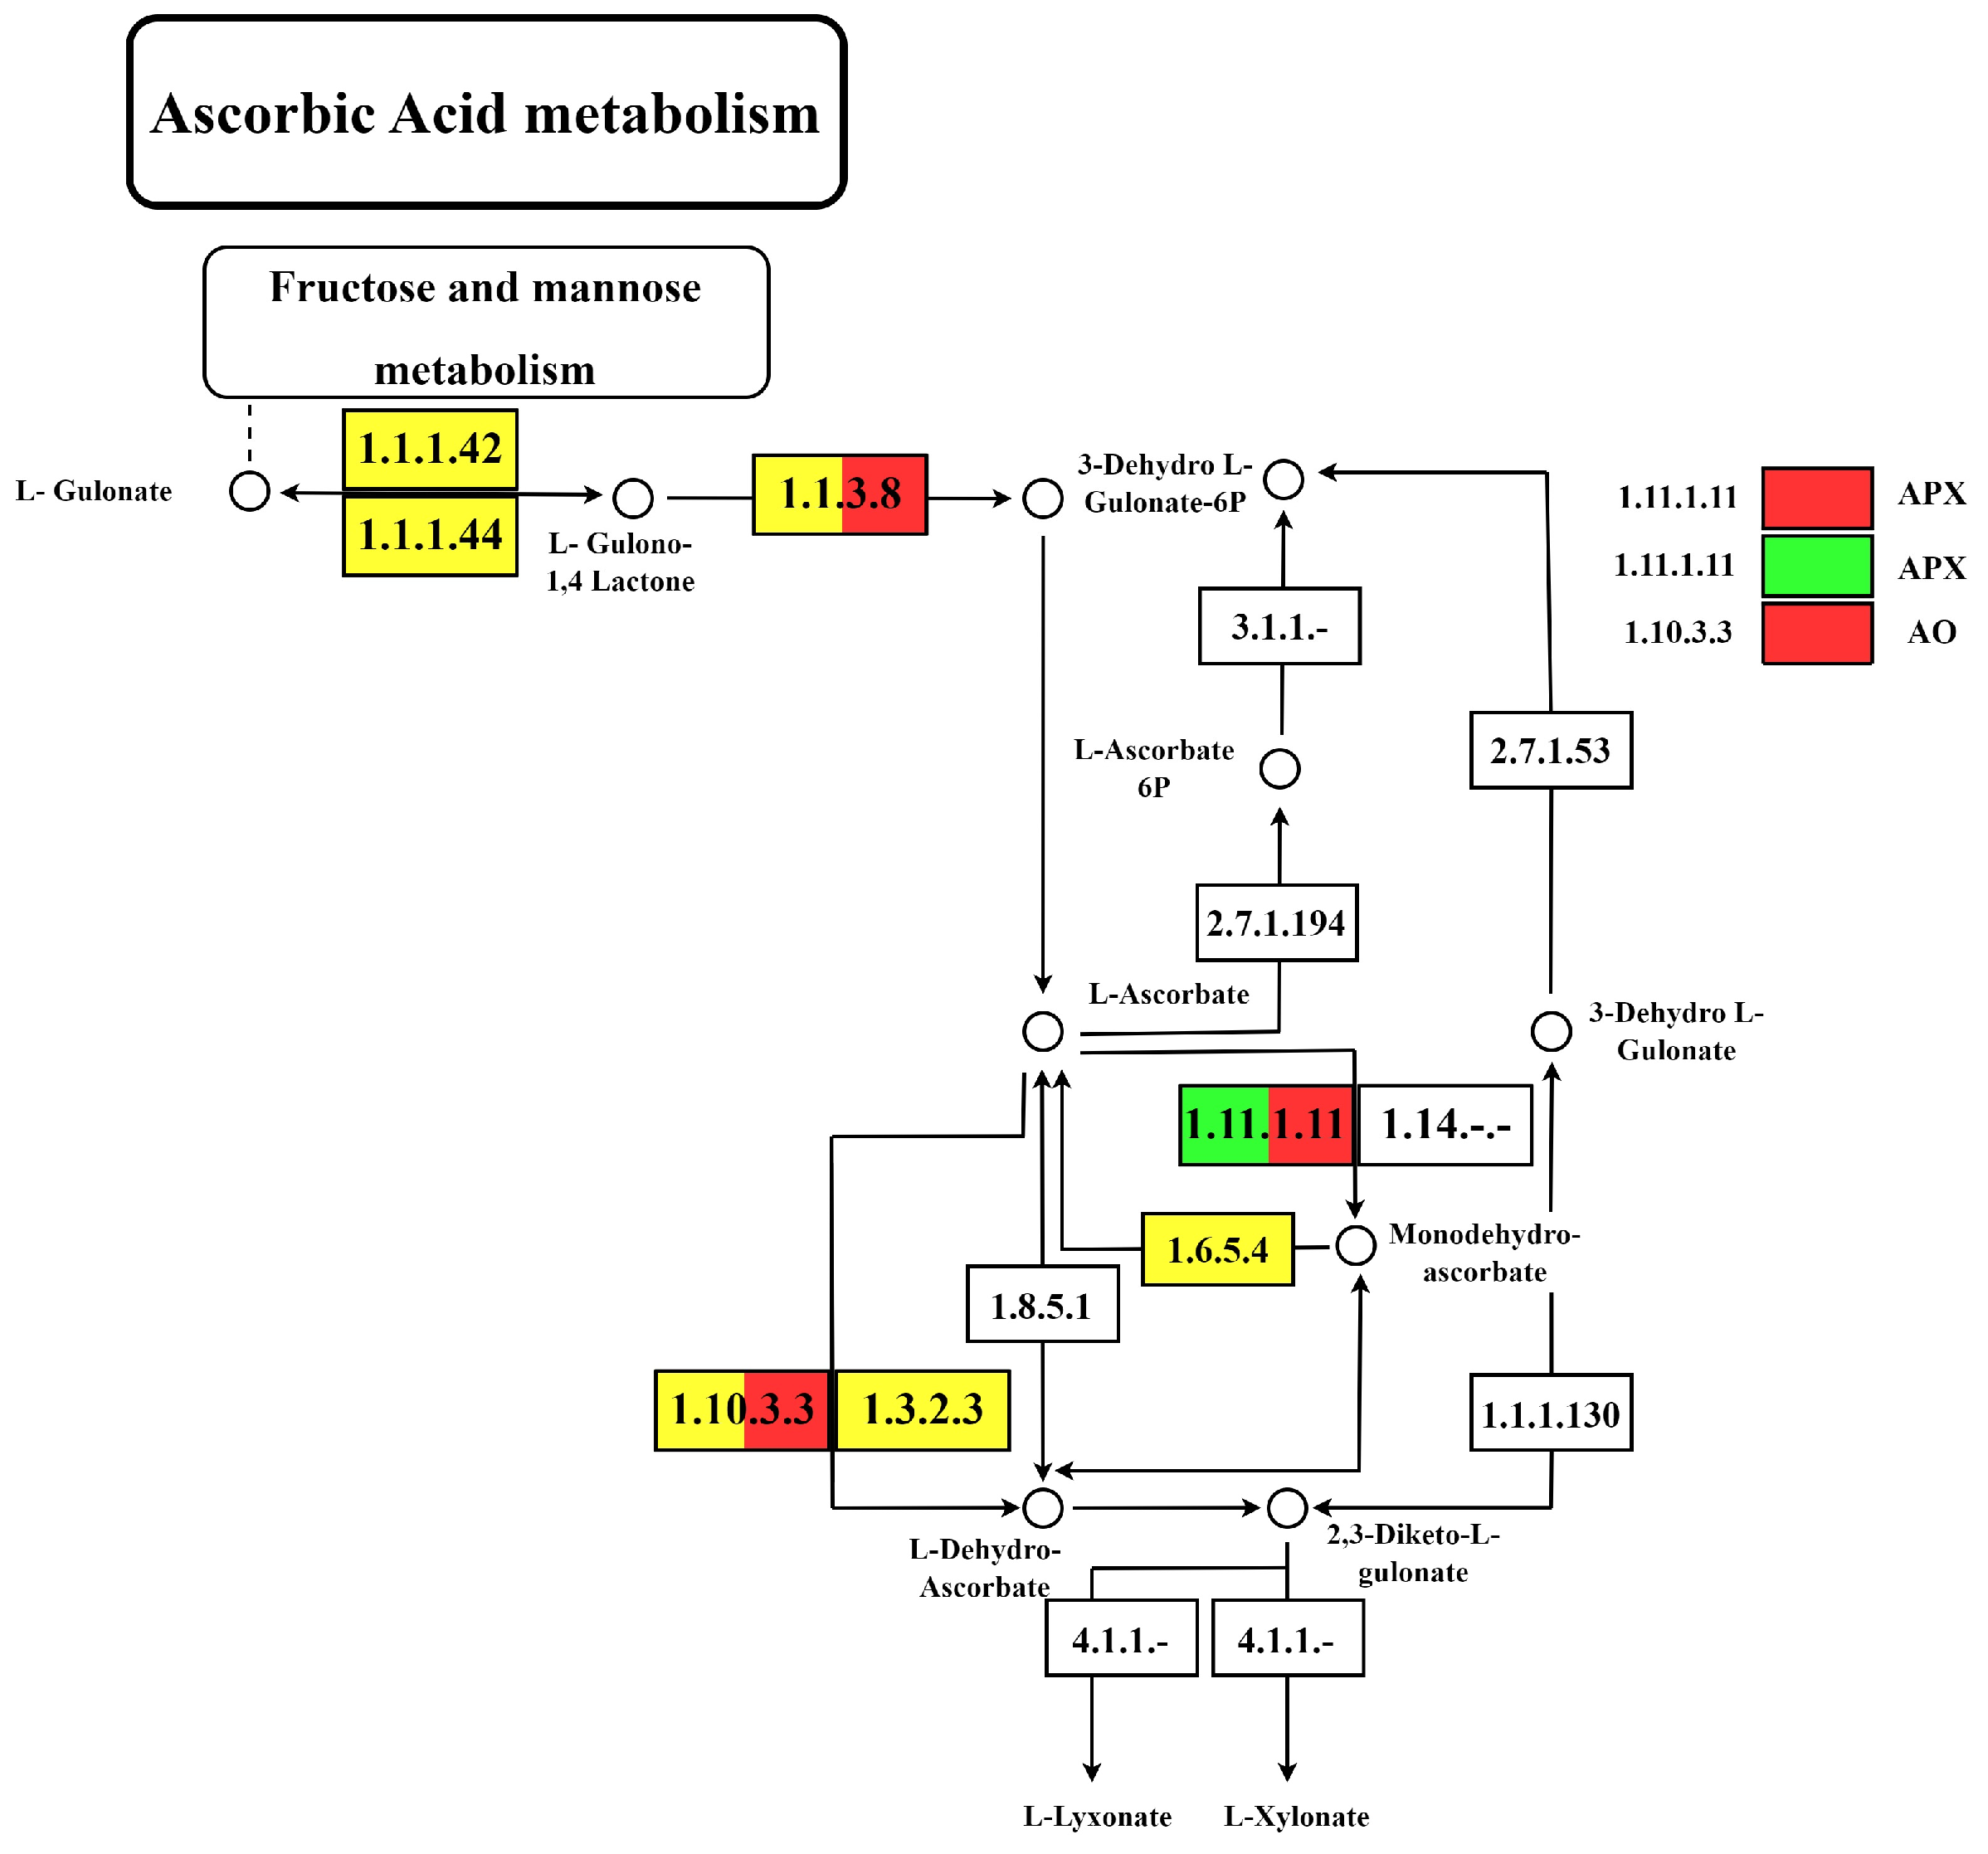
3.4. Identification and Analysis of DEGs Associated with GSH and AsA Metabolic Pathways

Our study focused on key metabolic pathways such as GSH and AsA in mango fruit, as shown in Figure 10 and Figure 11. We identified 21 significant DEGs associated with the GSH and AsA pathways. These genes’ log2 (fold change) values were visually represented in a heatmap, as shown in Figure 12. These DEGs were clustered into three groups based on their expression patterns across three comparisons: 30 vs. 60 days after flowering (DAF), 30 vs. 90 DAF, and 60 vs. 90 DAF. In comparing 30 vs. 60 DAF and 30 vs. 90 DAF, 12 genes related to GSH metabolism showed differential expression, with seven genes upregulated and five genes downregulated. For the 60 vs. 90 DAF comparison, seven genes were upregulated, and five genes showed no significant change in expression. Similarly, in the AsA metabolism pathway, 9 DEGs were identified across different comparisons. In comparing 30 vs. 60 DAF and 30 vs. 90 DAF, three genes were upregulated, and seven were downregulated. In contrast, one gene was upregulated in the 60 vs. 90 DAF comparison, and eight genes were downregulated.

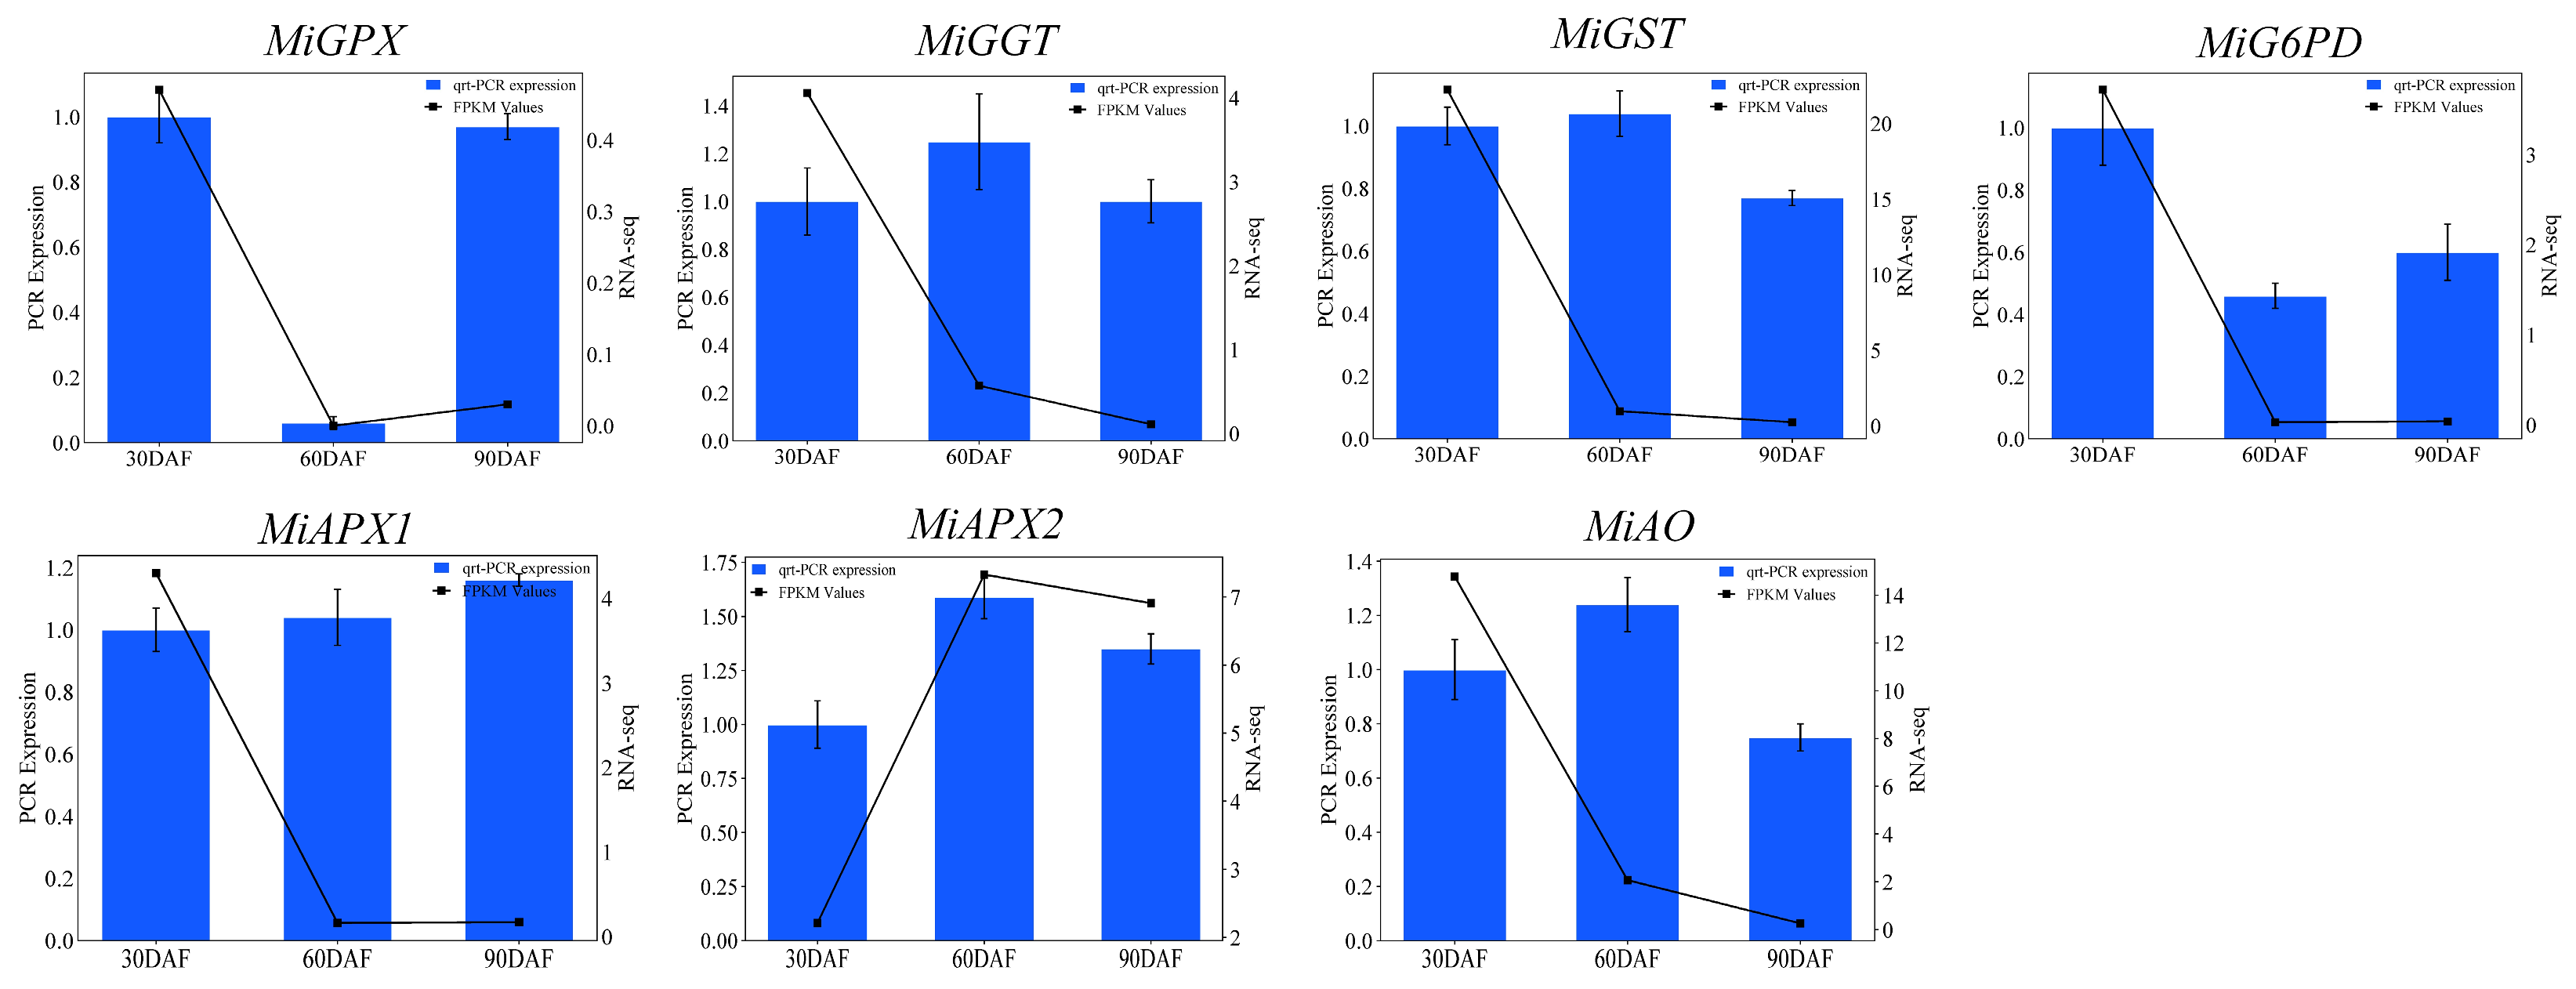
3.5. The qRT-PCR Analysis of Randomly Selected Genes

To validate the expression profiles of genes related to GSH and AsA metabolism that were identified through RNA-Seq, we analyzed the expression levels of 7 specific genes using qRT-PCR as shown in Figure 13. The genes that were examined include MiGPX, MiGGT, MiGST, MiG6PD, MiAPX1, MiAPX2, and MiAO. The results obtained from qRT-PCR generally aligned with the data from RNA-Seq, which were measured in fragments per kilobase per million reads (FPKM). Statistical analysis revealed similar differential expression patterns in both qRT-PCR and RNA-Seq datasets (Supplementary Figure S1, [39]).

4. Discussion

4.1. TSS, TA, and TSS/TA Ratio

The study of TSS, TA, and the TSS/TA ratio in mango pulp over two years provides insight into the ripening and development of mango. TSS content fluctuated significantly between 30 and 70 DAF, suggesting variable sugar accumulation. This pattern is consistent with previous findings that TSS generally increases as the fruit ripens due to greater sugar accumulation [40,41]. Similarly, the decline in TA contents during the later stages of ripening suggests a slower rate of acid utilization, possibly due to different environmental conditions or agronomic practices [42]. The decline in acidity during ripening is consistent with studies indicating that acids are utilized in respiration as the fruit matures [43]. Moreover, the TSS/TA ratio remained consistent in the early stages of both years but increased significantly from 80 to 90 DAF, possibly due to the simultaneous rise in TSS and decline in TA [44]. The observed changes in TSS, TA, and the TSS/TA ratio over the two years reflect the biochemical processes of mango ripening and underscore the importance of monitoring these parameters to optimize mango harvesting time and ensure high fruit quality.

4.2. MDA, RC, and ROS

The dynamic changes in MDA, RC, and ROS in mango pulp over the past two years provide valuable insights into oxidative stress and membrane integrity during mango ripening. The significant fluctuations in MDA content reflect early oxidative stress [45], which attributes MDA accumulation to ROS-induced lipid peroxidation in fruit tissues [46,47]. Similarly, an increase in RC in the first year suggests initial membrane damage followed by stabilization, whereas a continuous increase in the second year indicates prolonged oxidative stress and sustained membrane damage. The increase in RC aligns with the previous investigation on lipid peroxidation and electrolyte leakage caused by ROS [48,49]. However, the ROS (H2O2, OH and O2) analysis revealed varied trends in both years. H2O2 and OH showed significantly decreased trends at later stages whereas, the superoxide anion (O2) content showed a significant rising trend in both years. These trends indicate the dynamic production and scavenging of ROS during mango ripening, influenced by enzymatic and non-enzymatic antioxidant systems [45], reflecting the complex balance between ROS production and antioxidant activity, which affects fruit ripening, senescence, and storability [50]. These findings highlight the complex relationship between oxidative stress markers and membrane integrity throughout mango growth and development.

4.3. GSH-ASA Cycle and Other Functional Processes

The interplay between GSH and AsA is central to the fruit’s antioxidant defense system. The AsA-GSH cycle is crucial for fruit growth and development, underscoring the interconnected roles of these antioxidants in mitigating oxidative stress [51,52,53]. Our results demonstrate a consistent increase in GSH content across the years, particularly under natural conditions. This trend suggests that GSH accumulation is part of the mango’s defensive strategy against environmental factors, with levels peaking at 70 DAF, crucial for maintaining cellular redox balance and mitigating oxidative stress [54,55]. The rise in GSH content during the early stages of fruit development can be attributed to its role in scavenging reactive oxygen species (ROS) and supporting the antioxidant system through the AsA-GSH cycle [52,53]. Conversely, the AsA content exhibited a more complex pattern over the two years of the study. There was a significant decline in AsA content in the first year, while in the second year, AsA levels showed both increasing and decreasing trends. This variability suggests that the biosynthesis and stability of AsA are influenced by multiple factors, potentially including environmental conditions and the developmental stage of the fruit [55]. The decline in AsA content during ripening is consistent with findings in other fruits, such as apples, where AsA levels decrease due to conversion to dehydroascorbic acid or oxidative degradation [56,57]. Overall, our study demonstrates that GSH content increases as a defensive mechanism in mango pulp, particularly under natural conditions, whereas AsA levels decline during ripening due to oxidative processes and developmental changes. Similarly, sucrose plays an important role in fruit ripening by regulating genes involved in sugar metabolism, carotenoid biosynthesis, and anthocyanin production. It influences the transcription of key biosynthetic genes for carotenoids and anthocyanins, which are important pigments for the coloring and ripening of fruits [58]. Carotenoids and anthocyanins act as important antioxidants in fruits, helping to scavenge ROS and protect fruit tissues from oxidative damage during fruit ripening [59,60]. Secondary metabolites accumulate during fruit ripening and contribute to fruit quality, including color, flavor, and antioxidant capacity, and these compounds often play a role in ROS scavenging [59]. Ethylene is known to be a key regulator of climacteric fruit ripening. Hormone signaling cascades trigger various ripening-associated changes, including metabolic shifts and gene expression alterations [61,62]. The Mitogen-Activated Protein Kinase (MAPK) signaling pathway plays a crucial role in fruit ripening and quality formation. It is involved in mediating ripening-associated metabolisms and targeting ripening-associated transcription factors. MAPK signaling is likely involved in fruit ripening, particularly with ethylene signaling [63,64].

4.4. Enzymatic Activities in Mango Pulp

The enzymatic activities of GPX, GGT, GST, and G6PD in mango pulp over the two consecutive years exhibit dynamic changes that underscore their crucial roles in the antioxidant defense mechanisms during fruit ripening. GPX is essential for reducing lipid peroxides and preserving membrane integrity and cell viability during oxidative stress [65]. In the present study, we observed an increase in GPX activity, especially in the later stages of fruit development, highlighting the role in detoxifying high levels of H2O2 and lipid peroxides, thereby mitigating oxidative damage during ripening [66]. Similarly, GGT activity increased during the later stages of fruit development. GGT contributes to GSH metabolism, which is vital for maintaining antioxidant defenses. This enzyme’s increased activity supports the breakdown and recycling of GSH, enhancing the fruit’s ability to manage oxidative stress [67]. Previous studies in A. thaliana and tomato fruit have highlighted the importance of GGT in antioxidant defense and its upregulation during ripening [68,69]. GSTs are crucial for detoxifying oxidative stress products from metabolic processes [70]. Moreover, G6PD produces NADPH needed for the AsA-GSH cycle, which is important for ROS scavenging [22]. Our study’s increase in G6PD activity suggests its role in facilitating GSH recycling and supporting cellular redox homeostasis during fruit development and ripening [71]. The analysis of the enzymatic activities of APX and AO in mango pulp over time revealed significant patterns that underline their essential roles in the fruit’s response to oxidative stress and ripening processes. APX is crucial for converting H2O2 into water using ascorbate as a substrate, thereby protecting metabolic processes from oxidative damage [72]. The upregulation of APX activity indicates an adaptive response to oxidative stress, ensuring cellular redox balance during ripening. This observation aligns with findings that during the period of growth and development, the enzymatic activity of APX increased as it is crucial for antioxidant defense during ripening [73]. Similarly, AO plays a role in maintaining AsA levels during different stages of fruit development and ripening [26]. These dynamic changes in enzymatic activities reflect the mango fruit’s adaptive response during its development and growth.

4.5. Dynamic Changes in GSH and AsA Metabolic Pathways

Our study on mango fruit revealed significant differential expression of various genes involved in GSH and ASA metabolic pathways across different developmental stages (30, 60, and 90 DAF). The study on peach fruit suggests that PpaGPX6 is a key gene in mitigating oxidative stress during the late fruit ripening stages [74]. This is consistent with our observation that MiGPX showed upregulation, which indicates its role in mango fruit development. Similarly, the upregulation of MiGGT in our study suggests its involvement in enhancing the antioxidant defense mechanism during mango fruit development, supported by the studies on Arabidopsis thaliana, which demonstrate that mutations impairing GGT activity lead to the upregulation of the GGT gene [75,76]. Since GSTs are integral to ROS scavenging and reducing oxidative damage, for example, in Pyrus pyrifolia, PpGST1 and PpGST2 are upregulated during fruit ripening and senescence [77]. We found similar results where the MiGST gene showed an upregulation in the 30 vs. 60 DAF comparison, indicating their role in detoxification and defense mechanisms as the fruit matures [78,79]. Moreover, the increased G6PD activity has been associated with a higher accumulation of AsA and GSH in response to certain treatments in apple and longan fruits, which triggers the AsA-GSH cycle [80,81]. In our study, the upregulation of MiG6PD in early stages may suggest a similar role in promoting AsA and GSH accumulation, contributing to the antioxidant capacity during mango fruit development. Conversely, Guo et al. [82] reported high APX gene expression in kiwifruit leaves and roots, indicating that increased enzymatic activity and gene expression are crucial for AsA content regulation. Our study also found that the MiAPX gene has higher expression during mango fruit growth and development, suggesting that APX genes may have a critical role in mango growth and development. Previous research on different fruits, such as pepper and jujube, has further supported our findings. These studies have reported a correlation between reduced levels of AsA and increased expression of AO and APX genes [83,84]. Additionally, our study observed similar AO trends. Higher expression of MiAO significantly affects various aspects of plant physiology, including stress responses, growth features, yield, and photosynthesis. This influence is particularly notable during the fiber cell elongation stages [85,86]. The differential expression patterns of these genes during mango fruit development reflect their complex roles in maintaining GSH and AsA homeostasis and facilitating adaptive responses to changing conditions.

5. Conclusions

This study revealed the dynamic changes in glutathione (GSH) and ascorbic acid (AsA) levels in Mangifera indica pulp during fruit growth and development across the years. Our findings showed an increase in GSH and a decrease in AsA during ripening, significant effects on the MDA and ROS contents, which decreased throughout DAF intervals. TSS, TA, and the sugar–acid ratio significantly fluctuated, impacting the fruit’s quality. The study also highlighted the upregulation of key genes involved in GSH (MiGPX, MiGGT, MiGST, and MiG6PD) and AsA metabolism (MiAPX and MiAO), enhancing the fruit’s resilience to oxidative stress. These findings provide valuable insights into the molecular mechanisms regulating mango fruit ripening and provide potential strategies for improving fruit quality and resilience against senescence.

Supplementary Materials

The following supporting information can be downloaded at: https://www.mdpi.com/article/10.3390/horticulturae10070694/s1, Supplementary file S1.

Author Contributions

Conceptualization, H.T. and K.Z.; methodology, H.T., M.Z.U.H. and M.S.; software, H.T., A.T. and M.Z.U.H.; validation, H.T., M.Q. and K.Z.; formal analysis, H.T., M.Z.U.H., M.S., T.C. and S.S.; investigation, H.T., M.Z.U.H. and W.L.; resources, H.T. and M.Q.; data curation, H.T., M.Z.U.H., M.A.F., M.S. and S.S.; writing—original draft preparation, H.T. and M.Z.U.H.; writing—review and editing, H.T., K.Z., M.Z.U.H., A.T. and M.A.F.; visualization, H.T. and K.Z.; supervision, K.Z.; project administration, K.Z.; funding acquisition, K.Z. All authors have read and agreed to the published version of the manuscript.

Funding

This work was financially supported by the National Natural Science Foundation of China (No. 32160677).

Data Availability Statement

The original contributions presented in the study are included in the article and Supplementary Material. Further inquiries can be directed to the corresponding author.

Conflicts of Interest

The authors declare no conflict of interest.

References

  1. Wang, P.; Luo, Y.; Huang, J.; Gao, S.; Zhu, G.; Dang, Z.; Gai, J.; Yang, M.; Zhu, M.; Zhang, H. The genome evolution and domestication of tropical fruit mango. Gen. Biol. 2020, 21, 60. [Google Scholar] [CrossRef] [PubMed]
  2. García-Mahecha, M.; Soto-Valdez, H.; Carvajal-Millan, E.; Madera-Santana, T.J.; Lomelí-Ramírez, M.G.; Colín-Chávez, C. Bioactive compounds in extracts from the agro-industrial waste of mango. Molecules 2023, 28, 458. [Google Scholar] [CrossRef] [PubMed]
  3. Tharanathan, R.; Yashoda, H.; Prabha, T. Mango (Mangifera indica L.), “The king of fruits”—An overview. Food Rev. Int. 2006, 22, 95–123. [Google Scholar] [CrossRef]
  4. Zhang, D.; Chong, W.; Li, X.-L. Yield gap and production constraints of mango (Mangifera indica) cropping systems in Tianyang County, China. J. Integr. Agric. 2019, 18, 1726–1736. [Google Scholar] [CrossRef]
  5. Sawangchote, P.; Grote, P.J.; Dilcher, D.L. Tertiary leaf fossils of Mangifera (Anacardiaceae) from Li Basin, Thailand as examples of the utility of leaf marginal venation characters. Am. J. Bot. 2009, 96, 2048–2061. [Google Scholar] [CrossRef] [PubMed]
  6. Jahurul, M.; Zaidul, I.; Ghafoor, K.; Al-Juhaimi, F.Y.; Nyam, K.-L.; Norulaini, N.; Sahena, F.; Omar, A.M. Mango (Mangifera indica L.) by-products and their valuable components: A review. Food Chem. 2015, 183, 173–180. [Google Scholar] [CrossRef] [PubMed]
  7. Gómez-Caravaca, A.M.; López-Cobo, A.; Verardo, V.; Segura-Carretero, A.; Fernández-Gutiérrez, A. HPLC-DAD-q-TOF-MS as a powerful platform for the determination of phenolic and other polar compounds in the edible part of mango and its by-products (peel, seed, and seed husk). Electrophoresis 2016, 37, 1072–1084. [Google Scholar] [CrossRef] [PubMed]
  8. Matharu, A.S.; Houghton, J.A.; Lucas-Torres, C.; Moreno, A. Acid-free microwave-assisted hydrothermal extraction of pectin and porous cellulose from mango peel waste–towards a zero waste mango biorefinery. Green Chem. 2016, 18, 5280–5287. [Google Scholar] [CrossRef]
  9. Saba, M.K.; Moradi, S. Sodium nitroprusside (SNP) spray to maintain fruit quality and alleviate postharvest chilling injury of peach fruit. Sci. Hortic. 2017, 216, 193–199. [Google Scholar] [CrossRef]
  10. Osorio, S.; Scossa, F.; Fernie, A.R. Molecular regulation of fruit ripening. Front. Plant Sci. 2013, 4, 198. [Google Scholar] [CrossRef]
  11. Kumar, V.; Irfan, M.; Ghosh, S.; Chakraborty, N.; Chakraborty, S.; Datta, A. Fruit ripening mutants reveal cell metabolism and redox state during ripening. Protoplasma 2016, 253, 581–594. [Google Scholar] [CrossRef] [PubMed]
  12. Hasanuzzaman, M.; Hossain, M.A.; Fujita, M. Nitric oxide modulates antioxidant defense and the methylglyoxal detoxification system and reduces salinity-induced damage of wheat seedlings. Plant Biotechnol. Rep. 2011, 5, 353–365. [Google Scholar] [CrossRef]
  13. Ge, C.; Luo, Y.; Mo, F.; Xiao, Y.-H.; Li, N.-Y.; Tang, H.-R. Effects of glutathione on the ripening quality of strawberry fruits. AIP Conf. Proc. 2019, 2079, 020013. [Google Scholar] [CrossRef]
  14. Zhang, L.; Ma, G.; Yamawaki, K.; Ikoma, Y.; Matsumoto, H.; Yoshioka, T.; Ohta, S.; Kato, M. Regulation of ascorbic acid metabolism by blue LED light irradiation in citrus juice sacs. Plant Sci. 2015, 233, 134–142. [Google Scholar] [CrossRef]
  15. Begara-Morales, J.C.; Sánchez-Calvo, B.; Chaki, M.; Mata-Pérez, C.; Valderrama, R.; Padilla, M.N.; López-Jaramillo, J.; Luque, F.; Corpas, F.J.; Barroso, J.B. Differential molecular response of monodehydroascorbate reductase and glutathione reductase by nitration and S-nitrosylation. J. Exp. Bot. 2015, 66, 5983–5996. [Google Scholar] [CrossRef] [PubMed]
  16. Chongchatuporn, U.; Ketsa, S.; van Doorn, W.G. Chilling injury in mango (Mangifera indica) fruit peel: Relationship with ascorbic acid concentrations and antioxidant enzyme activities. Postharvest Biol. Technol. 2013, 86, 409–417. [Google Scholar] [CrossRef]
  17. Camejo, D.; Marti, M.C.; Roman, P.; Ortiz, A.; Jimenez, A. Antioxidant system and protein pattern in peach fruits at two maturation stages. J. Agric. Food Chem. 2010, 58, 11140–11147. [Google Scholar] [CrossRef] [PubMed]
  18. Meitha, K.; Pramesti, Y.; Suhandono, S. Reactive oxygen species and Antioxidants in postharvest vegetables and fruits. Int. J. Food Sci. 2020, 2020, 8817778. [Google Scholar] [CrossRef] [PubMed]
  19. Huan, C.; Jiang, L.; An, X.; Kang, R.; Yu, M.; Ma, R.; Yu, Z. Potential role of glutathione peroxidase gene family in peach fruit ripening under combined postharvest treatment with heat and 1-MCP. Postharvest Biol. Technol. 2016, 111, 175–184. [Google Scholar] [CrossRef]
  20. Yao, M.; Ge, W.; Zhou, Q.; Zhou, X.; Luo, M.; Zhao, Y.; Wei, B.; Ji, S. Exogenous glutathione alleviates chilling injury in postharvest bell pepper by modulating the ascorbate-glutathione (AsA-GSH) cycle. Food Chem. 2021, 352, 129458. [Google Scholar] [CrossRef]
  21. Wang, L.; Ma, M.; Zhang, S.; Wu, Z.; Li, J.; Luo, W.; Guo, L.; Lin, W.; Zhang, S. Characterization of genes involved in pear ascorbic acid metabolism and their response to bagging treatment during ‘Yali’fruit development. Sci. Hortic. 2021, 285, 110178. [Google Scholar] [CrossRef]
  22. Palma, J.M.; Terán, F.; Contreras-Ruiz, A.; Rodríguez-Ruiz, M.; Corpas, F.J. Antioxidant profile of pepper (Capsicum annuum L.) fruits containing diverse levels of capsaicinoids. Antioxidants 2020, 9, 878. [Google Scholar] [CrossRef] [PubMed]
  23. Vogelsang, L.; Dietz, K.-J. Plant thiol peroxidases as redox sensors and signal transducers in abiotic stress acclimation. Free Radic. Biol. Med. 2022, 193, 764–778. [Google Scholar] [CrossRef] [PubMed]
  24. Gaber, A.; Ogata, T.; Maruta, T.; Yoshimura, K.; Tamoi, M.; Shigeoka, S. The involvement of Arabidopsis glutathione peroxidase 8 in the suppression of oxidative damage in the nucleus and cytosol. Plant Cell Physiol. 2012, 53, 1596–1606. [Google Scholar] [CrossRef] [PubMed]
  25. Kato, N.; Esaka, M. Expansion of transgenic tobacco protoplasts expressing pumpkin ascorbate oxidase is more rapid than that of wild-type protoplasts. Planta 2000, 210, 1018–1022. [Google Scholar] [CrossRef] [PubMed]
  26. Potters, G.; Horemans, N.; Caubergs, R.J.; Asard, H. Ascorbate and dehydroascorbate influence cell cycle progression in a tobacco cell suspension. Plant Physiol. 2000, 124, 17–20. [Google Scholar] [CrossRef] [PubMed]
  27. Marioni, J.C.; Mason, C.E.; Mane, S.M.; Stephens, M.; Gilad, Y. RNA-seq: An assessment of technical reproducibility and comparison with gene expression arrays. Genome Res. 2008, 18, 1509–1517. [Google Scholar] [CrossRef] [PubMed]
  28. Gao, X.; Wang, L.; Zhang, H.; Zhu, B.; Lv, G.; Xiao, J. Transcriptome analysis and identification of genes associated with floral transition and fruit development in rabbiteye blueberry (Vaccinium ashei). PLoS ONE 2021, 16, e0259119. [Google Scholar] [CrossRef]
  29. Xie, M.; Huang, Y.; Zhang, Y.; Wang, X.; Yang, H.; Yu, O.; Dai, W.; Fang, C. Transcriptome profiling of fruit development and maturation in Chinese white pear (Pyrus bretschneideri Rehd). BMC Genom. 2013, 14, 823. [Google Scholar] [CrossRef]
  30. García-Gómez, B.E.; Ruiz, D.; Salazar, J.A.; Rubio, M.; Martínez-García, P.J.; Martínez-Gómez, P. Analysis of metabolites and gene expression changes relative to apricot (Prunus armeniaca L.) fruit quality during development and ripening. Front. Plant Sci. 2020, 11, 1269. [Google Scholar] [CrossRef]
  31. Su, L.; Zhang, T.; Wu, M.; Zhong, Y.; Cheng, Z. Transcriptome and Metabolome Reveal Sugar and Organic Acid Accumulation in Rosa roxburghii Fruit. Plants 2023, 12, 3036. [Google Scholar] [CrossRef] [PubMed]
  32. Ahmed, R.; Uddin, M.K.; Quddus, M.A.; Samad, M.Y.A.; Hossain, M.M.; Haque, A.N.A. Impact of foliar application of zinc and zinc oxide nanoparticles on growth, yield, nutrient uptake and quality of tomato. Horticulturae 2023, 9, 162. [Google Scholar] [CrossRef]
  33. Ding, Y.; Sheng, J.; Li, S.; Nie, Y.; Zhao, J.; Zhu, Z.; Wang, Z.; Tang, X. The role of gibberellins in the mitigation of chilling injury in cherry tomato (Solanum lycopersicum L.) fruit. Postharvest Biol. Technol. 2015, 101, 88–95. [Google Scholar] [CrossRef]
  34. Khaliq, G.; Mohamed, M.T.M.; Ghazali, H.M.; Ding, P.; Ali, A. Influence of gum arabic coating enriched with calcium chloride on physiological, biochemical and quality responses of mango (Mangifera indica L.) fruit stored under low temperature stress. Postharvest Biol. Technol. 2016, 111, 362–369. [Google Scholar] [CrossRef]
  35. Rao, B.; Deshpande, V. Experimental biochemistry. Tunbridge Wells Kent Anshan. 2006. [Google Scholar]
  36. Love, M.I.; Huber, W.; Anders, S. Moderated estimation of fold change and dispersion for RNA-seq data with DESeq2. Genome Biol. 2014, 15, 550. [Google Scholar] [CrossRef] [PubMed]
  37. Li, B.; Zhang, L.; Zhu, L.; Cao, Y.; Dou, Z.; Yu, Q. HDAC5 promotes intestinal sepsis via the Ghrelin/E2F1/NF-κB axis. FASEB J. 2021, 35, e21368. [Google Scholar] [CrossRef] [PubMed]
  38. Chen, C.; Chen, H.; Zhang, Y.; Thomas, H.R.; Frank, M.H.; He, Y.; Xia, R. TBtools: An integrative toolkit developed for interactive analyses of big biological data. Mol. Plant 2020, 13, 1194–1202. [Google Scholar] [CrossRef] [PubMed]
  39. Sapkota, S.; Salem, M.; Jahed, K.R.; Artlip, T.S.; Sherif, S.M. From endodormancy to ecodormancy: The transcriptional landscape of apple floral buds. Front. Plant Sci. 2023, 14, 1194244. [Google Scholar] [CrossRef]
  40. Gharezi, M.; Joshi, N.; Sadeghian, E. Effect of postharvest treatment on stored cherry tomatoes. J. Nutr. Food Sci. 2012, 2, 1–10. [Google Scholar]
  41. Nawaz, R.; Abbasi, N.; Hafiz, I.A.; Khalid, A. Impact of climate variables on fruit internal quality of Kinnow mandarin (Citrus nobilis Lour × Citrus deliciosa Tenora) in ripening phase grown under varying environmental conditions. Sci. Hortic. 2020, 265, 109235. [Google Scholar] [CrossRef]
  42. Lebaka, V.R.; Wee, Y.-J.; Ye, W.; Korivi, M. Nutritional composition and bioactive compounds in three different parts of mango fruit. Int. J. Environ. Res. Public Health 2021, 18, 741. [Google Scholar] [CrossRef]
  43. Ali, S.; Khan, A.S.; Malik, A.U.; Anjum, M.A.; Nawaz, A.; Shah, H.M.S. Modified atmosphere packaging delays enzymatic browning and maintains quality of harvested litchi fruit during low temperature storage. Sci. Hortic. 2019, 254, 14–20. [Google Scholar] [CrossRef]
  44. Magwaza, L.S.; Opara, U.L. Analytical methods for determination of sugars and sweetness of horticultural products—A review. Sci. Hortic. 2015, 184, 179–192. [Google Scholar] [CrossRef]
  45. Hodges, D.M.; Lester, G.E.; Munro, K.D.; Toivonen, P.M. Oxidative stress: Importance for postharvest quality. Hortic. Sci. 2004, 39, 924–929. [Google Scholar] [CrossRef]
  46. Luo, P.; He, J.J.; Yao, Y.L.; Mo, Y.W. Effect of chilling stress on leaf antioxidative abilities of rubble trees with different chilling tolerance. Acta Bot. Boreal.-Occident. Sin. 2014, 34, 311–317. [Google Scholar]
  47. Ren, J.; Zhao, S.; Su, Y.; Qi, G.; Li, B. Effects of low temperature stress in spring on antioxidase indexes of walnuts. J. Northwest A F Univ.-Nat. Sci. Ed. 2016, 44, 75–81. [Google Scholar]
  48. Tsikas, D. Assessment of lipid peroxidation by measuring malondialdehyde (MDA) and relatives in biological samples: Analytical and biological challenges. Anal. Biochem. 2017, 524, 13–30. [Google Scholar] [CrossRef]
  49. Prášil, I.; Zámečník, J. The use of a conductivity measurement method for assessing freezing injury: I. Influence of leakage time, segment number, size and shape in a sample on evaluation of the degree of injury. Environ. Exp. Bot. 1998, 40, 1–10. [Google Scholar] [CrossRef]
  50. Mondal, K.; Malhotra, S.P.; Jain, V.; Singh, R. Oxidative stress and antioxidant systems in Guava (Psidium guajava L.) fruits during ripening. Physiol. Mol. Biol. Plants 2009, 15, 327–334. [Google Scholar] [CrossRef]
  51. Li, Y.; Liu, Y.; Zhang, J. Advances in the research on the AsA-GSH cycle in horticultural crops. Front. Agric. China 2010, 4, 84–90. [Google Scholar] [CrossRef]
  52. Jin, Y.-H.; Tao, D.-L.; Hao, Z.-Q.; Ye, J.; Du, Y.-J.; Liu, H.-L.; Zhou, Y.-B. Environmental stresses and redox status of ascorbate. J. Integr. Plant Biol. 2003, 45, 795. [Google Scholar]
  53. Pan, Y.; Jiang, Y.; Huang, Q.; Zhu, Y.; Nie, Y.; Yuan, R.; Zhang, Z. Abnormal chilling injury of postharvest papaya is associated with the antioxidant response. J. Food Biochem. 2022, 46, e14272. [Google Scholar] [CrossRef]
  54. Zhou, Y.; Liu, J.; Zhuo, Q.; Zhang, K.; Yan, J.; Tang, B.; Wei, X.; Lin, L.; Liu, K. Exogenous glutathione maintains the postharvest quality of mango fruit by modulating the ascorbate-glutathione cycle. PeerJ 2023, 11, e15902. [Google Scholar] [CrossRef]
  55. Mellidou, I.; Keulemans, J.; Kanellis, A.K.; Davey, M.W. Regulation of fruit ascorbic acid concentrations during ripening in high and low vitamin C tomato cultivars. BMC Plant Biol. 2012, 12, 239. [Google Scholar] [CrossRef]
  56. Fang, T.; Zhen, Q.; Liao, L.; Owiti, A.; Zhao, L.; Korban, S.S.; Han, Y. Variation of ascorbic acid concentration in fruits of cultivated and wild apples. Food Chem. 2017, 225, 132–137. [Google Scholar] [CrossRef]
  57. Singh, J.; Mirza, A. Influence of ascorbic acid application on quality and storage life of fruits. Int. J. Curr. Microbiol. Appl. Sci. 2018, 7, 4319–4328. [Google Scholar] [CrossRef]
  58. Durán-Soria, S.; Pott, D.M.; Osorio, S.; Vallarino, J.G. Sugar signaling during fruit ripening. Front. Plant Sci. 2020, 11, 564917. [Google Scholar] [CrossRef]
  59. Decros, G.; Baldet, P.; Beauvoit, B.; Stevens, R.; Flandin, A.; Colombié, S.; Gibon, Y.; Pétriacq, P. Get the balance right: ROS homeostasis and redox signalling in fruit. Front. Plant Sci. 2019, 10, 1091. [Google Scholar] [CrossRef]
  60. Kaushal, S. Reactive oxygen species (ROS) and associated scavenging mechanisms during fruit ripening. Botany 2016, 66, 176–186. [Google Scholar]
  61. Jin, J.; Wang, W.; Fan, D.; Hao, Q.; Jia, W. Emerging Roles of Mitogen-Activated Protein Kinase Signaling Pathways in the Regulation of Fruit Ripening and Postharvest Quality. Int. J. Mol. Sci. 2024, 25, 2831. [Google Scholar] [CrossRef]
  62. Li, S.; Chen, K.; Grierson, D. Molecular and hormonal mechanisms regulating fleshy fruit ripening. Cells 2021, 10, 1136. [Google Scholar] [CrossRef]
  63. Wang, W.; Fan, D.; Hao, Q.; Jia, W. Signal transduction in non-climacteric fruit ripening. Hortic. Res. 2022, 9, uhac190. [Google Scholar] [CrossRef]
  64. Liu, M.; Wang, C.; Ji, H.; Sun, M.; Liu, T.; Wang, J.; Cao, H.; Zhu, Q. Ethylene biosynthesis and signal transduction during ripening and softening in non-climacteric fruits: An overview. Front. Plant Sci. 2024, 15, 1368692. [Google Scholar] [CrossRef]
  65. Patwardhan, R.; Sharma, D.; Checker, R.; Thoh, M.; Sandur, S. Spatio-temporal changes in glutathione and thioredoxin redox couples during ionizing radiation-induced oxidative stress regulate tumor radio-resistance. Free Radic. Res. 2015, 49, 1218–1232. [Google Scholar] [CrossRef]
  66. Sati, H.; Khandelwal, A.; Pareek, S. Effect of exogenous melatonin in fruit postharvest, crosstalk with hormones, and defense mechanism for oxidative stress management. Food Front. 2023, 4, 233–261. [Google Scholar] [CrossRef]
  67. Storozhenko, S.; Belles-Boix, E.; Babiychuk, E.; Hérouart, D.; Davey, M.W.; Slooten, L.; Van Montagu, M.; Inzé, D.; Kushnir, S. γ-Glutamyl transpeptidase in transgenic tobacco plants. Cellular localization, processing, and biochemical properties. Plant Physiol. 2002, 128, 1109–1119. [Google Scholar] [CrossRef]
  68. Martin, M.N.; Saladores, P.H.; Lambert, E.; Hudson, A.O.; Leustek, T. Localization of members of the γ-glutamyl transpeptidase family identifies sites of glutathione and glutathione S-conjugate hydrolysis. Plant Physiol. 2007, 144, 1715–1732. [Google Scholar] [CrossRef]
  69. Sorrequieta, A.; Ferraro, G.; Boggio, S.B.; Valle, E.M. Free amino acid production during tomato fruit ripening: A focus on l-glutamate. Amino Acids 2010, 38, 1523–1532. [Google Scholar] [CrossRef]
  70. Hayes, J.D.; Flanagan, J.U.; Jowsey, I.R. Glutathione transferases. Annu. Rev. Pharmacol. Toxicol. 2005, 45, 51–88. [Google Scholar] [CrossRef]
  71. Aghdam, M.S.; Palma, J.M.; Corpas, F.J. NADPH as a quality footprinting in horticultural crops marketability. Trends Food Sci. Technol. 2020, 103, 152–161. [Google Scholar] [CrossRef]
  72. Mittler, R.; Lam, E.; Shulaev, V.; Cohen, M. Signals controlling the expression of cytosolic ascorbate peroxidase during pathogen-induced programmed cell death in tobacco. Plant Mol. Biol. 1999, 39, 1025–1035. [Google Scholar] [CrossRef]
  73. Wang, L.; Li, R.; Shi, X.; Wei, L.; Li, W.; Shao, Y. Ripening patterns (off-tree and on-tree) affect physiology, quality, and ascorbic acid metabolism of mango fruit (cv. Guifei). Sci. Hortic. 2023, 315, 111971. [Google Scholar] [CrossRef]
  74. Huan, C.; Jiang, L.; An, X.; Yu, M.; Xu, Y.; Ma, R.; Yu, Z. Potential role of reactive oxygen species and antioxidant genes in the regulation of peach fruit development and ripening. Plant Physiol. Biochem. 2016, 104, 294–303. [Google Scholar] [CrossRef]
  75. Tolin, S.; Arrigoni, G.; Trentin, A.R.; Veljovic-Jovanovic, S.; Pivato, M.; Zechman, B.; Masi, A. Biochemical and quantitative proteomics investigations in Arabidopsis ggt1 mutant leaves reveal a role for the gamma-glutamyl cycle in plant’s adaptation to environment. Proteomics 2013, 13, 2031–2045. [Google Scholar] [CrossRef]
  76. Destro, T.; Prasad, D.; Martignago, D.; Lliso Bernet, I.; Trentin, A.R.; Renu, I.K.; Ferretti, M.; Masi, A. Compensatory expression and substrate inducibility of γ-glutamyl transferase GGT2 isoform in Arabidopsis thaliana. J. Exp. Bot. 2011, 62, 805–814. [Google Scholar] [CrossRef]
  77. Shi, H.-Y.; Li, Z.-H.; Zhang, Y.-X.; Chen, L.; Xiang, D.-Y.; Zhang, Y.-F. Two pear glutathione S-transferases genes are regulated during fruit development and involved in response to salicylic acid, auxin, and glucose signaling. PLoS ONE 2014, 9, e89926. [Google Scholar] [CrossRef]
  78. Pechanova, O.; Pechan, T.; Williams, W.P.; Luthe, D.S. Proteomic analysis of the maize rachis: Potential roles of constitutive and induced proteins in resistance to Aspergillus flavus infection and aflatoxin accumulation. Proteomics 2011, 11, 114–127. [Google Scholar] [CrossRef]
  79. Vaish, S.; Gupta, D.; Mehrotra, R.; Mehrotra, S.; Basantani, M.K. Glutathione S-transferase: A versatile protein family. 3 Biotech 2020, 10, 321. [Google Scholar] [CrossRef]
  80. Wei, M.; Ge, Y.; Li, C.; Han, X.; Qin, S.; Chen, Y.; Tang, Q.; Li, J. G6PDH regulated NADPH production and reactive oxygen species metabolism to enhance disease resistance against blue mold in apple fruit by acibenzolar-S-methyl. Postharvest Biol. Technol. 2019, 148, 228–235. [Google Scholar] [CrossRef]
  81. Bradfield, M.F.; Nicol, W. The pentose phosphate pathway leads to enhanced succinic acid flux in biofilms of wild-type Actinobacillus succinogenes. Appl. Microbiol. Biotechnol. 2016, 100, 9641–9652. [Google Scholar] [CrossRef]
  82. Guo, X.-H.; Yan, H.; Zhang, Y.; Yi, W.; Huang, S.-X.; Liu, Y.-S.; Wei, L. Kiwifruit (Actinidia chinensis ‘Hongyang’) cytosolic ascorbate peroxidases (AcAPX1 and AcAPX2) enhance salinity tolerance in Arabidopsis thaliana. J. Integrative Agric. 2022, 21, 1058–1070. [Google Scholar] [CrossRef]
  83. Alós, E.; Rodrigo, M.J.; Zacarías, L. Differential transcriptional regulation of L-ascorbic acid content in peel and pulp of citrus fruits during development and maturation. Planta 2014, 239, 1113–1128. [Google Scholar] [CrossRef]
  84. Zhang, C.; Huang, J.; Li, X. Transcriptomic analysis reveals the metabolic mechanism of L-ascorbic acid in Ziziphus jujuba Mill. Front. Plant Sci. 2016, 7, 172973. [Google Scholar] [CrossRef]
  85. Abdelgawad, F.K.; El-Mogy, M.M.; IA Mohamed, M.; Garchery, C.G.; Stevens, R. Increasing ascorbic acid content and salinity tolerance of cherry tomato plants by suppressed expression of the ascorbate oxidase gene. Agronomy 2019, 9, 51. [Google Scholar] [CrossRef]
  86. Fotopoulos, V.; Sanmartin, M.; Kanellis, A.K. Effect of ascorbate oxidase over-expression on ascorbate recycling gene expression in response to agents imposing oxidative stress. J. Exp. Bot. 2006, 57, 3933–3943. [Google Scholar] [CrossRef]
Figure 1. Dynamic changes in mango fruit pulp during 2021–2022 and 2022–2023, respectively. The graphs illustrate the following parameters: (a) TSS, (b) TA, and (c) TSS/TA. Different letters indicate significant differences during the growth periods (p ≤ 0.05).
Horticulturae 10 00694 g001
Figure 2. Dynamic changes in mango fruit pulp during 2021–2022 and 2022–2023. The graphs illustrate the following parameters: (a) MDA and (b) RC. Different letters indicate significant differences during the growth periods (p ≤ 0.05).
Horticulturae 10 00694 g002
Figure 3. Dynamic changes in mango fruit pulp during 2021–2022 and 2022–2023. The graphs illustrate the following parameters: (a) H2O2, (b) O2, and (c) OH contents. Different letters indicate significant differences during the growth periods (p ≤ 0.05).
Horticulturae 10 00694 g003
Figure 4. Dynamic changes in mango fruit pulp during 2021–2022 and 2022–2023. The graphs illustrate the following parameters: (a) GSH and (b) AsA. Different letters indicate significant differences during the growth periods (p ≤ 0.05).
Horticulturae 10 00694 g004
Figure 5. Dynamic changes in the enzymatic activity of GSH; mango fruit pulp during 2021–2022 and 2022–2023. The graphs illustrate the following parameters: (a) Glutathione peroxidase (GPX), (b) gamma-glutamyl transferase (GGT), (c) glutathione transferases (GST), and (d) glucose-6-phosphate dehydrogenase (G6PD). Different letters indicate significant differences during the growth periods (p ≤ 0.05).
Horticulturae 10 00694 g005
Figure 6. Dynamic changes in the enzymatic activity of mango fruit pulp during 2021–2022 and 2022–2023. The graphs illustrate the following parameters: (a) APX and (b) AO. Different letters indicate significant differences during growth (p ≤ 0.05).
Horticulturae 10 00694 g006
Figure 7. (a) Bar plot of DEGs from the comparisons of 30 vs. 60 DAF, 30 vs. 90 DAF, and 60 vs. 90 DAF. (b) Venn diagrams illustrate commonly expressed genes across comparisons of 30 vs. 60 DAF, 30 vs. 90 DAF, and 60 vs. 90 DAF. (c) This figure presents a Multidimensional Scaling (MDS) analysis. The dots of different colors and shapes represent different samples of specimens. The scales of the horizontal and vertical coordinates reflect the relative distances between the samples.
Horticulturae 10 00694 g007
Figure 8. GO annotated classification histogram of differential genes. The results were summarized in three main categories: biological process, cellular component, and molecular function. The horizontal axis is the functional classification, and the vertical axis is the number of genes in the classification (right) and their percentage of the total number of genes on the annotation (left).
Horticulturae 10 00694 g008
Figure 9. Encyclopedia of genes and genomes (KEGG) enrichment analysis of DEGs in mango. (a) KEGG enrichment pathways of 30 vs. 60 DAF, (b) KEGG enrichment pathways of 30 vs. 90 DAF, (c) KEGG enrichment pathways of 60 vs. 90 DAF. The y-axis indicates the KEGG metabolic pathway. The x-axis indicates the number of genes annotated to the pathway.
Horticulturae 10 00694 g009
Figure 10. KEGG metabolic pathway illustrates the differentially expressed genes involved in the glutathione (GSH) metabolism pathway. In this diagram, the relative expression levels were indicated by distinct colours. Upregulated genes are represented in red, with a deeper red colour indicating a higher level of upregulation. Conversely, down-regulated genes are shown in green, with a deeper green colour indicating a higher level of downregulation. Non-differentially expressed genes are marked in yellow, signifying no significant change in expression levels between the samples.
Horticulturae 10 00694 g010
Figure 11. KEGG metabolic pathway illustrates the differentially expressed genes involved in the ascorbic acid (AsA) metabolism pathway. In this diagram, the relative expression levels were indicated by distinct colours. Upregulated genes are represented in red, with a deeper red colour indicating a higher level of upregulation. Conversely, downregulated genes are shown in green, with a deeper green colour indicating a higher level of downregulation. Non-differentially expressed genes are marked in yellow, signifying no significant change in expression levels between the samples.
Horticulturae 10 00694 g011
Figure 12. Differential gene heatmap based on log2 (fold change) depict gene expression patterns and comparisons in GSH and AsA metabolism pathways, offering insights into mango response to dynamic changes over time. Each row represents a gene, and each column represents a comparison group, red indicates upregulated expression, and green indicates downregulated expression.
Horticulturae 10 00694 g012
Figure 13. Comparison of RT-qPCR and RNA-seq data of Seven DEGs identified through RNA sequencing. The left y-axis represents relative gene expression levels measured by RT-qPCR (2−∆∆Ct), while the right y-axis indicates the FPKM values obtained from RNA-seq in mango samples in the year (2022–2023).
Horticulturae 10 00694 g013
Disclaimer/Publisher’s Note: The statements, opinions and data contained in all publications are solely those of the individual author(s) and contributor(s) and not of MDPI and/or the editor(s). MDPI and/or the editor(s) disclaim responsibility for any injury to people or property resulting from any ideas, methods, instructions or products referred to in the content.

