Article

Optimization of Extraction Method of Bioactive Compounds from Elderberries (Sambucus nigra L.) and Testing Extract Stability

by
Oana-Elena Pascariu
1,*,
Luís Guimarães Dias
2 and
Florentina Israel-Roming
1
1
Faculty of Biotechnologies, University of Agronomic Sciences and Veterinary Medicine of Bucharest, 59 Mărăști Blvd, District 1, 011464 Bucharest, Romania
2
Centro de Investigação de Montanha (CIMO), Instituto Politécnico de Bragança, 5300-253 Bragança, Portugal
*
Author to whom correspondence should be addressed.
Horticulturae 2024, 10(7), 743; https://doi.org/10.3390/horticulturae10070743
Submission received: 7 June 2024 / Revised: 8 July 2024 / Accepted: 12 July 2024 / Published: 15 July 2024
(This article belongs to the Special Issue Bioactive Compounds in Horticultural Plants—2nd Edition)

Abstract

:
Phenolic compounds from elderberries (Sambucus nigra L.) have attracted attention due to their potential health benefits. This paper examines different extraction methods used to obtain phenolic compounds from these fruits and the stability of the extracts. Several extraction techniques (extraction with continuous agitation, ultrasound-assisted extraction, microwave-assisted extraction, maceration, and enzyme-assisted extraction) were tested and compared to evaluate the yield and the quality of the extracts. The stability of the extracts with various storage parameters (time and temperature) and processing conditions (concentration and lyophilization) was also investigated. The results showed that ultrasound-assisted extraction (UAE) provided the highest yield of total phenolic compounds (74.89 mg GAE/g), of which 71.23% were represented by total anthocyanins and 62.50% by monomeric anthocyanins, with total flavonoids of 8.11–9.41 mg RUE/g. The analysis of individual phenolic compounds reconfirms the efficiency of UAE, obtaining 0.42–0.09 mg/g gallic acid, 0.59–0.01 mg/g chlorogenic acid, 0.17–0.03 mg/g 4-coumaric acid, and 2.43–0.01 mg/g rutin. The optimization of the extraction conditions led to the conclusion that the best solvent is 45% ethanol (v/v), and the optimal parameters are 40 °C for 40 min. It was also found that the stability of the extracts can be high during long periods of time (even after 180 days). These findings contribute to the understanding of the optimization of extraction processes and storage conditions to obtain extracts rich in phenolic compounds from elderberries, with potential uses in pharmaceutical and food applications.

Graphical Abstract

1. Introduction

Medicinal plants are a rich source of bioactive compounds that have positive effects on human and animal health: phenolic compounds, alkaloids, terpenoids (isoprenoids), glycosides, saponins, vitamins, and minerals. Phenolic compounds are one of the most important categories of bioactive compounds. There are numerous studies in which the content of phenolic compounds is correlated with the antioxidant capacity of plants [1,2]. According to recent research, dark-colored fruits like berries can reduce stress and the risk of cardiovascular disease and hypertension, slow down the aging process, and strengthen defenses against infections [3,4]. These fruits are rich in phenolic acids and flavonoids, particularly anthocyanins, which may play a significant role in a healthy diet [5]. These substances exhibit antioxidant action in vivo, proven for humans [6,7] or rats [8,9,10]. There are many pharmacologically active compounds in the category of phenolic compounds, and flavonoids are the most important. Flavonoids are found in large amounts in plants and are involved in processes such as plant pigmentation, antioxidant capacity, protection against biotic and abiotic stress, and plant–environment interactions. Anthocyanins are compounds that belong to the category of flavonoids, responsible for the orange, red, and blue colors of plants [11].
Sambucus nigra L. (Adoxaceae family) is a plant native to the northern hemisphere that can be found in the wild flora of Europe, including Romania, where it grows in abundance. The plant produces elderberries (EDBs), which contain a large amount of phenolic compounds that can have a positive impact on human health. Among the positive effects studied are antioxidant capacity [2,12,13]; antibacterial [14,15], antiviral [16,17,18], and anticancer effects [19]; and antidiabetic properties [20,21,22]. For this reason, EDBs have been used for preventive or curative treatments in traditional medicine and in the pharmaceutical and cosmetic industries [23,24,25]. Moreover, EDBs are also used in the food industry, but on a small scale, especially in Romania. Existing studies show that some food products prepared with EDBs have kept an important part of the bioactive compounds in the final product. The food products obtained are juice, tea, liquor, spread [26], wine [27], dairy products [28,29], and meat products [30,31].
EDBs have a complex chemical composition that varies depending on many variables, including cultivar, location, ripening stage, and climate [32]. In the mature fruits of Sambucus nigra, the most important phenolic compounds are mainly anthocyanin derivatives: cyanidin 3-glucoside, cyanidin 3-sambubioside, cyanidin 3-rutinoside, cyanidin 3-sambubioside-5-glucoside, and cyanidin 3,5-diglucoside [13,33,34,35]. Because anthocyanins are unstable substances, processing conditions, particularly temperature, are crucial for products containing EDBs. Additionally, their application as food colorants is limited since the pH value affects their stability, structure, and color [33,36]. In the case of obtaining EDB extracts, too high temperatures can cause a decrease in the extraction yield of anthocyanins, being thermally unstable compounds [37]. It was discovered that the sample pre-treatment had a significant impact on the anthocyanin concentration. Anthocyanins break down quickly during the drying process, and afterwards, there is a marked drop in anthocyanin level. For this reason, freezing EDBs is preferable than drying them for storage [38,39].
In order to use phenolic compounds from EDBs in several categories of products, it is necessary to obtain fruit extracts. There are many factors that must be controlled in the extraction process, because plant matrices are complex, containing several metabolites that can decrease the extraction yield of phenolic compounds. To enhance the yield of bioactive molecule extraction, it is necessary to optimize the process. Among the most important factors are the extraction method, the solvent composition, the temperature, and the extraction time [40,41].
This study followed an experimental design to optimize the extraction of compounds with biological activity (especially phenolic compounds) in order to exploit EDBs. Moreover, it aimed to increase the extraction yield and decrease the extraction costs. Since phenolic compounds are unstable substances, the compositional changes that occur following the processes of concentration, lyophilization, and storage in different temperature conditions at several time intervals were observed.

2. Materials and Methods

2.1. Plant Material

Fruits of Sambucus nigra subsp. nigra were harvested at the fully ripened stage (based on the dark-violet color) from the wild flora of the north-eastern part of Romania (46°51′55″ N 26°54′48″ E) at the end of August 2022. In the area where these plants grow, the soil is of the chernozem type. During the fruit ripening period, the climatic conditions were characterized by maximum temperatures of 28–31 °C and nighttime minimum temperatures of 15–18 °C. In general, the weather was predominantly sunny with rare and isolated precipitations. After harvesting, EDBs were separated from pedicels and unripe, over-ripe, and dry berries; stored in plastic bags; and frozen at −18 °C. Frozen plant material was lyophilized for 48 h at −50 °C and 0.01 mbar to a water percentage of 5.4% using a laboratory freeze dryer (Labconco freeze-dry system, Kansas City, MO, USA). Lyophilized EDBs were ground and stored in glass containers at room temperature in the dark until the subsequent studies were carried out.

2.2. Chemical and Reagents

HPLC-grade ethanol (Sigma-Aldrich, St. Louis, MO, USA; Merck KGaA, Darmstadt, Germany) and acetonitrile (Merck KGaA, Darmstadt, Germany); analytical-grade substances: citric acid–disodium phosphate buffer, Na2CO3, CH3COONa, AlCl3, and KCl; standards: Folin–Ciocalteu reagent (Merck KGaA, Darmstadt, Germany), rutin (United States Pharmacopeia, North Bethesda, MD, USA), orthophosphoric acid (Sigma-Aldrich, Buchs, Switzerland), gallic acid (Sigma-Aldrich, Switzerland), chlorogenic acid (Sigma-Aldrich, Switzerland), caffeic acid (Sigma-Aldrich, Switzerland), syringic acid (Sigma-Aldrich, Switzerland), 4-coumaric acid (Sigma-Aldrich, Switzerland), and rutin (Sigma-Aldrich, Switzerland); commercial enzyme products: Ronozyme VP (DSM Nutritional Products, Heerlen, The Netherlands), Ronozyme WX (CT) (DSM Nutritional Products, Heerlen, The Netherlands), Pectinex (Schweizerische Ferment, A.G., Basel, Switzerland), Ultrazyme (Ciba-Geigy A.G., Basel, Switzerland), and CelluPract (BIOPRACT, Berlin, Germany).

2.3. Extraction Methods

The following aspects were taken into account in choosing the methods of extraction of bioactive compounds: the biological material on which we carried out the experiments (phenolic compounds from fruits are not difficult to extract, in general), the simplicity of the method and obtaining high extraction yields, the possibility of applying the method at an industrial level, the costs, and the impact on the environment, which should be as low as possible. The choice of extraction method consisted in testing five methods: extraction with continuous agitation (AE), ultrasound-assisted extraction (UAE), microwave-assisted extraction (MAE), maceration extraction (ME), and enzyme-assisted extraction (EAE). The same sample/solvent ratio and ethanol percentage were used for all the tested methods. The extraction parameters were established based on data from the scientific literature [42,43,44,45,46,47,48,49], with some modifications for experimental purposes. This resulted in 18 extracts, as shown in Figure 1. All the obtained samples were subsequently filtered using Whatman filter paper (Sigma-Aldrich, Merck KGaA, Darmstadt, Germany) and stored at a temperature of 2–4 °C for chemical analyses.

2.3.1. Extraction with Continuous Agitation (AE)

The plant sample (250 mg) was extracted with 25 mL of 60% ethanol (v/v) using a shaker (Heidolph Unimax 1010 DT, Schwabach, Germany) at 40 °C for 30 min.

2.3.2. Extraction Assisted by Ultrasounds (UAE)

The plant sample (250 mg) was extracted with 25 mL of 60% ethanol (v/v) using an ultrasonic bath (Bransonic ultrasonic cleaner 1510E-DTH, London, United Kingdom) at 70 watts and a frequency of 42 kHz at 40 °C for 20, 30, and 40 min.

2.3.3. Extraction Assisted by Microwaves (MAE)

The plant sample (250 mg) was extracted with 25 mL of 60% ethanol (v/v) using a microwave oven for 5, 10, and 15 s at 450 W power and 5, 10, and 15 s at 600 W power.

2.3.4. Maceration (ME)

The plant sample (250 mg) was extracted with 25 mL of 60% ethanol (v/v) at room temperature (approximately 22 °C) for 24, 48, and 72 h.

2.3.5. Enzyme-Assisted Extraction (EAE)

For the EAE, five commercial enzyme products were used: Ronozyme VP, Ronozyme WX (CT), Pectinex, Ultrazyme, and CelluPract. These products contain enzymes (cellulases, xylanases, and pectinases) involved in the hydrolysis of sugars, which may interfere in the process of extraction of bioactive compounds. According to the manufacturers, Ronozyme VP is a product obtained with Aspergillus aculeatus, and it contains endo-1,3(4)-beta-glucanase, having an enzymatic activity of 50 fungal β-glucanase units per gram (FBG/g). Ronozyme WX originates from Aspergillus oryzae; it contains endo-1,4-beta-xylanase, having a concentration of 1000 fungal xylanase units per gram (FXU/g). Pectinex is produced by a selected strain of Aspergillus aculeatus. Ultrazyme is a liquid product of pectinase preparation that is purified, concentrated, and standardized. In the case of the last two enzyme preparations, the manufacturers only specify the dosage of the products. Pectinex and CelluPract are enzyme preparations used in the food industry for pectin extraction or in the clarification of fruit juices [50]. The other enzyme preparations are often used in the feed manufacturing industry. For enzyme-assisted extractions, these commercial products were added to 360 mg of EDBs suspended in 20 mL of pH 5 citric acid–disodium phosphate buffer (citric acid, 0.1 M; disodium phosphate, 0.2 M). Each enzyme was tested in triplicate, and two control samples were also prepared (C1, obtained by applying the parameters used for UAE3, and C2, obtained by applying the parameters for EAE, but without enzyme). The mixtures were incubated for 2 h at 50 °C in a thermostatically controlled shaker at 200 rpm. Enzyme reaction was stopped by immersing the tubes in boiling water for 2 min, followed by fast cooling in ice water. The next step was the addition of ethanol to obtain a solvent with 60% ethanol (v/v) and keep the sample/solvent ratio from the other extractions. The mixtures were placed in an ultrasonic bath at 40 °C for 40 min. Afterwards, the mixtures were centrifuged (Hettich EBA 21,Tuttlingen, Germany) at 6000 rpm for 10 min and filtered using Whatman filter paper. The obtained extracts were stored at a temperature of 4 °C for subsequent analysis. After testing the 5 types of enzyme preparations and choosing the most effective one, the next step was testing the preparation for extraction at different pH values (2.0, 2.5, 3.0, 4.0, 4.5, 5.0, 5.5, 6.0, and 7.0) using the citric acid–disodium phosphate buffer (citric acid, 0.1 M; disodium phosphate, 0.2 M). The incubation and extraction procedures are as described above.

2.4. Optimization of Extraction Parameters

In order to establish the optimal extraction parameters, the effect of three chosen independent variables (temperature, concentration, and time of extraction) on the total phenolic content (TPC) of EDBs was assessed by the Response Surface Methodology (RSM). The primary objective of the experiment was to maximize the total phenolic content in the extract to obtain the optimal extraction parameters by assuming that a higher total phenolic content correlates with the desired properties or benefits of the extract (e.g., antioxidant activity, health benefits). The ranges of ethanol concentration (%), temperature (°C), and time (minutes) are presented in Table 1 and were selected based on several studies in which similar extractions were carried out [47,48,49]. The model was composed of a total of 32 design points. Each extraction was performed by using 250 mg of lyophilized EDBs extracted in a 25 mL hydroalcoholic solvent using the UAE method. The extracts were centrifuged, filtered using Whatman filter paper, and analyzed trice.

2.5. Effects of Concentration, Lyophilization, and Storage on EDB Extracts

The optimal extraction conditions, as determined by the RSM model, were applied in combination with the ultrasound-assisted method to test the stability of the extract. A rotary evaporator (Buchi Labortechnik Switzerland R-215 rotavapor, vacuum controller V-850) was used for the concentration of the extract. Concentrated EDB extract samples kept in the refrigerator (CER) and in the freezer (CEF) and unconcentrated EDB extract samples kept in the refrigerator (UER) and in the freezer (UEF) were tested from time to time (0, 15, 30, 60, and 180 days). A part of the concentrated extract was frozen at −18 °C and then dried by lyophilization for 20 h. The lyophilized extract was stored in brown bottles at 2–4 °C until further analyses.

2.6. Chemical Profile

2.6.1. Total Phenolic Content (TPC)

The Folin–Ciocalteu method was used to determine TPC from the extracts obtained to choose the most efficient extraction method (extracts obtained in Section 2.3) and from the extracts obtained to optimize the extraction parameters (extracts obtained in Section 2.4). Additionally, the choice of the most effective pH range for EAE at which the richest extract in phenolic compounds was obtained was based just on the TPC analysis. In addition, TPC analysis allowed the observation of chemical changes that occur in the extracts during the process of extract concentration and storage at different temperatures over time (extracts obtained in Section 2.5). TPC was determined spectrophotometrically according to the methodology proposed by Singleton et al. [51] with modifications. In short, 100 µL of hydroalcoholic extract from each sample was analyzed, over which 6 mL of distilled water and 500 µL of Folin–Ciocalteu reagent were added. The mixture was homogenized and incubated for 8 min in the dark. Later, Na2CO3 (7.5%) and distilled water were added and homogenized. The mixture remained in the dark for 2 h at room temperature, and then its absorbance was measured at 765 nm using an UV–VIS spectrophotometer (SP-UV 1000 DLAB, Beijing, China). Gallic acid was used as a standard (R2 = 0.9991), and results were expressed as mg of gallic acid equivalent (GAE) per gram lyophilized EDBs or per gram dry weight (DW). All experiments were carried out in triplicate, and the result was expressed as the mean value of mg GAE/g ± standard deviation (SD).

2.6.2. Total Flavonoid Content (TFC)

The method was used to determine TFC from the extracts obtained in Section 2.3 and Section 2.5. TFC was measured with the colorimetric assay described by Pękal and Pyrzynska [52] with some modifications. One milliliter of sample was added to 4 mL of distilled water; then 5 mL of CH3COONa (10%) was added, homogenized, and filtered. From the resulting mixture, 2.5 mL was measured, over which AlCl3 (2.5%) was added. Immediately, the mixture was diluted by adding distilled water, homogenized, and left to incubate for 45 min in the dark. The absorbance was measured at 420 nm using a UV–VIS spectrophotometer, compared with a control in which the sample was replaced with distilled water. The standard solution was represented by rutin (R2 = 0.9996), and the results were expressed as mg rutin equivalents (RUEs) per gram lyophilized EDBs or gram DW. The sample was analyzed in triplicate, and the result was expressed as the mean value of mg RUE/g ± SD.

2.6.3. Total Anthocyanin Content (TAC) and Monomeric Anthocyanin Content (MAC)

The method was used to determine TAC and MAC from the extracts obtained in Section 2.3. The total anthocyanin content in EDBs was measured using the pH differential spectrophotometric method described by Lee et al. [53]. The EDB extract was placed in a 10 mL volumetric flask, diluted with 0.025 M KCl buffer (pH 1.0) and 0.4 M CH3COONa buffer (pH 4.5), with a pre-determined dilution factor. The absorbance was measured at 520 nm and 700 nm for each dilution using an UV–VIS spectrophotometer. The absorbance (A) of the diluted sample was then calculated as follows:
A = (Aλ520 − Aλ700)pH1 − (Aλ520 − Aλ700)pH4.5
TAC, expressed as cyanidin-3-glucoside (C3G) equivalents, was calculated as follows:
Total anthocyanin content = (A′ × MW × DF × 103)/(ε × 1)
MAC was calculated as follows:
Monomeric anthocyanidin content = (A × MW × DF × 103)/(ε × 1)
where A = ( A λ 520 A λ 700 ) p H 1 , the MW (molecular weight) of C3G = 449.2 g/mole, the DF (dilution factor) = 100, 103 is the factor conversion from g to mg, ε (the molar absorptivity of C3G) = 26,900 L × mol−1 × cm−1, and 1 (the pathlength) = 1 cm. Results are expressed as milligram cyanidin-3-glucoside equivalent (C3G) per gram lyophilized EDBs. The sample was analyzed in triplicate, and the result is expressed as the mean value of mg C3G/g ± SD.

2.6.4. Individual Polyphenol Content Detected by High-Performance Liquid Chromatography (HPLC)

The method was used to analyze the extracts obtained in Section 2.3 and Section 2.5. HPLC analysis was performed using a Waters 2695 Alliance system equipped with a quaternary pump, autosampler, and UV–VIS detector (WATERS 2487). Separation was achieved by reversed-phase chromatography with a 5 µm SunFire Column (3.9 × 150 mm). A binary elution gradient consisting of 0.5% orthophosphoric acid in ultrapure water (A) and acetonitrile (B) was used according to the following gradient: 90/10 as initial condition, changed to 75/35 at 25 min, changed to 10/90 at 40 min, held 10/90 for 5 min, changed to 90/10 at 45.10 min, and held 90/10 for 10 min. The column temperature was controlled at 40 °C, and the sample temperature at 20 °C. Chromatograms were acquired at a 300 nm wavelength. Prior to separation, the samples were appropriately diluted, and the injection volume was 10 µL. The identification of phenolic compounds was performed according to their retention times compared with those obtained by injecting the standard solutions (4.25 min for gallic acid, 9.66 min for chlorogenic acid, 12.13 min for caffeic acid, 12.95 min for syringic acid, 17.34 min for 4-coumaric acid, and 18.91 min for rutin). For analyte quantification, a sample peak area was processed using the calibration curves of the corresponding standards.

2.7. Statistical Analysis

The TPC, TFC, TAC, and MAC of the extracts were expressed as means ± SD. Paired Student’s t-tests were performed to determine whether there were significant differences (p < 0.05) between groups. In the optimization study for establishing the best procedure conditions for elderberry phenolic compound extraction, a Response Surface Methodology (RSM) was applied. Data processing was performed with R software (R version 3.3.2, 31 October 2016). The Response Surface Methodology was implemented by the R package RSM [54]. After defining the model, its adequacy was evaluated by checking the diagnostics and plots of the estimated response surface model by verifying the randomness and normality of the residuals; Cook’s distance (values greater than 1 are indicative that these are excessively influential in the model); the leverage values (values below 0.2 are acceptable, values between 0.2 and 0.5 are risky, and values higher than 0.5 indicate the presence of an influential value or outlier); the model’s p-value (to evaluate the significance of the model obtained using a significance level of 0.05); the determination coefficient value (R2, to verify the amount of variance explained by the model); and the relative standard error (rse, to confirm the magnitude of the model errors).

3. Results and Discussion

The chemical profile analysis consisted in testing TPC, TFC, TAC, and MAC for the extracts obtained in Section 2.3 to choose the most efficient extraction method. TPC analysis was also used to choose the most effective pH range for EAE, for which the richest extract in phenolic compounds was obtained. TPC analysis was also performed to optimize the extraction conditions (extracts obtained in Section 2.4). In addition, TPC and TFC analysis allowed the observation of chemical changes that occur in the extracts during the process of extract concentration, lyophilization, and storage over time at different temperatures (extracts obtained in Section 2.5).

3.1. Chemical Profile of the Extracts Obtained by Different Extraction Methods

3.1.1. Total Phenolic Content

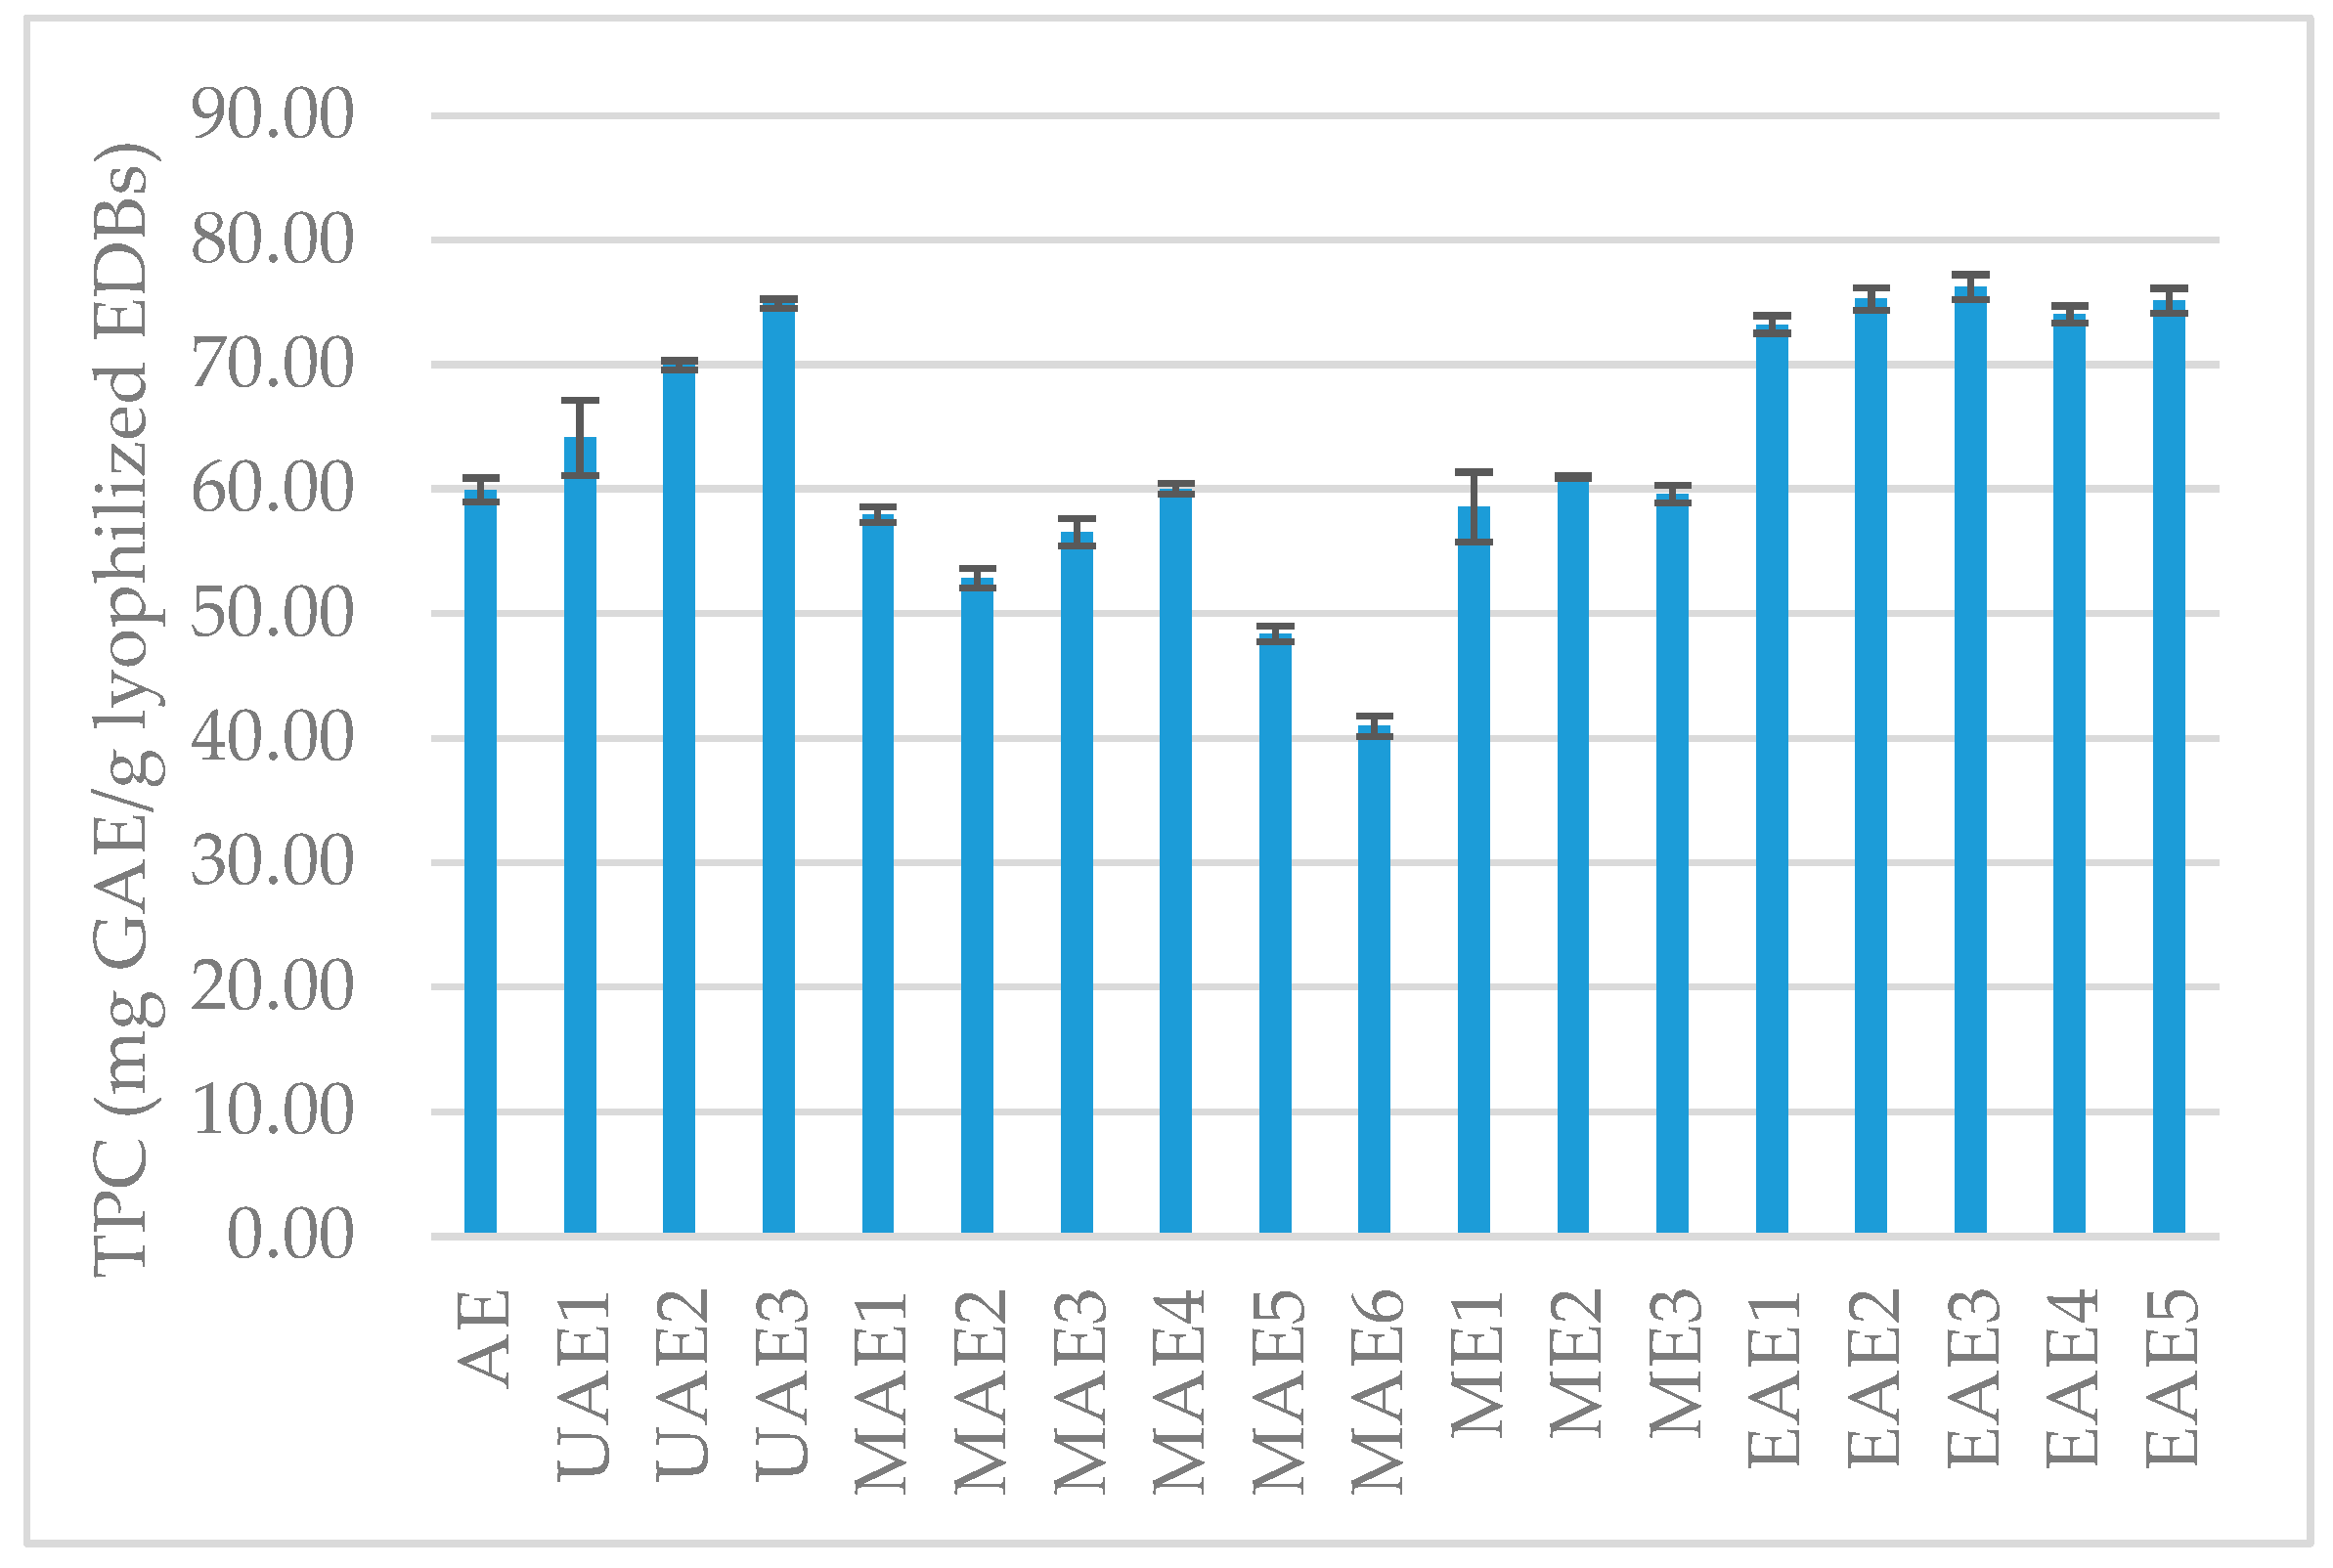
Following the extraction of bioactive compounds using the AE, UAE, MAE, and ME extraction methods, the highest values for TPC were obtained in the case of the UAE method (Figure 2) for all the three combinations of parameters (64.12 mg GAE/g for UAE1, 69.93 mg GAE/g for UAE2, and 74.89 mg GAE/g for UAE3). It has been reported that applying this technique can increase the extraction yield of phenolic compounds from different plant sources by up to 35% [55]. According to Oniszczuk et al. [49], ultrasonic-assisted extraction at 60 °C was the most effective technique for the extraction of phenolic compounds from functional foods that contain EDB extracts. According to dos Santos Nascimento et al. [48], the UAE ethanolic extracts of EDBs exhibited greater antioxidant activity than the fermented ones (p < 0.01); in fact, the UAE extracts were found to be two to five times more effective as antioxidants than the fermentation-derived ones. UAE may drop polyphenols’ molecular weight [56]. This is because ultrasonic waves have the power to produce strong mechanical and shear forces, which have the potential to break and degrade molecules. This can lower the average molecular weight of polyphenol molecules, which may enhance their bioavailability and facilitate digestion, absorption, and usage by a human organism. To increase the efficiency of extraction, UAE can be combined with other extraction techniques [57]. According to Tchabo et al. [58], when ultrasonic and enzyme-assisted extraction were combined, the yield was significantly higher than when each technique was used alone.
To avoid the degradation of heat-sensitive compounds (such as anthocyanins), we chose a temperature of 40 °C for the UAE and AE methods and different exposure times. In the case of the AE extract, the extraction yield decreased by 19.98% (59.93 mg GAE/g) compared with UAE3. For all the three variants of ME, the TPC values were almost similar and comparable with the value obtained for AE. It can also be observed that doubling or tripling the extraction time in the case of ME did not produce a significant increase in TPC, which proves the easy extraction in hydroalcoholic solutions. In the case of the MAE method, the best results were obtained for MAE4 (60.03 mg GAE/g). It can be observed that the MAE method led to the lowest values for TPC. This could be explained by the fact that some of the phenolic compounds are unstable substances at high temperatures. Microwave extraction leads to areas of overheating in the extract, determining the degradation of some phenolic compounds (especially anthocyanins) at high temperatures [59,60,61]. For the EAE extraction method, two control samples were used: C1, a control sample obtained using the extraction conditions applied for UAE3, because that extract had the highest value for TPC, and C2, a control sample for evaluating the effects of the additional steps applied for the enzymatic treatment. The value for C1 was 74.46 mg GAE/g, and C2 had 70.89 mg GAE/g, suggesting that a supplementary thermic treatment necessary for EAE led to a decrease in TPC. When coupling UAE with enzyme treatment extraction, high extraction efficacy was obtained for the EAE3 (76.22 mg GAE/g), EAE2 (75.27 mg GAE/g), and EAE5 (75.12 mg GAE/g) variants. Enzymes such as cellulases, hemicellulases, and pectinases are particularly effective in breaking down the cell wall components of fruits, facilitating the release of phenolic compounds. Cellulases break down cellulose into glucose units, increasing the cell wall permeability. Hemicellulases degrade hemicellulose, a major component of the cell wall matrix. Pectinases hydrolyze pectin, which binds the plant cells together, leading to cell wall degradation and easier release of phenolic compounds. The increased extraction yield is based on the activity of pectinases contained in a Pectinex product (EAE3), as well as xylanases in Ronozyme WX (EAE2). It seems that using cellulases does not result in an improved extraction yield, because TPC was lower for EAE1 (73.22 mg GAE/g) and EAE4 (74.03 mg GAE/g), but when the product contains also xylanases (EAE5), TPC is higher. The obtained results show that hydrolyzing pectin and hemicellulose may increase the extraction yield.
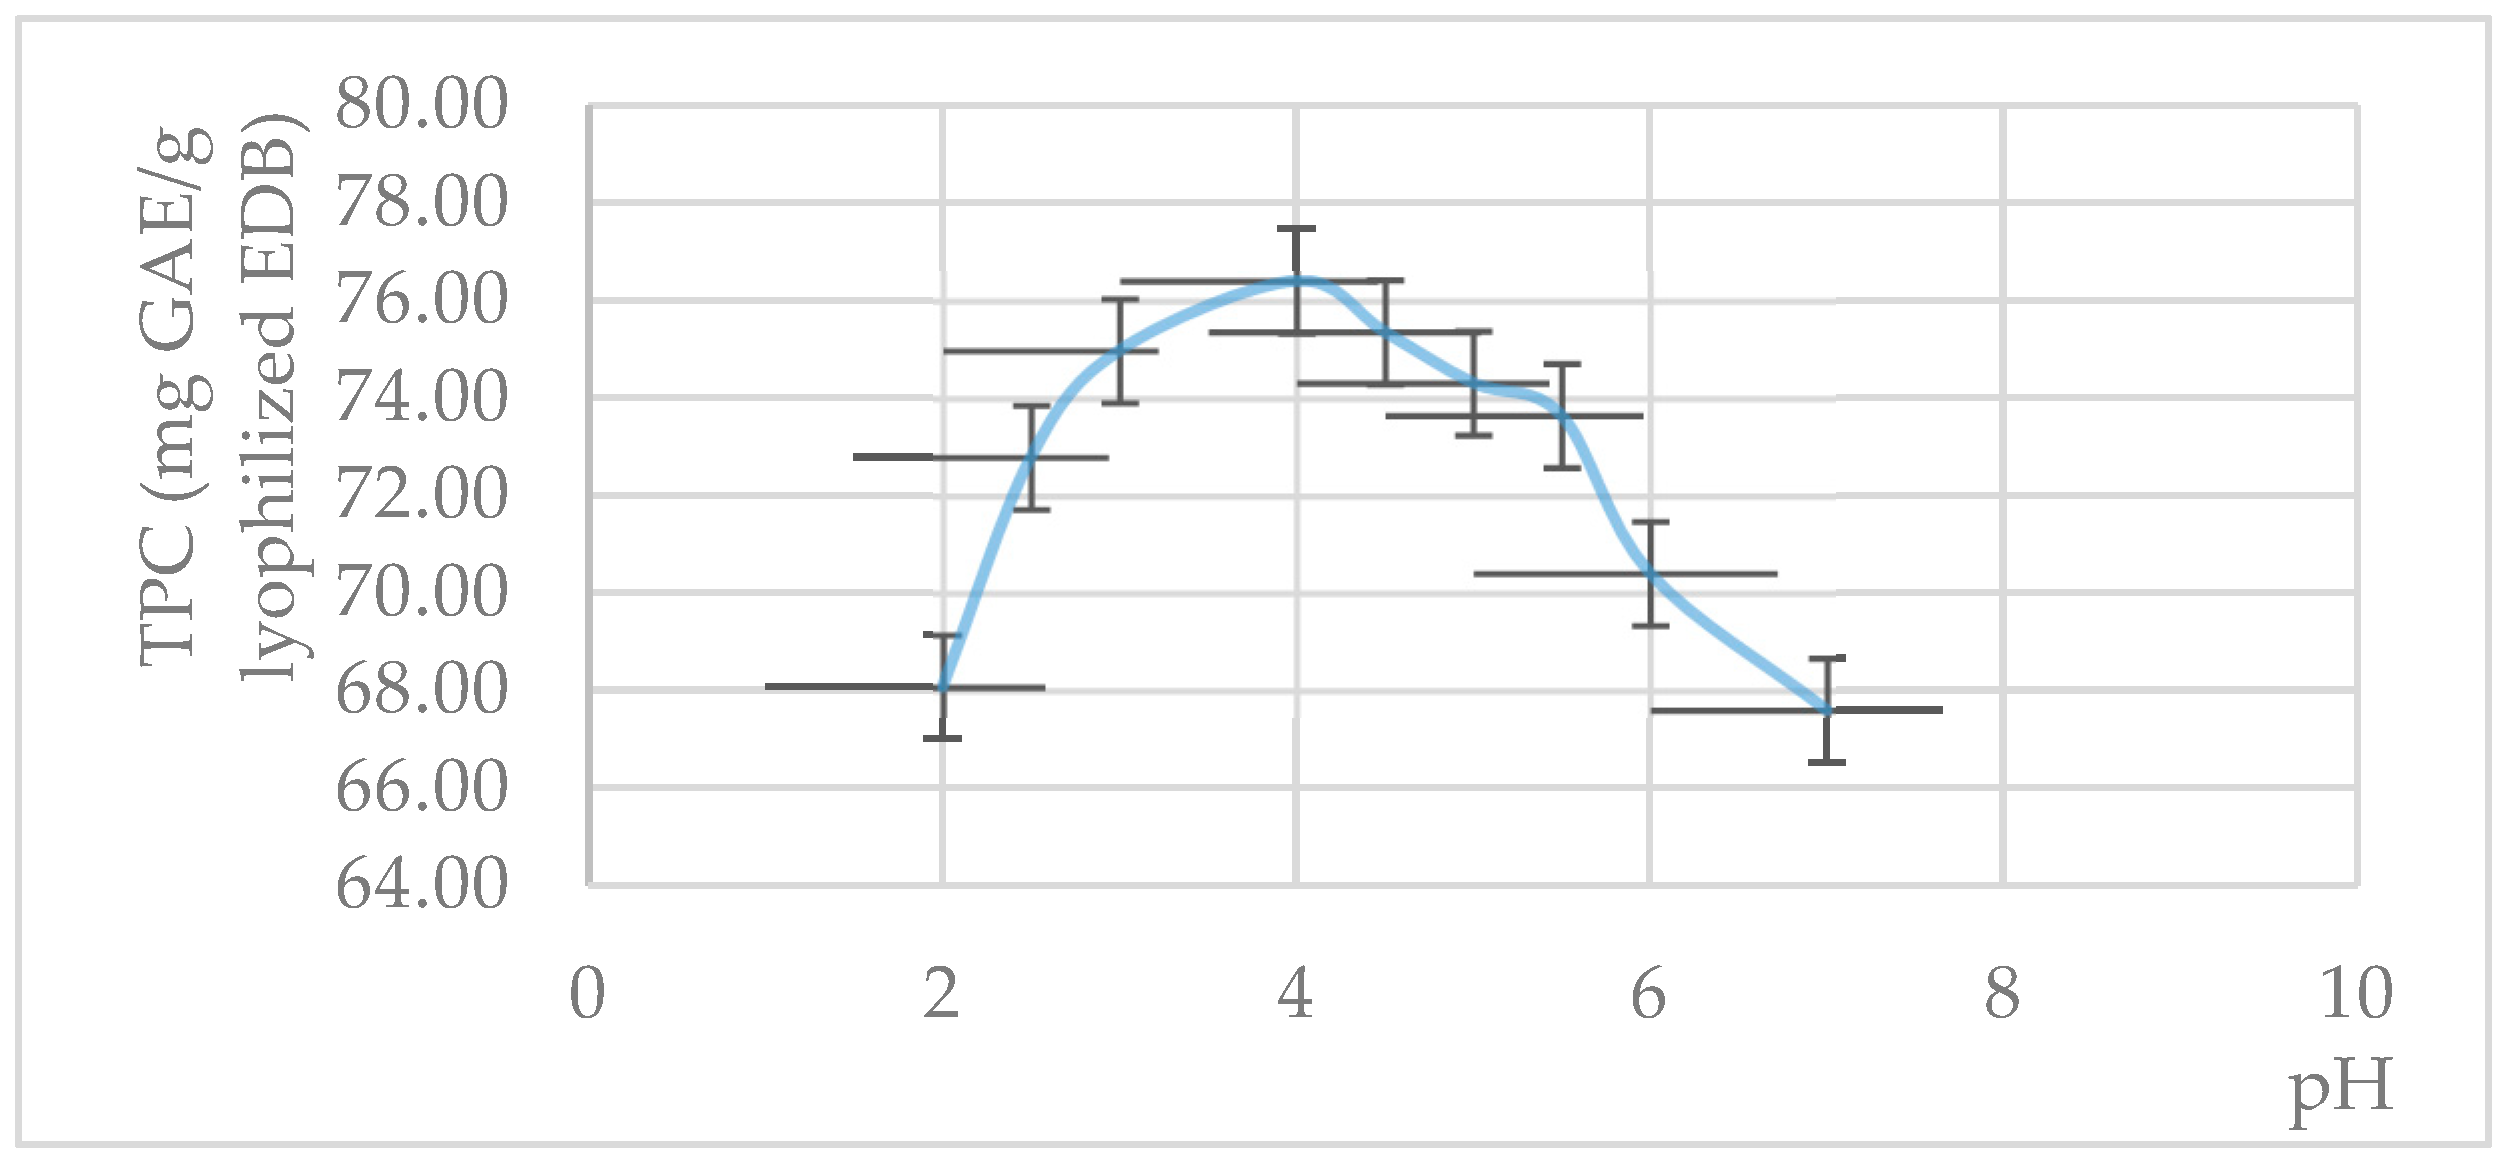
Performing extraction with a Pectinex enzyme preparation at different pH values (Figure 3), the best results were obtained in the pH range 3–4.5 (74.98–75.36 mg GAE/g). An explanation for these results can be the fact that the maximum enzymatic activity of the polygalacturonase from Pectinex (obtained by biosynthesis with Aspergillus aculeatus) is in this pH range (the optimal pH is approximately 4) [62].
Another study [63] reported that, for the ultrasound-assisted extraction, the best extracts were obtained through extraction with 50% of ethanol at 40 °C and pH 7 (30.90 mg GAE/g), 60 °C and pH 2 (30.00 mg GAE/g), and 20 °C and pH 2 (29.94 mg GAE/g). The results reported in different papers show that the TPC in EDBs can vary greatly (5.16–89.74 mg GAE/g DW) [15,31,36,64], depending on many factors, such as climate, growth location, and the maturity stage of the fruits [31].

3.1.2. Total Flavonoid Content, Total and Monomeric Anthocyanin Content

When considering TFC (Figure 4), the best results were registered for UAE (8.11–9.41 mg RUE/g) and EAE (7.81–8.84 mg RUE/g), followed by AE (7.67 mg RUE/g). The results obtained for these categories of phenolic compounds can be correlated with the TPC values. Other studies showed that the TFC values for wild S. nigra were 9.57 ± 0.65 mg RUE/g DW [15] and 17.38–49.71 mg quercetin/g fresh weight [65]. Viapiana and Wesolowski [66] reported absolute values (2.60–4.49 mg/g DW) for extracts obtained by infusion. In our study, the content of TAC was between 59.72% and 72.04% of the TPC values for all extracts. The highest amounts of TAC and MAC were obtained for a UAE3 sample (53.35 mg C3G/g and 46.73 mg C3G/g, representing 71.23% and 62.50% of the TPC), followed by EAE samples (50.57–52.94 mg C3G/g and 40.03–48.02 mg C3G/g). It can be observed that, for EAE, TAC yields, compared with the amount of TPC, varied in large limits (59.72–70.48%). Therefore, some extracts obtained by EAE have high values for TPC, but the percentage of TAC related to TPC is lower than that for the UAE method. Similar yields were observed when applying MAE (67.54–71.63%, maximum for MAE4), but TPC was lower for this method. An explanation may be that EAE involves the use of a higher temperature for a longer period of time, while MAE is a process that is more difficult to control. Anthocyanins are thermally unstable phenolic compounds that can be affected during the extraction process. Reported data are contradictory: some of them show higher yields of anthocyanins extracted from grape skin peels by MAE [67], while others indicate that an increase in temperature and/or microwave exposure time may decrease the anthocyanins obtained from cherries [68]. High yields were obtained by ME, especially in the case of the ME1 sample (70.63%), but the highest values for TAC and MAC were for the ME2 sample (42.30 mg C3G/g and 37.05 mg C3G/g). Extending the extraction time determined a decrease in TAC yield for ME3 (68.18%). An explanation in this sense could be the instability of these compounds to factors such as oxygen. According to Dangles and Fenger [69], a combination of hydrolytic and autoxidative processes may cause the rupture of C2-C1′, C2-C3, and C3-C4 bonds, leading to the degradation of anthocyanins. Other studies showed very varied levels of anthocyanins, values of 4.08–10.67 mg CGE/g DW [45], 30.71 mg CGE for wild plants, and 46.38 mg CGE/g DW for orchard [64]. Therefore, the extraction of total flavonoids and anthocyanins was improved by the ultrasound treatment. Although the enzymatic method determined higher TPC values, on average, UAE allowed for obtaining higher yields of TAC compared with EAE (70.10% compared with 67.20%).
UAE can be considered better than MAE for anthocyanin extraction because it operates at lower temperatures, reducing the risk of thermal degradation of the compounds. The method provides a more precise control of the parameters and a higher yield through cavitation, which improves the release of active substances from the cells. Compared with ME and EAE, the UAE method accelerates the extraction through the cavitation process, and the short extraction time prevents the degradation of anthocyanins, offering a higher yield. Unlike EAE, which requires precise conditions and a long time to degrade cell walls, ultrasound provides better control and avoids thermal degradation. Additionally, the UAE method does not depend on the activity of enzymes; thus, it is more reliable and easier to apply in different conditions.
Considering the values obtained for TPC, TFC, TAC, and MAC, the extracts obtained with the best variant from each method (AE, UAE3, MAE1, ME2, and EAE3) were selected for the individual analysis of phenolic compounds using the HPLC method (Table 2). It can be observed that the sample UAE3 had the highest concentration of rutin. It is noteworthy that EAE presented a higher concentration of gallic acid. An explanation could be the fact that the enzymes released the gallic acid from the glycosidic structures. According to Zhang et al. [70], gallic acid degrades when exposed to ultrasonic radiation. Regarding chlorogenic acid, the results are comparable, with the exception of the EAE3 sample. It is possible that the enzymes acted on the ester-type chemical bonds, and caffeic acid resulted.
Taking into account all the good results obtained for the UAE3 extract (high values for TPC; highest values for TFC, TAC, and MAC; large amount of rutin, 4-coumaric acid, chlorogenic, and gallic acids), the UAE method was chosen for optimizing the extraction conditions (time, temperature, and solvent concentration) using RSM.

3.2. Optimization of the Extraction Parameters

The extraction costs, the time to obtain the extract, and the impact on the environment can be reduced by applying the optimal extraction parameters. The optimization of the extraction of the phenolic compounds from EDBs was studied based on RSM in an attempt to valorize these fruits. The efficacity of the different extraction variants was evaluated by the determination of TPC. In order to select optimal extraction conditions, the effects of three independent factors, namely, temperature (X1; 20, 40, and 60 °C), solvent concentration (X2; 10%, 45%, and 80% ethanol), and time (X3; 20, 40, and 60 min) on TPC (mg GAE/g) were determined. Table 3 shows 32 assays regarding the combination of three factors and three levels for each factor of extraction and the response (TPC). The TPC results indicated are average values and presented relative percentage standard deviations of less than 1%. The model is significant (p < 0.001) and justifies 88.48% of the data variability.
The significant terms of the model were X1, X2, and X22 and interaction X1 × X2 and X2 × X3.
The obtained model is TPC = 35 + 0.34 × X1 + 0.87 × X2 + 0.15 × X3 − 0.0079 × X12 − 0.0032 × X1 × X2 − 0.0019 × X2 × X3.
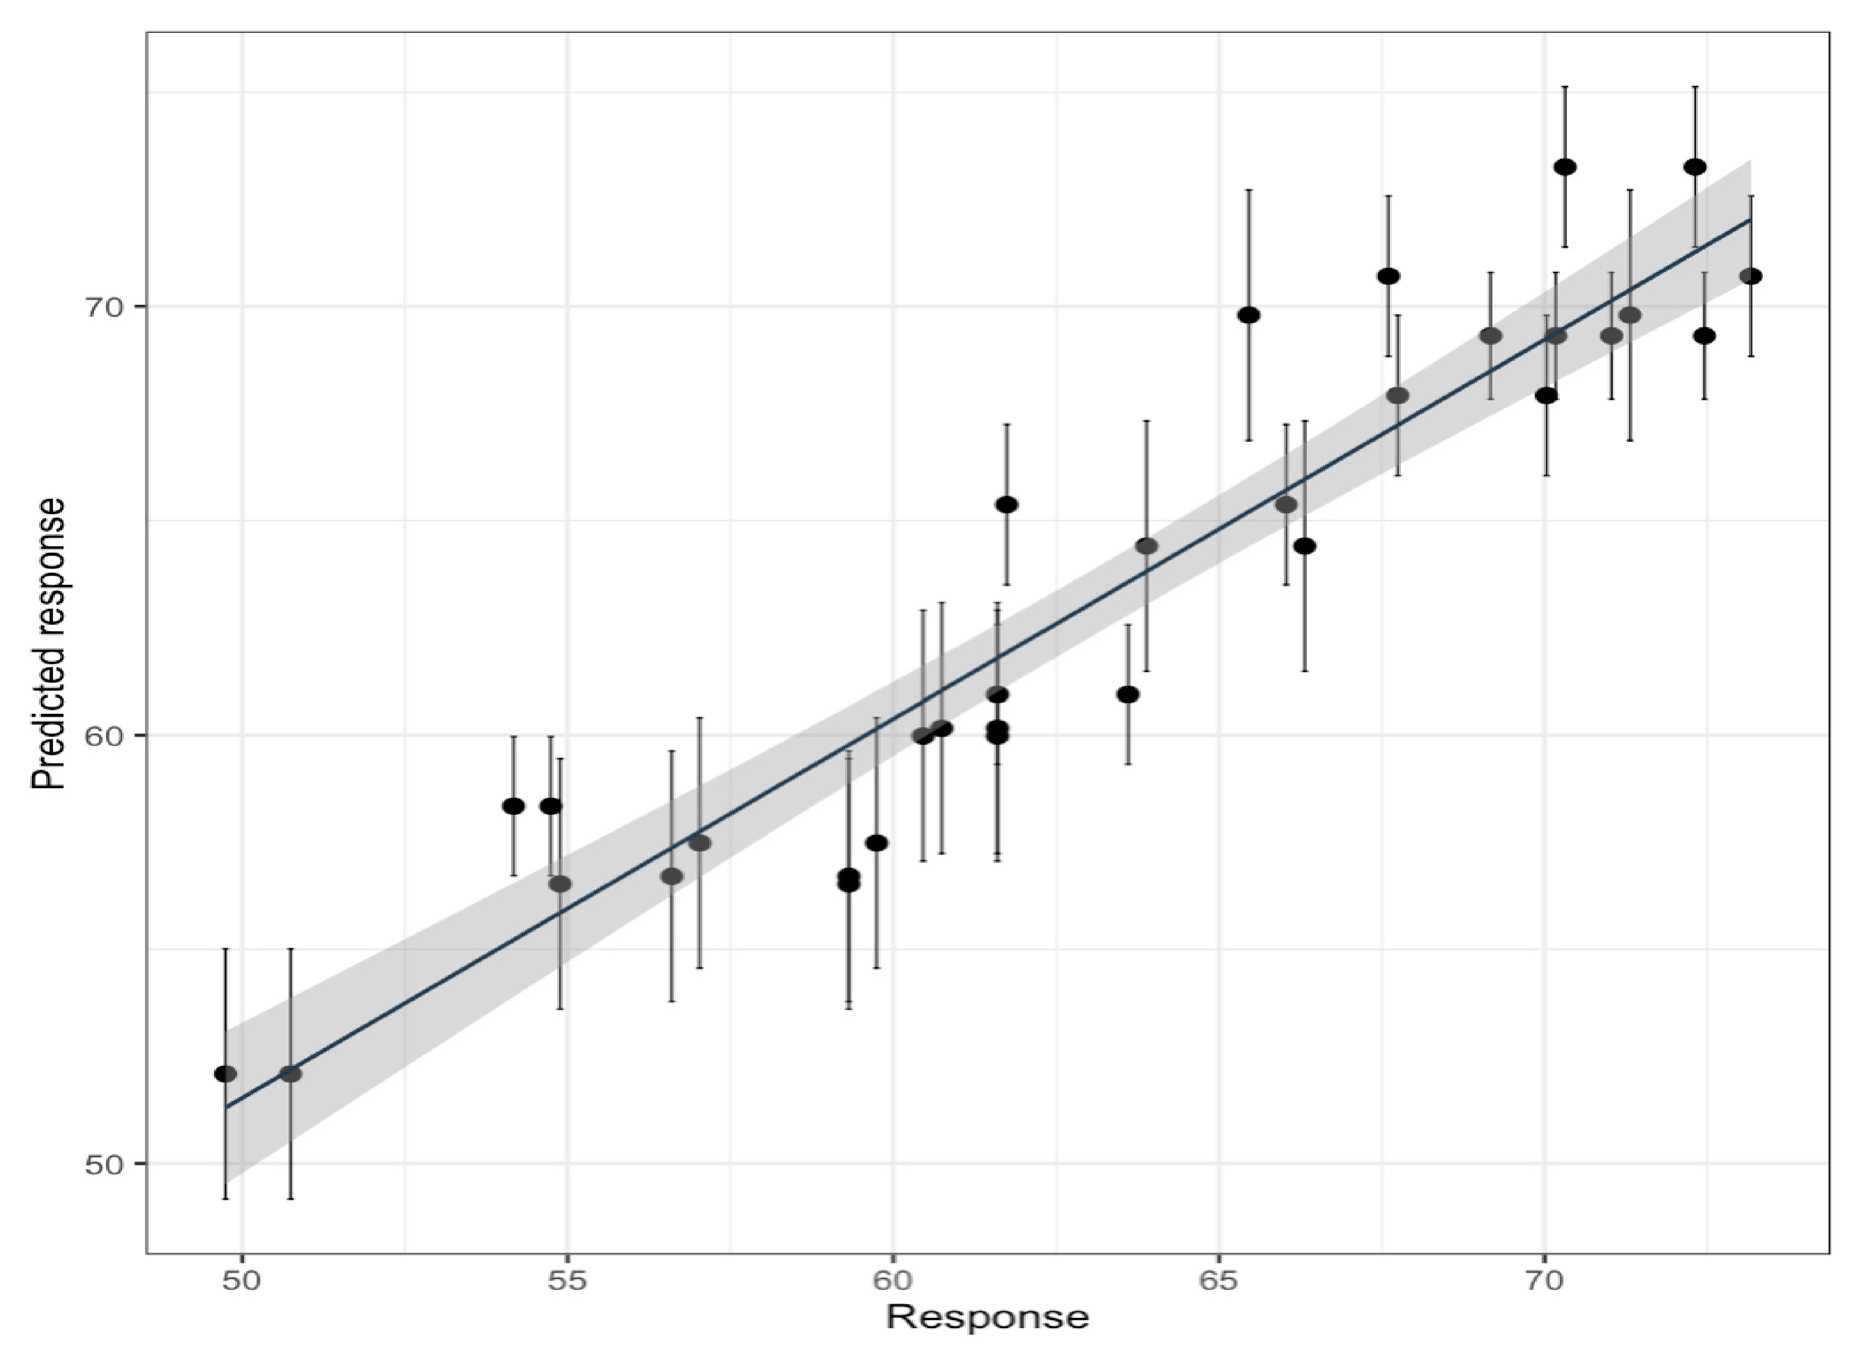
This model was considered adequate since the randomness and normality of the residuals were confirmed, Cook’s distance values showed that there were no present influential values in the model, and some leverage values were between 0.2 and 0.35, considered acceptable due to the variability shown in Figure 5. However, the statistically significant lack of fit had a p-value of 0.019.
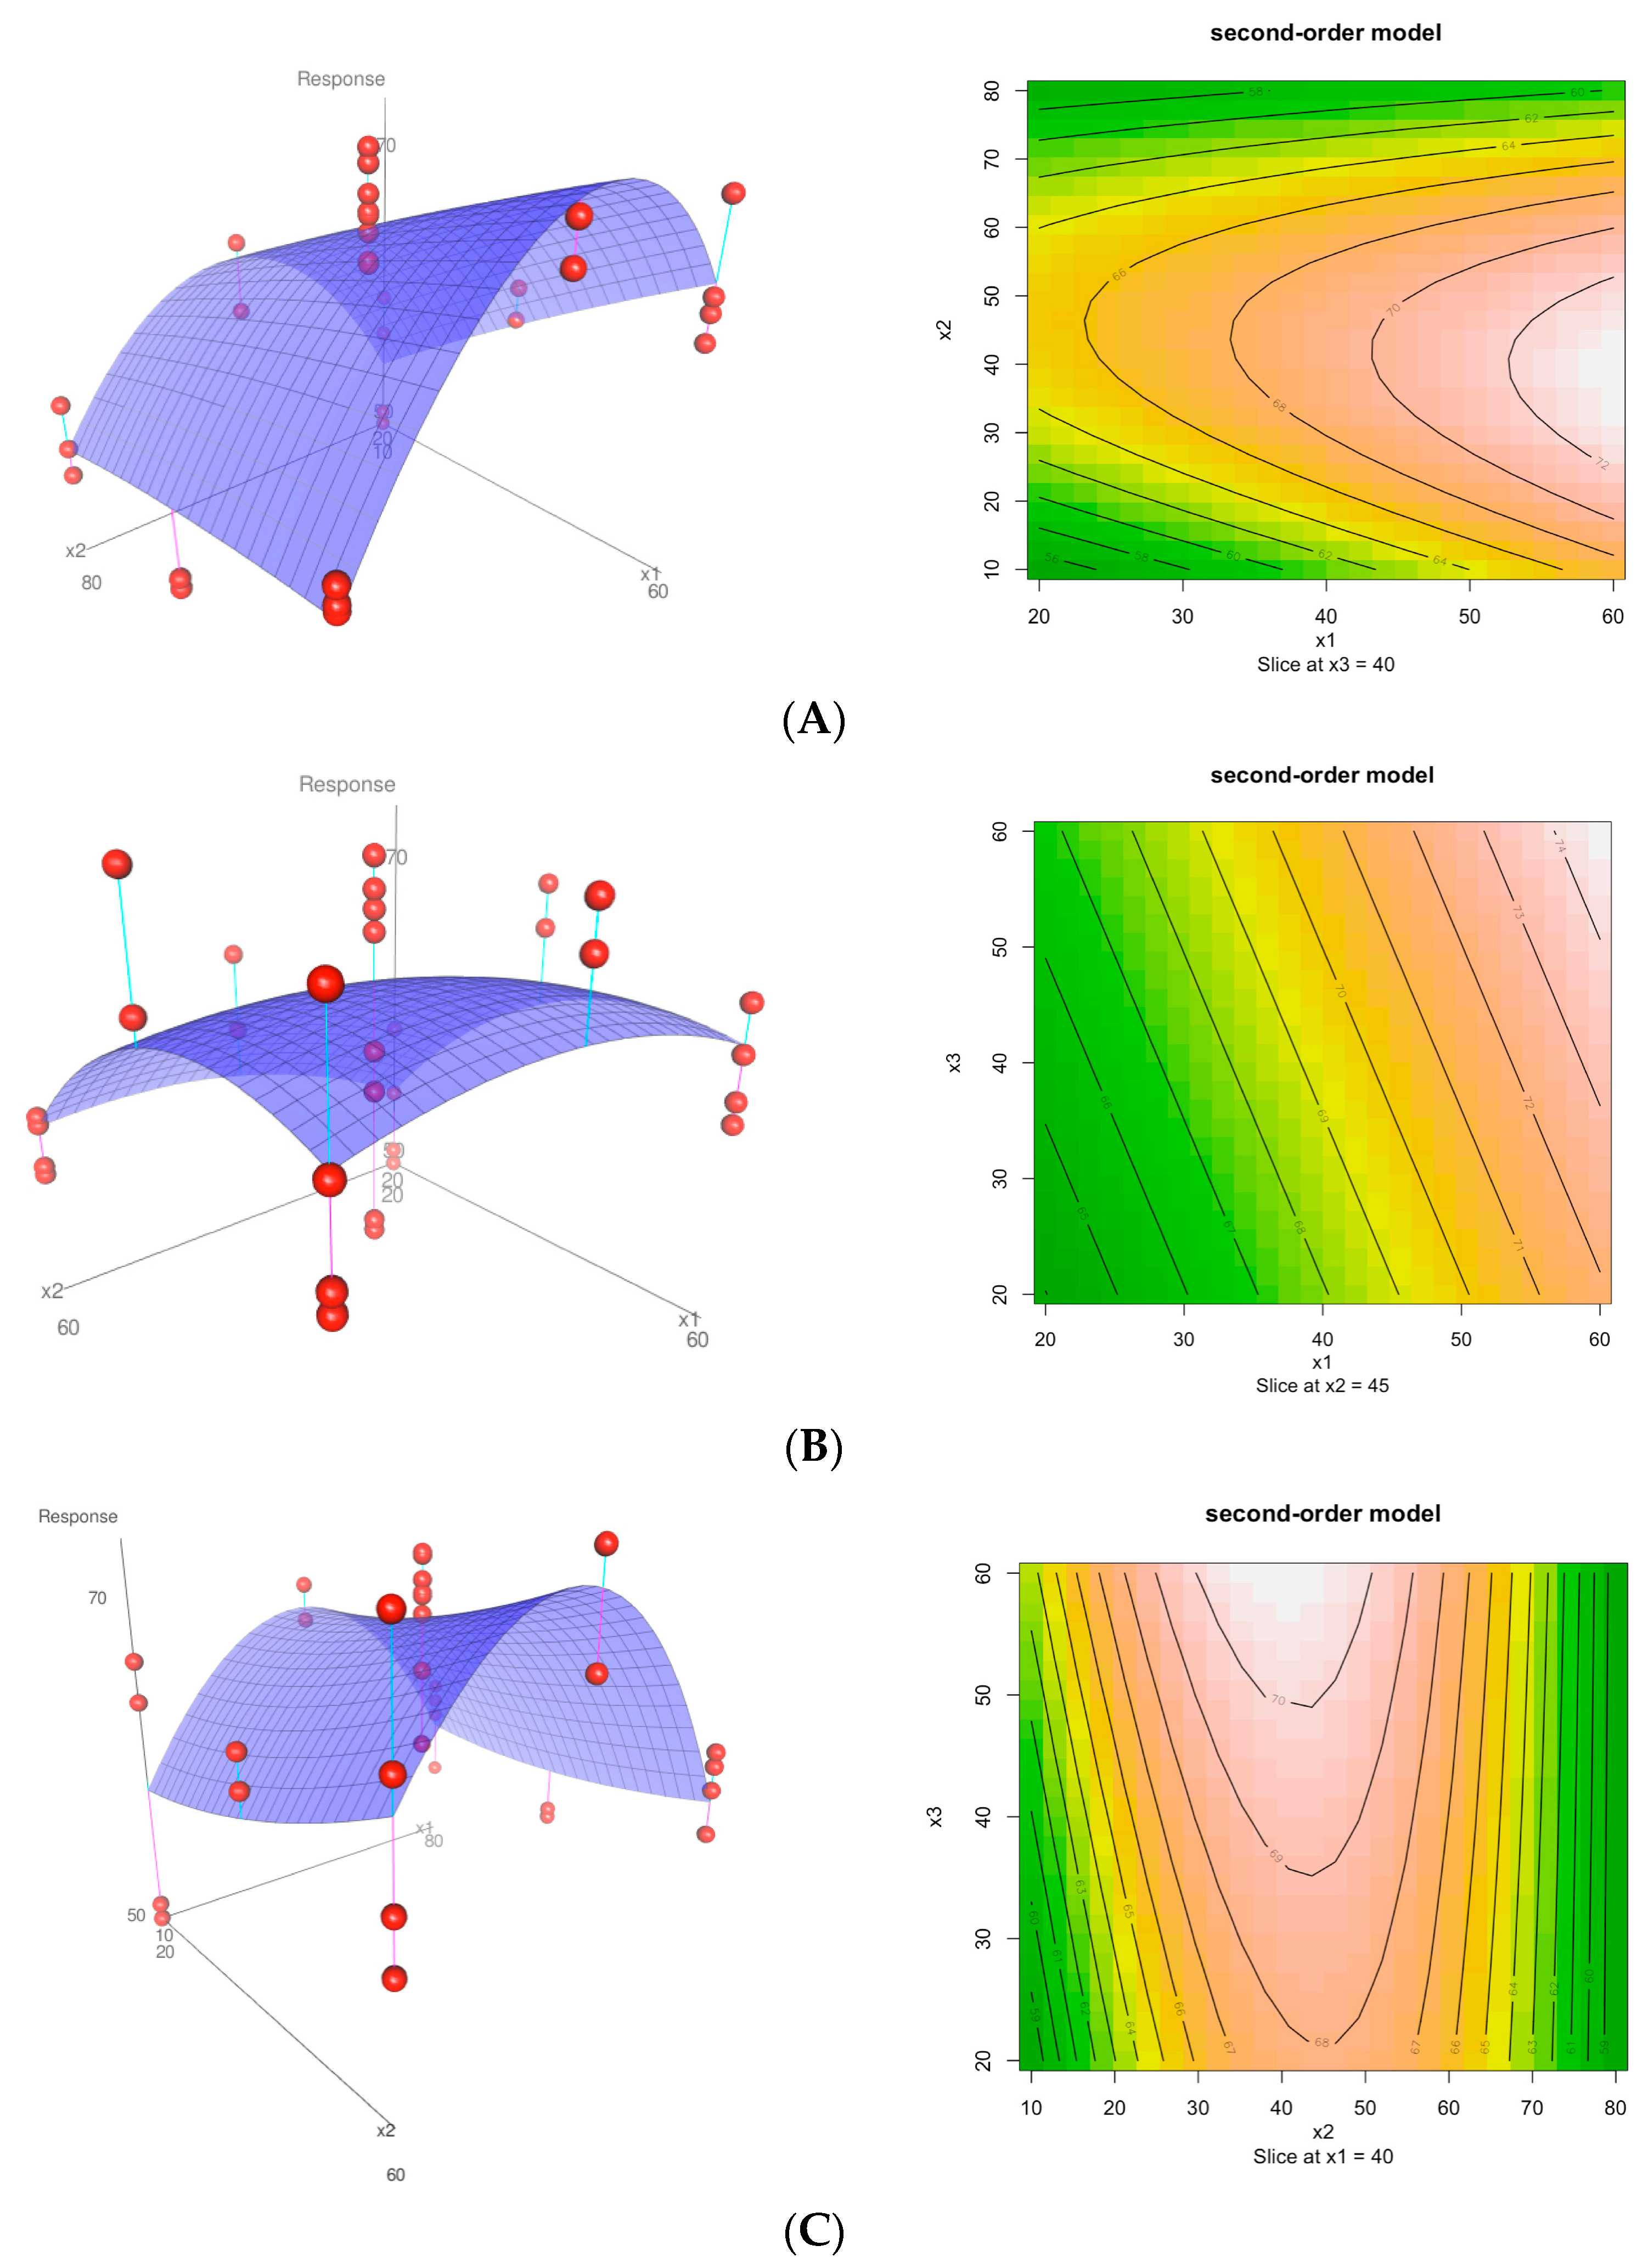
The 3D plots were obtained to visualize the experimental points and the interaction model of two independent variables and their influence on TPC. From the interaction contour plots (2D plots), it can be observed that the TPC value is strongly influenced by all independent variables (Figure 5A–C). Figure 5A shows the effect of solvent concentration and temperature at a fixed extraction time (40 min). A temperature between 40 and 60 °C and a solvent concentration between 10% and 45% have a positive effect on the yield of TPC. The extraction of polyphenols depends on the polarity of the solvent and the nature of the polyphenols. Polyphenols are organic compounds with several hydroxyl (-OH) groups, which gives them polar characteristics. Water, being a very polar solvent, can dissolve polyphenols that are strongly polar and have many hydroxyl groups. However, water may not be as effective in dissolving polyphenols with a larger and more complex structure or those with more hydrophobic components. Ethanol, being polar but less polar than water, has a dissolving capacity that covers both polar and less polar substances. Ethanol is often preferred for polyphenol extraction due to its ability to dissolve a wider range of polyphenols, including those with longer chains and more hydrophobic structures. Mixtures of water and ethanol are often the most effective for polyphenol extraction because they combine the advantages of both solvents [71,72].
When the ethanol concentration is too low, the solvent’s polarity is too high, and when the ethanol concentration is too high, the solvent’s polarity dramatically decreases, making it difficult to extract phenolic compounds effectively [73]. The influence of time and temperature (at a constant solvent concentration of 45% ethanol) is depicted in Figure 5B, whereas Figure 5C shows the response surface plots as a function solvent concentration and time (at a constant temperature of 40 °C). There is a positive correlation between TPC and higher applied extraction times and temperatures (Figure 5B). Under various experimental conditions, TPC varied between 49.74 and 73.17 mg GAE/g (Table 3), so the tested parameters clearly affect the amount of phenolic compounds extracted. The minimum value was obtained after applying a temperature of 20 °C at a solvent concentration of 10% for 20 min. The three highest TPC values (72.41, 72.56, and 73.17 mg GAE/g) were all obtained with treatments performed with 45% solvent concentration for 40–60 min and 40–60 °C, respectively. The TPC for EDBs was found to significantly decrease (p < 0.05) when extraction temperature and ethanol percentage increased, as shown by Domínguez et al. [63]. An explanation for these results could be the decrease in the polarity of the extraction solution and the interaction with the hydroxyl groups of the polyphenols. Moreover, high temperatures can affect some phenolic compounds, thus reducing the extraction yield. The RSM of TPC in the function of temperature and ethanol percentage showed, in line with our findings, that both variables affect their recovery; specifically, the model suggests a midway value for these parameters. Liao et al. [74] examined how temperature affects the extraction of total anthocyanins and phenolic compounds using UAE. According to their research, the mass transfer rate of solutes increases as the extraction temperature rises. Therefore, the extraction of TPC and TAC increases as the temperature increases from 30 °C to 45 °C. However, the extraction yield shows a decreasing trend above 45 °C. This can be explained by the damage of thermosensitive compounds caused by too high temperatures.
The relation between the experimental TPC data and the values predicted by the obtained model is presented in Figure 6. The results show a linear relationship (the model is significant, at p < 0.001, and explains 88.35% of the data variability) with the slope that diverges substantially from the theoretical value 1 (slope = 0.84 ± 0.06), and the origin ordinate moves away from the theoretical zero value (intercept = 12 ± 4). These results are expected since the RSM model’s determination coefficient (R2 = 0.8848) indicates that the model explains a significant portion of the variability in the response variable, and the statistically significant lack of fit (p-value of 0.019) suggests that there are some variations in the data that are not fully accounted for by the model. This could be due to various factors, including the complex nature of phenolic compounds’ responses to extraction conditions and the limitations of the analytical method used [75]. The Folin–Ciocalteu method, while widely used for its simplicity and ease, has known limitations, such as interference from sample matrix effects, including the presence of colored compounds, proteins, carbohydrates, ascorbic acid, and organic acids, which can lead to overestimation of TPC [51,76], which can give problems in the RSM methodology when using TPC as a response variable [77].
In conclusion, while the model may not capture all sources of variation due to the complex nature of phenolic compounds and the limitations of the analytical method, it is sufficiently robust to guide the determination of optimal extraction parameters.

3.3. Effects of Concentration, Lyophilization, and Storage on Extract Stability

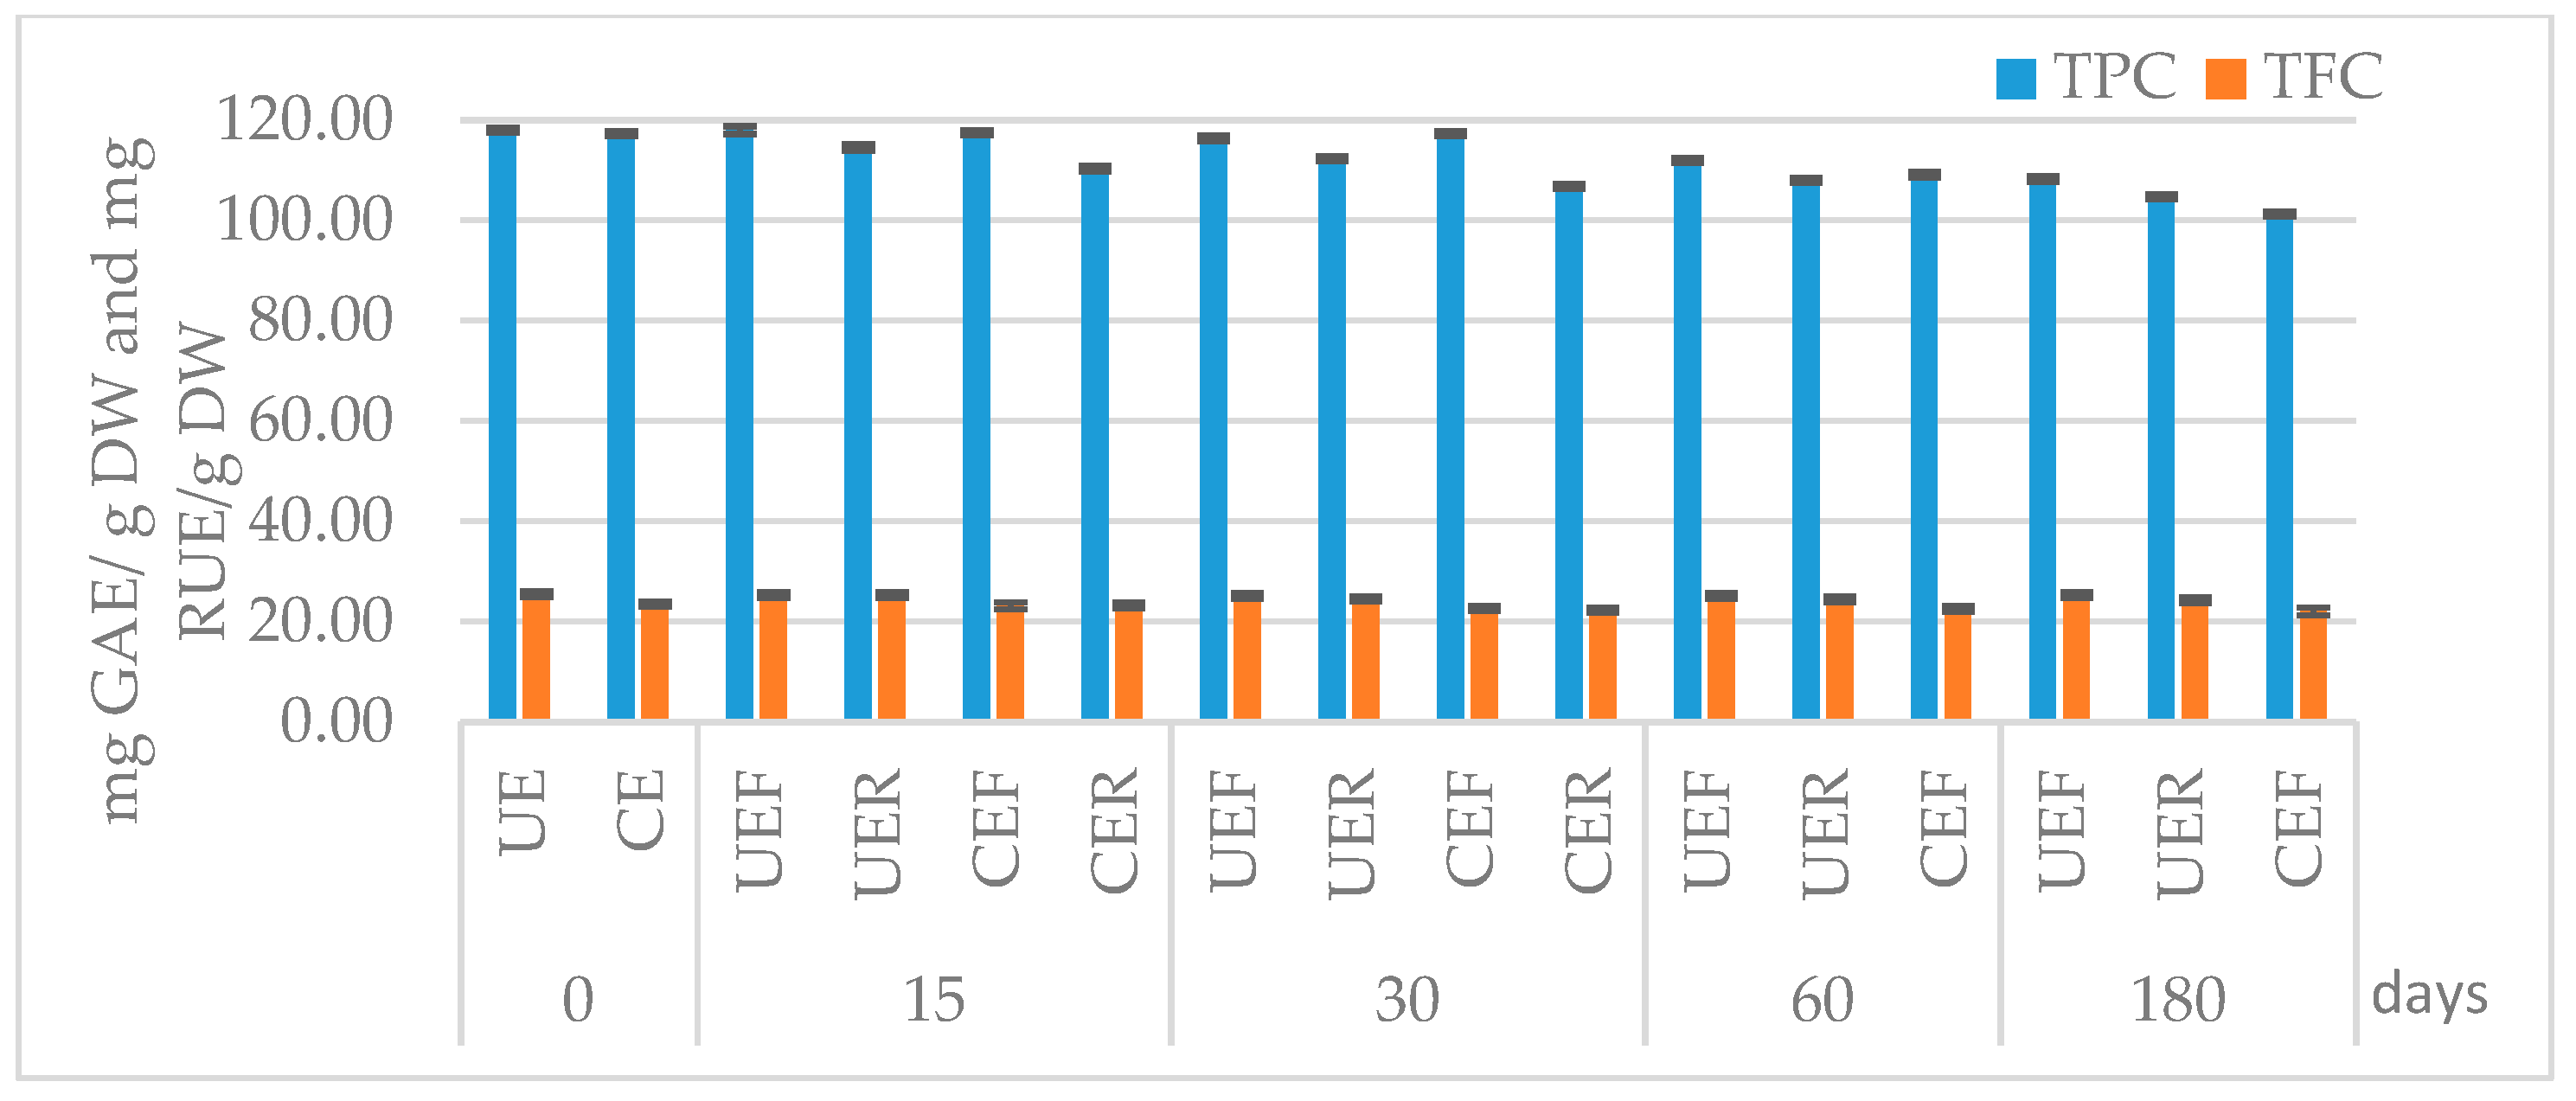
Ensuring the stability of polyphenolic extracts over time involves understanding and mitigating the factors that contribute to their degradation. The unconcentrated extract was obtained using the UAE method, with optimized parameters (45% ethanol v/v, 40 °C, 40 min). The TPC and TFC of the concentrated and lyophilized EDB extracts were determined to study the effects of these treatments on the chemical composition (Figure 7).
Stability over time at different storage temperatures (−18 °C and 4 °C) was evaluated by TPC and TFC analysis only for unconcentrated and concentrated extracts because lyophilization is a widely used method for storing extracts due to the low humidity. The disadvantages are represented by the increased costs for lyophilization and the losses of bioactive compounds that may occur following this process (Figure 8). The stability of phenolic compounds is related to factors such as temperature, pH, light, oxygen, metal ions, and the presence of enzymes and carbohydrates [78]. The results showed that alcohol has an important role in maintaining the levels of TPC and TFC in the extracts. Phenolic compounds in extracts can be affected by the growth of microorganisms. There are several ways in which microorganisms can influence the stability and integrity of polyphenols. First of all, microorganisms produce enzymes that can break down polyphenols. Some bacteria and fungi produce polyphenol oxidases and other enzymes that can oxidize or hydrolyze phenolic compounds. Second, some microorganisms can use polyphenols as a source of carbon and energy, metabolizing them and changing their chemical structure. This may reduce the concentration of phenolic compounds in the extracts. In addition, the metabolic activity of microorganisms can lead to the formation of secondary products that can react with polyphenols, changing their structure and, implicitly, their properties [79,80]. Concentration and lyophilization processes can decrease the amount of bioactive compounds and the temperature at which the extracts are stored. For the concentrated one, because the alcohol has been removed, the innocuousness depends on the storage temperature. In the case of CER, the stability was low (15 days); after that period of time, the development of microorganisms was observed. Further studies are needed to ensure the safety of the product from a microbiological point of view. CEF did not have a significant decrease for TPC and TFC (p > 0.05). The analysis of the profile of the phenolic compounds shows that the concentration process determined the disappearance of gallic acid, while chlorogenic acid, 4-coumaric, and rutin had comparable values. The concentration was carried out in a rotary evaporator at a temperature of 50 °C and 300 mbar for 5 h (an extract volume of 250 mL was concentrated per concentration series), so it is possible that the exposure to light and oxygen affected the extracts, leading to the oxidation of some phenolic compounds, including gallic acid. Insignificant losses were found (p > 0.05) after 15 days of storage, regardless of the storage temperature. During the following months, after 180 days of extract storage (Table 4), the results show significant losses (p < 0.05) for 4-coumaric acid and for rutin.
Other studies [81] have shown that, in strawberry puree, storage conditions had a strong impact on the levels of phenolic compounds, especially anthocyanins. Choosing the right storage time and temperature is essential to preserve the polyphenol content of fruits such as berries. Processing methods have a smaller impact on reducing polyphenol losses than storage conditions. Physiological mechanisms of plant senescence processes increase total polyphenols after the first days of fruit storage [82]. Considering this aspect and taking into account the fact that elderberries are part of the category of forest fruits, their storage can be done for short periods of time to increase the amount of phenolic compounds before obtaining the extracts. Additional studies are needed to confirm the fact that storing elderberries before lyophilization and obtaining extracts can lead to an increase in TPC values, as well as studies to establish the optimal storage period.

4. Conclusions

The study of the extraction methods of phenolic compounds from EDBs and the stability of extracts represents a significant step towards the understanding and efficient use of natural resources for human benefit. The results demonstrate that UAE can be a promising method for obtaining bioactive extracts from these fruits. The optimal extraction parameters were 45% ethanol (v/v), 40 °C, and 40 min. Testing the stability of the extracts obtained by UAE showed an increased stability, especially in the case of hydroalcoholic extracts. In conclusion, EDB extracts presented a good stability, essential for use in various pharmaceutical, cosmetic, and food applications. However, further research is essential to assess the impact of extracts on human health. These efforts will contribute to the full exploitation of the potential of EDBs and phenolic compounds, with a view to developing therapeutic and nutraceutical products with benefits to human health.

Author Contributions

Conceptualization, O.-E.P. and F.I.-R.; methodology, O.-E.P.; software, O.-E.P. and L.G.D.; validation, O.-E.P., F.I.-R. and L.G.D.; formal analysis, O.-E.P. and L.G.D.; investigation, O.-E.P.; resources, O.-E.P. and F.I.-R.; data curation, O.-E.P.; writing—original draft preparation, O.-E.P.; writing—review and editing, O.-E.P. and F.I.-R.; visualization, O.-E.P. and F.I.-R.; supervision, F.I.-R. and L.G.D. All authors have read and agreed to the published version of the manuscript.

Funding

This research received no external funding.

Data Availability Statement

All related data and methods are presented in this paper.

Conflicts of Interest

The authors declare no conflicts of interest.

References

  1. Nichita, C.; Neagu, G.; Cucu, A.; Vulturescu, V.; Vifor, Ș.; Berteşteanu, G. Antioxidative properties of Plantago anceola L. extracts evaluated by chemiluminescence method. AgroLife Sci. J. 2016, 2, 95–102. [Google Scholar]
  2. Aguiar, J.; Estevinho, B.N.; Santos, L. Microencapsulation of natural antioxidants for food application—The specific case of coffee antioxidants—A review. Trends Food Sci. Technol. 2016, 58, 21–39. [Google Scholar] [CrossRef]
  3. Pap, N.; Fidelis, M.; Azevedo, L.; doCarmo, M.A.V.; Wang, D.; Mocan, A.; Pereira, E.P.R.; Xavier-Santos, D.; Sant’Ana, A.S.; Yang, B.; et al. Berrypolyphenols and human health: Evidence of antioxidant, anti-inflammatory, microbiota modulation, and cell-protecting effects. Curr. Opin. Food Sci. 2021, 42, 167–186. [Google Scholar] [CrossRef]
  4. Duthie, S.J. Berry phytochemicals, genomic stability and cancer: Evidence for chemoprotection at several stages in the carcinogenic process. Mol. Nutr. Food. Res. 2007, 51, 665–674. [Google Scholar] [CrossRef] [PubMed]
  5. Varsta, M.; Popa, M.E. The influence of processing on active—Biologically compounds of some berries—A review. Sci. Bull. Ser. F Biotechnol. 2015, 19, 206–210. [Google Scholar]
  6. Curtis, P.J.; van der Velpen, V.; Berends, L.; Jennings, A.; Feelisch, M.; Umpleby, A.M.; Evans, M.; Fernandez, B.O.; Meiss, M.S.; Minnion, M.; et al. Blueberries improve biomarkers of cardiometabolic function in participants with metabolic syndrome—Results from a 6-month, double-blind, randomized controlled trial. Am. J. Clin. Nutr. 2019, 109, 1535–1545. [Google Scholar] [CrossRef] [PubMed]
  7. Habanova, M.; Saraiva, J.A.; Holovicova, M.; Moreira, S.A.; Fidalgo, L.G.; Haban, M.; Gazo, J.; Schwarzova, M.; Chlebo, P.; Bronkowska, M. Effect of berries/apple mixed juice consumption on the positive modulation of human lipid profile. J. Funct. Foods 2019, 60, 103417. [Google Scholar] [CrossRef]
  8. Chaves, V.C.; Soares, M.S.P.; Spohr, L.; Teixeira, F.; Vieira, A.; Constantino, L.S.; Pizzol, F.D.; Lencina, C.L.; Spanevello, R.M.; Freitas, M.P.; et al. Blackberry extract improves behavioral and neurochemical dysfunctions in a ketamine-induced rat model of mania. Neurosci. Lett. 2020, 714, 134566. [Google Scholar] [CrossRef] [PubMed]
  9. Hussain, F.; Malik, A.; Ayyaz, U.; Shafique, H.; Rana, Z.; Hussain, Z. Efficient hepatoprotective activity of cranberry extract against CCl4-induced hepatotoxicity in Wistar albino rat model: Down regulation of liver enzymes and strong antioxidant activity. Asian Pac. J. Trop. Med. 2017, 10, 1054–1058. [Google Scholar] [CrossRef]
  10. Giampieri, F.; Alvarez-suarez, J.M.; Cordero, M.D.; Gasparrini, M.; Forbes-Hernandez, T.Y.; Afrin, S.; Santos-Buelga, C.; Gonzalez-Paramas, A.M.; Astolfi, P.; Rubini, C.; et al. Strawberry consumption improves aging-associated impairments, mitochondrial biogenesis and functionality through the AMP-activated protein kinase signaling cascade. Food Chem. 2017, 234, 464–471. [Google Scholar] [CrossRef]
  11. Tungmunnithum, D.; Thongboonyou, A.; Pholboon, A.; Yangsabai, A. Flavonoids and Other Phenolic Compounds from Medicinal Plants for Pharmaceutical and Medical Aspects: An Overview. Medicines 2018, 5, 93. [Google Scholar] [CrossRef] [PubMed]
  12. Olejnik, A.; Olkowicz, M.; Kowalska, K.; Rychlik, J.; Dembczynski, R.; Myszka, K.; Juzwa, W.; Białas, W.; Moyer, M.P. Gastrointestinal digested Sambucus nigra L. fruit extract protects in vitro cultured human colon cells against oxidative stress. Food Chem. 2016, 197, 648–657. [Google Scholar] [CrossRef] [PubMed]
  13. Sidor, A.; Gramza-Michałowska, A. Advanced research on the antioxidant and health benefit of elderberry (Sambucus nigra) in food—A review. J. Funct. Foods 2014, 18, 941–958. [Google Scholar] [CrossRef]
  14. Gleńsk, M.; Glinski, J.A.; Wlodarczyk, M.; Stefanowicz, P. Determination of ursolic and oleanolic acid in Sambucus fruits. Chem. Biodiver. 2014, 11, 1939–1944. [Google Scholar] [CrossRef] [PubMed]
  15. Krawitz, C.; Mraheil, M.A.; Stein, M.; Imirzalioglu, C.; Domann, E.; Pleschka, S.; Hain, T. Inhibitory activity of a standardized elderberry liquid extract against clinically-relevant human respiratory bacterial pathogens and influenza A and B viruses. BMC Complement. Altern. Med. 2011, 11, 16. [Google Scholar] [CrossRef] [PubMed]
  16. Boroduske, A.; Jekabsons, K.; Riekstina, U.; Muceniece, R.; Rostoks, N.; Nakurte, I. Wild Sambucus nigra L. from north-east edge of the species range: A valuable germplasm with inhibitory capacity against SARS-CoV2 S-protein RBD and hACE2 binding in vitro. Ind. Crops Prod. 2021, 165, 113438. [Google Scholar] [CrossRef] [PubMed]
  17. Hawkins, J.; Baker, C.; Cherry, L.; Dunne, E. Black elderberry (Sambucus nigra) supplementation effectively treats upper respiratory symptoms: A meta-analysis of randomized, controlled clinical trials. Complement. Ther. Med. 2019, 42, 361–365. [Google Scholar] [CrossRef] [PubMed]
  18. Harnett, J.; Oakes, K.; Carè, J.; Leach, M.; Brown, D.; Cramer, H.; Pinder, T.A.; Steel, A.; Anheyer, D. The effects of Sambucus nigra berry on acute respiratory viral infections: A rapid review of clinical studies. Adv. Integr. Med. 2020, 7, 240–246. [Google Scholar] [CrossRef] [PubMed]
  19. Akduman, G.; Korkmaz, S.; Taşkın, T.; Güneş, E.F. Cytotoxicity of Sambucus nigra L. on Cancer Cell Line and In Vitro Antioxidant Properties. Clin. Exp. Health Sci. 2023, 13, 896–901. [Google Scholar] [CrossRef]
  20. Manna, P.; Jain, S.K. Obesity, oxidative stress, adipose tissue dysfunction, and the associated health risks: Causes and therapeutic strategies. Metab. Syndr. Relat. Disord. 2015, 13, 423–444. [Google Scholar] [CrossRef]
  21. Salvador, Â.C.; Król, E.; Lemos, V.C.; Santos, S.A.; Bento, F.P.; Costa, C.P.; Almeida, A.; Szczepankiewicz, D.; Kulczyński, B.; Krejpcio, Z.; et al. Effect of elderberry (Sambucus nigra L.) extract supplementation in STZ-induced diabetic rats fed with a high-fat diet. Int. J. Mol. Sci. 2017, 18, 13. [Google Scholar] [CrossRef] [PubMed]
  22. Opriș, R.; Tatomirn, C.; Olteanu, D.; Moldovan, R.; Moldovan, B.; David, L.; Nagy, A.; Decea, N.; Kiss, M.L.; Filip, G.A. The effect of Sambucus nigra L. extract and phytosinthesized gold nanoparticles on diabetic rats. Colloids Surf. B Biointerfaces 2017, 150, 192–200. [Google Scholar] [CrossRef] [PubMed]
  23. Porter, R.S.; Bode, R.F. A review of the antiviral properties of black elder (Sambucus nigra L.) products. Phytother. Res. 2017, 31, 533–554. [Google Scholar] [CrossRef] [PubMed]
  24. Zielinska-Wasielica, J.; Olejnik, A.; Kowalska, K.; Olkowicz, M.; Dembczynski, R. Elderberry (Sambucus nigra L.) fruit extract alleviates oxidative stress, insulin resistance, and inflammation in hypertrophied 3T3-L1 adipocytes and activated RAW 264.7 macrophages. Foods 2019, 8, 326. [Google Scholar] [CrossRef] [PubMed]
  25. Senica, M.; Stampar, F.; Veberic, R.; Mikulic-Petkovsek, M. The higher the better? Differences in phenolics and cyanogenic glycosides in Sambucus nigra leaves, flowers and berries from different altitudes. J. Sci. Food Agric. 2016, 97, 2623–2632. [Google Scholar] [CrossRef] [PubMed]
  26. Senica, M.F.; Stampar, R.; Veberic, R.; Mikulic-Petkovsek, M. Processed elderberry (Sambucus nigra L.) products: A beneficial or harmful food alternative? LWT Food Sci. Technol. 2016, 72, 182–188. [Google Scholar] [CrossRef]
  27. Schmitzer, V.; Veberic, R.; Slatnar, A.; Stampar, F. Elderberry (Sambucus nigra L.) wine: A product rich in health promoting compounds. J. Agric. Food Chem. 2010, 58, 10143–10146. [Google Scholar] [CrossRef] [PubMed]
  28. Cais-Sokolińska, D.; Walkowiak-Tomczak, D. Consumer-perception, nutritional, and functional studies of a yogurt with restructured elderberry juice. J. Dairy Sci. 2021, 104, 1318–1335. [Google Scholar] [CrossRef]
  29. Najgebauer-Lejko, D.; Liszka, K.; Tabaszewska, M.; Domagała, J. Probiotic Yoghurts with Sea Buckthorn, Elderberry, and Sloe Fruit Purees. Molecules 2021, 26, 2345. [Google Scholar] [CrossRef]
  30. Jin, S.K.; Kim, G.D.; Jeong, J.Y. Evaluation of the Effect of Inhibiting Lipid Oxidation of Natural Plant Sources in a Meat Model System. J. Food Qual. 2021, 2021, 6636335. [Google Scholar] [CrossRef]
  31. Cordeiro, T.; Viegas, O.; Silva, M.; Martins, Z.E.; Fernandes, I.; Ferreira, I.M.L.P.V.O.; Pinho, O.; Mateus, N.; Calhau, C. Inhibitory effect of vinegars on the formation of polycyclic aromatic hydrocarbons in charcoal-grilled pork. Meat Sci. 2020, 167, 108083. [Google Scholar] [CrossRef] [PubMed]
  32. Mlynarczyk, K.; Walkowiak-Tomczak, D.; Lysiak, G.P. Bioactive properties of Sambucus nigra L. As a functional ingredient for food and pharmaceutical industry. J. Funct. Foods 2018, 40, 377–390. [Google Scholar] [CrossRef] [PubMed]
  33. Liu, D.; He, X.-Q.; Wu, D.-T.; Li, H.-B.; Feng, Y.-B.; Zou, L.; Gan, R.-Y. Elderberry (Sambucus nigra L.): Bioactive Compounds, Health Functions, and Applications. J. Agric. Food Chem. 2022, 70, 4202–4220. [Google Scholar] [CrossRef] [PubMed]
  34. Stănciuc, N.; Oancea, A.M.; Aprodu, I.; Turturică, M.; Barbu, V.; Ioniţă, E.; Râpeanu, G.; Bahrim, G. Investigations on binding mechanism of bioactives from elderberry (Sambucus nigra L.) by whey proteins for efficient microencapsulation. J. Food Eng. 2018, 223, 197–207. [Google Scholar] [CrossRef]
  35. Silva, P.; Ferreira, S.; Nunes, F.M. Elderberry (Sambucus nigra L.) by-products a source of anthocyanins and antioxidant polyphenols. Ind. Crops Prod. 2017, 95, 227–234. [Google Scholar] [CrossRef]
  36. Hubbermann, E.M.; Heins, A.; Stöckmann, H.; Schwarz, K. Influence of acids, salt, sugars and hydrocolloids on the colour stability of anthocyanin rich black currant and elderberry concentrates. Eur. Food Res. Technol. 2006, 223, 83–90. [Google Scholar] [CrossRef]
  37. Przybylska-Balcerek, A.; Szablewski, T.; Szwajkowska-Michałek, L.; Świerk, D.; Cegielska-Radziejewska, R.; Krejpcio, Z.; Suchowilska, E.; Tomczyk, Ł.; Stuper-Szablewska, K. Sambucus nigra Extracts–Natural Antioxidants and Antimicrobial Compounds. Molecules 2021, 26, 2910. [Google Scholar] [CrossRef] [PubMed]
  38. Česlová, L.; Kalendová, P.; Dubnová, L.; Pernica, M.; Fischer, J. The Effect of Sample Pretreatment on the Anthocyanin Content in Czech Wild Elderberry (Sambucus nigra L.). Molecules 2023, 28, 6690. [Google Scholar] [CrossRef] [PubMed]
  39. Floares, D.; Cocan, I.; Alexa, E.; Poiana, M.-A.; Berbecea, A.; Boldea, M.V.; Negrea, M.; Obistioiu, D.; Radulov, I. Influence of Extraction Methods on the Phytochemical Profile of Sambucus nigra L. Agronomy 2023, 13, 3061. [Google Scholar] [CrossRef]
  40. Braga, M.E.M.; Seabra, I.J.; Ama, D.; De Sousa, H.C. Recent trends and perspectives for the extraction of natural products. In Natural Product Extraction: Principles and Applications; Rostagno, M.A., Prado, J.M., Eds.; RSC Publishing: Cambridge, UK, 2013; pp. 231–275. [Google Scholar]
  41. Seabra, I.J.; Braga, M.E.M.; Batista, M.T.; de Sousa, H.C. Effect of solvent (CO2/ethanol/H2O) on the fractionated enhanced solvent extraction of anthocyanins from elderberry pomace. J. Supercrit. Fluids 2010, 54, 145–152. [Google Scholar] [CrossRef]
  42. Seabra, I.J.; Braga, M.E.M.; Batista, M.T.P.; de Sousa, H.C. Fractioned High Pressure Extraction of Anthocyanins from Elderberry (Sambucus nigra L.) Pomace. Food Bioprocess Technol. 2010, 3, 674–683. [Google Scholar] [CrossRef]
  43. Salamon, I.; Mariychuk, R.; Grulova, D. Optimal Extraction of Pure Anthocyanins from Fruits of Sambucus nigra. Acta Hortic. 2015, 1061, 73–78. [Google Scholar] [CrossRef]
  44. Dawidowicz, A.L.; Wianowska, D.; Baraniak, B. The antioxidant properties of alcoholic extracts from Sambucus nigra L. (antioxidant properties of extracts). LWT 2006, 39, 308–315. [Google Scholar] [CrossRef]
  45. Duymuş, H.G.; Göger, F.; Başer, K.H.C. In Vitro Antioxidant Properties and Anthocyanin Compositions of Elderberry Extracts. Food Chem. 2014, 155, 112–119. [Google Scholar] [CrossRef]
  46. Mattson, M.L.; Corfield, R.; Bajda, L.; Pérez, O.E.; Schebor, C.; Salvatori, D.M. Potential bioactive ingredient from elderberry fruit: Process optimization for a maximum phenolic recovery, physicochemical characterization, and bioaccesibility. J. Berry Res. 2021, 11, 51–68. [Google Scholar] [CrossRef]
  47. Radványi, D.; Juhász, R.; Kun, S.Z.; Szabó-Nótin, B.; Barta, J. Preliminary study of extraction of biologically active compounds from elderberry (Sambucus nigra L.) pomace. Acta Aliment. 2013, 42, 63–72. [Google Scholar] [CrossRef]
  48. dos Santos Nascimento, L.B.; Gori, A.; Degano, I.; Mandoli, A.; Ferrini, F.; Brunetti, C. Comparison between Fermentation and Ultrasound-Assisted Extraction: Which Is the Most Efficient Method to Obtain Antioxidant Polyphenols from Sambucus nigra and Punica granatum Fruits? Horticulturae 2021, 7, 386. [Google Scholar] [CrossRef]
  49. Oniszczuk, A.; Olech, M.; Oniszczuk, T.; Wojtunik-Kulesza, K.; Wójtowicz, A. Extraction methods, LC-ESI-MS/MS analysis of phenolic compounds and antiradical properties of functional food enriched with elderberry flowers or fruits. Arab. J. Chem. 2016, 12, 4719–4730. [Google Scholar] [CrossRef]
  50. Sandri, I.G.; Fontana, R.C.; Barfknecht, D.M.; Silveira, M.M. Clarification of fruit juices by fungal pectinases. LWT-Food Sci. Technol. 2011, 44, 2217–2222. [Google Scholar] [CrossRef]
  51. Singleton, V.L.; Orthofer, R.; Lamuela-Raventos, R.M. Analysis of total phenols and others oxidation substrates and antioxidants by means of Folin-Ciocalteu reagent. Meth. Enzymol. 1999, 299, 152–153. [Google Scholar] [CrossRef]
  52. Pękal, A.; Pyrzynska, K. Evaluation of Aluminium Complexation Reaction for Flavonoid Content Assay. Food Anal. Methods 2014, 7, 1776–1782. [Google Scholar] [CrossRef]
  53. Lee, J.; Durst, R.W.; Wrolstad, R.E. Determination of total monomeric anthocyanin pigment content of fruit juices, natural colorants, and wines, by the pH differential method: Collaborative study. J. AOAC Int. 2005, 88, 1269–1278. [Google Scholar] [CrossRef]
  54. Lenth, R.V. Response-Surface Methods in R, Using rsm. J. Stat. Softw. 2009, 32, 1–17. [Google Scholar] [CrossRef]
  55. Vilkhu, K.; Mawson, R.; Simons, L.; Bates, D. Applications and opportunities for ultrasound assisted extraction in the food industry—A review. Innov. Food Sci. Emerg. Technol. 2008, 9, 161–169. [Google Scholar] [CrossRef]
  56. Shen, L.; Pang, S.; Zhong, M.; Sun, Y.; Qayum, A.; Liu, Y.; Rashid, A.; Xu, B.; Liang, Q.; Ma, H.; et al. A comprehensive review of ultrasonic assisted extraction (UAE) for bioactive components: Principles, advantages, equipment, and combined technologies. Ultrason. Sonochem. 2023, 101, 106646. [Google Scholar] [CrossRef] [PubMed]
  57. Chemat, F.; Zill-e-Huma; Khan, M.K. Applications of ultrasound in food technology: Processing, preservation and extraction. Ultrason. Sonochem. 2011, 18, 813–835. [Google Scholar] [CrossRef] [PubMed]
  58. Tchabo, W.; Ma, Y.; Engmann, F.N.; Zhang, H. Ultrasound-assisted enzymatic extraction (UAEE) of phytochemical compounds from mulberry (Morus nigra) must and optimization study using response surface methodology. Ind. Crops Prod. 2015, 63, 214–225. [Google Scholar] [CrossRef]
  59. Suwal, S.; Marciniak, A. Technologies for the Extraction, Separation and Purification of polyphenols—A Review. Nepal J. Biotechnol. 2019, 6, 74–91. [Google Scholar] [CrossRef]
  60. Denery, J.R.; Dragull, K.; Tang, C.S.; Li, Q.X. Pressurized fluid extraction of carotenoids from Haematococcus pluvialis and Dunaliella salina and kavalactones from Piper methysticum. Anal. Chim. Acta 2004, 501, 175–181. [Google Scholar] [CrossRef]
  61. Luque de Castro, M.D.; García-Ayuso, L.E. Soxhlet extraction of solid materials: An outdated technique with a promising innovative future. Anal. Chim. Acta 1998, 369, 1–10. [Google Scholar] [CrossRef]
  62. Silva, J.C.; França, P.R.L.; Melob, A.H.F.; Neves-Petersenc, M.T.; Convertie, A.; Porto, T.S. Optimized production of Aspergillus aculeatus URM4953 polygalacturonases for pectin hydrolysis in hog plum (Spondias mombin L.) juice. Process Biochem. 2019, 79, 18–27. [Google Scholar] [CrossRef]
  63. Domínguez, R.; Zhang, L.; Rocchetti, G.; Lucini, L.; Pateiro, M.; Munekata, P.E.S.; Lorenzo, J.M. Elderberry (Sambucus nigra L.) as potential source of antioxidants. Characterization, optimization of extraction parameters and bioactive properties. Food Chem. 2020, 330, 127–266. [Google Scholar] [CrossRef] [PubMed]
  64. Młynarczyk, K.; Walkowiak-Tomczak, D.; Staniek, H.; Kidoń, M.; Łysiak, G.P. The content of selected minerals, bioactive compounds, and the antioxidant properties of the flowers and fruit of selected cultivars and wildly growing plants of Sambucus nigra L. Molecules 2020, 25, 876. [Google Scholar] [CrossRef] [PubMed]
  65. Caruso, M.C.; Galgano, F.; Grippo, A.; Condelli, N.; Di Cairano, M.; Tolve, R. Assay of Healthful Properties of Wild Blackberry and Elderberry Fruits Grown in Mediterranean Area. J. Food Meas. Charact. 2019, 13, 1591–1598. [Google Scholar] [CrossRef]
  66. Viapiana, A.; Wesolowski, M. The Phenolic Contents and Antioxidant Activities of Infusions of Sambucus nigra L. Plant Foods Hum. Nutr. 2017, 72, 82–87. [Google Scholar] [CrossRef] [PubMed]
  67. Liazid, A.; Guerrero, R.F.; Cantos, E.; Palma, M.; Barroso, C.G. Microwave assisted extraction of anthocyanins from grape skins. Food Chem. 2011, 124, 1238–1243. [Google Scholar] [CrossRef]
  68. Garofulić, I.E.; Dragović-Uzelac, V.; Režek, J.A.; Jukić, M. The effect of microwave assisted extraction on the isolation of anthocyanins and phenolic acids from sour cherry Marasca (Prunus cerasus var. Marasca). J. Food Eng. 2013, 117, 437–442. [Google Scholar] [CrossRef]
  69. Dangles, O.; Fenger, J.A. The Chemical Reactivity of Anthocyanins and its Consequences in Food Science and Nutrition. Molecules 2018, 23, 1970. [Google Scholar] [CrossRef] [PubMed]
  70. Zhang, Q.A.; Shen, H.; Fan, X.H.; Shen, Y.; Wang, X.; Song, Y. Changes of gallic acid mediated by ultrasound in a model extraction solution. Ultrason. Sonochem. 2015, 22, 149–154. [Google Scholar] [CrossRef] [PubMed]
  71. Dai, J.; Mumper, R.J. Plant phenolics: Extraction, analysis and their antioxidant and anticancer properties. Molecules 2010, 15, 7313–7352. [Google Scholar] [CrossRef]
  72. Ignat, I.; Volf, I.; Popa, V.I. A critical review of methods for characterization of polyphenolic compounds in fruits and vegetables. Food Chem. 2011, 126, 1821–1835. [Google Scholar] [CrossRef] [PubMed]
  73. Dumitru, L.; Preda, D.; Constantinescu-Aruxandei, D.; Oancea, F.; Băbeanu, N. Optimization of ultrasound-assisted extraction of polyphenols from honeysuckle (Lonicera caprifolium). AgroLife Sci. J. 2021, 1, 47–55. [Google Scholar] [CrossRef]
  74. Liao, J.; Xue, H.; Li, J. Extraction of phenolics and anthocyanins from purple eggplant peels by multi-frequency ultrasound: Effects of different extraction factors and optimization using uniform design. Ultrason. Sonochem. 2022, 90, 106174. [Google Scholar] [CrossRef] [PubMed]
  75. Slinkard, K.; Singleton, V.L. Total phenol analysis: Automation and comparison with manual methods. Am. J. Enol. Vitic. 1977, 28, 49–55. [Google Scholar] [CrossRef]
  76. George, S.; Brat, P.; Alter, P.; Amiot, M.J. Rapid determination of polyphenols and vitamin C in plant-derived products. J. Agric. Food Chem. 2005, 53, 1370–1373. [Google Scholar] [CrossRef] [PubMed]
  77. Montgomery, D.C. Design and Analysis of Experiments; John Wiley & Sons: Hoboken, NJ, USA, 2017. [Google Scholar]
  78. Patras, A.; Brunton, N.P.; O’Donnell, C.; Tiwari, B.K. Effect of Thermal Processing on Anthocyanin Stability in Foods; Mechanisms and Kinetics of Degradation. Trends Food Sci. Technol. 2010, 21, 3–11. [Google Scholar] [CrossRef]
  79. Shahidi, F.; Naczk, M. Phenolics in Food and Nutraceuticals, 2nd ed.; CRC Press: Boca Raton, FL, USA, 2004; p. 576. [Google Scholar] [CrossRef]
  80. Speroni, F.; Tullio, V.; Litterio, N.; Caccia, R.; Piccinini, R.; Rossetti, L.; Tullio, V. Inactivation of microorganisms in liquids: A review of factors influencing the antimicrobial effectiveness of ethanol. J. Water Health 2020, 18, 667–683. [Google Scholar]
  81. Salazar-Orbea, G.L.; García-Villalba, R.; Bernal, M.J.; Hernández-Jiménez, A.; Egea, J.A.; Tomás-Barberán, F.A.; Sánchez-Siles, L.M. Effect of Storage Conditions on the Stability of Polyphenols of Apple and Strawberry Purees Produced at Industrial Scale by Different Processing Techniques. J. Agric. Food. Chem. 2023, 71, 2541–2553. [Google Scholar] [CrossRef]
  82. Cătunescu, G.M.; Rotar, I.; Vidican, R.; Rotar, A.M. Effect of cold storage on antioxidants from minimally processed herbs. Sci. Bull. Ser. F Biotechnol. 2017, 2, 121–126. [Google Scholar]
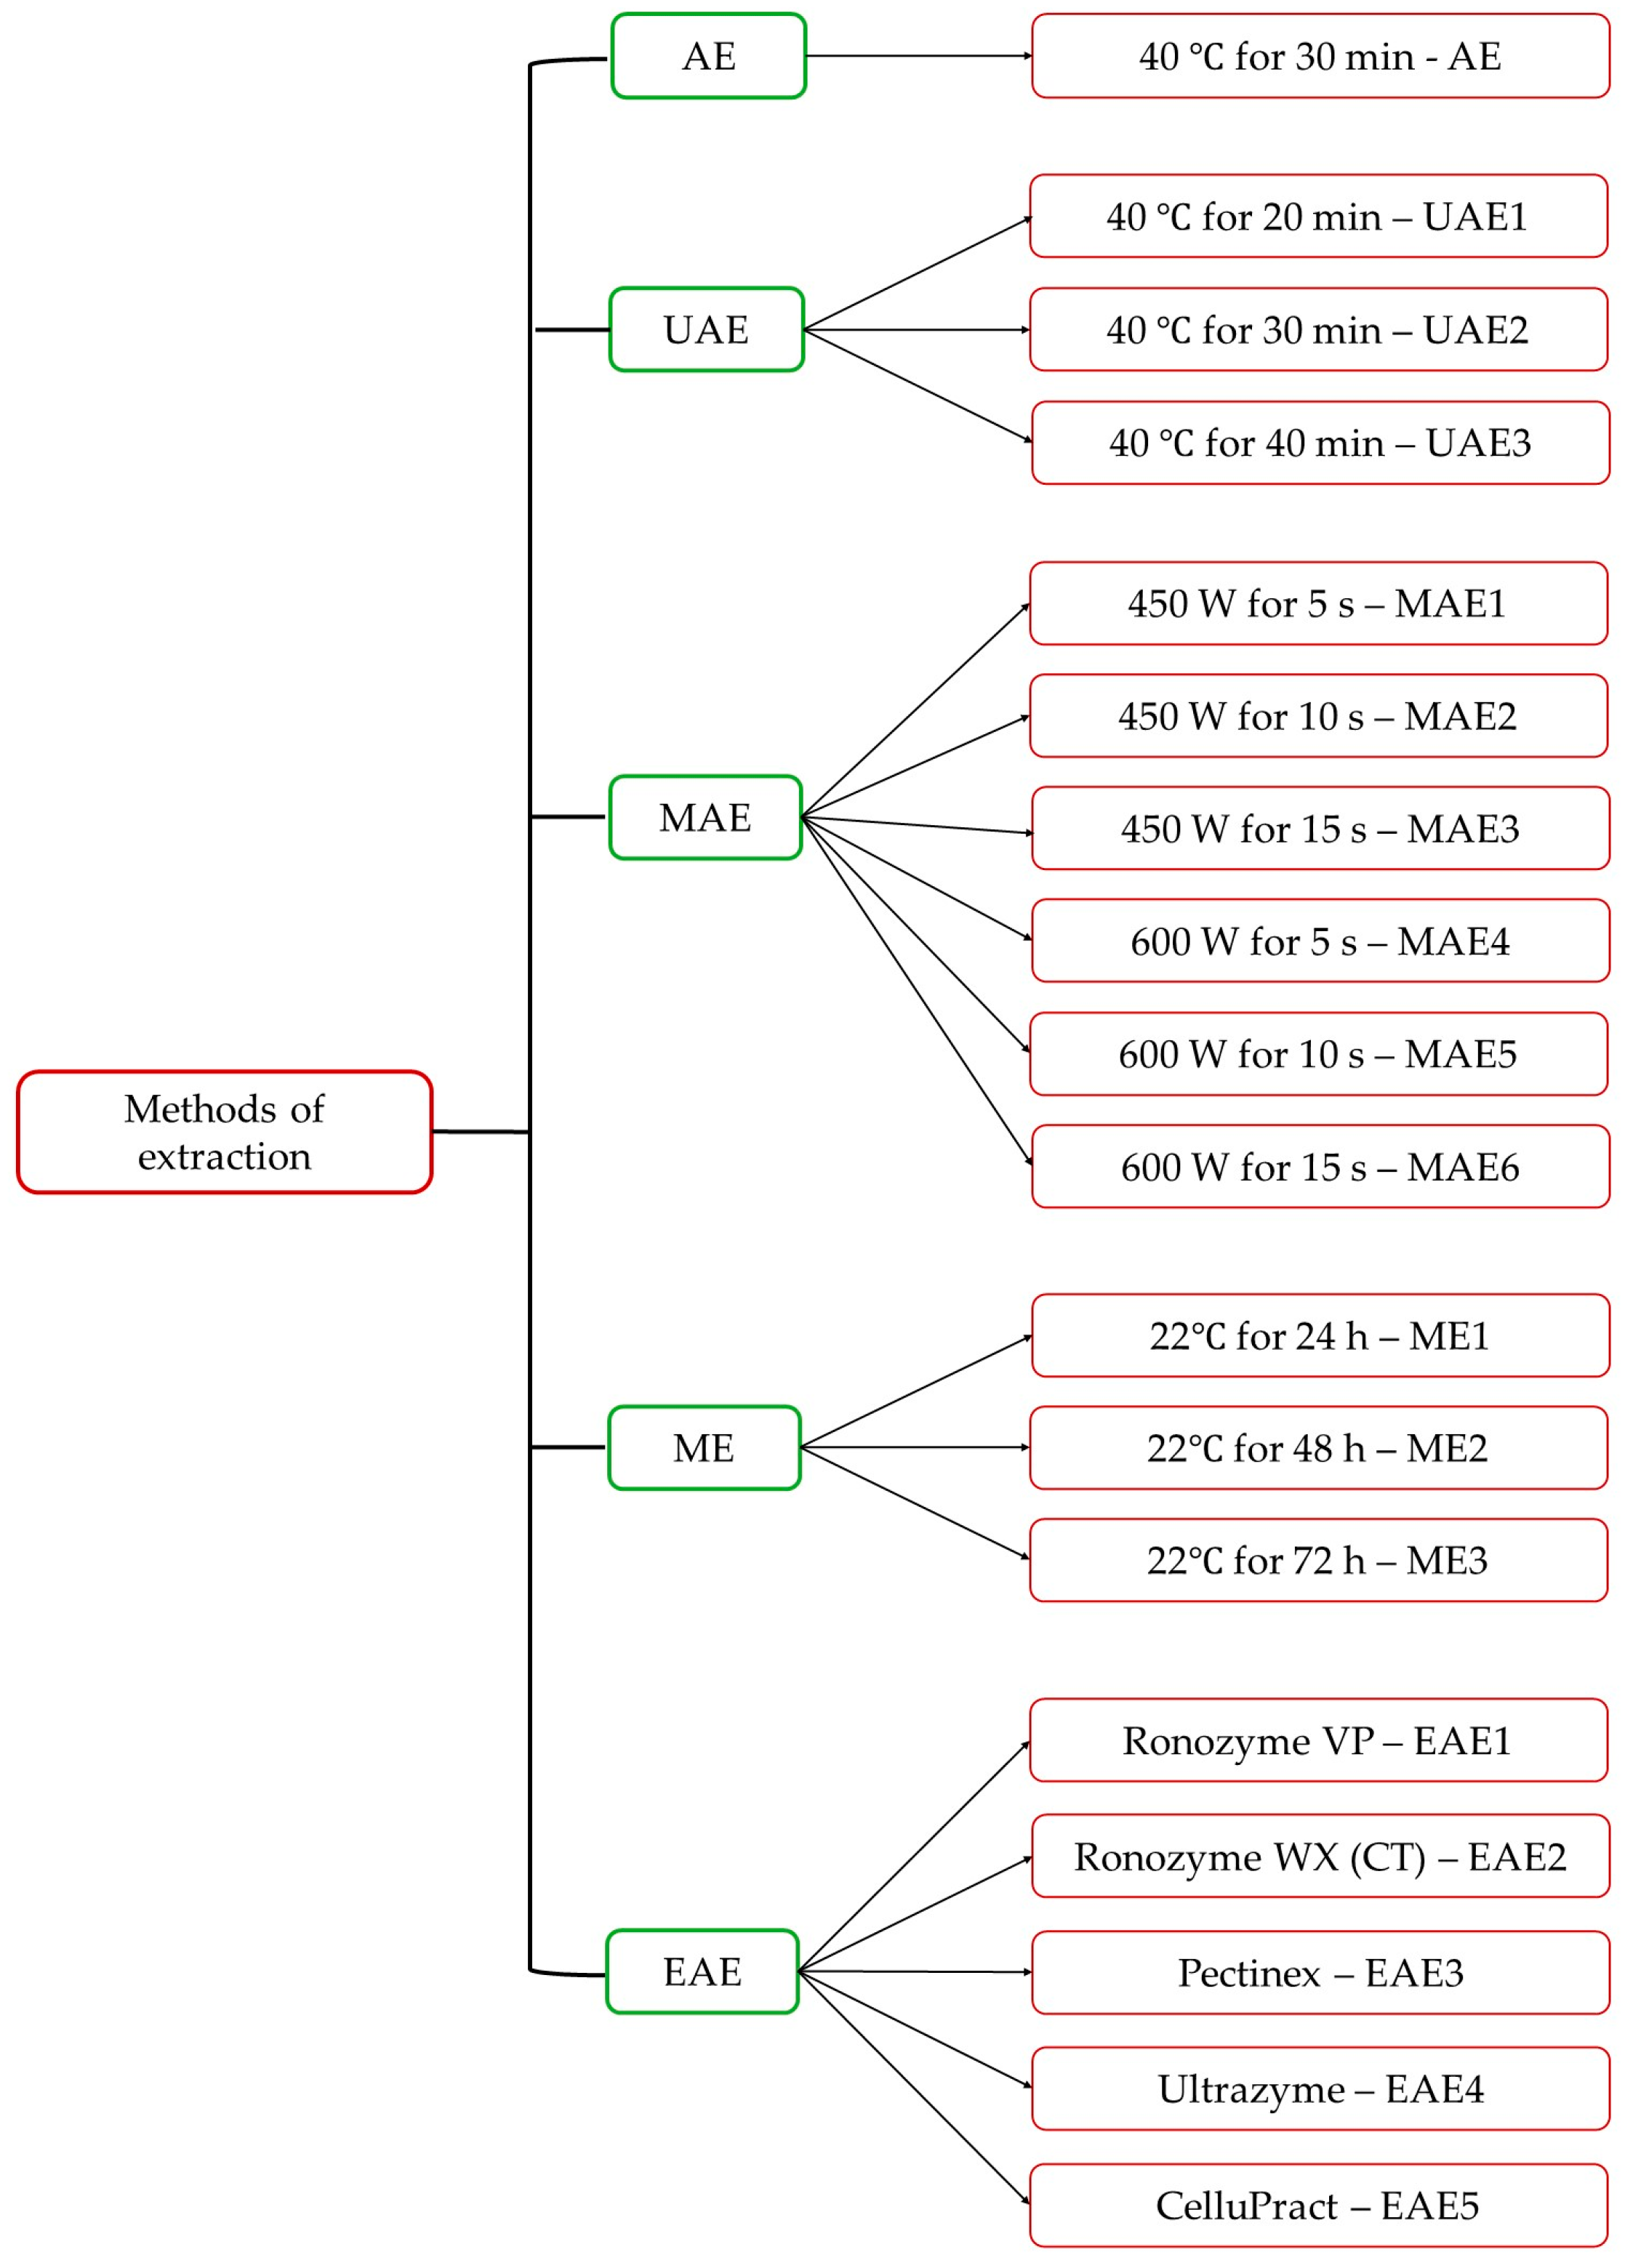
Figure 1. Extraction parameters for AE (continuous agitation), UAE (ultrasound-assisted extraction), MAE (microwave-assisted extraction), ME (maceration extraction), and EAE (enzyme-assisted extraction); enzymes used for EAE and the code for each type of extract.
Horticulturae 10 00743 g001
Figure 2. TPC content expressed as mg of GAE/g lyophilized EDBs. Values are reported as mean (n = 3) ± standard deviation indicated in the columns by error bars (TPC—total phenolic content; GAE—gallic acid equivalent; EDB—elderberry; AE—continuous agitation; UAE—ultrasound-assisted extraction; MAE—microwave-assisted extraction; ME—maceration extraction; and EAE—enzyme-assisted extraction).
Horticulturae 10 00743 g002
Figure 3. The TPC (mg of GAE/g lyophilized EDBs) of the samples obtained by EAE with Pectinex at different pH values. Values are reported as mean (n = 3) ± standard deviation indicated by error bars (TPC—total phenolic content; GAE—gallic acid equivalent; EDB—elderberry; and EAE—enzyme-assisted extraction).
Horticulturae 10 00743 g003
Figure 4. TFC (mg RUE/g lyophilized EDB), TAC, and MAC (mg C3G/g lyophilized EDB) of the extracts obtained by different methods of extraction. Values are reported as mean (n = 3) ± standard deviation indicated by error bars (TAC—total anthocyanin content; MAC—monomeric anthocyanin content; TFC—total flavonoid content; RUE—rutin equivalent; EDB—elderberry; C3G—cyanidin-3-glucoside equivalents; AE—continuous agitation; UAE—ultrasound-assisted extraction; MAE—microwave-assisted extraction; ME—maceration extraction; and EAE—enzyme-assisted extraction).
Horticulturae 10 00743 g004
Figure 5. Three-dimensional response surface plots for TPC (total phenolic content) as a function of (A) X1 = temperature and X2 = solvent concentration (at a constant time of 40 min), (B) X1 = temperature and X3 = time (at a constant solvent concentration of 45% ethanol), and (C) X2 = solvent concentration and X3 = time (at a constant temperature of 40 °C).
Horticulturae 10 00743 g005
Figure 6. Linear relation between the values obtained by each model and the expected results of the train and test groups for TPC as mg GAE/g lyophilized EDBs (TPC—total phenolic content; GAE—gallic acid equivalent; and EDB—elderberry).
Horticulturae 10 00743 g006
Figure 7. Chemical composition of EDB extracts. Values are reported as mean (n = 3) ± standard deviation (GAE—gallic acid equivalent; RUE—rutin equivalent; and DW—dry weight).
Horticulturae 10 00743 g007
Figure 8. The effect of storage on the extracts over the time on TPC (mg GAE/g DW EDB) and TFC (mg RUE/g DW EDB). Values are reported as mean (n = 3) ± standard deviation (UE—unconcentrated extract; CE—concentrated extract; UEF—unconcentrated extract stored in the freezer; UER—unconcentrated extract stored in the refrigerator; CEF—concentrated extract kept in the freezer; CER—concentrated extract kept in the refrigerator; TPC—total phenolic content; TFC—total flavonoid content; GAE—gallic acid equivalent; RUE—rutin equivalent; and DW—dry weight).
Horticulturae 10 00743 g008
Table 1. Design setup—range and levels for each independent variable.
FactorRange and Levels
Independent variablesXi−101
Temperature (°C)X1204060
Concentration (% ethanol)X2104580
Time (min)X3204060
Table 2. Phenolic profile of elderberry extracts. Values are reported as mg/g lyophilized EDBs, as mean (n = 3) ± standard deviation (ND—not detected; AE—continuous agitation; UAE—ultrasound-assisted extraction; MAE—microwave-assisted extraction; ME—maceration extraction; and EAE—enzyme-assisted extraction).
Extraction MethodGallic Acid (mg/g)Chlorogenic Acid (mg/g)Caffeic Acid (mg/g)Syringic Acid (mg/g)4-Coumaric Acid (mg/g)Rutin (mg/g)
AE0.34 ± 0.030.52 ± 0.02NDND0.11 ± 0.041.98 ± 0.01
UAE30.42 ± 0.090.59 ± 0.01NDND0.17 ± 0.032.43 ± 0.01
MAE10.27 ± 0.090.49 ± 0.02NDND0.09 ± 0.032.17 ± 0.02
ME20.21 ± 0.110.49 ± 0.02NDND0.15 ± 0.021.98 ± 0.02
EAE30.68 ± 0.070.13 ± 0.010.20 ± 0.010.14 ± 0.070.13 ± 0.061.87 ± 0.03
Table 3. Multilevel fractional factorial design for three factors with three levels and values of observed response. Values for response are reported as mean (n = 3) ± standard deviation (TPC—total phenolic content; GAE—gallic acid equivalent).
RunTemperature
(°C)
X1
Solvent
(% Ethanol)
X2
Time (min)
X3
Response
TPC
(mg GAE/g)
140454070.17 ± 0.13
260106065.46 ± 0.30
340456073.17 ± 0.15
460806061.60 ± 0.20
560106071.31 ± 0.08
640104061.60 ± 0.28
740804054.17 ± 0.08
820102049.74 ± 0.14
920802054.89 ± 0.13
1060102066.31 ± 0.28
1160802060.46 ± 0.25
1240104063.60 ± 0.13
1320454066.03 ± 0.17
1440454069.17 ± 0.01
1560102063.89 ± 0.25
1620802059.31 ± 0.16
1720806059.31 ± 0.09
1820102050.74 ± 0.17
1940804054.74 ± 0.06
2060454072.31 ± 0.32
2140454072.46 ± 0.10
2220106057.03 ± 0.10
2360802061.60 ± 0.35
2420806056.60 ± 0.07
2540456067.60 ± 0.16
2640452067.74 ± 0.03
2740452070.03 ± 0.11
2820454061.74 ± 0.09
2960454070.31 ± 0.05
3020106059.74 ± 0.19
3160806060.74 ± 0.12
3240454071.03 ± 0.11
Table 4. Phenolic profile of EDB extracts after 1 day of obtaining, 15 days, and 180 days. Values are reported as mg/g DW, as mean (n = 3) ± standard deviation (UE—unconcentrated extract; CE—concentrated extract; UEF—unconcentrated extract stored in the freezer; UER—unconcentrated extract stored in the refrigerator; CEF—concentrated extract kept in the freezer; CER—concentrated extract kept in the refrigerator; DW—dry weight; ND—not detected; and loQ—limit of quantitation).
Type of ExtractGallic Acid (mg/g DW)Chlorogenic Acid
(mg/g DW)
Caffeic Acid
(mg/g DW)
Syringic Acid (mg/g DW)4-Coumaric Acid
(mg/g DW)
Rutin
(mg/g DW)
After 1 day
UE0.24 ± 0.020.92 ± 0.02NDND0.15 ± 0.023.61 ± 0.02
CE<loQ0.92 ± 0.03NDND0.11 ± 0.023.55 ± 0.01
After 15 days
UEF<loQ0.92 ± 0.01NDND0.14 ± 0.023.56 ± 0.03
UER<loQ0.91 ± 0.00NDND0.16 ± 0.013.38 ± 0.02
CEF<loQ0.91 ± 0.01NDND0.08 ± 0.013.42 ± 0.01
CER<loQ0.85 ± 0.02NDND0.07 ± 0.013.34 ± 0.00
After 180 days
UEF<loQ0.86 ± 0.02NDND0.10 ± 0.013.02 ± 0.02
UER<loQ0.80 ± 0.01NDND0.14 ± 0.022.71 ± 0.02
CEF<loQ0.79 ± 0.03NDND0.04 ± 0.012.91 ± 0.01
Disclaimer/Publisher’s Note: The statements, opinions and data contained in all publications are solely those of the individual author(s) and contributor(s) and not of MDPI and/or the editor(s). MDPI and/or the editor(s) disclaim responsibility for any injury to people or property resulting from any ideas, methods, instructions or products referred to in the content.