Article

Integrated Transcriptome and Metabolome to Elucidate the Mechanism of Aluminum-Induced Blue-Turning of Hydrangea Sepals

Hunan Mid-Subtropical Quality Plant Breeding and Utilization Engineering Technology Research Center, College of Horticulture, Hunan Agricultural University, Changsha 410128, China
*
Author to whom correspondence should be addressed.
Horticulturae 2024, 10(7), 745; https://doi.org/10.3390/horticulturae10070745
Submission received: 21 June 2024 / Revised: 11 July 2024 / Accepted: 12 July 2024 / Published: 15 July 2024

Abstract

:
Hydrangea macrophylla is an ornamental plant with varied calyx colors. Interestingly, from red, to purple, to blue, the colors of all Hydrangea macrophylla are formed by unique delphinidin-3-O-glucoside and aluminum ions (Al3+) and 5-O-p-coumaroylquinic acid. The sepals of ‘Blue Mama’ changed from pink to blue, and the contents of delphinidin-3-O-glucoside and aluminum ions increased under 3 g/L aluminum sulfate treatment. However, the mechanism of the effect of aluminum ions on the synthesis and metabolism of anthocyanins in Hydrangea macrophylla is still unclear. In this project, transcriptome sequencing and anthocyanin metabolome analysis were performed on the sepals of ‘Blue Mama’ during flower development at the bud stage (S1), discoloration stage (S2) and full-bloom stage (S3) under aluminum treatment. It was found that delphinidin, delphinidin-3-O-glucoside and delphinidin-3-O-galactoside were the main differential metabolites. The structural genes CHS, F3H, ANS, DFR and BZI in the anthocyanin synthesis pathway were up-regulated with the deepening in sepal color. There was no significant difference between the aluminum treatment and the non-aluminum treatment groups. However, seven transcription factors were up-regulated and expressed to regulate anthocyanin synthesis genes CHS, F3H, BZI and 4CL, promoting the sepals to turn blue. The KEGG enrichment pathway analysis of differentially expressed genes showed that the glutathione metabolism and the ABC transporter pathway were closely related to anthocyanin synthesis and aluminum-ion transport. GST (Hma1.2p1_0158F.1_g069560.gene) may be involved in the vacuolar transport of anthocyanins. The expression of anthocyanin transporter genes ABCC1 (Hma1.2p1_0021F.1_g014400.gene), ABCC2 (Hma1.2p1_0491F.1_g164450.gene) and aluminum transporter gene ALS3 (Hma1.2p1_0111F.1_g053440.gene) were significantly up-regulated in the aluminum treatment group, which may be an important reason for promoting the transport of anthocyanin and aluminum ions to vacuoles and making the sepals blue. These results preliminarily clarified the mechanism of aluminum ion in the synthesis and transport of anthocyanin in Hydrangea macrophylla, laying a foundation for the further study of the formation mechanism of ‘blue complex’ in Hydrangea macrophylla.

1. Introduction

Hydrangea macrophylla is a deciduous shrub of the Hydrangeaceae family, and it is also an aluminum-enriched plant. Its petal-like sepals are the main ornamental parts, including white, pink, blue and purple, and the color of sepals can change with the content of aluminum ions in the sepals. This phenomenon has also attracted the attention of botanists and horticulturists [1].
Flower color is an important trait of ornamental plants, and the formation of plant flower color is affected by a combination of factors, including core anthocyanin types, anthocyanin transport methods, anthocyanin accumulation and metal ions. Anthocyanin biosynthesis pathway is an important branch of plant flavonoid pathway, and its biosynthesis is regulated by structural genes and transcription factors. The structural genes include upstream structural genes CHS, CHI and F3H, and downstream structural genes DFR, F3H, F35H, ANS and UFGT. Among them, F35H is a key enzyme gene for the synthesis of blue flower core pigment delphinidin. The expression of these structural genes is regulated by transcription factors such as MYB, bHLH and WD40, which regulate the expression of genes related to anthocyanin biosynthesis by binding to the corresponding cis-acting elements in the structural gene promoter [2]. In the cultivars of Hydrangea macrophylla, the same anthocyanin (delphinidin-3-O-glucoside) can make sepals appear red, purple and blue [3]. At present, the structural genes F3H and DFR in the anthocyanin synthesis pathway and the transcription factor HymMYB2 related to the formation of blue Hydrangea macrophylla have been identified from Hydrangea macrophylla [4,5].
The transport and storage of anthocyanin to vacuole after anthocyanin synthesis is also a key process affecting plant coloring. Anthocyanin transporters play an important role in the accumulation of anthocyanin. At present, four kinds of anthocyanin transport models have been proposed, and it has been found that GST, MRP, MATE and BTL-homologous proteins may be involved in the transport of anthocyanin to vacuoles [6]. The protein structure of GSTs determines the diversity of their functions. Studies have confirmed that GSTU involved in flavonoid accumulation is involved in the regulation of anthocyanins. GSTF substrates are widely available and are involved in the accumulation of many components of flavonoids, and GSTF12 encoded by Petunia (Petunia hybrida) PhAn9 directly binds to anthocyanins, transporting them to the vesicles [7]. Maize (Zea mays L.) Bz2 was the first GST family member found to be related to anthocyanin glycoside transport [8], and GST genes related to anthocyanin accumulation were subsequently reported in cyclamen (Cyclamen persicum) [9], chrysanthemums (Chrysanthemum morifolium Ramat.) [10], guayule (Senecio cruentus) [11], peonies (Paeonia suffruticosa) [12] and other ornamental plants. ABC transporters play a key role in plant secondary metabolite transport, exogenous toxin detoxification, lipid metabolism and plant disease resistance. Some members of the ABCC/MRP subfamily act as glutathione S-crosslinking binding pumps on the vacuolar membrane and participate in the transmembrane transport of anthocyanins. In the mutant analysis of maize and petunia, it was found that GST-deficient mutants could not accumulate anthocyanins into vacuoles. MRP/ABCC not only had a substrate preference for glutathione conjugates, but also improved its transport activity [8,13]. Similar findings suggest that Arabidopsis AtMRP1 and AtMRP2 [14,15], maize ZmMRP3 [16], rice (Oryza sativa L.) OsMRP15 [17] and grape (Vitis vinifera L.) ABCC1 are associated with transmembrane transport of anthocyanin glycosides [18].
Studies have confirmed that in acidic soil, Hydrangea macrophylla absorbs and transports aluminum ions to the sepals, and the content of Al3+ in the sepals of blue Hydrangea macrophylla is about 40 times that of red sepals [19]. The ‘blue complex’ in the blue sepals is composed of delphinidin-3-O-glucoside, aluminum ions and 5-O-acylquinic acid in a ratio of 1:1:1 [20,21,22]. As an aluminum hyperaccumulator, Hydrangea macrophylla has a natural tolerance to aluminum ions. The aluminum transporter genes HmPALT and HmVALT on the plasma membrane and vacuole membrane have been cloned from the sepals of Hydrangea macrophylla [23]. Aluminum treatment not only activates the activity of transporters, but also promotes the increase in anthocyanin content in the sepals and makes the sepals’ color blue; the ABCC1 gene of hydrangea was also up-regulated by aluminum, which promoted the accumulation of Al3+ in the sepals [24,25,26]. At present, many advances have been made in understanding the chemical mechanism of sepal color formation in Hydrangea macrophylla, including the structure of the blue complex, the transporters involved in the accumulation of aluminum ions and the distribution of aluminum ions in the sepals. However, the molecular mechanism of aluminum-induced sepal color formation in Hydrangea macrophylla remains to be further studied.
We conducted this experiment in order to explore the molecular mechanism and metabolic pathway of sepal color change caused by aluminum treatment and to determine the key genes regulating color formation. In this study, transcriptome sequencing and metabolite analysis were performed on the sepals of Al-treated H. macrophylla ‘Blue Mama’ at the bud stage (S1), discoloration stage (S2) and full-bloom stage (S3). The changes in metabolites during the process of sepals turning blue were studied, the differentially expressed genes and transcription factors related to anthocyanin synthesis and transport were identified, and the related transcriptional regulatory network was constructed to reveal the differential regulation of genes involved in anthocyanin accumulation. This finding is helpful to further elucidate the regulatory mechanism of aluminum-induced anthocyanin accumulation to form blue flowers.

2. Materials and Methods

2.1. Plant Materials and Experimental Treatment

Three-year-old hydrangea plants of the ‘Blue Mama’ variety, uniform in the growth stage and size, were selected and planted in five-gallon pots filled with a mixed substrate (vermiculite/perlite/peat/garden soil = 2:2:3:3). These pots were placed in the flower base of the College of Horticulture, Hunan Agricultural University, for uniform maintenance and management. The first aluminum treatment was started at the budding stage in early March 2022. The concentrations of Al2(SO4)3 (Sinopharm Chemical Reagent Co. Ltd., Shanghai, China) were 1, 3 and 5 g/L, respectively, and water was used as the control. The treatment was performed once every 10 days during the growth and development process, with 3 pots for each treatment and 3 biological replicates. According to the characteristics of sepals at different stages of flower development, they were divided into S1 stage (bud stage), S2 stage (discoloration stage) and S3 stage (full-bloom stage). Three inflorescences were randomly selected from each treatment, and three sepals were taken from each inflorescence. This process was repeated three times, and the samples were stored at −80 °C.

2.2. Flower Color Determination

The Royal Horticultural Society Color Chart (RHSCC) and colorimeter (3nh-YS30, Shenzhen Sanenshi Technology Co., Ltd., Shenzhen, China) were used to determine the color (brightness L* value, redness a* value, blueness b* value) of the middle part of the calyx of Hydrangea macrophylla. Each calyx was measured three times, and the average value was taken [27].

2.3. Determination of Metal ion Content

At the S3 stage, the roots, stems, leaves and fresh sepals of the plants were taken, washed and dried in an oven to constant weight. Then, the samples were ground into powder and passed through a 100-mesh sieve. A 0.1 g portion of the ground sample was weighed, and 5 mL of nitric acid was added for digestion. The mixture was diluted to 50 mL with distilled water and then diluted 10 times. The content of Al3+ was determined by ICP-MS (Agilent 7900 ICP-MS, Agilent Technologies, Santa Clara, CA, USA) [28]. Each treatment group was set up with 3 replicates.

2.4. Extraction and Determination of Anthocyanin

The fresh sepals were placed in a mortar and quickly ground to a fine powder with liquid nitrogen. The 250 mg powder was weighed in a centrifuge tube. After the liquid nitrogen was volatilized, 1 mL anthocyanin extract (Vmethanol/Vwater/Vformic acid = 70:27:3) was added. Then, it was placed on a shaker and shaken well. The centrifuge tube was wrapped completely with tin paper and placed in a refrigerator at 4 °C for 12 h. After the extraction was completed, it was shaken once again. Then, it was transferred to a centrifuge (5424R, Eppendorf AG, Hamburg, DE) at 4 °C and centrifuged at 10,000 rpm/min for 5 min. The supernatant was taken, filtered through a 0.45 μm filter membrane, and the filtrate was stored in an injection bottle. It was then detected and analyzed by high performance liquid chromatography (CBM-20A, Shimadzu, Kyoto, Japan). The chromatographic column was Welchrom ® C18 (4.6 mm × 250 mm, 5 μm). The mobile phase A was 5% formic acid aqueous solution, and the mobile phase B was 5% formic acid acetonitrile. The flow rate was 1.0 mL/min. Elution gradient: 0 min, 5% B; 8~13 min, 13% B; 13~20 min, 17% B; 20~23 min, 17% B; 23~30 min, 20% B; 30~40 min, 20% B; 40~40.1 min, 5% B; 40.1~50 min, 5% B. The detection wavelength was 520 nm. The external standard method was used to quantify the sample. The standard was delphinidin-3-O-glucoside, and the standard curve was y = 40,922x − 1166.5 (R2 = 1).

2.5. Metabolite Extraction and Analysis

Metabolome analysis was performed using 18 sepal samples (sepals at three stages of flower development in the CK group and the 3 g/L aluminum treatment group, three biological replicates).Weigh 20 mg of freeze-dried and ground calyx samples in a 2 mL centrifuge tube, add 1 mL of methanol: aqueous solution (7:3, v/v, containing 0.1% formic acid) vortex for 30 s, homogenize at 45 Hz for 15 min and ultrasound for 30 min under ice water bath conditions. The samples were centrifuged at 4 °C and 12,000 r/min for 15 min, and 200 μL of the supernatant was filtered through a 0.22 μm filter membrane and analyzed by the UHPLC-MS/MS system.
UHPLC conditions: the UHPLC separation was carried out using a Waters ACQUITY I-Class (Waters Corporation, Milford, MA, USA), equipped with an ACQUITY UPLC HSS T3 (100 mm × 2.1 mm, 1.8 μm, Waters). The mobile phase A was 0.1% formic acid in water, and the mobile phase B was 0.1% formic acid in acetonitrile. Elution gradient: 0 min, 5% B; 1 min, 5% B; 4 min, 30% B; 9 min, 60% B; 12 min, 80% B; 14 min, 5% B. The column temperature was set to 35 °C. The auto-sampler temperature was set to 10 °C, and the injection volume was 2 μL.
Mass spectrometer conditions: a SCIEX 6500 QTRAP + triple quadrupole mass spectrometer (SCIEX, Hermosa Beach, CA, USA) equipped with IonDrive Turbo V ESI ion source was used for mass spectrometry analysis in multiple reaction monitoring (MRM) mode. Multi-Response Monitoring (MRM) was developed by biomarker biotechnology (Beijing, China). The ion-source parameters were as follows: curtain gas = 35 psi, IonSpray voltage = +5500 V, −4500 V, temperature = 550 °C, ion-source gas 1 = 50 psi, ion-source gas 2 = 55 psi.
In this study, qualitative and quantitative analysis of anthocyanin metabolites was carried out based on the UHPLC-MS/MS platform, combined with standard substances. The information on standard substances, standard curves and method detection limits is shown in Table S1. The screening criteria for differential metabolites were fold change ≥ 1, VIP ≥ 0 and p < 0.05.

2.6. Transcriptome Analysis

As with the samples used for metabolomics analysis, 18 sepal samples were used for transcriptomics analysis. Total RNA was extracted from each sepal samples using RNAprep Pure Plant Kit reagent (Tiangen, Beijing, China). RNA quality and integrity were detected using the NanoDrop 2000 spectrophotometer (Thermo Fisher Scientific, Wilmington, DE, USA) and the Agilent 2100 bioanalyzer (Agilent Technologies, Santa Clara, CA, USA). The cDNA library was generated using the NEBNext ® UltraTM RNA non-strand-specific library preparation kit (NEB, Ipswich, MA, USA). After the cDNA library quality was evaluated by the Agilent Bioanalyzer 2100 system, sequencing was performed on the Illumina high-throughput sequencing platform. The original sequence data containing adaptors and low-quality reads (N% > 10%, Q ≤ 10 bases > 50%) were removed to obtain high-quality clean data. The clean reads were aligned to the Hydrangea macrophylla reference genome (reference genome version information: Hydrangea_macrophylla.HMA_r1.2_1.genome.fa) using HISAT2 software. After the alignment analysis was completed, StringTie software (v2.2.0) was used for assembly, quantification and standardization using FPKM.
DESeq2 was used to identify differentially expressed genes (DEGs) between different samples (fold change ≥ 1.5, FDR < 0.05). STEM v1.3.13 was used to analyze the temporal expression trend of DEGs, and then TBtools software (version 2.086) was used to perform KEGG (https://www.genome.jp/kegg/, accessed on 16 October 2023) pathway enrichment analysis on DEGs, within the significant enrichment trend (p < 0.05).

2.7. qRT-PCR

qRT-PCR was performed using the ChamQ Universal SYBR qPCR Master Mix reagent (Vazyme, Nanjing, China) and the Bio-Rad CFX96 RT-PCR system (Bio-Rad, Hercules, CA, USA). Each sample was analyzed in triplicate. Specific primers were designed using Primer Premier 5.0 (Table S2). The relative gene expression level was calculated by the 2−ΔΔCT method [29].

2.8. Data Analysis

Excel 2019 and SPSS 20.0 were used for data statistics, as well as one-way analysis of variance (ANOVA); p < 0.05 was statistically significant. Correlation analysis was performed using the Maiwei Cloud platform (https://cloud.metware.cn/, accessed on 20 November 2023). Diagrams were produced using Graphpad Prism 8.0, Adobe Photoshop 2020 and Cytoscape v3.7.1.

3. Results

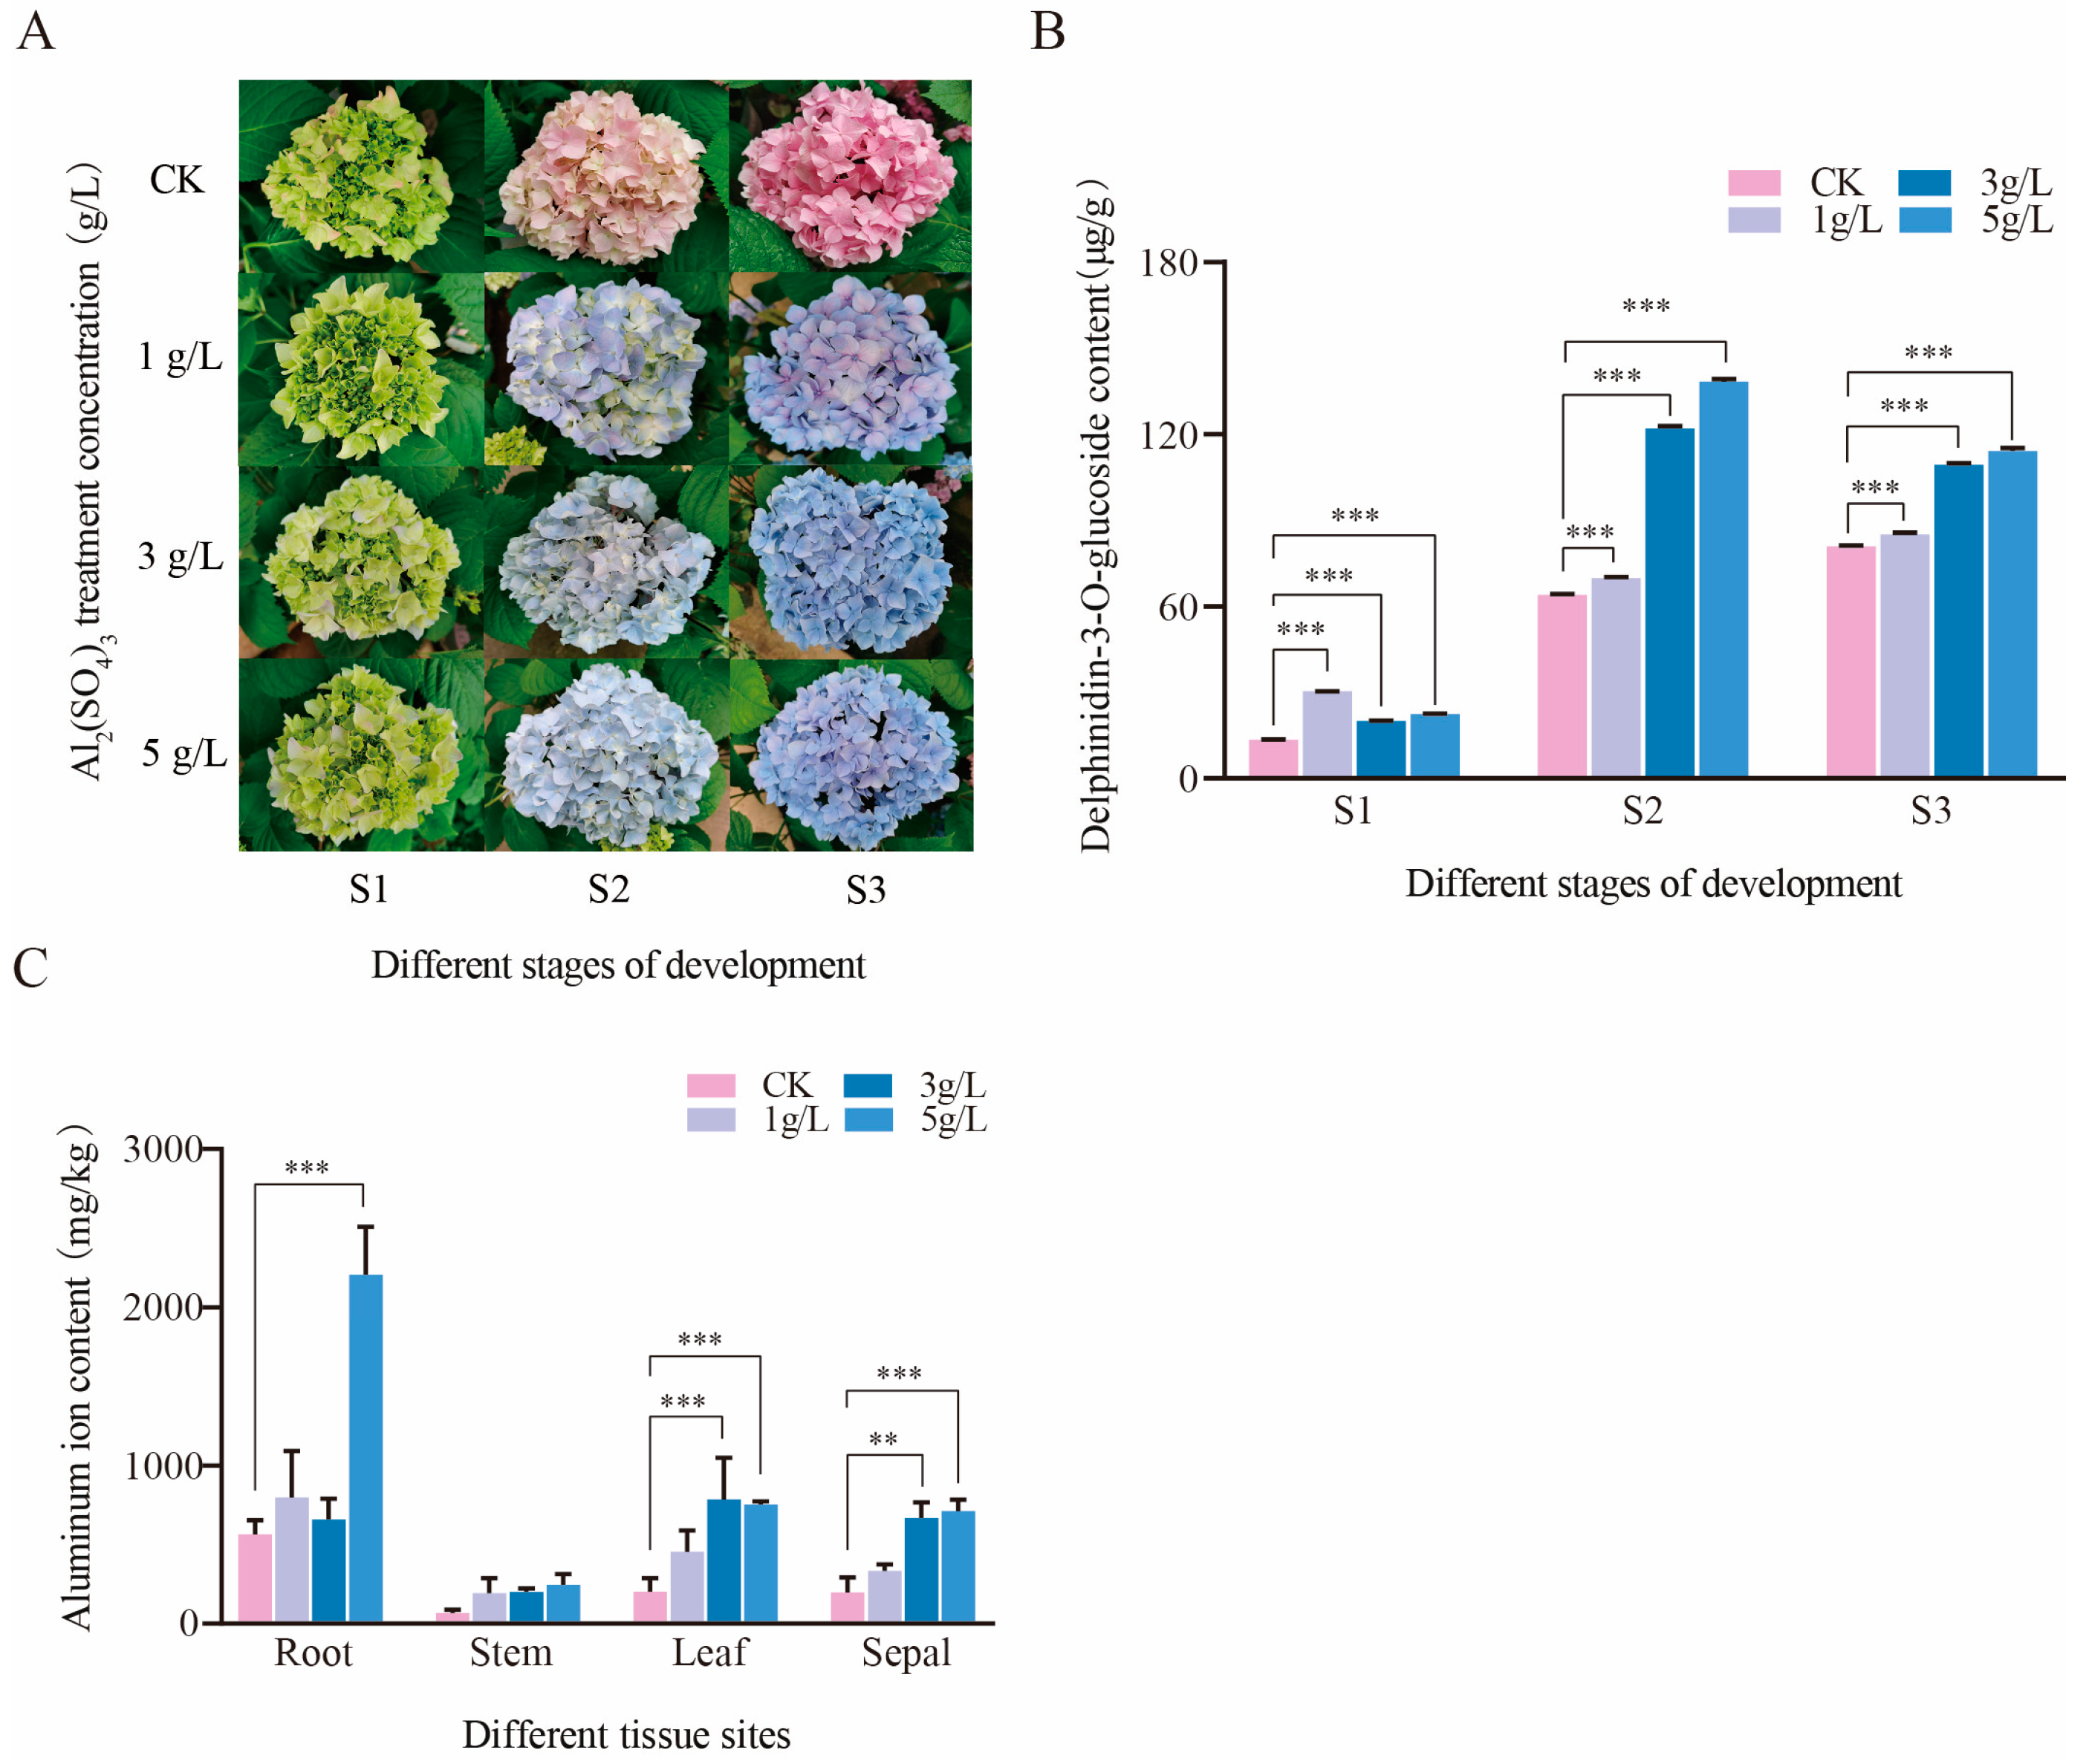
3.1. The Changes in Calyx Color and Metal Ion Content under Different Concentrations of Aluminum Treatment

Figure 1A,B and Table S3 show that with the development of flowers, the calyx began to color from green (S1) and completely colored at the S3 stage. Aluminum treatment made the sepals color turn blue. With the increase in the aluminum treatment concentration, the sepals were light purple (P-V N82D), blue (B101C) and purple blue (V-B98C), and the content of delphinidin-3-O-glucoside also increased. The content of aluminum ions in each part of the plant was measured during the full-bloom stage. It was found that the aluminum treatment promoted the upward transport of aluminum ions in the plant and accumulated them in the sepals and leaves. This trend was consistent with the change trend in the delphinidin-3-O-glucoside content. However, when the aluminum treatment concentration was 5 g/L, a large amount of aluminum ions accumulated in the roots, which may cause aluminum toxicity (Figure 1C). It was concluded that aluminum treatment promoted the accumulation of anthocyanins and aluminum ions in the sepals. When the concentration of aluminum sulfate was 3 g/L Al2(SO4)3, ‘Blue Mama’ formed blue sepals.

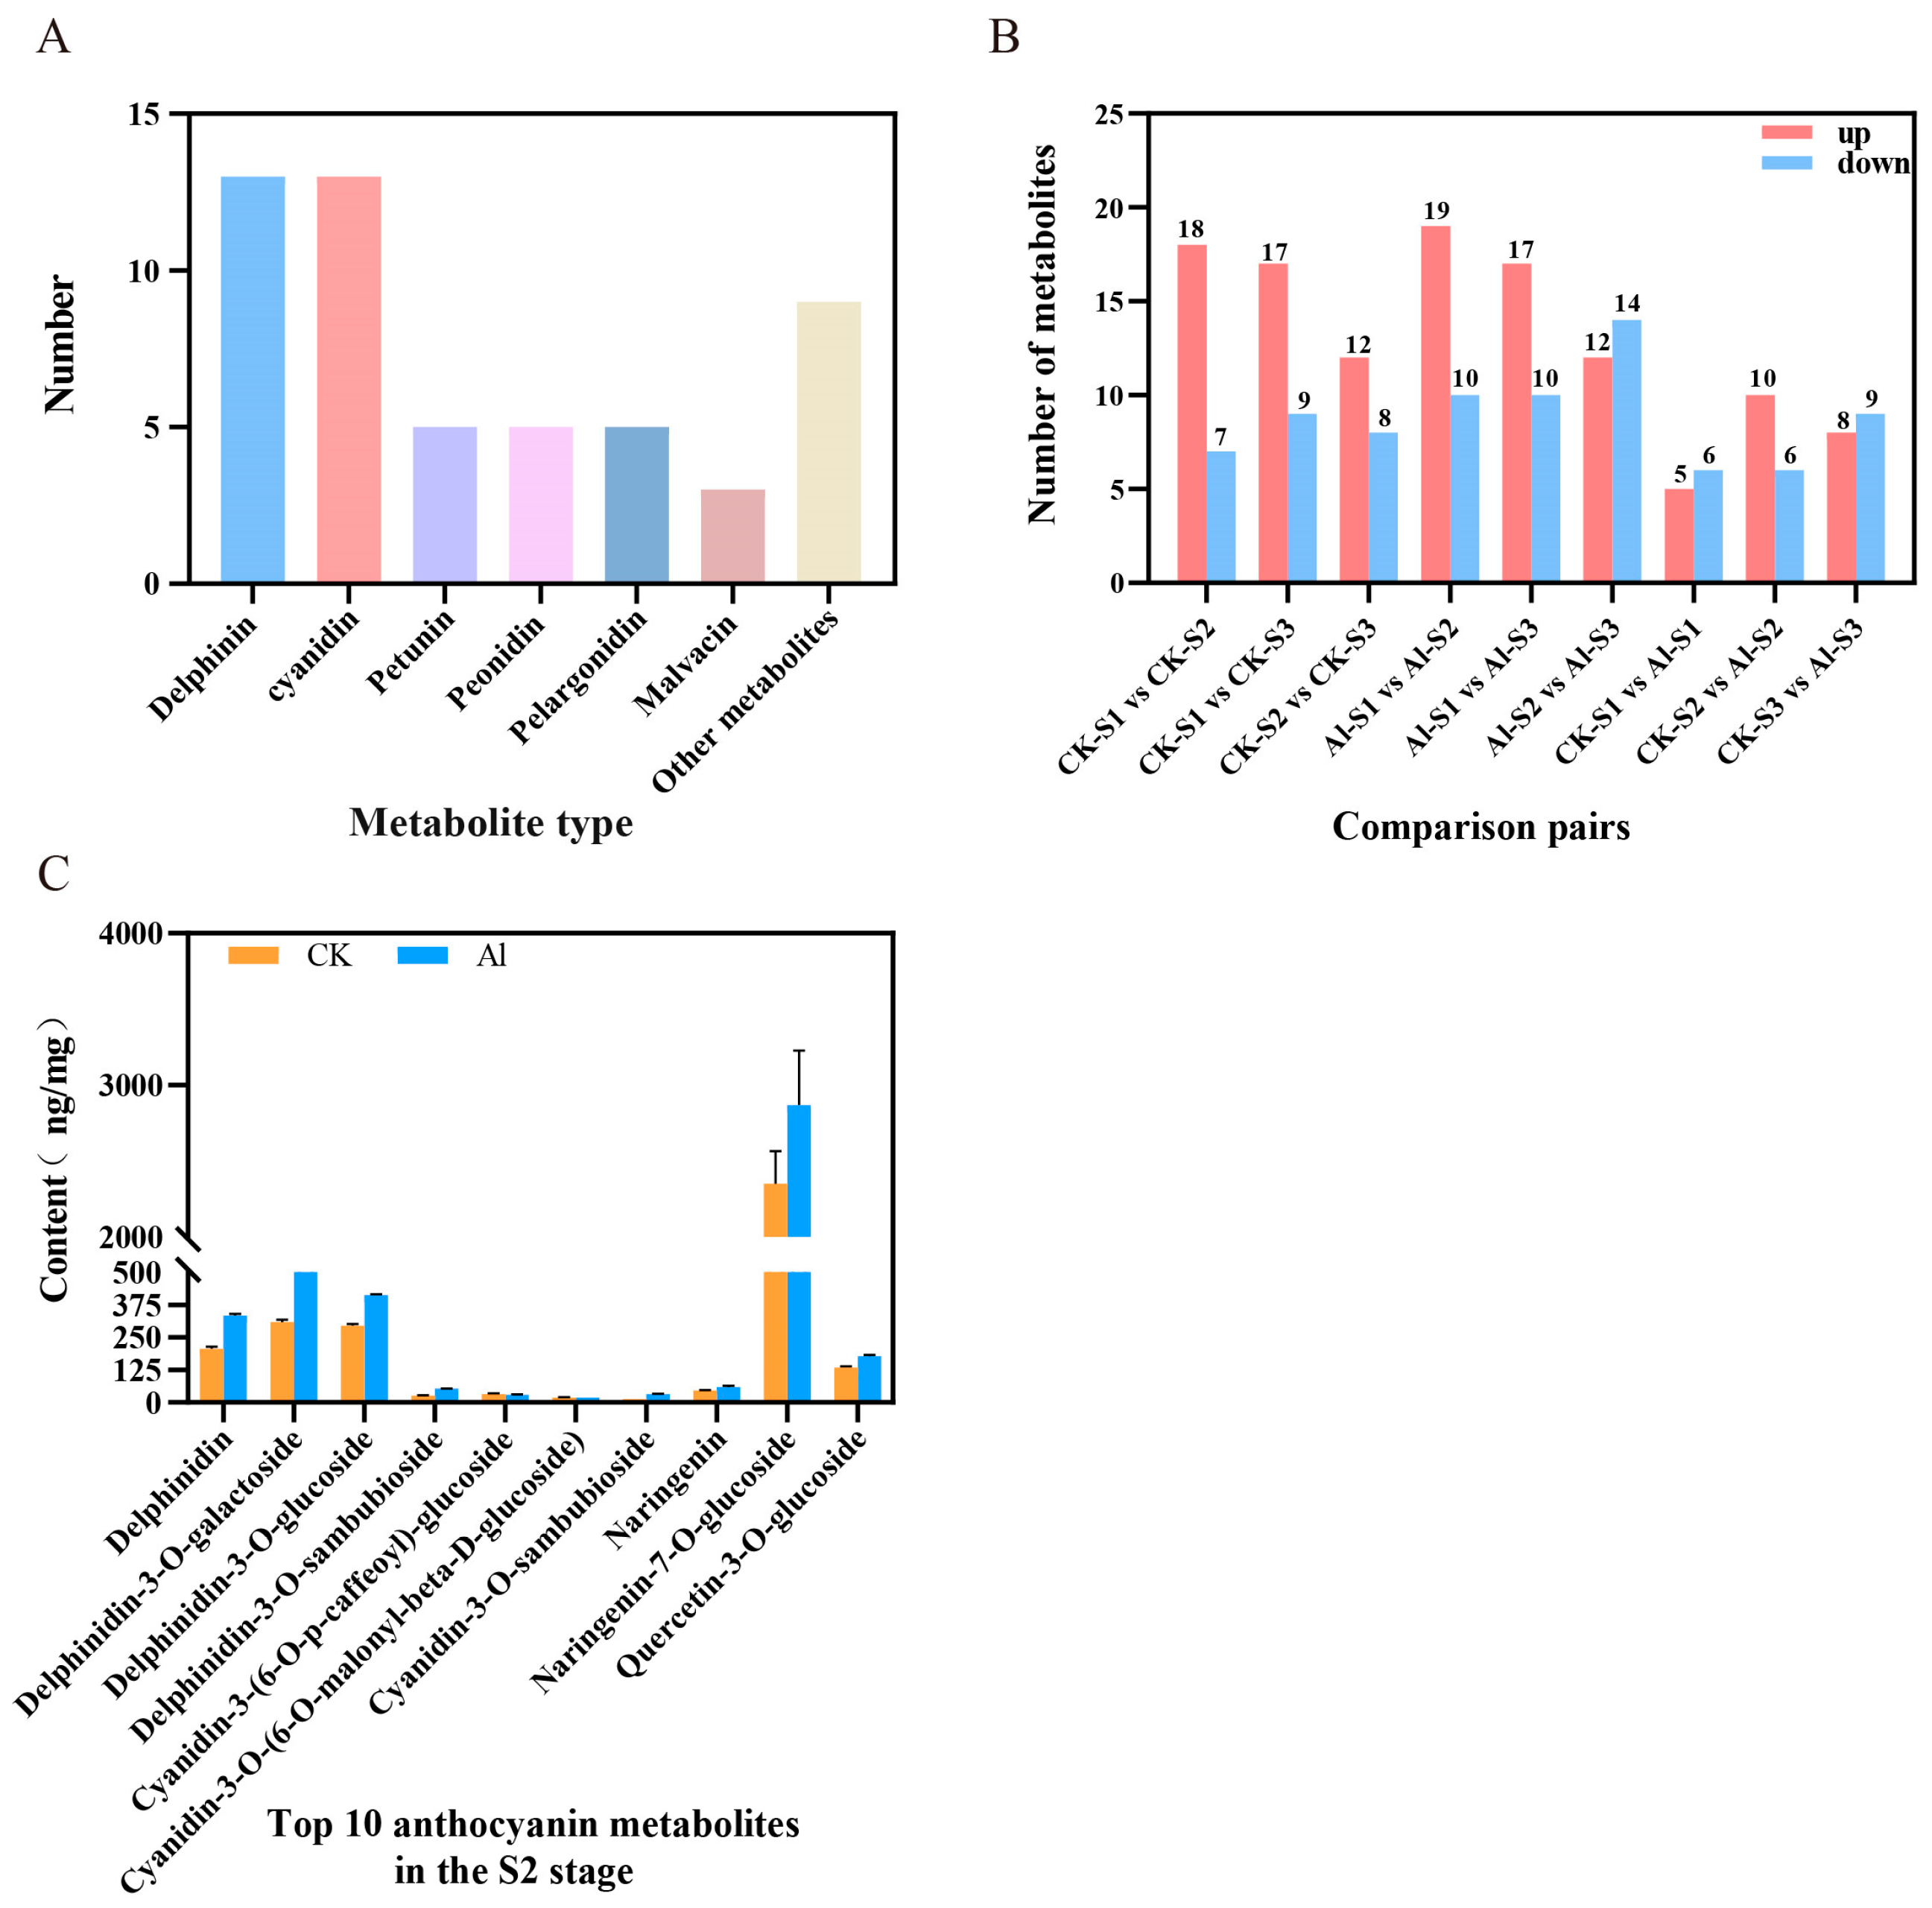
3.2. Metabolome Analysis of Anthocyanins

In order to understand the changes in the anthocyanin composition and content during the sepal coloration of Hydrangea macrophylla, the changes in anthocyanin metabolites during three developmental stages were detected by the UHPLC-MS/MS method. A total of 53 anthocyanin metabolites were detected in the samples, including 13 delphinidins, 13 cyanidins, 5 petunidins, 5 peonidins, 5 pelargonidins, 3 malvidins and others (Figure 2A, Table S4). The sepals of the aluminum-free treatment group changed from green to pink. Through the analysis of differential metabolites during development, it was found that the number of differential metabolites up-regulated and down-regulated in CK-S1 vs. CK-S2, CK-S1 vs. CK-S3 and CK-S2 vs. CK-S3 were 18 and 7, 17 and 9, 12 and 8, respectively (Figure 2B). Further analysis showed that delphinidin, delphinidin-3-O-glucoside, delphinidin-3-O-galactoside and naringenin-7-O-glucoside were the main anthocyanin metabolites in the pink sepals. The contents of these four metabolites continued to increase during sepal coloration and peaked at the S3 stage.
The sepals of the 3 g/L Al2(SO4)3 treatment group changed from green to blue. Through the analysis of differential metabolites during development, it was found that in Al-S1 vs. Al-S2, Al-S1 vs. Al-S3 and Al-S2 vs. Al-S3, the number of differential metabolites up-regulated and down-regulated were 19 and 10, 17 and 10, 12 and 14, respectively (Figure 2B). Delphinidin, delphinidin-3-O-glucoside, delphinidin-3-O-galactoside and naringenin-7-O-glucoside were the main metabolites in the blue sepals. These results are the same as the results of the aluminum-free treatment group. However, the content of metabolites increased significantly from the S1 to the S2 stage and reached the peak in the S2 stage. Therefore, the S2 stage was considered to be the key period for the color of blue Hydrangea macrophylla.
Compared with the aluminum-free treatment group, the number of differential metabolites up-regulated and down-regulated in the three developmental stages were 5 and 6, 10 and 6, 8 and 9, respectively (Figure 2B). After aluminum treatment, the sepals were blue at the S2 stage, and the contents of delphinidin, delphinidin-3-O-galactoside and delphinidin-3-O-glucoside in the sepals were significantly higher than those in the aluminum-free treatment group (Figure 2C). Therefore, it is speculated that the significant increase in the content of delphinidin and its derivatives induced by aluminum in the S2 stage is the key period for the sepals to turn blue.

3.3. Calyx Transcriptome Analysis Data Statistics

Transcriptome sequencing was performed on the sepals of three stages of flower development of ‘Blue Mama’ treated with 3 g/L aluminum sulfate solution, and a total of 117.50 Gb clean data were obtained with water treatment as the control. The results of the PCA showed that the biological repeatability was good, and there was a strong correlation between the samples in each group (R2 > 0.82) (Figure S1). Therefore, the transcriptome sequencing data is reliable and can be used for subsequent analysis. With fold change ≥ 1.5 and FDR < 0.05 as the screening conditions for differential genes (Table S5), it can be seen from Figure 3A that there are a large number of differential genes between the three stages of flower development, among which the number of differential genes in S1 and S3 stages is the largest. Compared with the control group, the number of differential genes in the S2 stage was the highest. From the Venn diagram of differential genes within and between groups, it can be seen that the number of differential genes unique to the S2 stage is the most, which is 22.8 times that of the S1 stage and 2.4 times that of the S3 stage (Figure 3B). The above results show that the period from S1 to S2 was the key period for sepal coloration of Hydrangea macrophylla.

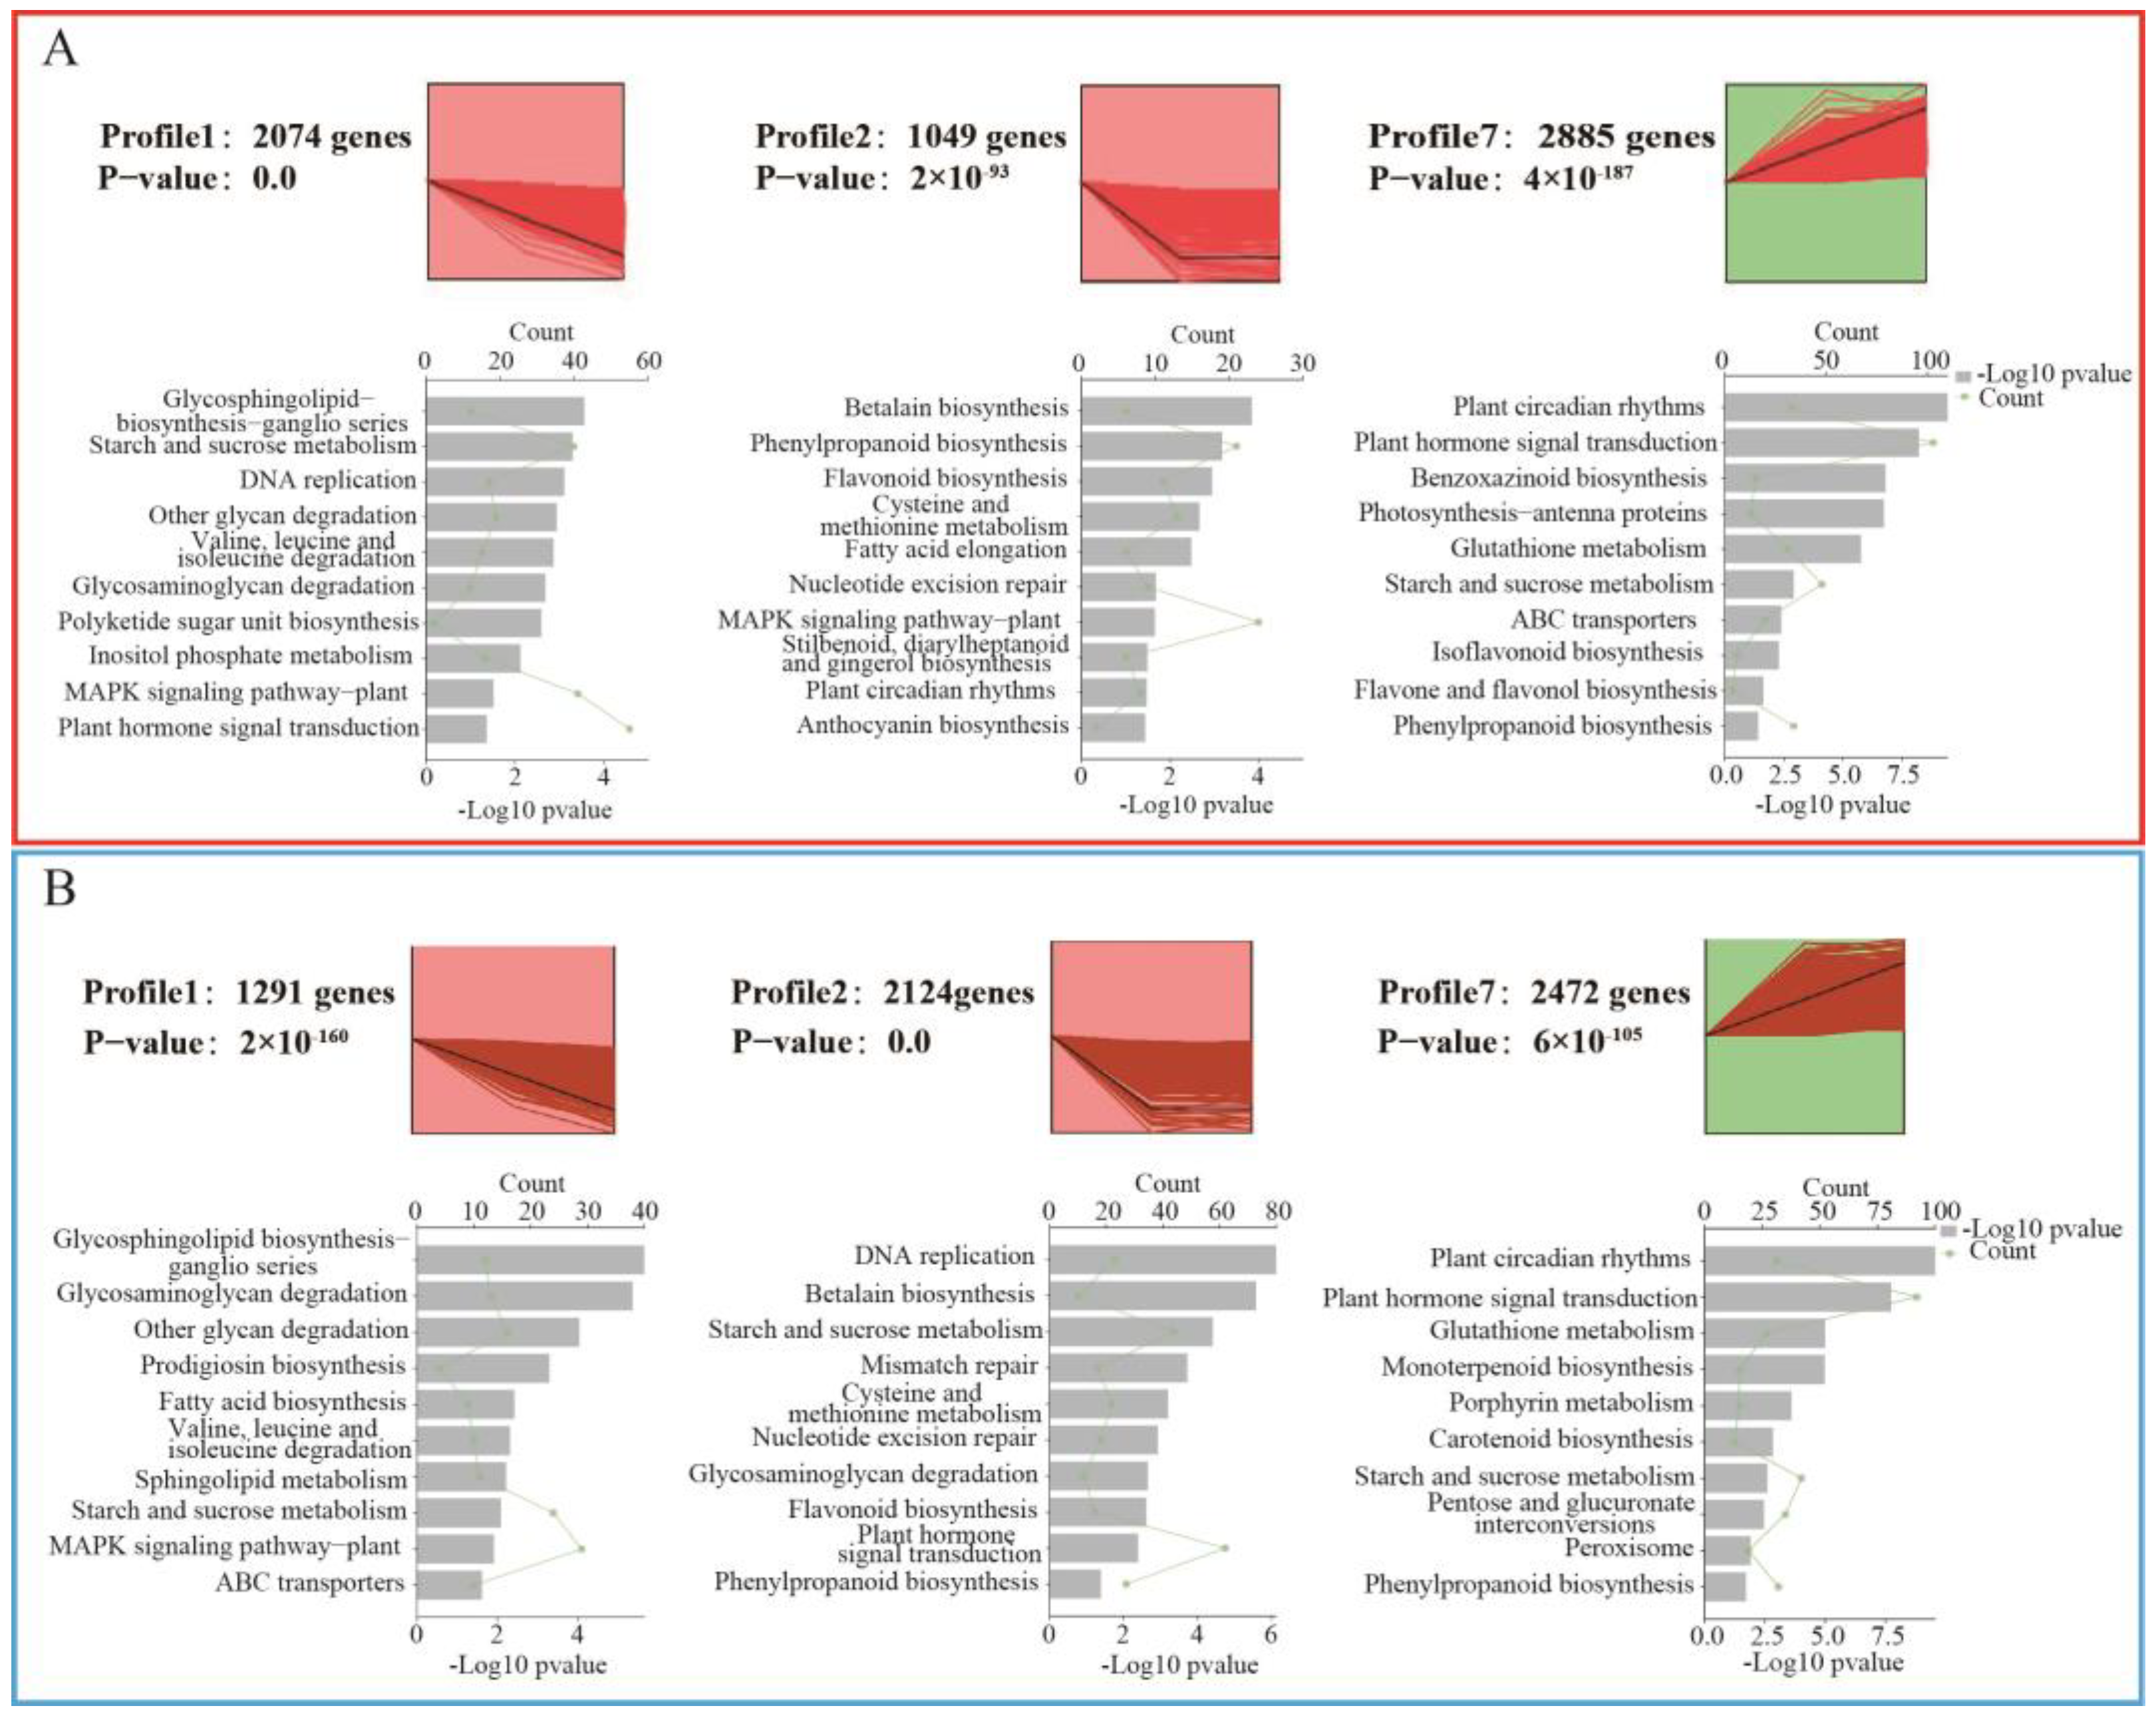
3.4. Changes in Gene Expression Profiles in Different Treatment Groups

In order to further understand the relevant biological processes, the co-expression profiles of the differential gene sets of the aluminum-free treatment group and the aluminum treatment group at the three flower development stages were analyzed. The results showed that 11,988 and 12,630 differentially expressed genes in the two treatment groups were classified into eight different expression patterns (Figures S2 and S3), and there were three significant temporal expression patterns in both groups. Subsequently, KEGG enrichment analysis was performed on genes in significant expression profiles (p < 0.05). Profile7 of the two treatment groups contained genes that were positively regulated throughout the time course, and some of them were enriched in plant circadian rhythms, plant hormone signal transduction, glutathione metabolism, starch and sugar metabolism, phenylpropanoid biosynthesis pathway (Figure 4). In addition, in the aluminum treatment group, the genes involved in peroxisome metabolism were also specifically enriched in Profile7 (Figure 4B). These results suggest that these biological pathways have potentially important effects on the calyx coloration of Hydrangea macrophylla.

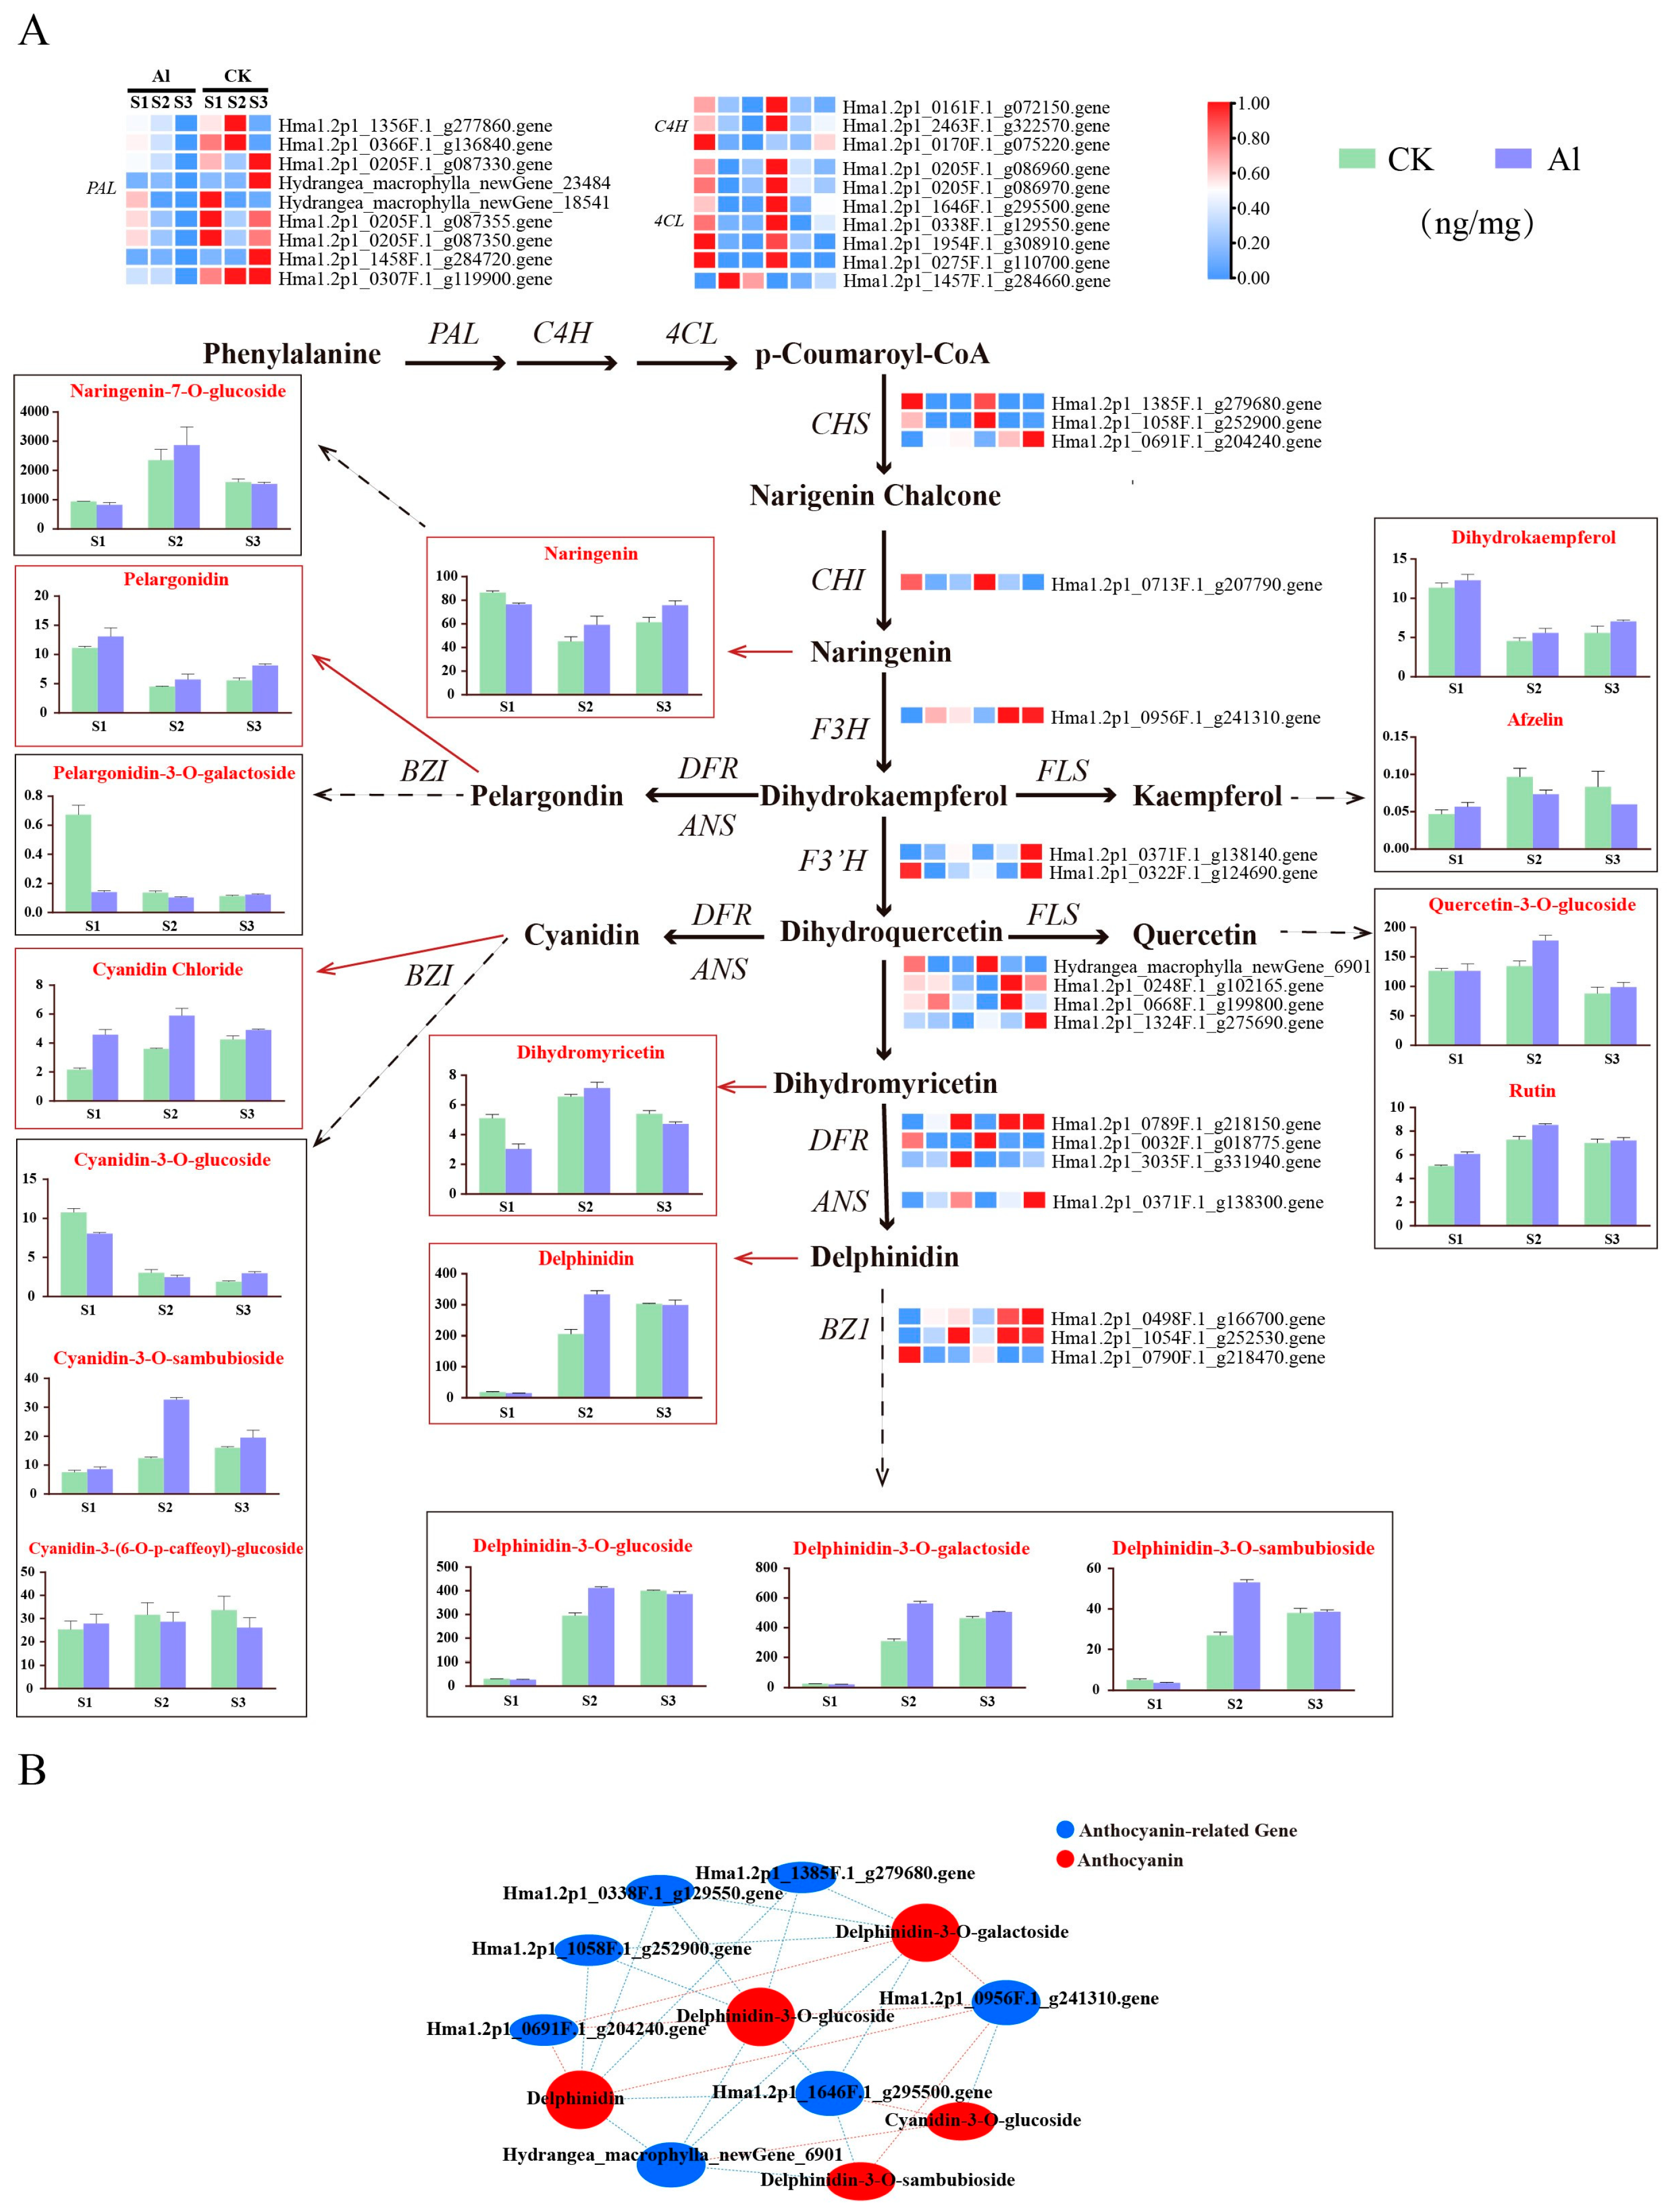
3.5. Association Analysis of Differential Genes and Metabolites in Anthocyanin Biosynthesis

The anthocyanin biosynthesis pathway is an important metabolic branch of the flavonoid pathway, which is responsible for the production of anthocyanins in different plant tissues. Phenylalanine is a precursor for the biosynthesis of flavonoids. It is catalyzed by phenylalanine ammonia lyase (PAL), cinnamic acid 4-hydroxylase (C4H) and 4-coumarate CoA ligase (4CL). During the development of Hydrangea macrophylla, 9 PAL, 3 C4H and 7 4CL genes were differentially expressed. However, only 1 4CL (Hma1.2p1_1457F.1_g284660.gene) gene was significantly up-regulated, and the expression level of the aluminum treatment group was higher than that of the control group.
By analyzing the differentially expressed genes in the anthocyanin metabolic pathway, the results showed that during the development of H. macrophylla flowers, as the sepals color changed from green to pink and blue, that is, from the S1 to the S3 stage, the CHS (Hma1.2p1_0691F.1_g204240.gene), F3H (Hma1.2p1_0956F.1_g241310.gene), ANS (Hma1.2p1_0371F.1_g138300.gene), DFR (Hma1.2p1_0789F.1_g218150.gene), BZI (Hma1.2p1_0498F.1_g166700.gene) genes were significantly up-regulated in the two treatment groups (Figure 5A). The Pearson correlation coefficient method was used to calculate the correlation between differential genes and major metabolites in the anthocyanin biosynthesis metabolism, and a total of seven structural genes for anthocyanin biosynthesis and five differential metabolites were identified as having a correlation with each other (Figure 5B, Table S6). Among them, delphinidin, delphinidin-3-O-galactoside and delphinidin-3-O-glucoside were positively correlated with CHS (Hma1.2p1_0691F.1_g204240.gene) and F3H (Hma1.2p1_0956F.1_g241310.gene), indicating that the differential expression of the CHS and F3H structural genes played an important role in the pink or blue sepals of Hydrangea macrophylla (Table S6). However, compared with the non-aluminum treatment group, the expression of the CHS and F3H genes in the sepals of H. macrophylla was not significantly up-regulated after aluminum treatment. Therefore, it is speculated that the up-regulation of the anthocyanin biosynthesis genes induced by aluminum may not be the main reason for the blue sepals.

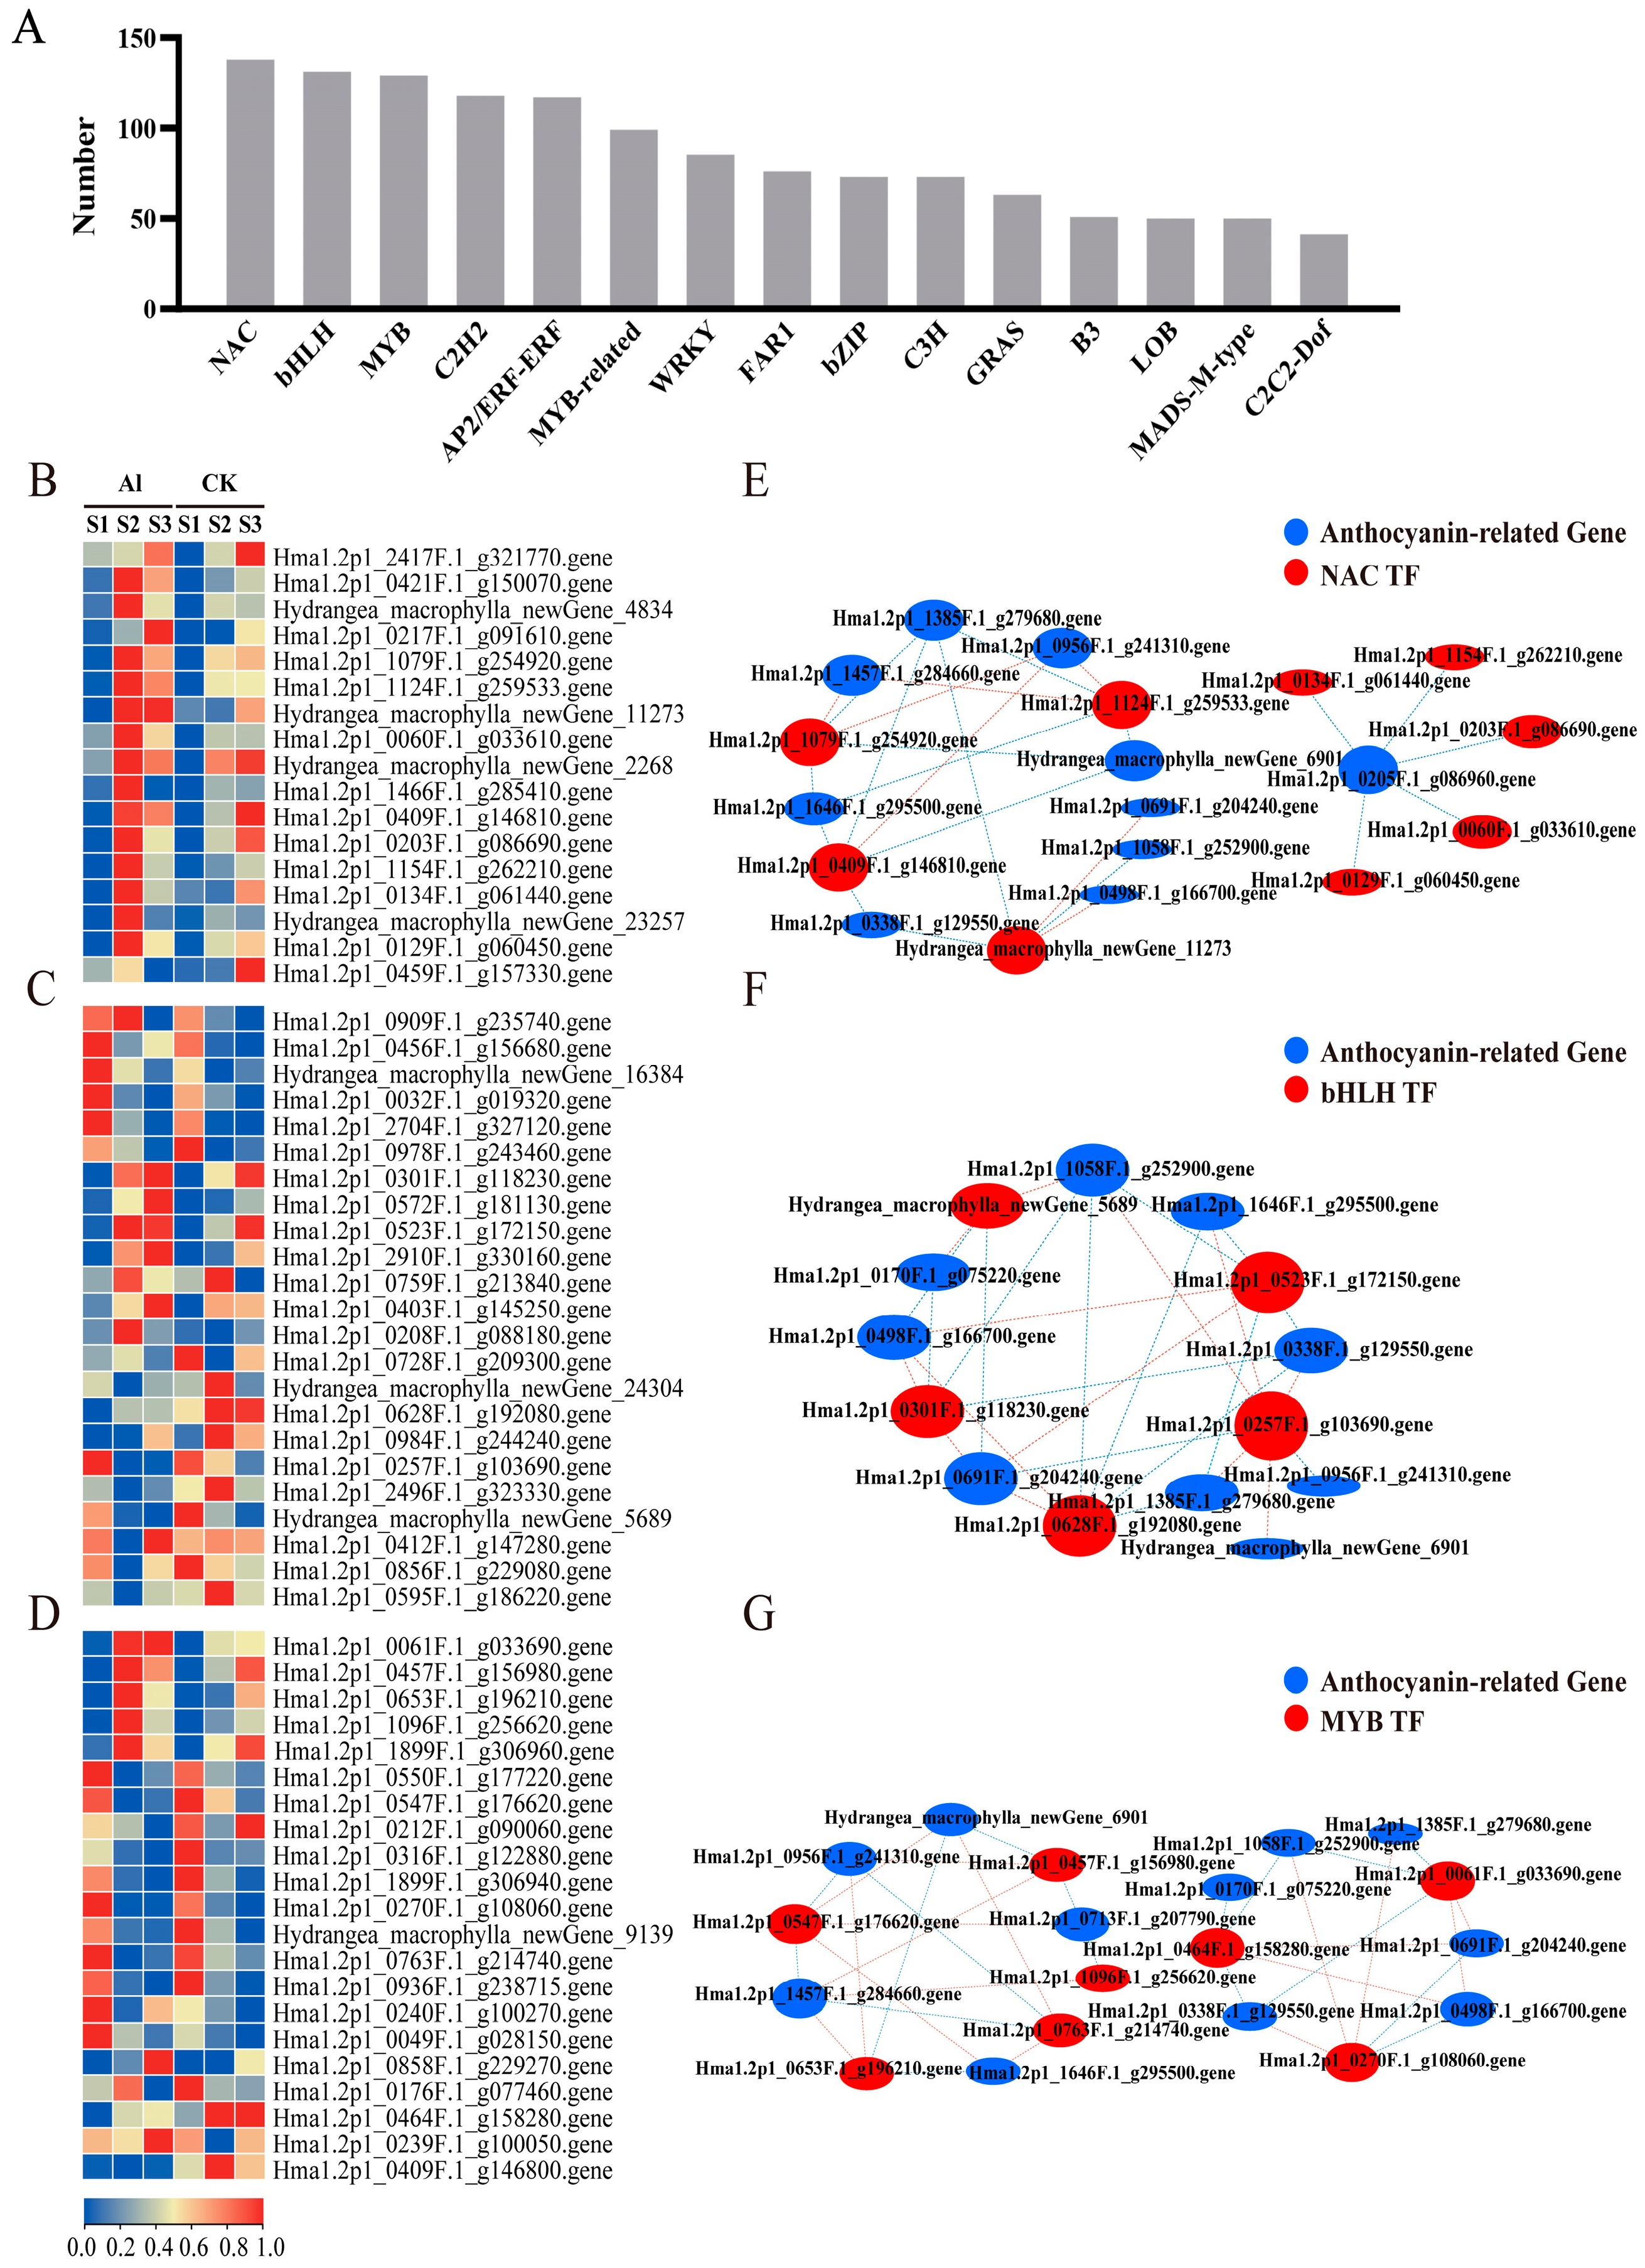
3.6. Expression Analysis of Transcription Factors Related to Anthocyanin Biosynthesis

A total of 69 transcription factor families were identified during the floral development of Hydrangea macrophylla, of which the NAC and bHLH genes were the most abundant, with 138 and 131 members, respectively, followed by MYB, C2H2, AP2/ERF-ERF and other gene families (Figure 6A). Based on the differentially expressed genes FPKM > 5 in at least one sample, 17 NAC genes, 23 bHLH genes and 21 MYB genes were screened. In the aluminum treatment group, the expression of 11 NAC genes, 8 bHLH genes and 7 MYB genes were significantly up-regulated during the key period (S2) of sepal color from green to blue. In addition, eight bHLH genes and six MYB genes were significantly down-regulated (Figure 6B–D).
In order to reveal the potential biological regulatory network of anthocyanin synthesis-related gene expression, we constructed co-expression networks of differentially expressed transcription factors with anthocyanin synthesis structural genes and found that 9 NAC, 5 bHLH, and 8 MYB transcription factors were correlated with the anthocyanin synthesis structural genes (p < 0.05). Among these, NAC (Hma1.2p1_1079F.1_g254920.gene, Hma1.2p1_1124F.1_g259533.gene) and MYB (Hma1.2p1_0457F.1_g156980.gene, Hma1.2p1_0653F.1_g196210.gene) were highly expressed in the S2 stage of the aluminum-treated group and correlated positively with the anthocyanin synthesis structural genes 4CL (Hma1.2p1_1457F.1_g284660.gene) and F3H (Hma1.2p1_0956F.1_g241310.gene) (Figure 6E,G). As shown in Figure 6F,G, bHLH (Hma1.2p1_0523F.1_g172150.gene, Hma1.2p1_0301F.1_g118230.gene) and MYB (Hma1.2p1_0061F.1_g033690.gene) were highly expressed in the aluminum-treated group during the S2 stage and were associated with BZ1 (Hma1.2p1_0498F.1_g166700.gene) and CHS (Hma1.2p1_0691F.1_g204240.gene), which were positively correlated (Table S6). Therefore, it was speculated that aluminum induced the up-regulation of these seven transcription factors to regulate the anthocyanin synthesis genes CHS, F3H, BZI and 4CL and promoted the sepals to turn blue. In addition, the interaction between NAC and MYB and the interaction between bHLH and MYB are worthy of further study.

3.7. Anthocyanin Transporter Gene Expression Analysis

The process of anthocyanin transport and storage to vacuoles after synthesis also directly affects the coloration of plants. It can be seen from Figure 4 that the up-regulated differential genes (Profile7) were significantly enriched in the glutathione metabolic pathway and the ABC transporter pathway during the process of sepals changing from green to pink or blue. By analyzing the differentially expressed genes in the glutathione metabolic pathway, 20 GST genes, 2 GSH genes and 2 GSH-Px genes were identified, of which the AtGSTF12 homologous gene Hma1.2p1_0158F.1_g069560.gene was significantly up-regulated (Figure 7). Therefore, it is believed that this gene may be involved in the vacuolar transport of anthocyanin.
In the subfamily of ABC transporters, the multidrug resistance-associated protein (MRP/ABCC) is involved in the transmembrane transport of glutathione anthocyanins. It can be seen from Figure 7 that seven ABCC transporter genes were differentially expressed during the development of Hydrangea macrophylla, and the expression levels of four genes were up-regulated, as the color of sepals changed to pink or blue. In the aluminum treatment group, ABCC1 (Hma1.2p1_0021F.1_g014400.gene) and ABCC2 (Hma1.2p1_0491F.1 _g164450.gene) were highly expressed in the S2 and S3 periods and were significantly higher than those in the aluminum-free treatment group. Therefore, it is believed that aluminum induces the high expression of ABCC1 and ABCC2 transporter genes in Hydrangea macrophylla, which are involved in the vacuolar transport of anthocyanins and contribute to making its calyx blue.

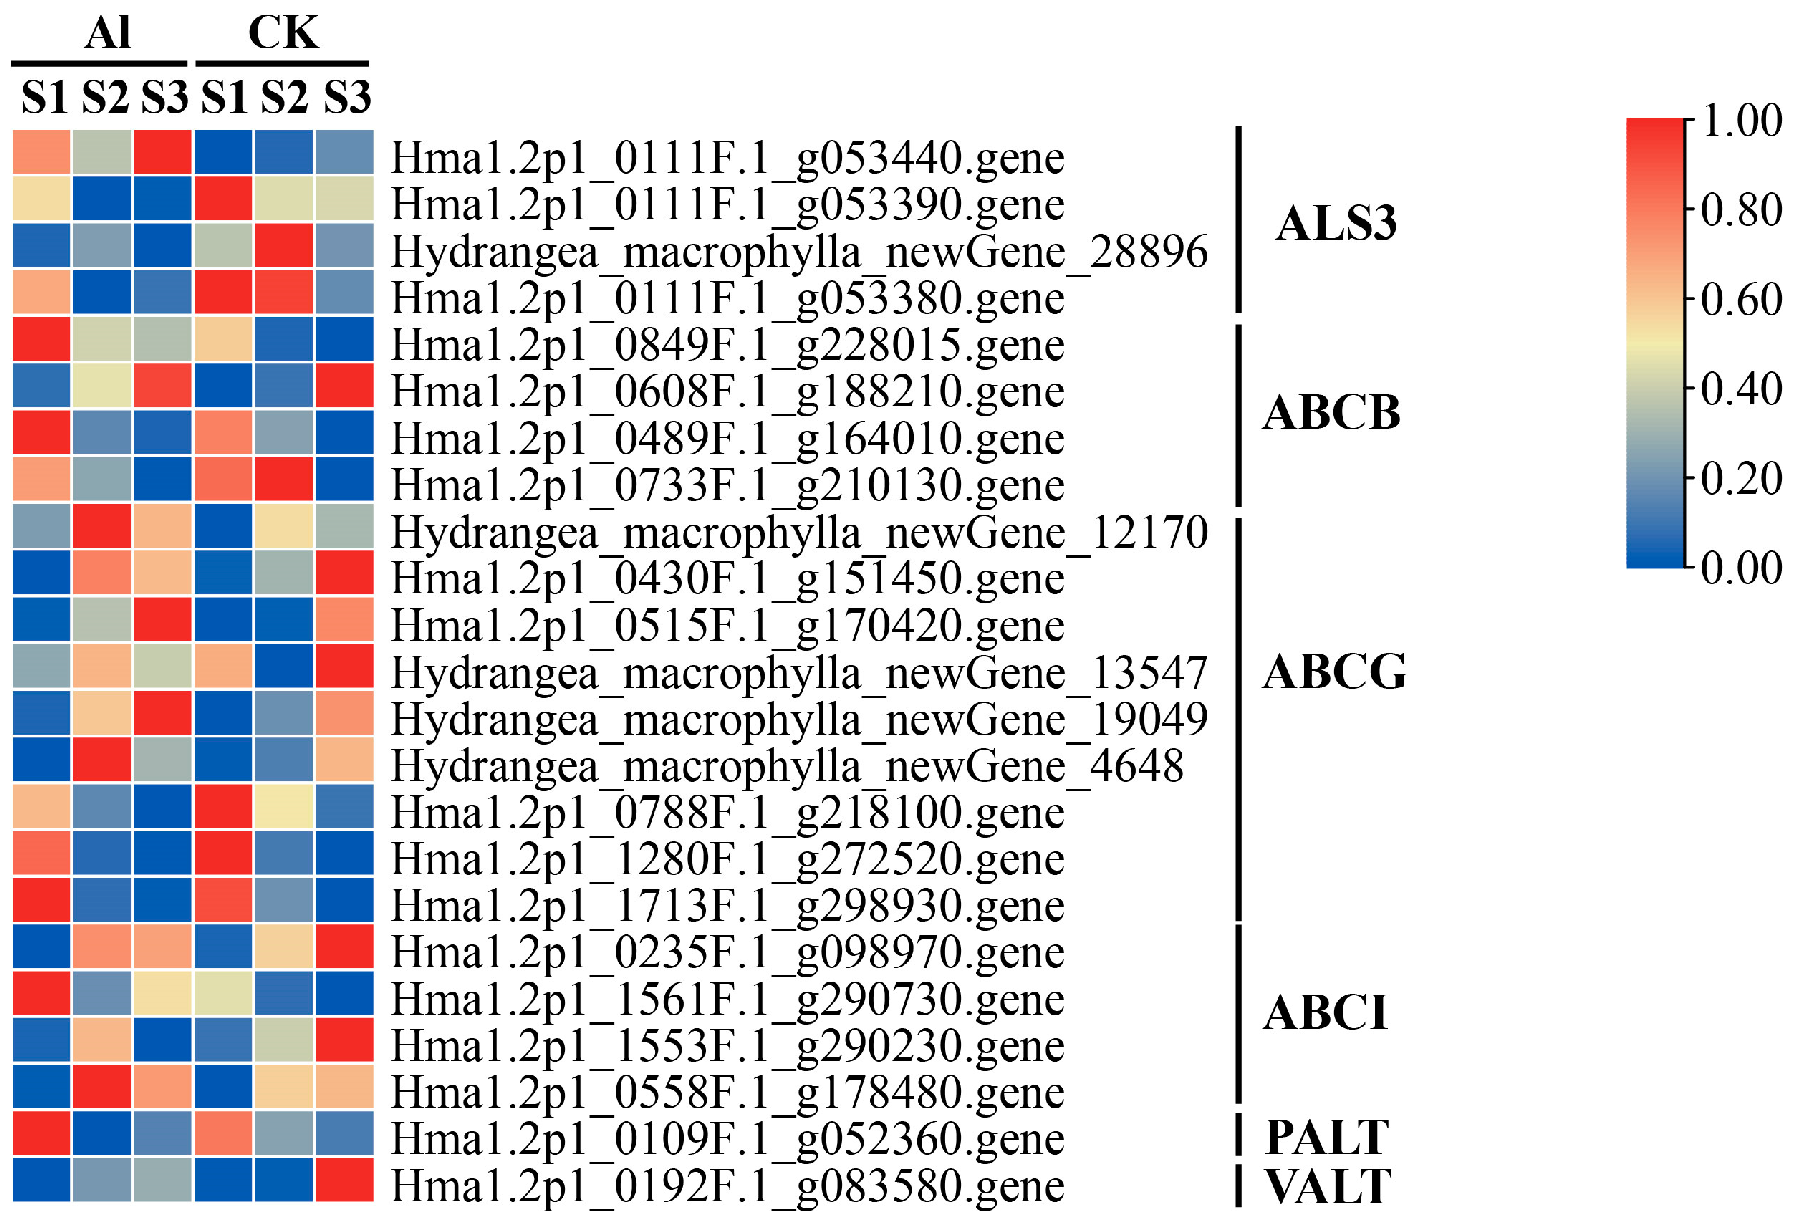
3.8. Expression Analysis of Aluminum Transport-Related Genes

Metal ions are one of the important factors affecting the color change in anthocyanins. The formation of complexes between metal ions and anthocyanins in vacuoles will change the color of anthocyanins, thus affecting the flower color of plants. For example, the combination of aluminum ions and anthocyanins will make the anthocyanins blue [30]. At the same time, anthocyanins can also compartmentalize metal ions and improve the tolerance of plants to metals. The main way is to reduce metal toxicity by catalyzing the binding of GSH to metals by GST [31]. It can be seen from Figure 7 that seven GST (tau) genes and one GSH-Px gene in the aluminum treatment group were significantly up-regulated at the S2 stage compared to the non-aluminum treatment group. Among them, Hma1.2p1_0992F.1_g245190.gene and Hma1.2p1_0961F.1_g241660.gene are homologous to AtGSTU7 and ZmGST23, respectively, both of which are known to respond to environmental stress. Therefore, it is believed that these two genes may be involved in the vacuolar transport of aluminum ions.
A large number of studies have shown that multiple members of the ABCB, ABCG and ABCI subfamilies are involved in many key physiological processes in response to environmental stress [32]. As shown in Figure 8, four ABCB, nine ABCG and four ABCI genes were differentially expressed in the aluminum treatment group. Among them, the ABCB1 (Hma1.2p1_0608F.1_g188210.gene), ABCG2 (Hydrangea_macrophylla_newGene_12170), ABCG36 (Hma1.2p1_0430F.1_g151450.gene) gene expression levels were significantly higher than those in the aluminum-free treatment group. At the same time, four half-molecule ABC transporters, ALS3, were identified, and the expression of ALS3 (Hma1.2p1_0111F.1_g053440.gene) was significantly up-regulated in the aluminum treatment group. The above results indicate that these four ABC transporter genes may also be involved in the vacuolar transport of aluminum ions.

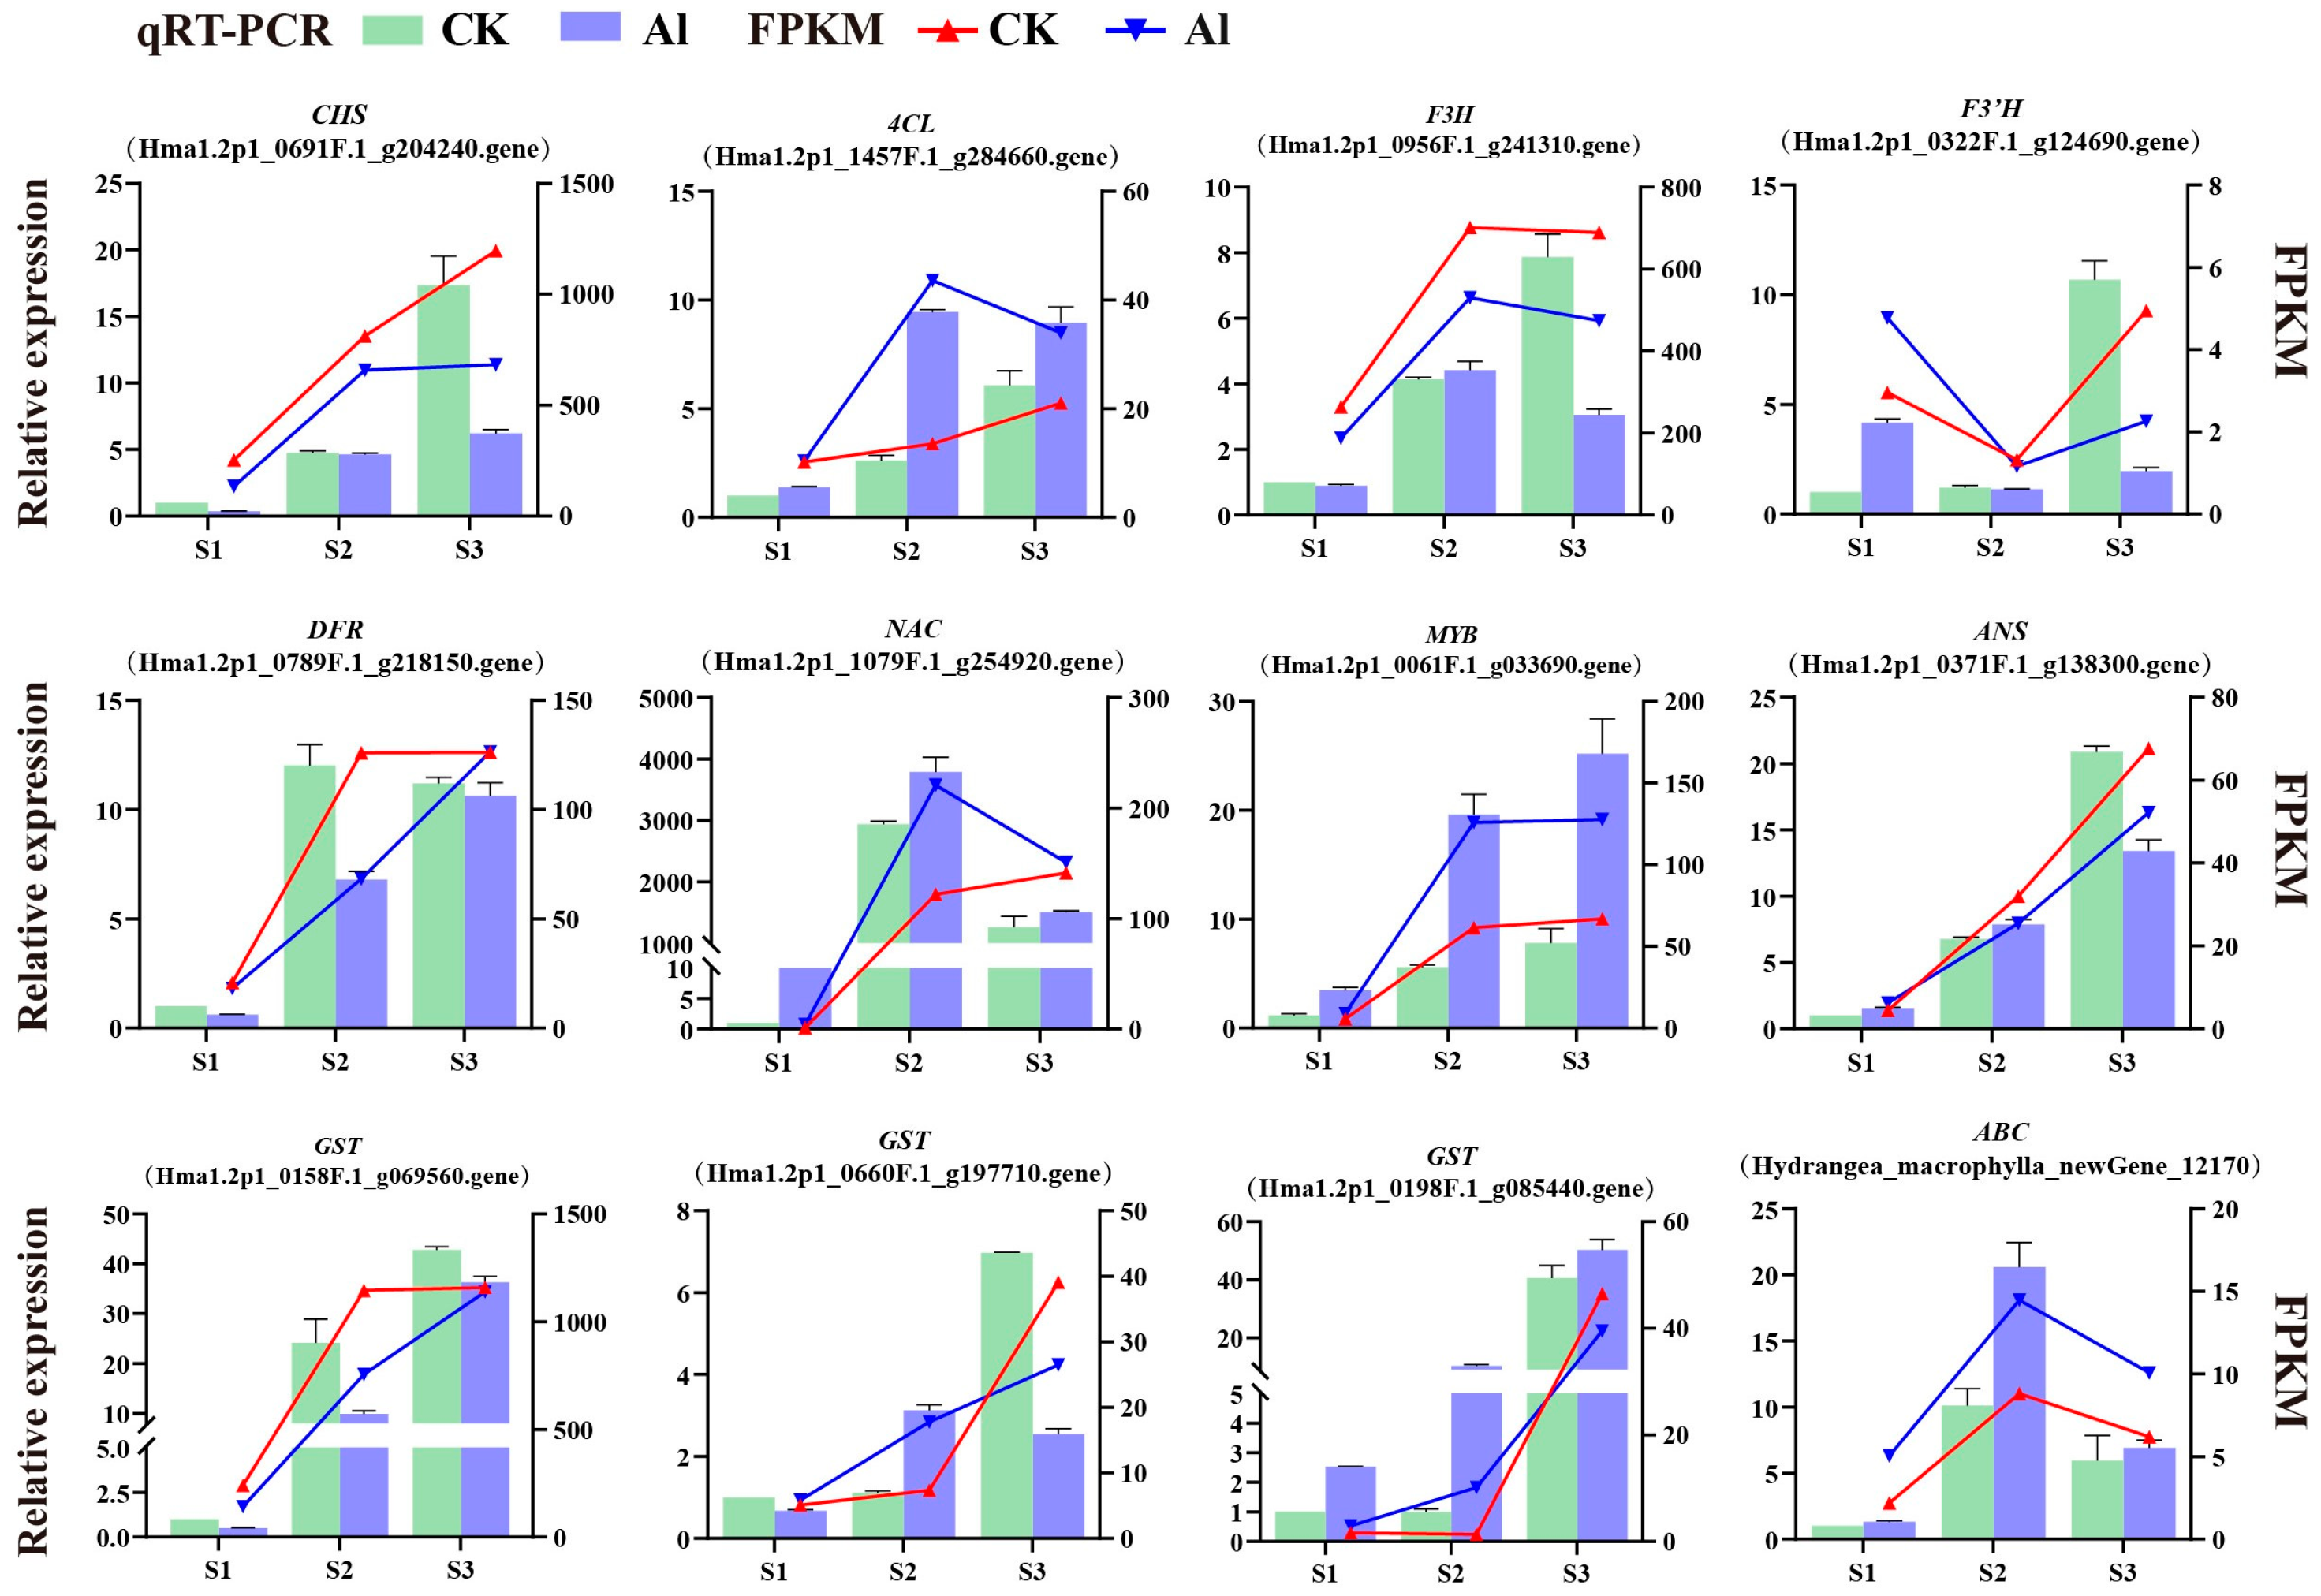
3.9. Real-Time PCR Validation

To verify the accuracy of the transcriptome sequencing results, genes related to anthocyanin biosynthesis and transport were selected for real-time fluorescence quantification. The results showed that the selected 12 differentially expressed genes showed a similar trend to the transcriptome sequencing results, indicating that the transcriptome data of this study were reliable (Figure 9).

4. Discussion

The ‘blue complex’ in the calyx of Hydrangea macrophylla is composed of delphinidin-3-O-glucoside, 5-O-caffeoylquinic acid and Al3+ in a 1:1:1 ratio, in an aqueous solution with a pH value of about 4.0. Studies have shown that after soil application of aluminum sulfate, it not only reduces the pH of the soil, promotes the absorption of Al3+ by the roots of Hydrangea macrophylla and increases the content of Al3+ in the calyx, but also promotes the increase in the content of delphinidin-3-O-glucoside, making the calyx change from red to blue [33]. After applying different concentrations of aluminum solution, the calyx color of Hydrangea macrophylla changed from pink to purple and blue-purple, and the content of Al3+ in the calyx also increased from 2.24 ug/g FW to 5.12 ug/g FW and 11.83 ug/g FW [24]. In this study, with the increase in the aluminum treatment concentration, the color of the calyx of ‘Blue Mama’ changed from pink to purple, blue and blue-purple. The content of delphinidin-3-O-glucoside and Al3+ in the calyces of the aluminum treatment group increased significantly, and the calyces of the 3 g/L aluminum treatment group were blue. However, the roots of the 5 g/L aluminum treatment group accumulated a large amount of aluminum ions, and the content of aluminum ions was significantly higher than in the other parts. Therefore, the appropriate concentration of aluminum treatment was very important for the blue coloration of Hydrangea macrophylla.
Plants mitigate aluminum toxicity through uptake, transport and compartmentalization of Al3+ by transporter proteins. In Arabidopsis, AtALS3 is an aluminum transporter protein that redistributes Al3+ outside of aluminum-sensitive tissues [34]; in buckwheat, FeALS1.1 and FeALS1.2 are involved in the internal detoxification of aluminum in roots and leaves by sequestering Al3+ into vesicles, respectively [35]. Rice OsALS3 encodes a semi molecular ABC transporter protein that is induced by aluminum and is not induced by other metals or a low pH [36]. In this study, the aluminum transporter protein gene ALS3 (Hma1.2p1_0111F.1_g053440.gene) was screened. It not only up-regulated its expression with the deepening of the calyx color, but its expression was also significantly higher in the aluminum-treated group than in the control group, which suggests that ALS3 is involved in aluminum-ion transport and blue calyx formation in Hydrangea macrophylla.
The main coloring substance in plants is anthocyanin, and phenylalanine is the starting material of anthocyanin metabolic pathway, which is catalyzed by PAL, C4H and 4CL [37]. The upstream structural gene CHS is the core enzyme of the anthocyanin synthesis pathway, and its loss of activity will lead to the loss of anthocyanin and other flavonoids, resulting in a white-flower mutant [38]. The competition of F3H, F3H and F35H leads to the production of different anthocyanin metabolic branch pathways. The downstream BZI is the key enzyme in the last step of anthocyanin synthesis, which catalyzes anthocyanin into stable anthocyanin [39]. In this study, with the deepening of calyx color, five PAL, three C4H and six 4CL genes in the upstream structural genes of anthocyanin synthesis were highly expressed in the S1 stage, and the expression level was significantly higher than that in the S2 and S3 stages. The phenomenon of early high expression of upstream genes may provide a prerequisite for anthocyanin synthesis, which is similar to the results of Rahmati et al. [40]. However, the expression level of 4CL (Hma1.2p1_1457F.1_g284660.gene) increased with the deepening of the calyx color, and was significantly higher in the aluminum treatment group than in the control group. The gene expression may be related to aluminum induction. The expression levels of upstream and downstream structural genes CHS, F3H, DFR, ANS and BZI in the anthocyanin synthesis pathway of Hydrangea macrophylla were up-regulated with the deepening of color, and the expression level in the aluminum treatment group was lower than that in the control group. This finding is similar to the results of Chen Haixia et al. [25], indicating that the up-regulated expression of structural genes promoted the synthesis of anthocyanin, but aluminum ions may not be the activators.
The expression of anthocyanin synthesis structural genes is also regulated by transcription factors [38]. At present, MYB, bHLH and WD40 are the main transcription factors regulating anthocyanin synthesis [41,42]. The expression levels of CeMYB52 and CeMYB104 in purple and red sepals were significantly higher than those in yellow and white sepals, and the expression levels were proportional to the anthocyanin content in sepals [43]. Under strong light, in the purple leaves of pepper (Capsicum annuum L.), bHLH90-like is significantly expressed and is highly positively correlated with anthocyanin synthesis genes [44]. The transcription factor HymMYB2 may regulate the formation of the blue calyx by affecting the expression of C35H, DFR and ANS in blue Hydrangea ‘Endless Summer’ [4]. This study found that two MYB (Hma1.2p1_0653F.1_g196210.gene, Hma1.2p1_0457F.1 _g156980.gene) genes and 4CL (Hma1.2p1_1457F.1_g284660.gene) were positively correlated; the MYB (Hma1.2p1_0547F.1_g176620.gene) and bHLH genes (Hma1.2p1_0628F.1_g192080.gene) were negatively correlated with 4CL (Hma1.2p1_1457F.1_g284660.gene). It can be seen that the MYB gene and the bHLH gene may be involved in the expression of 4CL gene as positive and negative regulators, respectively.
NAC transcription factors play an important role in plant growth and development, stress response and the regulation of secondary metabolite biosynthesis. A new NAC gene, SmNAC1, was cloned from Salvia miltiorrhiza [45]. The overexpression of SmNAC1 enhanced the tolerance of transgenic plants to high zinc concentrations. It was also found that PpNAC1 could promote anthocyanin accumulation in blood-fleshed peach by activating the expression of PpMYB10.1 [46]; apple MdNAC52 binds to MdMYB9 and MdMYB11 promoters to promote the accumulation of anthocyanins and proanthocyanidins [47]. The NAC (Hma1.2p1_1079F.1_g254920.gene, Hma1.2p1_1124F.1_g259533.gene) identified in this study was positively correlated with 4CL (Hma1.2p1_1457F.1_g284660.gene) and F3H (Hma1.2p1_0956F.1_g241310.gene) and positively regulated 4CL and F3H with two MYB genes. Therefore, the interaction between them deserves further study.
Plant glutathione transferase (GST) is a multifunctional family involved not only in the transport of anthocyanins [7,8,48] but also in primary and secondary metabolism in plant cells, resistance to heavy metal stress and other activities [49,50,51]. Glutathione transferase (GST), located in the cytoplasm, catalyzes the covalent binding of glutathione (GSH) and anthocyanin to form a glutathione cross-linked complex, which is recognized by MRP on the tonoplast and transported across the membrane to the vacuole [7,16]. GSTs related to anthocyanin transport have been isolated and identified in maize [8], petunia [7], Arabidopsis [52], perilla [53], grape [54], cyclamen [9] and carnation [55], cineraria [56] and Yunnan wild yellow peony [57]. In this study, it was found that the calyx color of the aluminum treatment group gradually became blue during the flower development, and the increase in anthocyanin was significantly higher than that of the control group. However, aluminum treatment did not up-regulate the expression of the middle and lower structural genes of anthocyanin synthesis. Therefore, it is believed that the difference in anthocyanin accumulation may be related to the enhancement of aluminum-induced anthocyanin transport capacity. Differential gene analysis showed that the anthocyanin transporter gene AtGSTF12, a homologous gene of GST (Hma1.2p1_0158F.1_g069560.gene), was up-regulated with the deepening of the calyx color, and the MRP protein genes ABCC1 (Hma1.2p1_0021F.1_g014400.gene) and ABCC2 (Hma1.2p1_0491F.1_g164450.gene) were also up-regulated. It has been identified that Arabidopsis AtABCC1 and AtABCC2 are metal chelate transporters located on the vacuolar membrane, which mediate the tolerance of cells to arsenic, cadmium and mercury [58]. Vitis vinifera VvABCC1 can mediate the vacuolar membrane transport of anthocyanin [18]. ZmMRP3 is necessary for the accumulation of anthocyanin in the aleurone layer of seeds [16]. Therefore, the function of ABCC1 and ABCC2 in Hydrangea macrophylla and the mechanism involved in anthocyanin transport deserve further study.

5. Conclusions

Exogenous aluminum treatment significantly increased the content of delphinidin-3-O-glucoside and Al3+ in the calyx of Hydrangea macrophylla, and 3 g/L aluminum treatment made the calyx blue. A total of 45,436 genes and 53 anthocyanin metabolites were identified by comparative analysis of the transcriptome and anthocyanin metabolome of the three stages of calyx color change. The contents of three main differential metabolites, delphinidin, delphinidin-3-O-glucoside and delphinidin-3-O-galactoside, increased in the 3 g/L aluminum treatment group and were positively correlated with the expression of CHS and F3H genes. However, only the expression of the upstream structural gene 4CL was significantly up-regulated under aluminum treatment, and MYB and NAC may jointly positively regulate the expression of 4CL. Aluminum induced a significantly up-regulated expression of the anthocyanin transporter gene ABCC1 (Hma1.2p1_0021F.1_g014400.gene), ABCC2 (Hma1.2p1_0491F.1_g164450.gene), as well as the aluminum transporter gene ALS3 (Hma1.2p1_0111F.1_g053440.gene). This induction may be an important factor in promoting the transport of anthocyanin and aluminum ions to the vacuole, resulting in the blue color of the calyx. This study preliminarily clarified the effect of aluminum ions on anthocyanin synthesis and metabolism, providing valuable ideas for further elucidating the formation mechanism of blue Hydrangea macrophylla.

Supplementary Materials

The following supporting information can be downloaded at: https://www.mdpi.com/article/10.3390/horticulturae10070745/s1, Figure S1: Sample PCA and correlation heat map; Figure S2: Eight expression patterns of differentially expressed genes in group CK; Figure S3: Eight expression patterns of differentially expressed genes in the aluminum treatment group; Table S1: Metabolome sequencing-related parameter information; Table S2: Primers used for qRT-PCR in this study; Table S3: Changes in calyx floral color values under aluminum treatment; Table S4: All anthocyanins detected in the samples; Table S5: Expression of all differential genes; Table S6: All correlation data in this study.

Author Contributions

Conceptualization, H.C. and H.J.; methodology, W.L.; software, P.L.; validation, W.L., P.L. and H.Z.; formal analysis, T.Z.; investigation, W.L.; resources, H.C.; data curation, H.Z.; writing—original draft preparation, W.L.; writing—review and editing, H.C.; visualization, H.J.; supervision, T.Z.; project administration, H.C.; funding acquisition, H.C. All authors have read and agreed to the published version of the manuscript.

Funding

This research was funded by the Key Project of Hunan Provincial Department of Education, received in 2022 (22A0142), and the Key Research and Development Program of Hunan grant number 2022NK2019.

Data Availability Statement

The RNA-Seq data generated in this study are available at the SRA Archive (http://www.ncbi.nlm.nih.gov/sra, accessed on 18 July 2024), with accession number PRJNA1125644.

Conflicts of Interest

The authors declare no conflicts of interest.

References

  1. Kodama, M.; Tanabe, Y.; Nakayama, M. Analyses of coloration-related components in Hydrangea sepals causing color variability according to soil conditions. Hortic. J. 2016, 85, 372–379. [Google Scholar] [CrossRef]
  2. Zhuang, W.; Liu, T.; Shu, X.; Qu, S.; Zhai, H.; Wang, T.; Zhang, F.; Wang, Z. Molecular regulation of anthocyanin glycoside biosynthesis and colour presentation in plants. Plant Physiol. J. 2018, 54, 1630–1644. [Google Scholar]
  3. Asen, S.; Siegelman, H.W.; Stuart, N.W. Anthocyanin and other phenolic compounds in red and blue sepals of Hydrangea macrophylla var. Merveille. Proc. Amer. Soc. Hort. Sci. 1957, 69, 561–569. [Google Scholar]
  4. Peng, J.; Xue, C.; Dong, X.; Zeng, C.; Wu, Y.; Cao, F. Gene cloning and analysis of the pattern of expression of the transcription factor HymMYB2 related to blue flower formation in Hydrangea macrophylla. Euphytica 2021, 217, 115. [Google Scholar] [CrossRef]
  5. Chen, D.; Li, M.; Peng, J.; Tian, Y.; Chao, S. Association between HmDFR gene expression and flower color of Hydrangea macrophylla. Plant Physiol. J. 2020, 56, 1641–1649. [Google Scholar]
  6. Zhao, J.; Dixon, R.A. The ‘ins’ and ‘outs’ of flavonoid transport. Trends Plant Sci. 2010, 15, 72–80. [Google Scholar] [CrossRef]
  7. Mueller, L.A.; Goodman, C.D.; Silady, R.A.; Walbot, V. AN9, a petunia glutathione S-transferase required for anthocyanin sequestration, is a flavonoid-binding protein. Plant Physiol. 2000, 123, 1561–1570. [Google Scholar] [CrossRef] [PubMed]
  8. Marrs, K.A.; Alfenito, M.R.; Lloyd, A.M.; Walbot, V. A glutathione S-transferase involved in vacuolar transfer encoded by the maize gene Bronze-2. Nature 1995, 375, 397–400. [Google Scholar] [CrossRef] [PubMed]
  9. Kitamura, S.; Akita, Y.; Ishizaka, H.; Narumi, I.; Tanaka, A. Molecular characterization of an anthocyanin-related glutathione S-transferase gene in cyclamen. J. Plant Physiol. 2012, 169, 636–642. [Google Scholar] [CrossRef]
  10. Li, Y.; Liu, X.; Li, F.; Xiang, L.; Chen, K. The Isolation and Identification of Anthocyanin-Related GSTs in Chrysanthemum. Horticulturae 2021, 7, 231. [Google Scholar] [CrossRef]
  11. Cui, Y.; Fan, J.; Lu, C.; Ren, J.; Qi, F.; Huang, H.; Dai, S. ScGST3 and multiple R2R3-MYB transcription factors function in anthocyanin accumulation in Senecio cruentus. Plant Sci. 2021, 313, 111094. [Google Scholar] [CrossRef]
  12. Han, L.; Zou, H.; Zhou, L.; Wang, Y. Transcriptome-based identification and expression analysis of the glutathione S-transferase(GST)family in tree peony reveals a likely role in anthocyanin transport. Hortic. Plant J. 2022, 8, 787–802. [Google Scholar] [CrossRef]
  13. Alfenito, M.R.; Souer, E.; Goodman, C.D.; Buell, R.; Mol, J.; Koes, R.; Walbot, V. Functional complementation of anthocyanin sequestration in the vacuole by widely divergent glutathione S-transferases. Plant Cell 1998, 10, 1135–1149. [Google Scholar] [CrossRef] [PubMed]
  14. Lu, Y.P.; Li, Z.S.; Rea, P.A. AtMRP1 gene of Arabidopsis encodes a glutathione S-conjugate pump: Isolation and functional definition of a plant ATP-binding cassette transporter gene. Proc. Natl. Acad. Sci. USA 1997, 94, 8243–8248. [Google Scholar] [CrossRef] [PubMed]
  15. Lu, Y.P.; Li, Z.S.; Drozdowicz, Y.M.; Hortensteiner, S.; Martinoia, E.; Rea, P.A. AtMRP2, an Arabidopsis ATP binding cassette transporter able to transport glutathione S-conjugates and chlorophyll catabolites: Functional comparisons with Atmrp1. Plant Cell 1998, 10, 267–282. [Google Scholar] [CrossRef]
  16. Goodman, C.D.; Casati, P.; Walbot, V. A multidrug resistance–associated protein involved in anthocyanin transport in Zea mays. Plant Cell 2004, 16, 1812–1826. [Google Scholar] [CrossRef]
  17. Zhu, Q.; Xie, X.; Zhang, J.; Xiang, G.; Li, Y.T.; Wu, H. In Silico Analysis of a MRP Transporter Gene Reveals Its Possible Role in Anthocyanins or Flavonoids Transport in Oryze sativa. Am. J. Plant Sci. 2013, 4, 555–560. [Google Scholar] [CrossRef]
  18. Francisco, R.M.; Regalado, A.; Ageorges, A.; Burla, B.J.; Bassin, B.; Eisenach, C.; Zarrouk, O.; Vialet, S.; Marlin, T.; Chaves, M.M.; et al. ABCC1, an ATP binding cassette protein from grape berry, transports anthocyanidin 3-O-Glucosides. Plant Cell 2013, 25, 1840–1854. [Google Scholar] [CrossRef]
  19. Ito, D.; Shinkai, Y.; Kato, Y.; Kondo, T.; Yoshida, K. Chemical Studies on Different Color Development in Blue- and Red-Colored Sepal Cells of Hydrangea macrophylla. Biosci. Biotechnol. Biochem. 2009, 73, 1054–1059. [Google Scholar] [CrossRef]
  20. Ito, T.; Aoki, D.; Fukushima, K.; Yoshida, K. Direct mapping of hydrangea blue-complex in sepal tissues of Hydrangea macrophylla. Sci. Rep. 2019, 9, 5450. [Google Scholar] [CrossRef]
  21. Ito, T.; Oyama, K.-i.; Yoshida, K. Direct observation of hydrangea blue-complex composed of 3-O-glucosyldelphinidin, Al3+ and 5-O-acylquinic acid by ESI-mass spectrometry. Molecules 2018, 23, 1424. [Google Scholar] [CrossRef]
  22. Yoshida, K.; Oyama, K.-i.; Kondo, T. Insight into chemical mechanisms of sepal color development and variation in hydrangea. Proc. Jpn. Acad. Ser. B 2021, 97, 51–68. [Google Scholar] [CrossRef] [PubMed]
  23. Negishi, T.; Oshima, K.; Hattori, M.; Kanai, M.; Mano, S.; Nishimura, M.; Yoshida, K. Tonoplast- and plasma membrane-localized aquaporin-family transporters in blue hydrangea sepals of aluminum hyperaccumulating plant. PLoS ONE 2012, 7, e43189. [Google Scholar] [CrossRef]
  24. Gong, Z.; He, Y.; Yang, J.; Song, Y.; Ye, Z.; Zhu, Z. Mechanism of exogenous Al2(SO4)3 on regulating the anthocyanin concen-tration in Hydrangea macrophylla petal. J. Plant Nutr. Fertil. 2017, 23, 821–826. [Google Scholar]
  25. Chen, H.; Wang, D.; Zhu, Y.; Li, W.; Chen, J.; Li, Y. Integrative transcriptomics and proteomics elucidate the regulatory mechanism of Hydrangea macrophylla flower-color changes induced by exogenous aluminum. Agronomy 2022, 12, 969. [Google Scholar] [CrossRef]
  26. Chen, S.; Qi, X.; Feng, J.; Chen, H.; Qin, Z.; Wang, H.; Deng, Y. Biochemistry and transcriptome analyses reveal key genes and pathways involved in high-aluminum stress response and tolerance in hydrangea sepals. Plant Physiol. Biochem. 2022, 185, 268–278. [Google Scholar] [CrossRef] [PubMed]
  27. Li, Q.; Xu, J.; Gao, C.; Lu, J.; Du, G.; Sun, X. The taxonomic key of 63 herbaceous peony cultivar. Chin. Agric. Sci. Bull. 2018, 34, 51–59. [Google Scholar]
  28. Hu, Y.; Yuan, J.; Chen, H. Effect of aluminum stress on flower color of Hydrangea cultivar ‘Meihong Mother’. Mol. Plant Breed. 2021, 19, 6164–6171. [Google Scholar]
  29. Mestdagh, P.; Van Vlierberghe, P.; De Weer, A.; Muth, D.; Westermann, F.; Speleman, F.; Vandesompele, J. A novel and universal method for microRNA RT-qPCR data normalization. Genome Biol. 2009, 10, R64. [Google Scholar] [CrossRef]
  30. Oyama, K.; Yamada, T.; Ito, D.; Kondo, T.; Yoshida, K. Metal Complex Pigment Involved in the Blue Sepal Color Development of Hydrangea. J. Agric. Food Chem. 2015, 63, 7630–7635. [Google Scholar] [CrossRef]
  31. Nianiou-Obeidat, I.; Madesis, P.; Kissoudis, C.; Voulgari, G.; Chronopoulou, E.; Tsaftaris, A.; Labrou, N.E. Plant glutathione transferase-mediated stress tolerance: Functions and biotechnological applications. Plant Cell Rep. 2017, 36, 791–805. [Google Scholar] [CrossRef] [PubMed]
  32. Wang, X.; Sun, W.; Ma, Y.; Han, E.; Han, L.; Sun, L.; Peng, Z.; Wang, B. Advances in the study of ABC transporter proteins in Arabidopsis thaliana. Plant Physiol. J. 2017, 53, 133–144. [Google Scholar]
  33. Schreiber, H.D.; Jones, A.H.; Lariviere, C.M.; Mayhew, K.M.; Cain, J.B. Role of aluminum in red-to-blue color changes in Hydrangea macrophylla sepals. Biometals 2011, 24, 1005–1015. [Google Scholar] [CrossRef] [PubMed]
  34. Larsen, P.B.; Geisler, M.J.; Jones, C.A.; Williams, K.M.; Cancel, J.D. ALS3 encodes a phloem-localized ABC transporter-like protein that is required for aluminum tolerance in Arabidopsis. Plant J. 2005, 41, 353–363. [Google Scholar] [CrossRef] [PubMed]
  35. Lei, G.J.; Yokosho, K.; Yamaji, N.; Fujii-Kashino, M.; Ma, J.F. Functional characterization of two half-size ABC transporter genes in aluminium-accumulating buckwheat. New Phytol. 2017, 215, 1080–1089. [Google Scholar] [CrossRef]
  36. Huang, C.F.; Yamaji, N.; Chen, Z.; Ma, J.F. A tonoplast-localized half-size ABC transporter is required for internal detoxification of aluminum in rice. Plant J. 2012, 69, 857–867. [Google Scholar] [CrossRef]
  37. Yang, K.; Shan, X.; Shi, J.; Zhu, C.; Gao, Z. Identification and expression analysis of 4CL gene family in Phyllostachys edulis. J. Nucl. Agric. Sci. 2021, 35, 72–82. [Google Scholar]
  38. Dai, S.; Hong, Y. Molecular breeding for flower colors modification on ornamental plants based on the mechanism of antho-cyanins biosynthesis and coloration. Sci. Agric. Sin. 2016, 49, 529–542. [Google Scholar]
  39. Du, L.; Chen, K.; Liu, Y. Cloning and expression analysis of anthocyanidin-3-O-glucosytransferase gene in Grape hyacinth. Pratacultural Sci. 2017, 34, 10. [Google Scholar]
  40. Rahmati, R.; Hamid, R.; Ghorbanzadeh, Z.; Jacob, F.; Azadi, P.; Zeinalabedini, M.; Karimi Farsad, L.; Kazemi, M.; Ebrahimi, M.A.; Shahinnia, F. Comparative Transcriptome Analysis Unveils the Molecular Mechanism Underlying Sepal Colour Changes under Acidic pH Substratum in Hydrangea macrophylla. Int. J. Mol. Sci. 2022, 23, 15428. [Google Scholar] [CrossRef]
  41. Tanaka, Y.; Ohmiya, A. Seeing is believing: Engineering anthocyanin and carotenoid biosynthetic pathways. Curr. Opin. Biotechnol. 2008, 19, 190–197. [Google Scholar] [CrossRef]
  42. Ramsay, N.A.; Glover, B.J. MYB–bHLH–WD40 protein complex and the evolution of cellular diversity. Trends Plant Sci. 2005, 10, 63–70. [Google Scholar] [CrossRef] [PubMed]
  43. Shen, Y.; Mao, L.; Zhou, Y.; Sun, Y.; Liu, Z.; Liang, C. Integrated transcriptome and metabolome analysis revealed the molecular mechanism of anthocyanin synthesis in purple leaf pepper (Capsicum annuum L.) under different light intensities. Horticulturae 2023, 9, 814. [Google Scholar] [CrossRef]
  44. Ke, Y.J.; Zheng, Q.D.; Yao, Y.H.; Ou, Y.; Chen, J.Y.; Wang, M.J.; Lai, H.P.; Yan, L.; Liu, Z.J.; Ai, Y. Genome-wide identification of the MYB gene family in cymbidium ensifolium and its expression analysis in different flower colors. Int. J. Mol. Sci. 2021, 22, 13245. [Google Scholar] [CrossRef] [PubMed]
  45. Zhu, B.; Huo, D.-A.; Hong, X.-X.; Guo, J.; Peng, T.; Liu, J.; Huang, X.-L.; Yan, H.-Q.; Weng, Q.-B.; Zhang, X.-C. The Salvia miltiorrhiza NAC transcription factor SmNAC1 enhances zinc content in transgenic Arabidopsis. Gene 2019, 688, 54–61. [Google Scholar] [CrossRef]
  46. Zhou, H.; Lin-Wang, K.; Wang, H.; Gu, C.; Dare, A.P.; Espley, R.V.; He, H.; Allan, A.C.; Han, Y. Molecular genetics of blood-fleshed peach reveals activation of anthocyanin biosynthesis by NAC transcription factors. Plant J. 2015, 82, 105–121. [Google Scholar] [CrossRef]
  47. Sun, Q.; Jiang, S.; Zhang, T.; Xu, H.; Fang, H.; Zhang, J.; Su, M.; Wang, Y.; Zhang, Z.; Wang, N.; et al. Apple NAC transcription factor MdNAC52 regulates biosynthesis of anthocyanin and proanthocyanidin through MdMYB9 and MdMYB11. Plant Sci. 2019, 289, 110286. [Google Scholar] [CrossRef]
  48. Kitamura, S.; Shikazono, N.; Tanaka, A. TRANSPARENT TESTA 19 is involved in the accumulation of both anthocyanins and proanthocyanidins in Arabidopsis. Plant J. 2004, 37, 104–114. [Google Scholar] [CrossRef]
  49. Zhang, X.; Tao, L.; Qiao, S.; Du, B.; Guo, C. The role of glutathione transferase in plant resistance to abiotic stresses. China Biotechnol. 2017, 37, 92–98. [Google Scholar]
  50. Zhang, Y.; Zhang, F.; Wang, L.; Wei, K.; Cheng, H. Plant glutathione s-transferases: Roles in flavonoid accumulation. Plant Physiol. J. 2015, 51, 1815–1820. [Google Scholar]
  51. Estévez, I.H.; Hernández, M.R. Plant glutathione S-transferases: An overview. Plant Gene 2020, 23, 100233. [Google Scholar] [CrossRef]
  52. Sun, Y.; Li, H.; Huang, J.-R. Arabidopsis TT19 functions as a carrier to transport anthocyanin from the cytosol to tonoplasts. Mol. Plant 2012, 5, 387–400. [Google Scholar] [CrossRef] [PubMed]
  53. Yamazaki, M.; Shibata, M.; Nishiyama, Y.; Springob, K.; Kitayama, M.; Shimada, N.; Aoki, T.; Ayabe, S.i.; Saito, K. Differential gene expression profiles of red and green forms of Perilla frutescens leading to comprehensive identification of anthocyanin biosynthetic genes. FEBS J. 2008, 275, 3494–3502. [Google Scholar] [CrossRef] [PubMed]
  54. Conn, S.; Curtin, C.; Bézier, A.; Franco, C.; Zhang, W. Purification, molecular cloning, and characterization of glutathione S-transferases (GSTs) from pigmented Vitis vinifera L. cell suspension cultures as putative anthocyanin transport proteins. J. Exp. Bot. 2008, 59, 3621–3634. [Google Scholar] [CrossRef] [PubMed]
  55. Sasaki, N.; Nishizaki, Y.; Uchida, Y.; Wakamatsu, E.; Umemoto, N.; Momose, M.; Okamura, M.; Yoshida, H.; Yamaguchi, M.; Nakayama, M. Identification of the glutathione S-transferase gene responsible for flower color intensity in carnations. Plant Biotechnol. 2012, 29, 223–227. [Google Scholar] [CrossRef]
  56. Jin, X.; Hong, Y.; Huang, H.; Dai, S.; Zhu, Y. Isolation and expression analysis of GST gene encoding glutathione s-transferase from Senecio Cruentus. Acta Hortic. Sin. 2013, 40, 1129–1138. [Google Scholar]
  57. Shi, Q.; Zhou, L.; Li, Q.; Wang, Y. Isolation and expression analysis of GST gene encoding glutathione S-transferase of Paeonia delavayi var. lutea Wild Population in Yunnan. Sci. Silvae Sin. 2014, 50, 63–72. [Google Scholar]
  58. Park, J.; Song, W.Y.; Ko, D.; Eom, Y.; Hansen, T.H.; Schiller, M.; Lee, T.G.; Martinoia, E.; Lee, Y. The phytochelatin transporters AtABCC1 and AtABCC2 mediate tolerance to cadmium and mercury. Plant J. 2012, 69, 278–288. [Google Scholar] [CrossRef]
Figure 1. Changes in flower color and aluminum-ion content of ‘Blue Mama’. (A) Changes in flower color during the development of ‘Blue Mama’ under different concentrations of aluminum treatment. (B) Changes in the content of delphinidin-3-O-glucoside in sepals under different concentrations of aluminum treatment. (C) Aluminum-ion content in root, stem, leaf and sepals of plants at S3 stage. **, p < 0.01; ***, p < 0.001.
Horticulturae 10 00745 g001
Figure 2. Statistical analysis of anthocyanin metabolites. (A) The type and quantity of metabolites identified. (B) The number of differential metabolites in different comparison groups. (C) Comparative analysis of the top 10 anthocyanin metabolites in terms of content in the S2 stage.
Horticulturae 10 00745 g002
Figure 3. Sequencing results statistics. (A) Statistical analysis of differential genes between groups. (B) The differential gene Venn diagram within and between groups.
Horticulturae 10 00745 g003
Figure 4. The expression profiles of significantly enriched differential genes and their KEGG pathway enrichment analysis. The above profiles significantly represent enriched expression patterns of differential genes, with the broken lines indicating the trend in gene expression across the three stages of flower development (p < 0.05). Below each cluster, the top 10 most significantly enriched KEGG pathways are represented by a histogram based on the adjusted p-value, and the number of genes in each pathway is represented by a line chart. (A,B) are the CK group and the Al treatment group, respectively.
Horticulturae 10 00745 g004
Figure 5. Comparative analysis of gene expression and metabolites in anthocyanin biosynthesis pathway at different stages of flower development. (A) Comparative analysis of structural gene expression and metabolite content. (B) Correlation analysis between structural genes and metabolites. Only Pearson correlation coefficient |PCC| ≥ 0.90, p < 0.05. Red dashed line, positive correlation between gene and metabolite; blue dashed line, negative correlation between gene and metabolite.
Horticulturae 10 00745 g005
Figure 6. Transcription factor analysis. (A) The number of top 15 transcription factor families identified. (B) Heatmap of NAC transcription factor. (C) Heatmap of bHLH transcription factor. (D) Heatmap of MYB transcription factor. (E) Co-expression map of NAC and anthocyanin synthesis structural genes. (F) Co-expression map of bHLH and anthocyanin synthesis structural genes. (G) Co-expression map of MYB and anthocyanin synthesis structural genes. Only Pearson correlation coefficient |PCC| ≥ 0.90, p < 0.05. Red dashed line, positive correlation between genes; blue dashed line, negative correlation between genes.
Horticulturae 10 00745 g006
Figure 7. Expression analysis of anthocyanin transporter gene.
Horticulturae 10 00745 g007
Figure 8. Expression analysis of aluminum transport-related genes.
Horticulturae 10 00745 g008
Figure 9. Validation and expression analysis of selected genes using qRT-PCR.
Horticulturae 10 00745 g009
Disclaimer/Publisher’s Note: The statements, opinions and data contained in all publications are solely those of the individual author(s) and contributor(s) and not of MDPI and/or the editor(s). MDPI and/or the editor(s) disclaim responsibility for any injury to people or property resulting from any ideas, methods, instructions or products referred to in the content.

