Article

Exploration of Thiamin thiazole synthase (THI4) Expression and Transcriptomes Involved in the Floral Volatiles of Caladium bicolor

1
Environmental Horticulture Department, Plant Innovation Center, Institute of Food and Agricultural Sciences, University of Florida, Gainesville, FL 32611, USA
2
Horticultural Sciences Department, Institute of Food and Agricultural Sciences, University of Florida, Gainesville, FL 32611, USA
*
Author to whom correspondence should be addressed.
Horticulturae 2024, 10(8), 810; https://doi.org/10.3390/horticulturae10080810
Submission received: 4 June 2024 / Revised: 1 July 2024 / Accepted: 29 July 2024 / Published: 31 July 2024
(This article belongs to the Section Genetics, Genomics, Breeding, and Biotechnology (G2B2))

Abstract

:
4-methyl-5-vinylthiazole (MVT) is a significant volatile of caladium (Caladium bicolor) which produces a very high level of thiamin thiazole synthase (THI4) in male flowers. We explored transcriptomes upregulating MVT using RNA-seq during the six developmental stages of the male flower (Day−10 to Day0) in C. bicolor ‘Tapestry’. THI4 was the highest transcript throughout the male flower development. Additionally, the genes showing the high expression associated with floral volatiles of caladium on Day0 were trans-resveratrol di-O-methyltransferase (ROMT), chalcone synthase (CHS), 3-ketoacyl-CoA thiolase 2 (KAT2), and linalool synthase (TPS). These four genes correspond to the following elevated volatiles of caladium: 1,3,5-trimethoxybenzene, MVT, indole, methyl salicylate, and linalool on Day0 compared to Day−10. The upstream THI4 gene was cloned to drive a fluorescent gene (ZsGreen1) in transient and stable transgenic petunia and tobacco plants, showing the gene expression only in the male tissue. The tissue-specific expression of the caladium THI4 promoter could benefit crop production with minimal modification of plants. Investigating transcriptomes associated with caladium fragrance can help provide insight into understanding the regulatory mechanisms of floral volatiles of caladium.

1. Introduction

In plants, thiamin thiazole synthase (THI4) is involved in the synthesis of adenylated thiazole derivative (ADT) and thiamin (vitamin B1), which are essential for all living organisms. THI4 synthesizes the adenylated thiazole moiety of thiamin via nicotinamide adenine dinucleotide (NAD+) and glycine. THI4 utilizes sulfur transferred from a cysteine residue to make 2-(2-carboxy-4-methylthiazol-5-yl) ethyl phosphate (cThz-P), a thiazole precursor of thiamin [1,2]. When the sulfur was removed from the cysteine residue, THI4 became deactivated, acting as a suicide enzyme that undergoes a single turnover before degradation and resynthesis [3]. Yazdani et al. [4] demonstrated that the Arabidopsis THI4 mutant did not grow on MS medium and was rescued with supplemental thiamin or 4-methyl-5(2-phosphonooxyethyl)thiazole (Thz-P). However, THI4 degradation is not a unique process to provide sulfur for thiazole synthesis in certain crops. Sun et al. [5] indicated that hydrosulfide (HS) can be the sulfide donor to make cThz-P in plants. Further functional complementation tests revealed that caladium THI4 may retain non-suicidal catalytic activity in hypoxic conditions. It is also shown that certain archaea can utilize environmental sulfide as the sulfur donor [6]. Joshi et al. [6] indicated that some cereal THI4s had no active site for a cysteine residue and therefore could not obtain sulfur from the cysteine residue. In these cereals, aspartic acid (Asp) and glutamic acid (Glu) residues are instead appropriately positioned to mediate the sulfur transfer.
Caladium (Caladium bicolor) belongs to the Araceae family and is an aroid native to the Neotropics with a unique floral fragrance profile. The fragrance and inflorescence structure were specialized with adaptations for cyclocephaline scarab beetle pollination syndrome. The inflorescences, which emit an intense odor during thermogenesis, and white spathe blades are likely to attract the beetles olfactorily and visually. The morphologically altered spathe tube provides a well-developed floral chamber where beetles can breed. This phenomenon is also observed in species of Philodendron, Dieffenbachia, Montrichardia, and Xanthosoma [7,8,9,10,11]. The fragrance profile of caladium has been well characterized and consists of several benzenoids, phenylpropanoids, terpenoids, and nitrogen- and/or sulfur-containing compounds [12]. Interestingly, amongst these floral volatile compounds, 4-methyl-5-vinylthiazole (MVT) emission was very high [5,12]. MVT is structurally homologous to ADT and its metabolite, cThz-P. Our previous study found that MVT and endogenous THI4 expressions were high in male tissues of caladium and that THI4 had an active site cysteine residue [5].
Although the study showed the high emission of MVT, potentially via THI4, in caladium, it did not explain how THI4 was regulated in MVT production. Transcript expression can be tissue-specific, especially when the transcripts are involved in signal transduction and organ function or development [13,14,15,16]. This prompts us to investigate transcriptomes to understand how caladium inflorescences upregulate MVT and THI4 expression during male flower development. There have been remarkable advancements in RNA-seq techniques, but very little caladium genomic and transcriptomic data is publicly available. Cao and Deng [17] conducted the first de novo transcript characterization from the root of three caladium cultivars. They characterized fifty unigenes translated into receptor-like protein kinases (RLKs) associated with signal perception and disease resistance pathways in the Pythium-resistant caladium root. Therefore, C. bicolor ‘Tapestry’ male tissues were collected at various developmental stages and RNA-seq was used to characterize the floral transcriptomes. In this study, we focused on floral differentially expressed genes (DEGs) to identify putative candidate genes that play a role in THI4 regulation and floral volatile production. In addition, the caladium THI4 promoter (pCbTHI4) was cloned to drive a fluorescence gene, ZsGreen1, and the regulation of THI4 was investigated in tobacco and petunia plants through transient and stable transformation. Interestingly, ZsGreen1 was expressed only in male tissues of petunia flowers. This study could provide insights into the regulation of THI4 in caladium and male tissue-specific characteristics of the THI4 promoter.

2. Materials and Methods

2.1. Plant Materials

C. bicolor ‘Tapestry’ tubers were soaked for 16 h in 600 mg/L gibberellic acid solution (4% Pro-Gibb, Valent Biosciences Co., Libertyville, IL, USA) which promotes fast growth. The tubes were grown in 1-gallon pots (3.78 L) containing Sunshine Mix #4 substrate (Sun Gro Horticulture, Agawam, MA, USA) supplemented with 10 g of Osmocote 14-14-14 fertilizer (ICL Specialty Fertilizers, Dublin, OH, USA). Petunia x hybrida cv ‘Mitchell Diploid’ (MD) were grown in PRO-MIX BX potting medium (Premier Tech Horticulture, Quakertown, PA, USA) and fertilized with Scott’s Excel 15-5-15 (Scotts, Marysville, OH, USA). The plants were grown in air-conditioned glass greenhouses (24 ± 2 °C) with a 16 h photoperiod per day. The growth stages of caladium were determined as previously described [5], including Day−10, Day−7, Day−5, Day−3, Day−1, and Day0 alongside female flower development. The negative numbers indicated how many days before female anthesis (spathe opening).

2.2. Sample Preparation and Data Analyses for RNA-seq

Male flower tissues from caladium were collected during the six growth stages, frozen in liquid nitrogen, and stored at −80 °C. Tissue was ground to a fine powder using a mortar cooled with liquid nitrogen with three biological replicates. RNAs were extracted using a CTAB (cetyltrimethylammonium bromide) method [18] followed by on-column DNase treatment using the RNase-Free DNase I Kit (Norgen Biotech, Thorold, ON, Canada). Total RNA was quantified using a NanoDrop 2000c spectrophotometer (Thermo Fisher Scientific, Waltham, MA, USA). Subsequently, cDNA libraries were generated from each RNA sample using a SMARTer™ RACE cDNA Amplification Kit (Clontech Laboratories, Inc., Mountain View, CA, USA) following the manufacturer’s instructions.
The samples from the six time points with three replicates were sequenced on the Illumina MiSeq System, using paired-end reads, 300 bp, and 50 million reads (ICBR, Univ. of FL, Gainesville, FL, USA). The raw data was cleaned using Trimmomatic [19] to trim low-quality bases and remove residual adaptor sequences. De novo assembly was performed using Trinity, followed by CD-HIT-EST [20] to generate expressed sequence tags (ESTs). The ESTs were then used to BLAST on NCBI (National Center for Biotechnology Information), yielding 40,205 hits (32%) in Araport11 and 39,248 hits (31.2%) in SwissProt_viridiplatae. A total of 109,722 ESTs were aligned with the top 50 most abundant transcripts found on Day0. A Nextera XT DNA library prep kit (New England Biolabs, Ipswich, MA, USA) was used for differentially expressed gene analysis with samples from the six developmental stages, with three replicates. The library was then sequenced with Illumina HiSeq, using paired-end reads, 100 bp, and 50 million reads per sample. The raw data was cleaned using Trimmomatic [19]. The de novo transcriptome assembly was used as a reference for alignment using Bowtie2, Version 2.4.3 in RSEM (RNA-seq by Expectation Maximization), counting the reads in FPKM (Fragments Per Kilobase Million) and TPM (Transcripts Per Million). Differential expression analysis using the R package (https://www.r-project.org/, accessed on 6 June 2019) “EBSeq” identified 9376 DEGs out of 93,681 normalized transcripts. The predicted protein sequences from the TRAPID [21] analysis were conducted with KAAS (KEGG Automatic Annotation Server), KEGG GhostKOALA, KEGG BlastKOALA (KEGG Orthology And Links Annotation) [22], and PlantTFDB (Plant Transcription Factor Database) [23]. Short Time-Series Expression Miner (STEM) was used to ensure no additional normalization/gene annotation and cross-reference/gene location source.

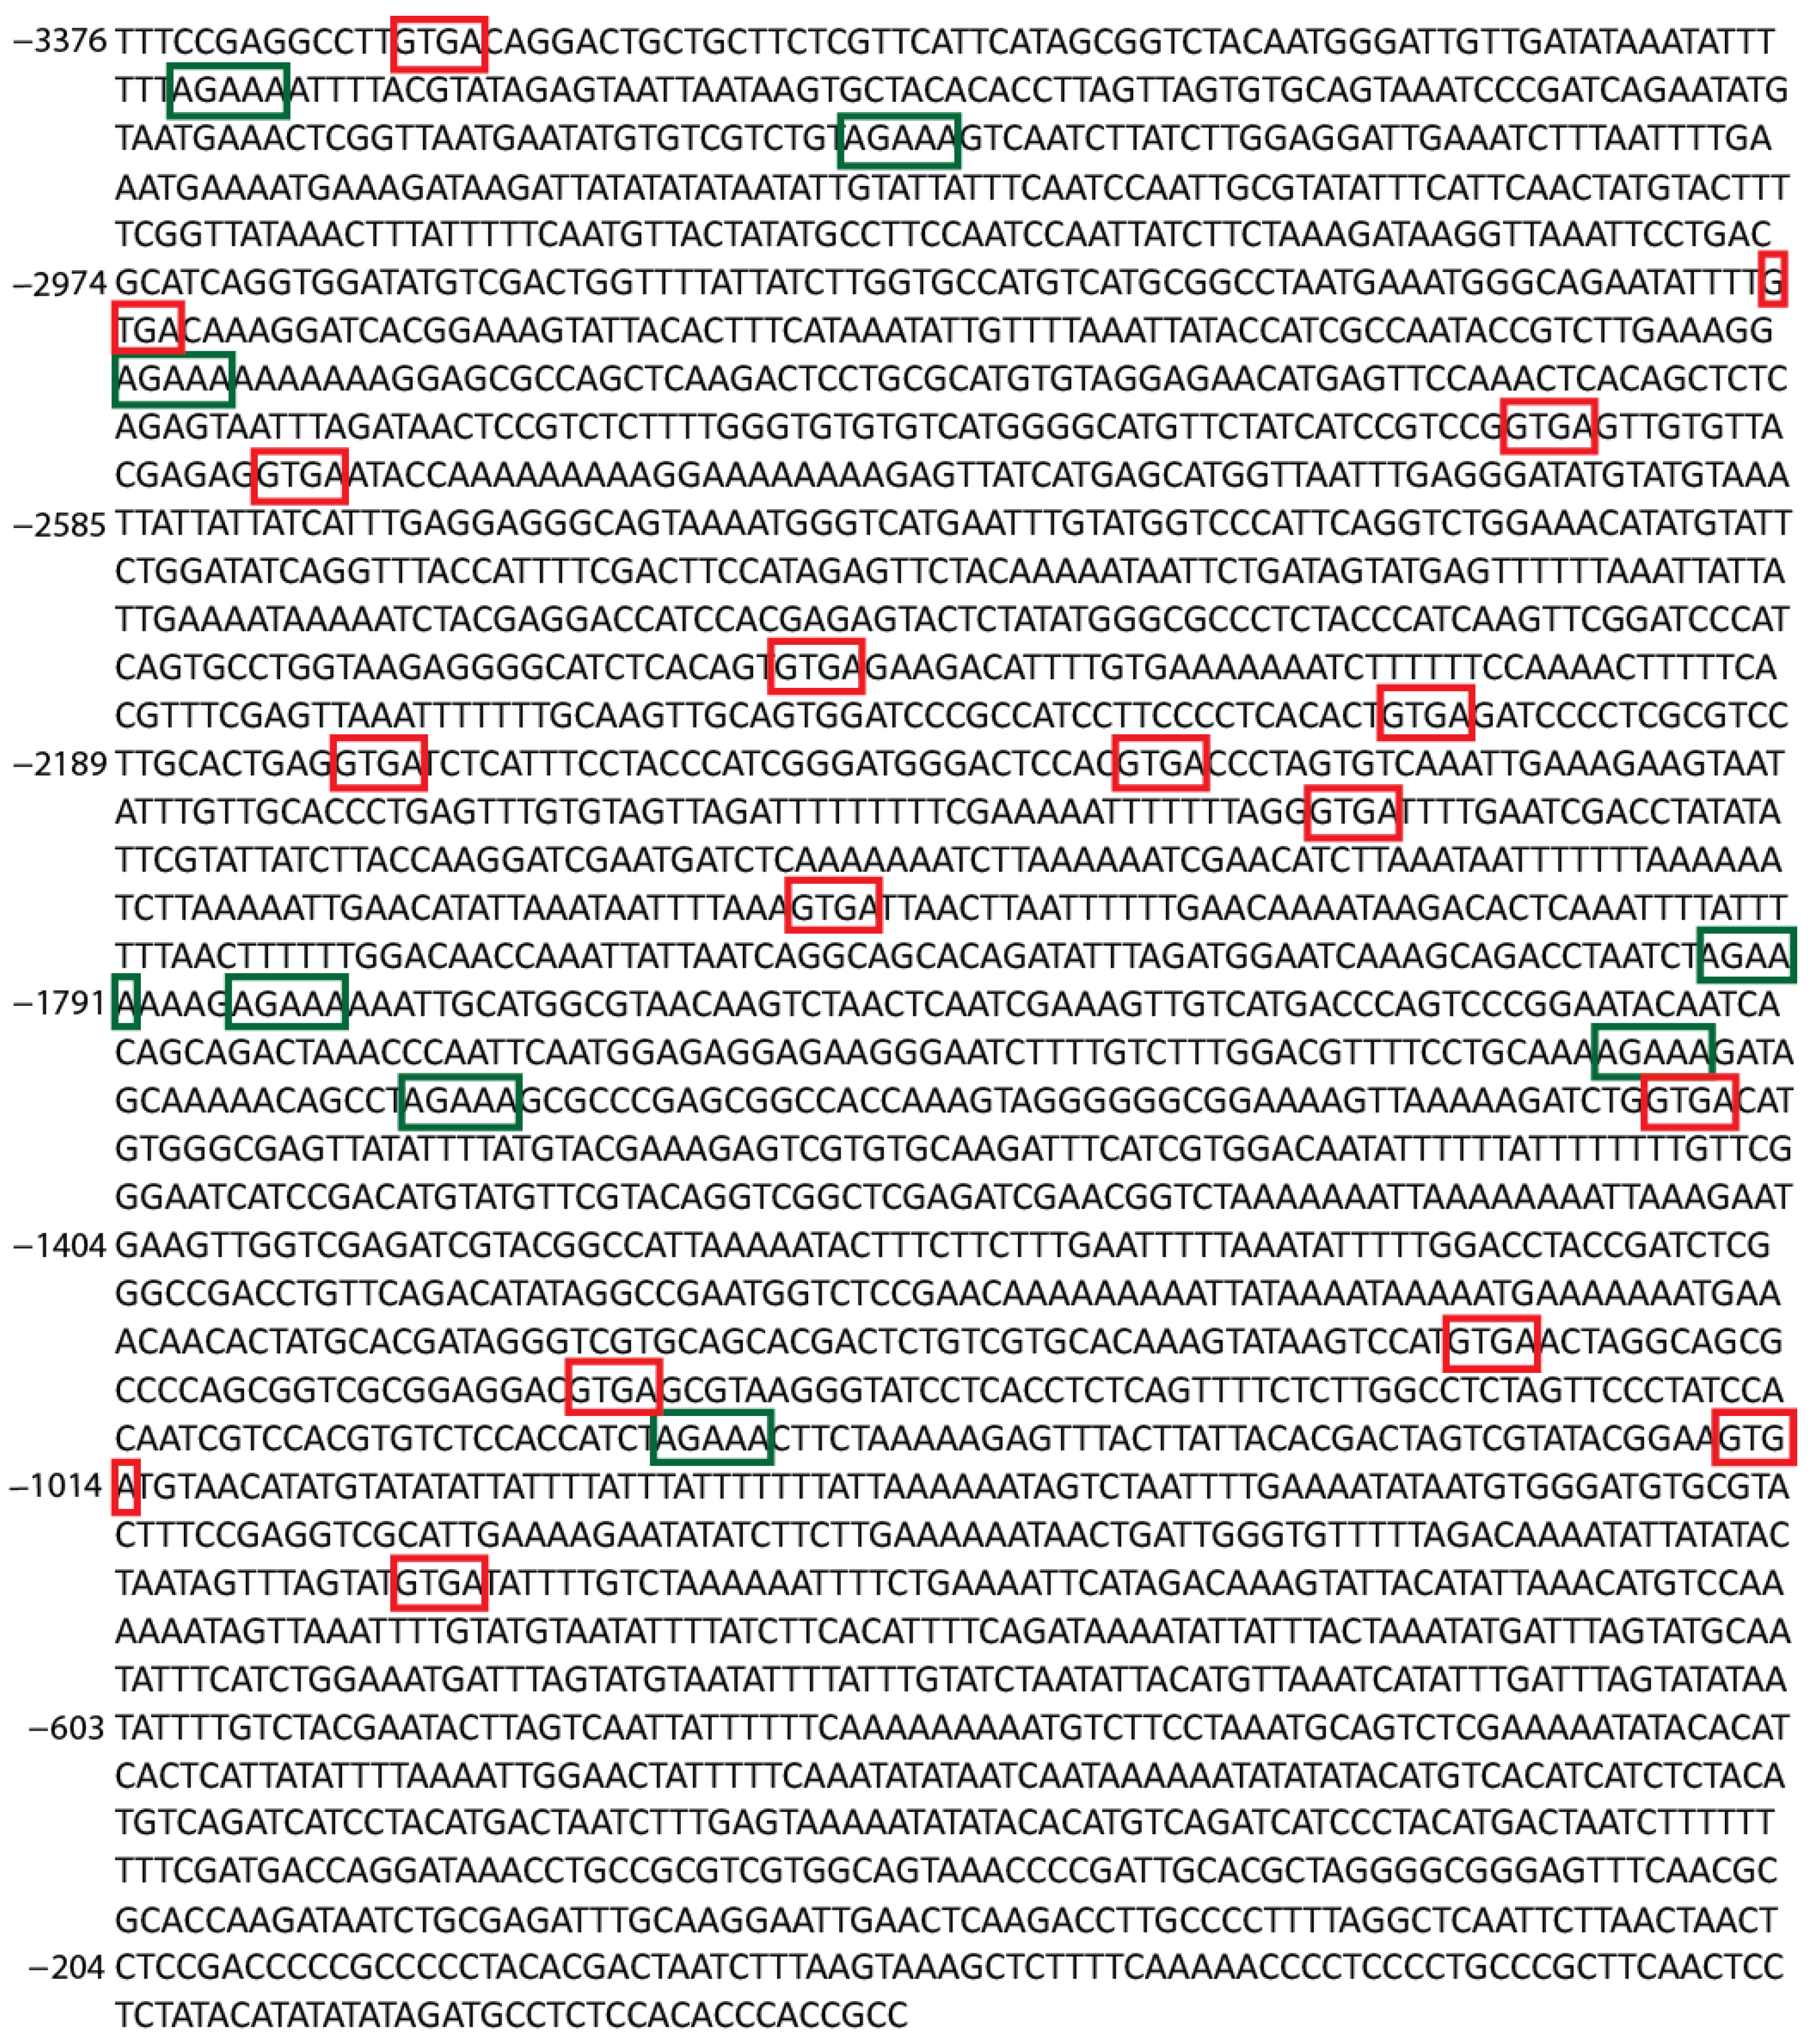
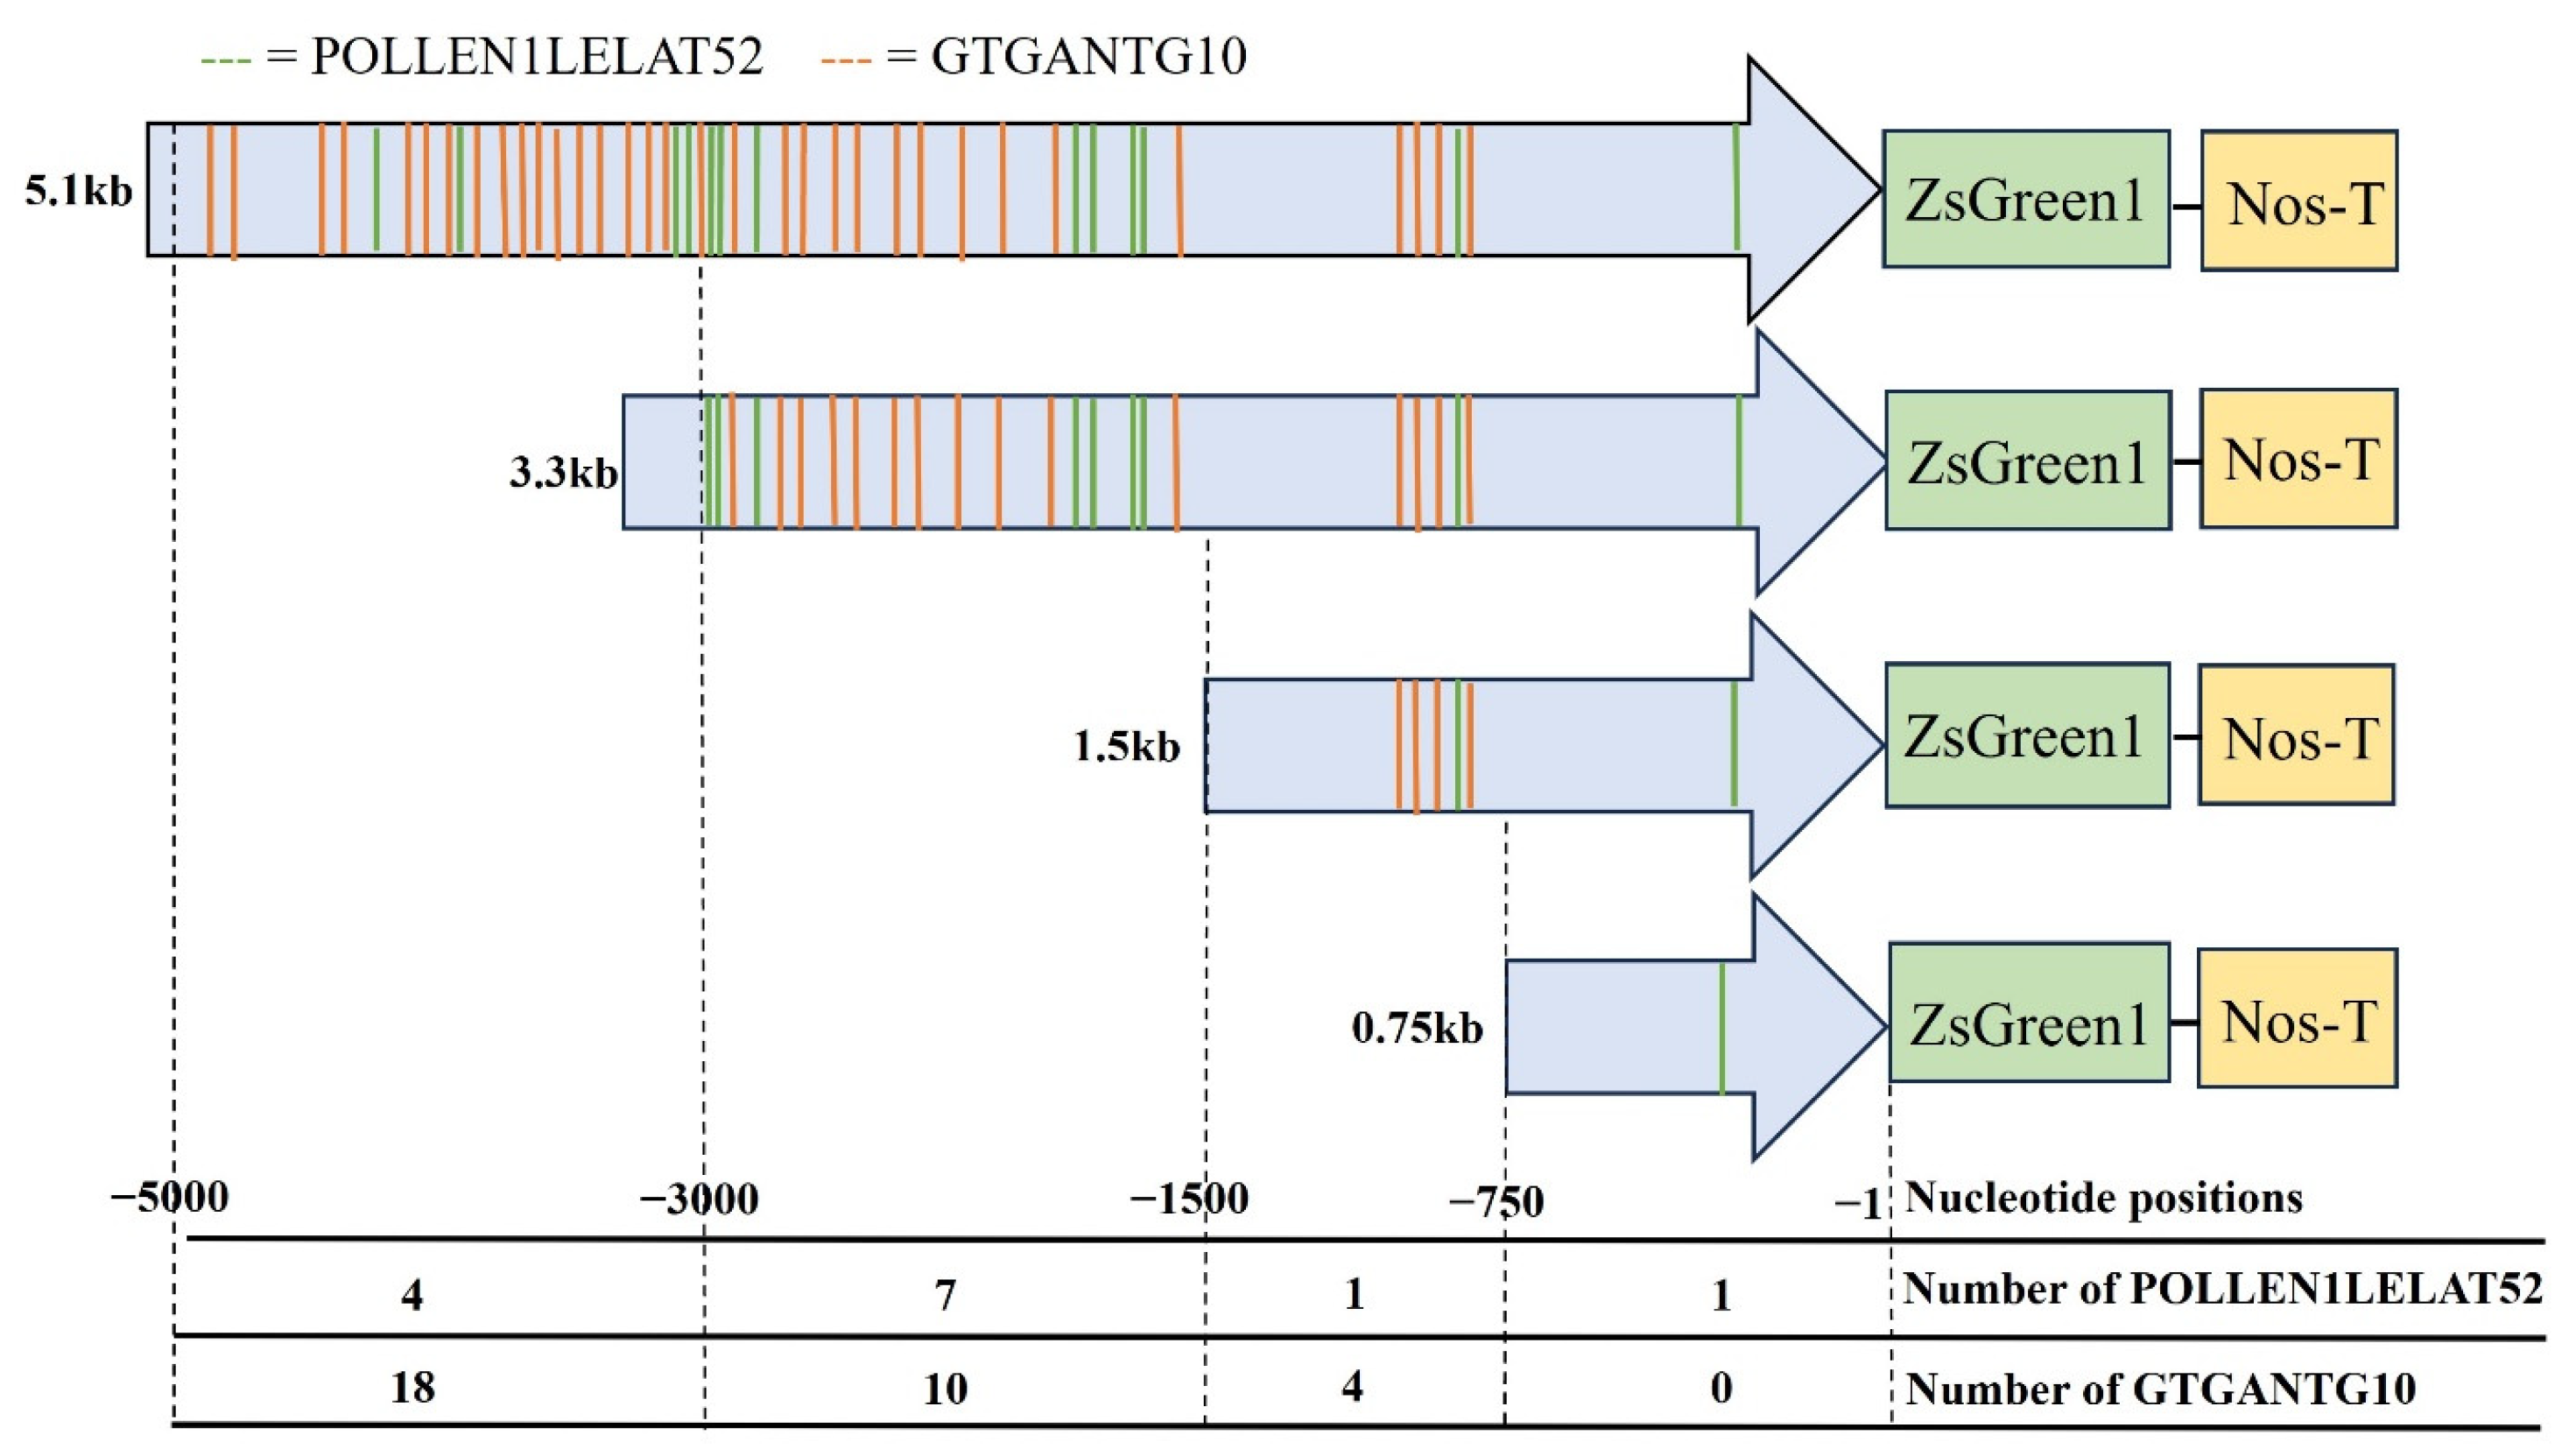
2.3. Cloning and Transient Expression of Caladium THI4 Promoter

Genomic DNAs were extracted from Tapestry leaves using a CTAB method [18], and Caladium THI4 promoter (pCbTHI4) including the 5′ UTR of THI4 gene (MH796125/MH796126) was cloned using Universal GenomeWalkerTM 2.0 (Takara Bio., San Jose, CA, USA) according to the manufacturer’s instruction (primers in Table S1). The amplicons were respectively inserted into the pGEM®-T easy vector (Promega, Madison, WI, USA). Various sizes of the CbTHI4 promoter (3282 bp, 1547 bp, 764 bp, or 474 bp) were amplified from pGEM®-T easy vector (primers in Table S1) and inserted into a PHK vector containing ZsGreen1 [24]. To compare gene expression, ZsGreen1 driven by a figwort mosaic virus promoter (pFMV) or isoeugenol synthase promoter (pIGS) was also constructed into a pHK vector. Each vector was then transformed into Agrobacterium tumefaciens, BI (ABI).
For the transient expression of ZsGreen1 driven by a variety of lengths of pCbTHI4, Agrobacterium suspension harboring each pCbTHI4-ZsGreen1-PHK vector was diluted (O.D.600 = 1.0) and injected directly into flower limbs of MD using a syringe with a Luer-Lok Tip. Fully opened flowers were cut with peduncles and soaked in water during the experiment. Agrobacterium having a ZsGreen1-PHK vector driven by a constitutive pFMV was injected as a positive control, and ABI as a negative control. The infected flowers were examined under a fluorescence stereo microscope (MZ16F, Leica Microsystems, Wetzlar, Germany) through a green filter [GFP (480/510 nm excitation/emission)], and the relative intensities of the fluorescent images were analyzed using ImageJ software (1.51; National Institutes of Health, Bethesda, MD, USA) as described in Cho et al. [24] until the flowers were completely wilted. The transient expression of ZsGreen1 driven by pCbTHI4 was also examined in Nicotiana benthamiana. Agrobacterium suspension harboring ZsGreen1 with pCbTHI4 or pFMV was diluted (O.D.600 = 0.5) with infiltration buffer [25] and injected directly into tobacco leaves using a syringe with a Luer-Lok Tip. The infected leaves were observed under a microscope using a GFP filter.

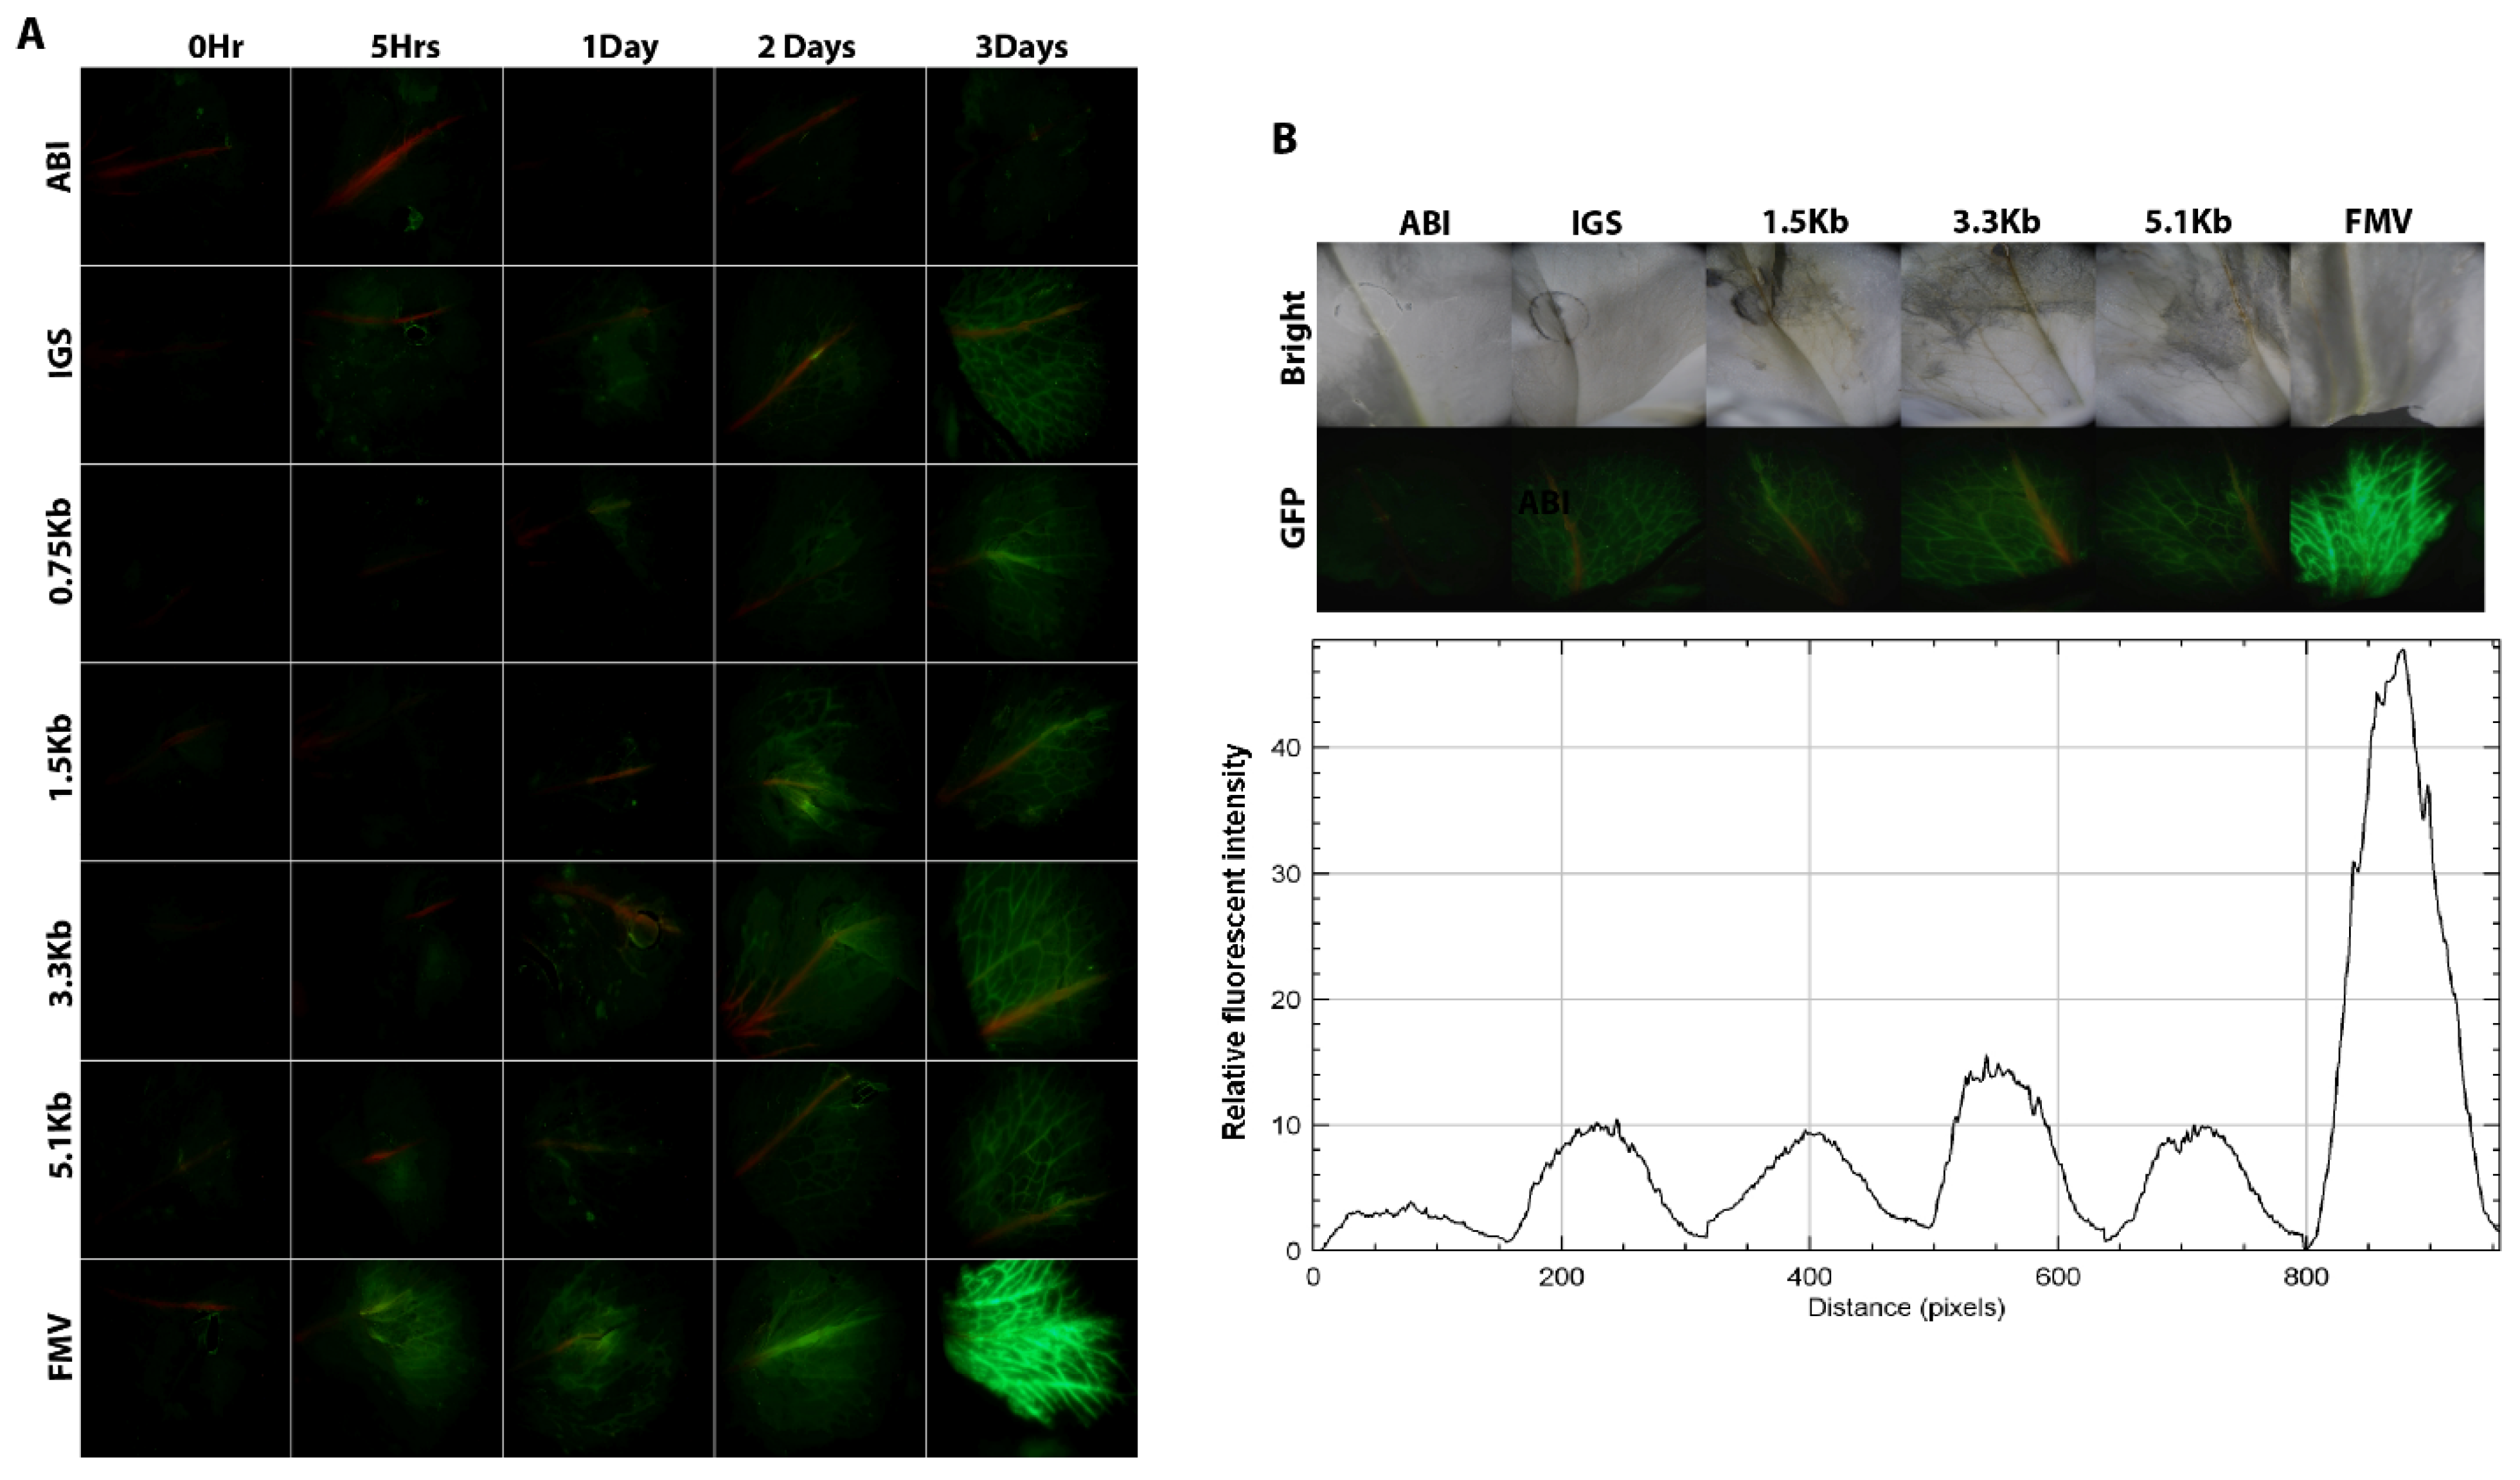
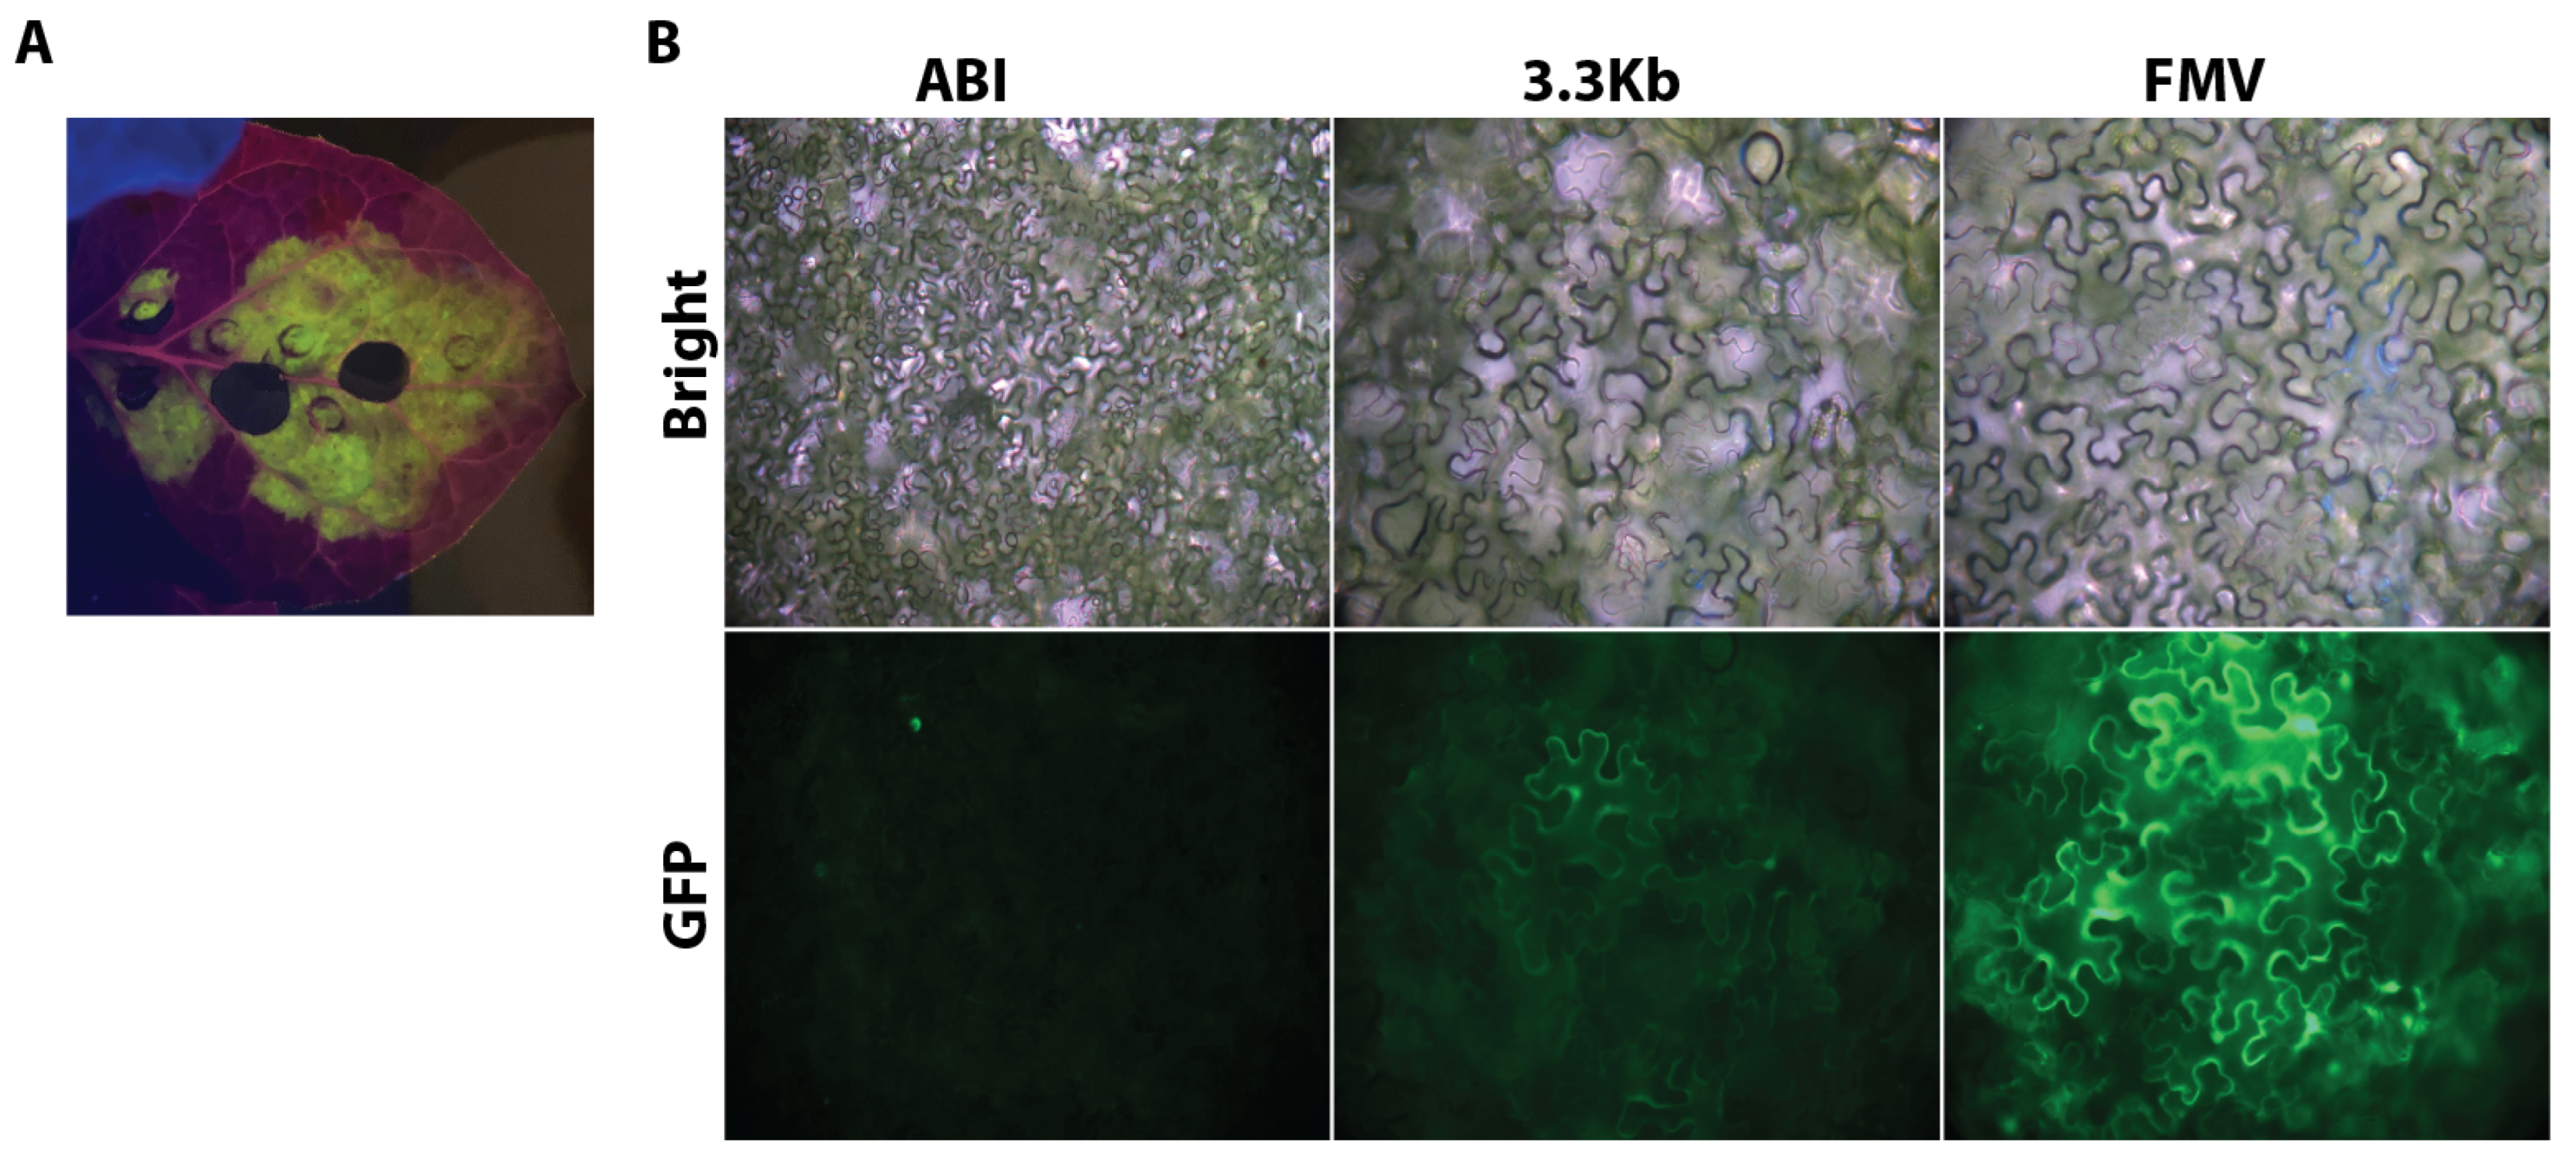
2.4. Analysis of a Transgene Expression Driven by Caladium THI4 Promoter

Five-week-old petunia leaf discs from seed germination on ½MS medium were transformed according to the method of Jorgensen et al. [26]. Total RNA was extracted using TriZOL™ (ThermoFisher Scientific, Waltham, MA, USA) as previously described [27] and treated with TURBO™ DNA-free™ (Ambion Inc., Austin, TX, USA). RNA was prepared into 50 ng µL−1 after measuring the concentration using a NanoDrop™ 2000c spectrophotometer (ThermoFisher Scientific, Waltham, MA, USA). Transcript accumulation was analyzed by semi-quantitative (sq)RT-PCR using a One-step RT-PCR kit (Qiagen Co., Valencia, CA, USA) and quantitative (q)RT-PCR using a Power SYBR® Green RNA-to-CT™ 1-Step kit and StepOnePlus™ real-time PCR system (ThermoFisher Scientific, Waltham, MA, USA). Primers were designed using Primer3 (https://primer3.ut.ee/, accessed on 5 March 2021) (primers in Table S1). To analyze transcript accumulation of ZsGreen1, (q)RT-PCR was performed using petunia 18S ribosomal RNA (Ph18S), fructose-bisphospatase1 (FBP1), and/or ubiquitin (PhUbiq) as an internal standard with three replications to compare the expression of each gene. All (q)RT-PCR data was analyzed using the 2−∆ΔCt method [28]. Flowers and dissected tissues were examined under a microscope using a GFP filter.

3. Results

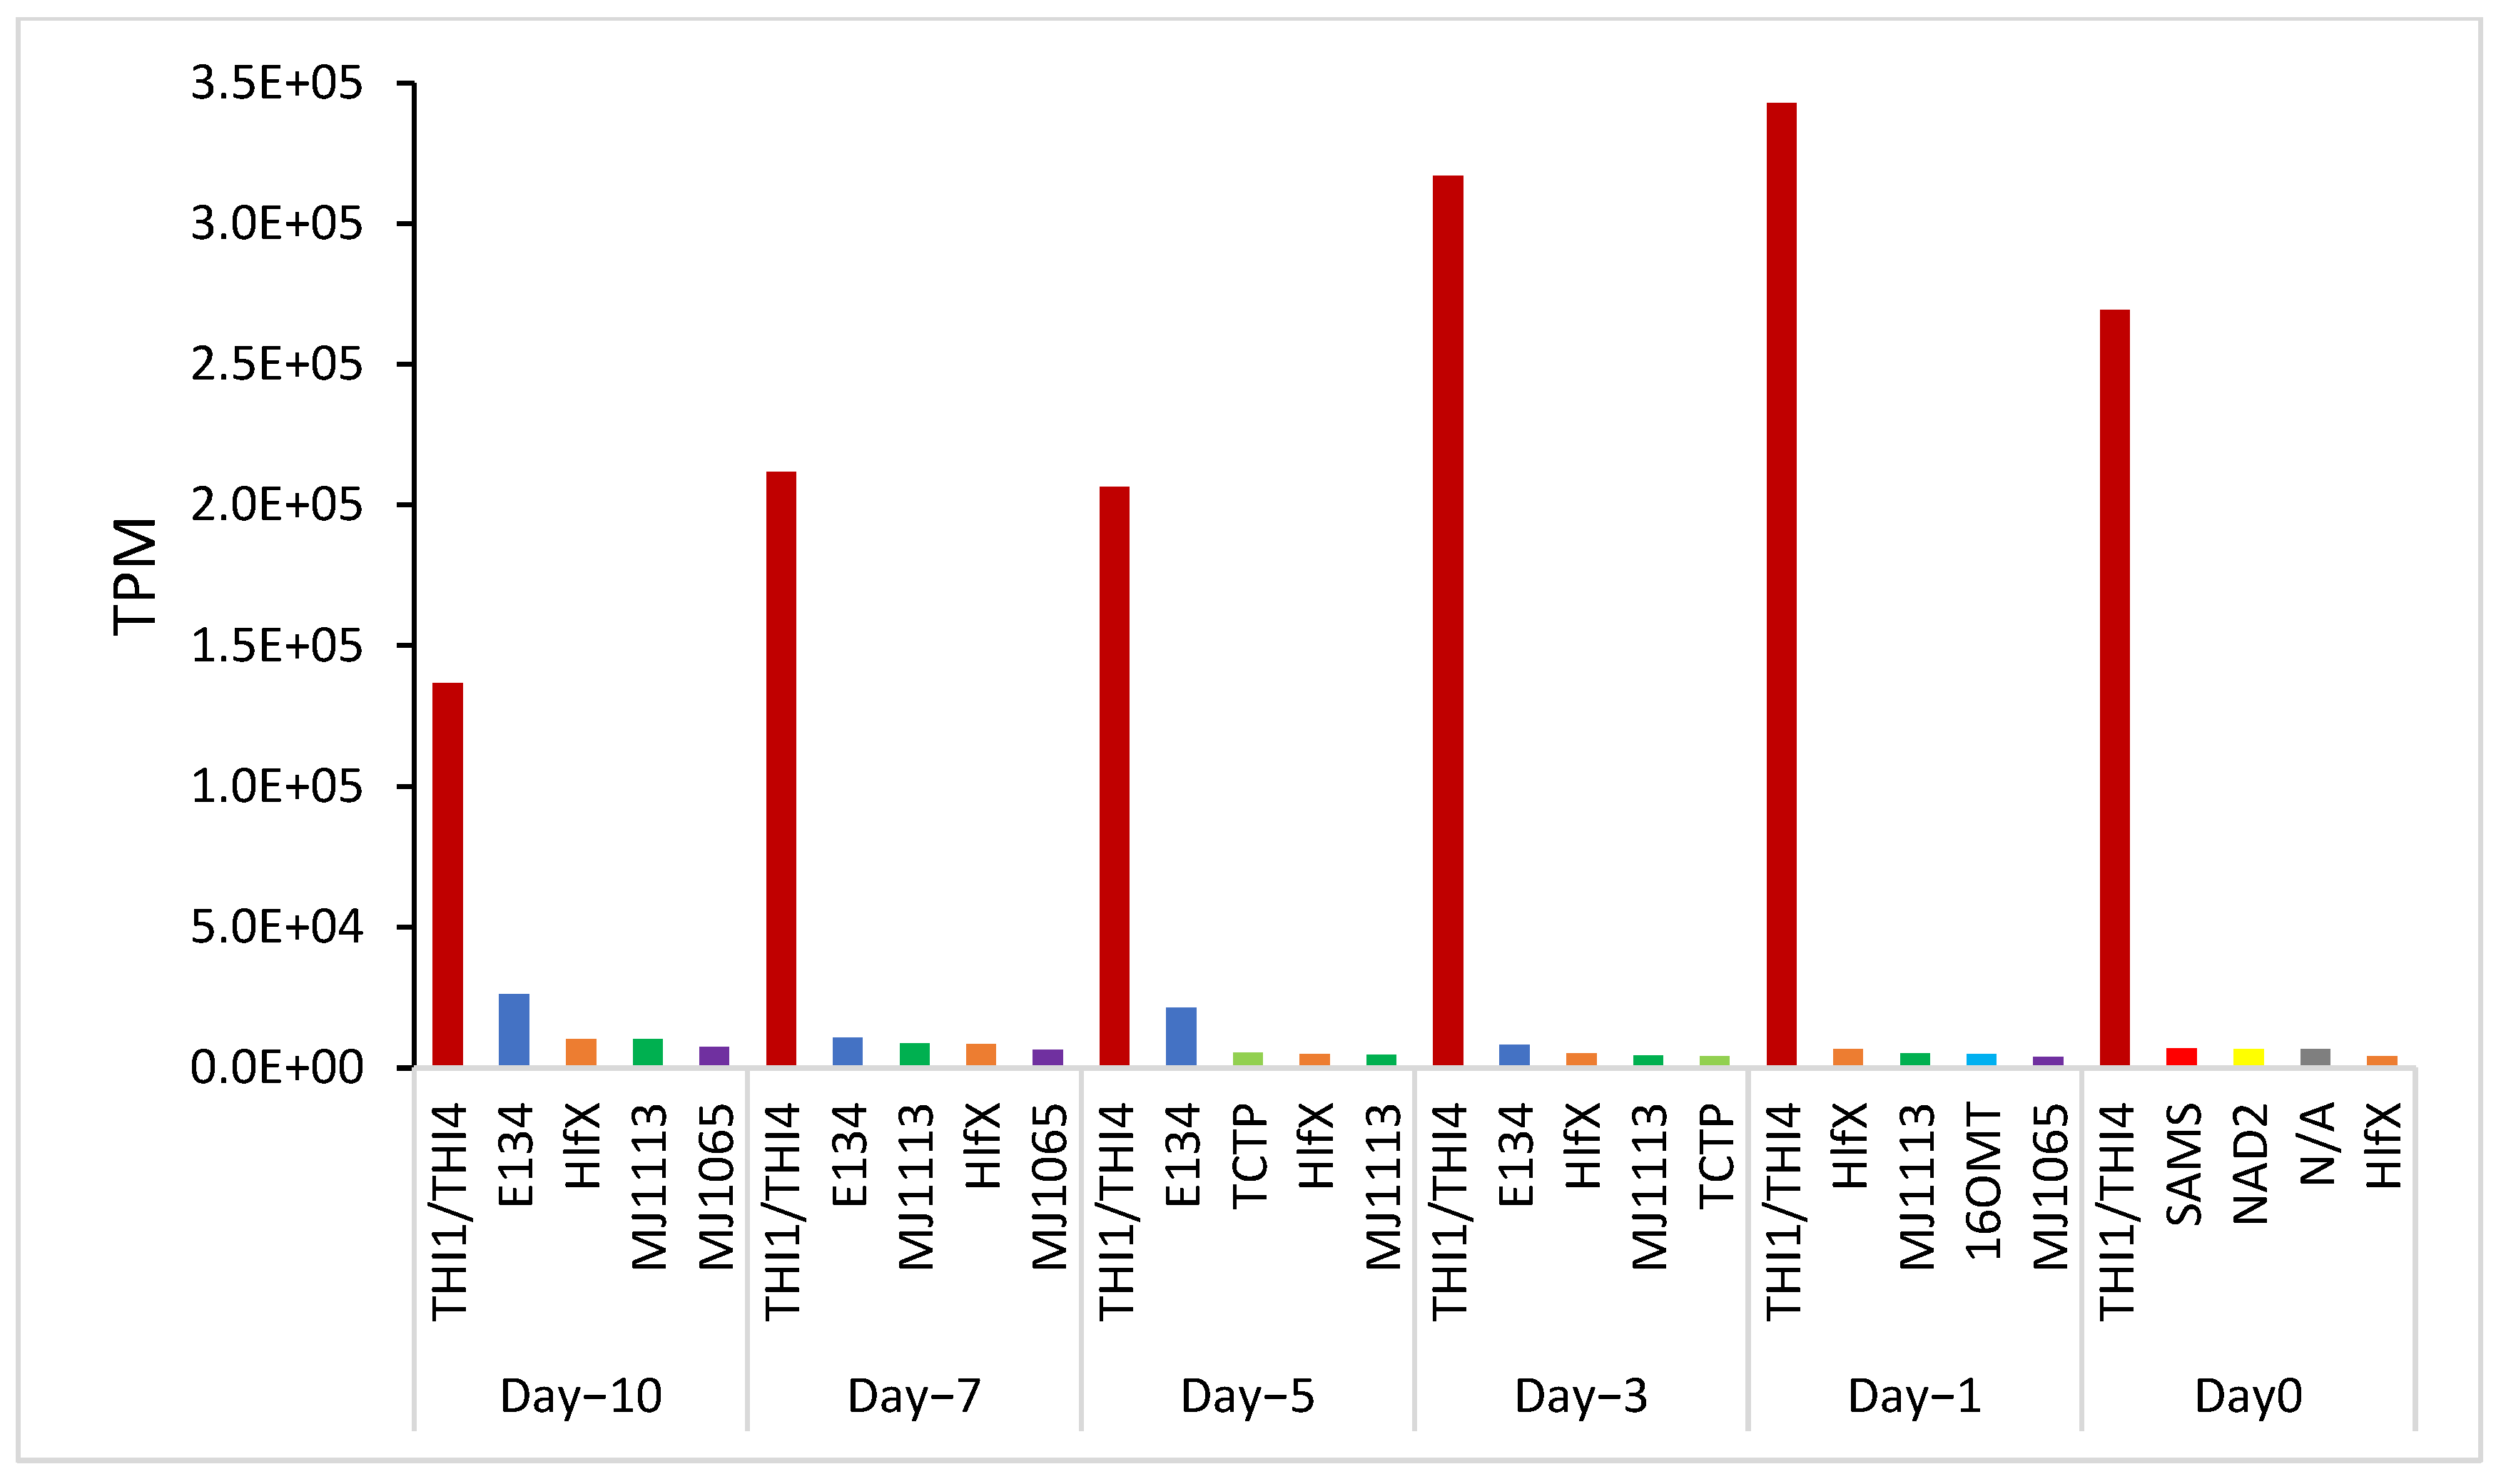
3.1. Predicted Transcript Analyses

A total of 9376 DEGs were analyzed for predicted functional transcripts using PlantTFDB v.4.0 (http://planttfdb.cbi.pku.edu.cn/, accessed on 5 March 2021). Of the 58 currently known plant transcription factor families, including bHLH (17), MYB-related (16), ERF (12), GRAS (11), MYB (9), and WRKY (9), 45 were identified from 187 annotated transcription factor sequences (Table S2). The top five transcripts in each flower developmental stage were identified. THI4 was the highest expressed transcript during flower development, accounting for approximately 25% of DEGs in the transcriptome (Figure 1). Among the 93,681 transcripts analyzed, 9376 transcripts, including THI4, showed significant changes in DEG developmental profiles from Day−10 to Day0. Short Time-series Expression Miner (STEM) was used to identify clusters that revealed increasing (Profile 16), decreasing (Profile 22), and constant transcripts across flower development (Profile 2) (Figure 2). THI4 was associated with Profile 16, indicating elevated THI4 expression during flower development.

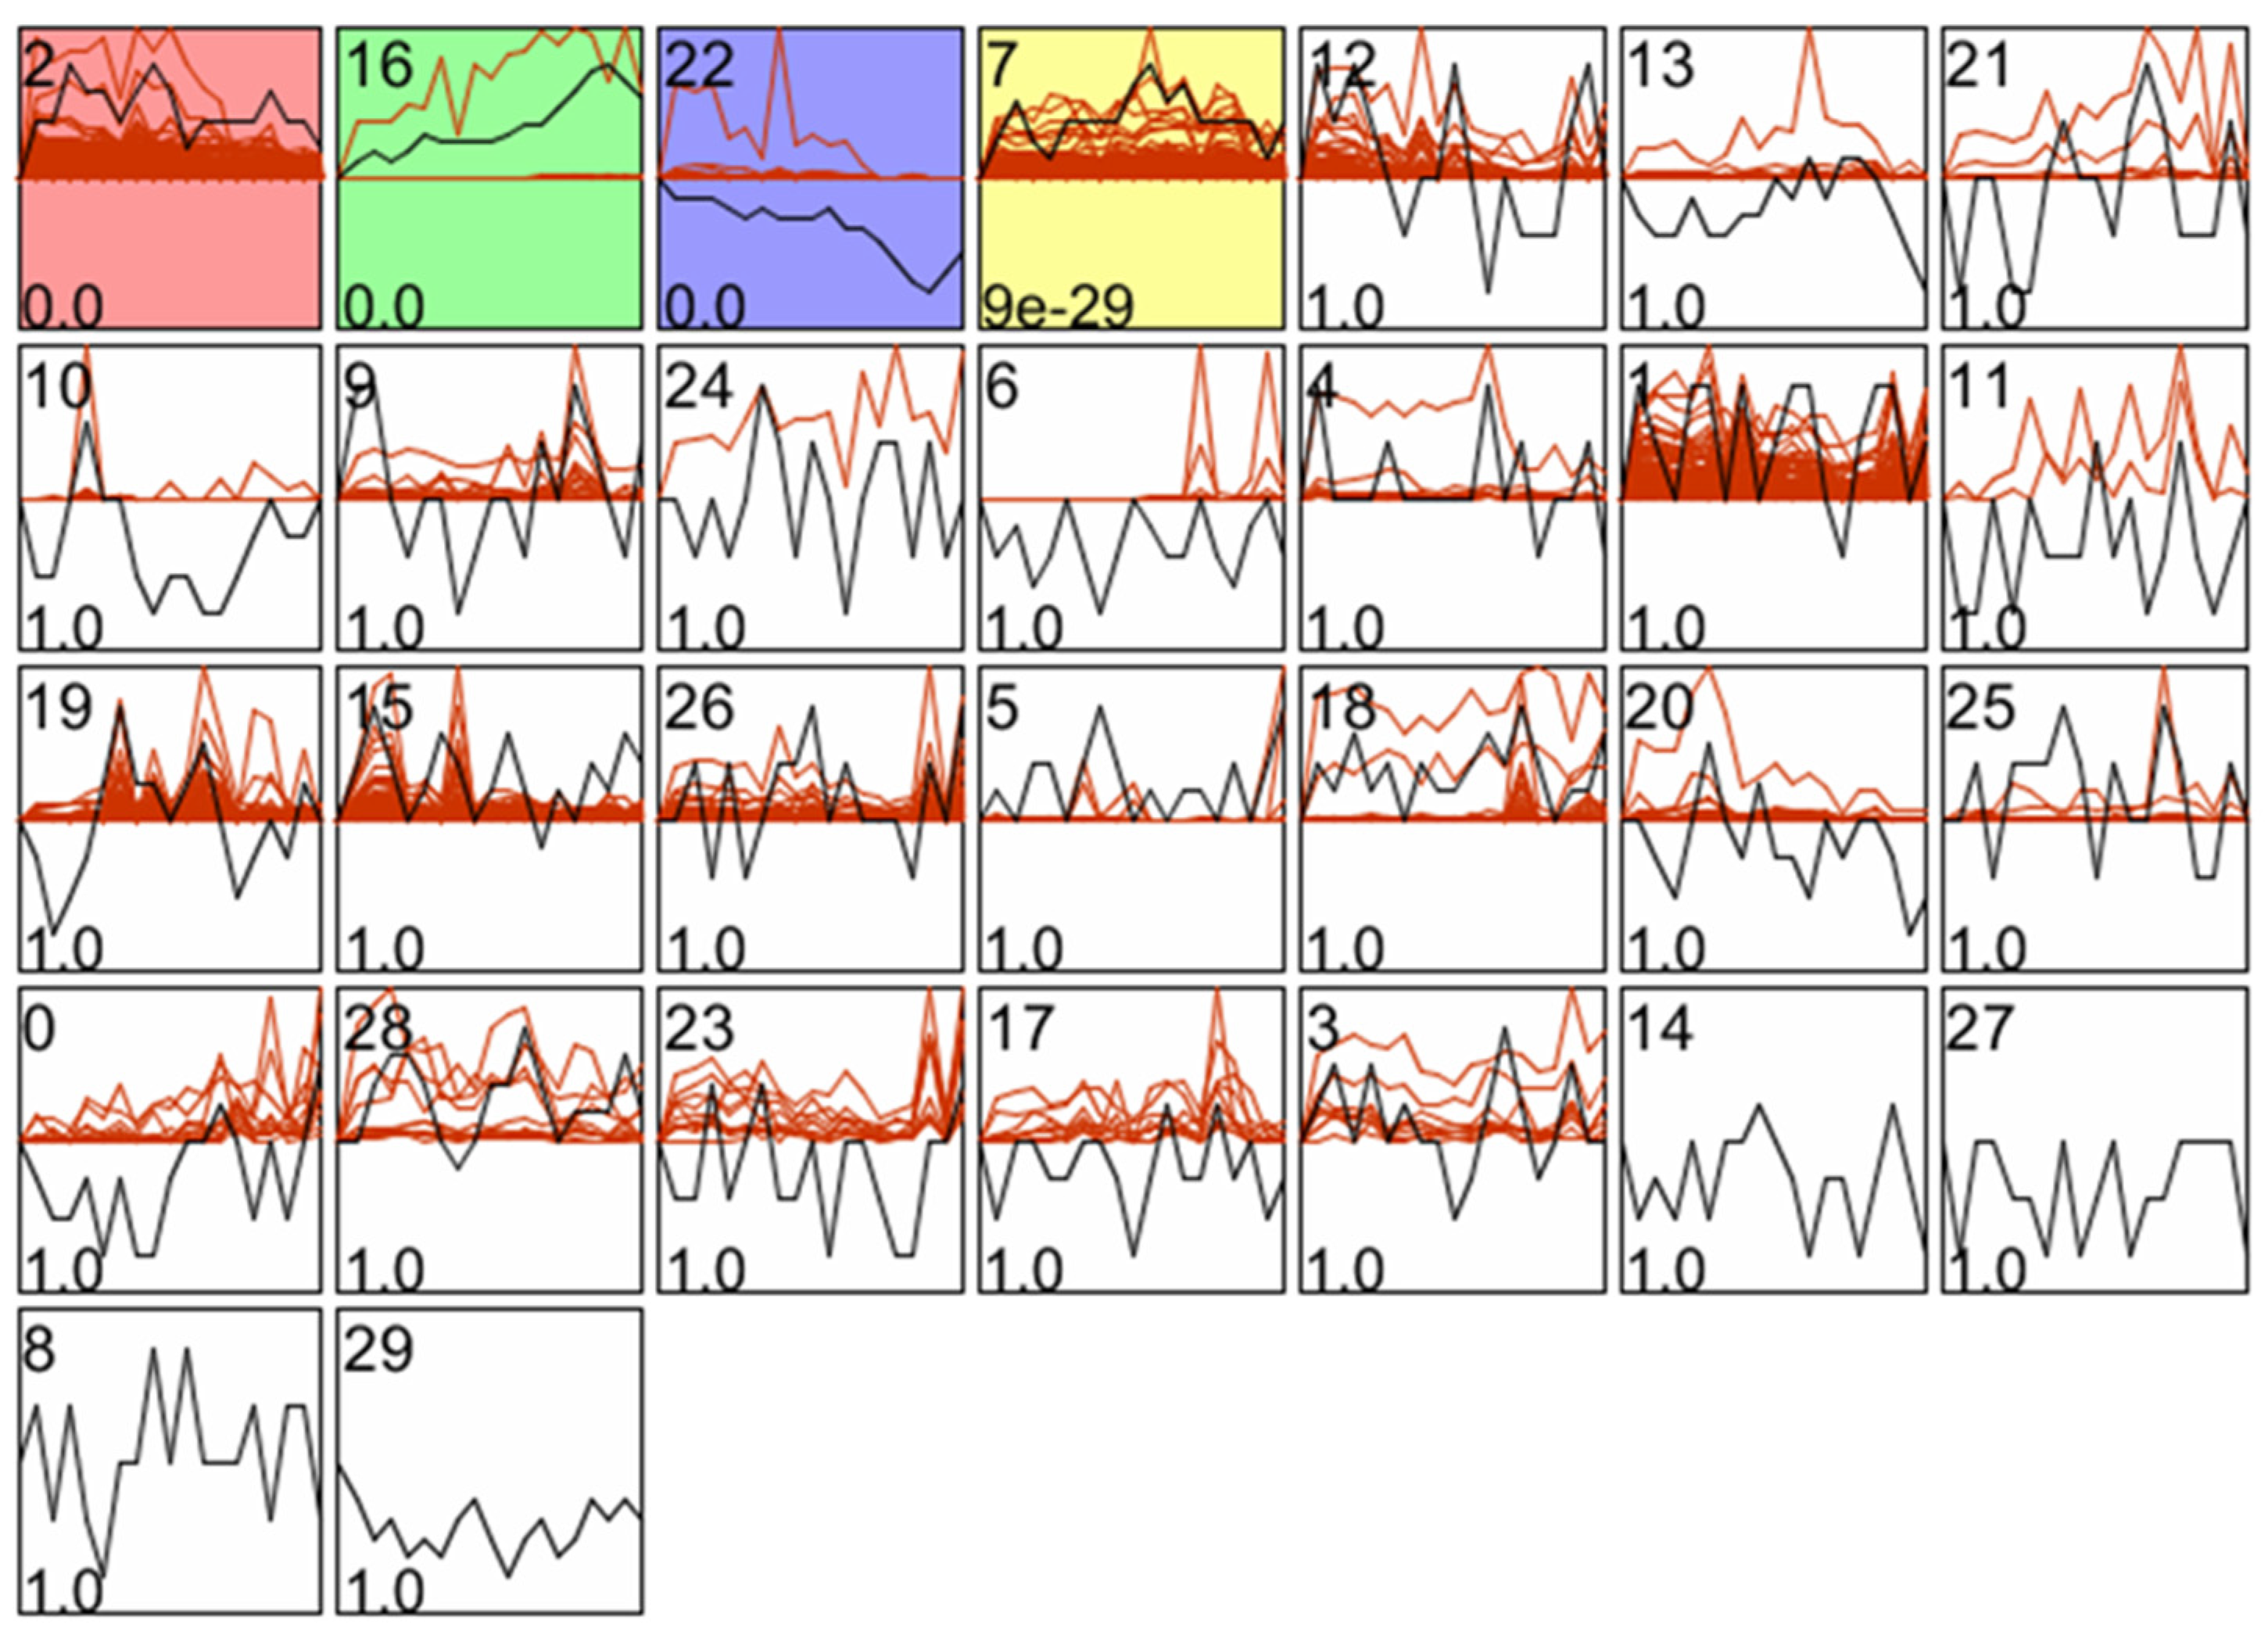
3.2. Putative THI4 Regulatory Transcripts

We analyzed transcripts demonstrating significant changes across flower developmental stages and compared them with the floral volatiles of caladium to identify potential regulatory transcripts of THI4. On Day0, a hundred transcripts involved in secondary metabolite biosynthesis were elevated, several of which were associated with floral volatiles of ‘Tapestry’ (Figure 3 and Table S3). The top four genes identified were trans-resveratrol di-O-methyltransferase (ROMT), chalcone synthase (CHS), 3-ketoacyl-CoA thiolase 2 (KAT2), and linalool synthase (TPS). These four genes correspond to the following elevated volatiles of caladium: 1,3,5-trimethoxybenzene (TMB), MVT, indole, methyl salicylate, and linalool. Other highly expressed transcripts were associated with biosynthesis of floral terpenoid-, benzenoid/phenylpropanoid-, and carotenoid-derived compounds, such as caffeoyl-CoA O-methyltransferase (CCoAOMT), cytochrome P450 family 71 subfamily A (CYP71A), carotenoid cleavage dioxygenase 4 (CCD4), and jasmonate O-methyltransferase (JMT) (Table S3).
Of the 442 transcripts involved in RNA development, chromatin remodeling, and transcription factors, 115 genes increased from Day−10 to Day0. Notably, a viral polyprotein (helper component proteinase, HCPro) showed approximately 150-fold higher expression on Day0 than on Day−10. MYB-related protein 305-like (MYB305) and a transcription factor REVEILLE 3 (ASG4/RVE3) also exhibited high levels on Day0 (Figure 4 and Table 1). The top three RNA modifying transcripts (GRP1A, PABP2, and ABCF1) that showed decreased levels from Day−10 to Day0 were associated with effective RNA post-transcriptional processing, viral RNA translation, and RNase L inhibition, respectively (Table 2). CPN60/groEL transcripts involved in protein folding chaperones were low on Day0, while histone modifiers and RNA binding proteins levels were not changed much throughout development.

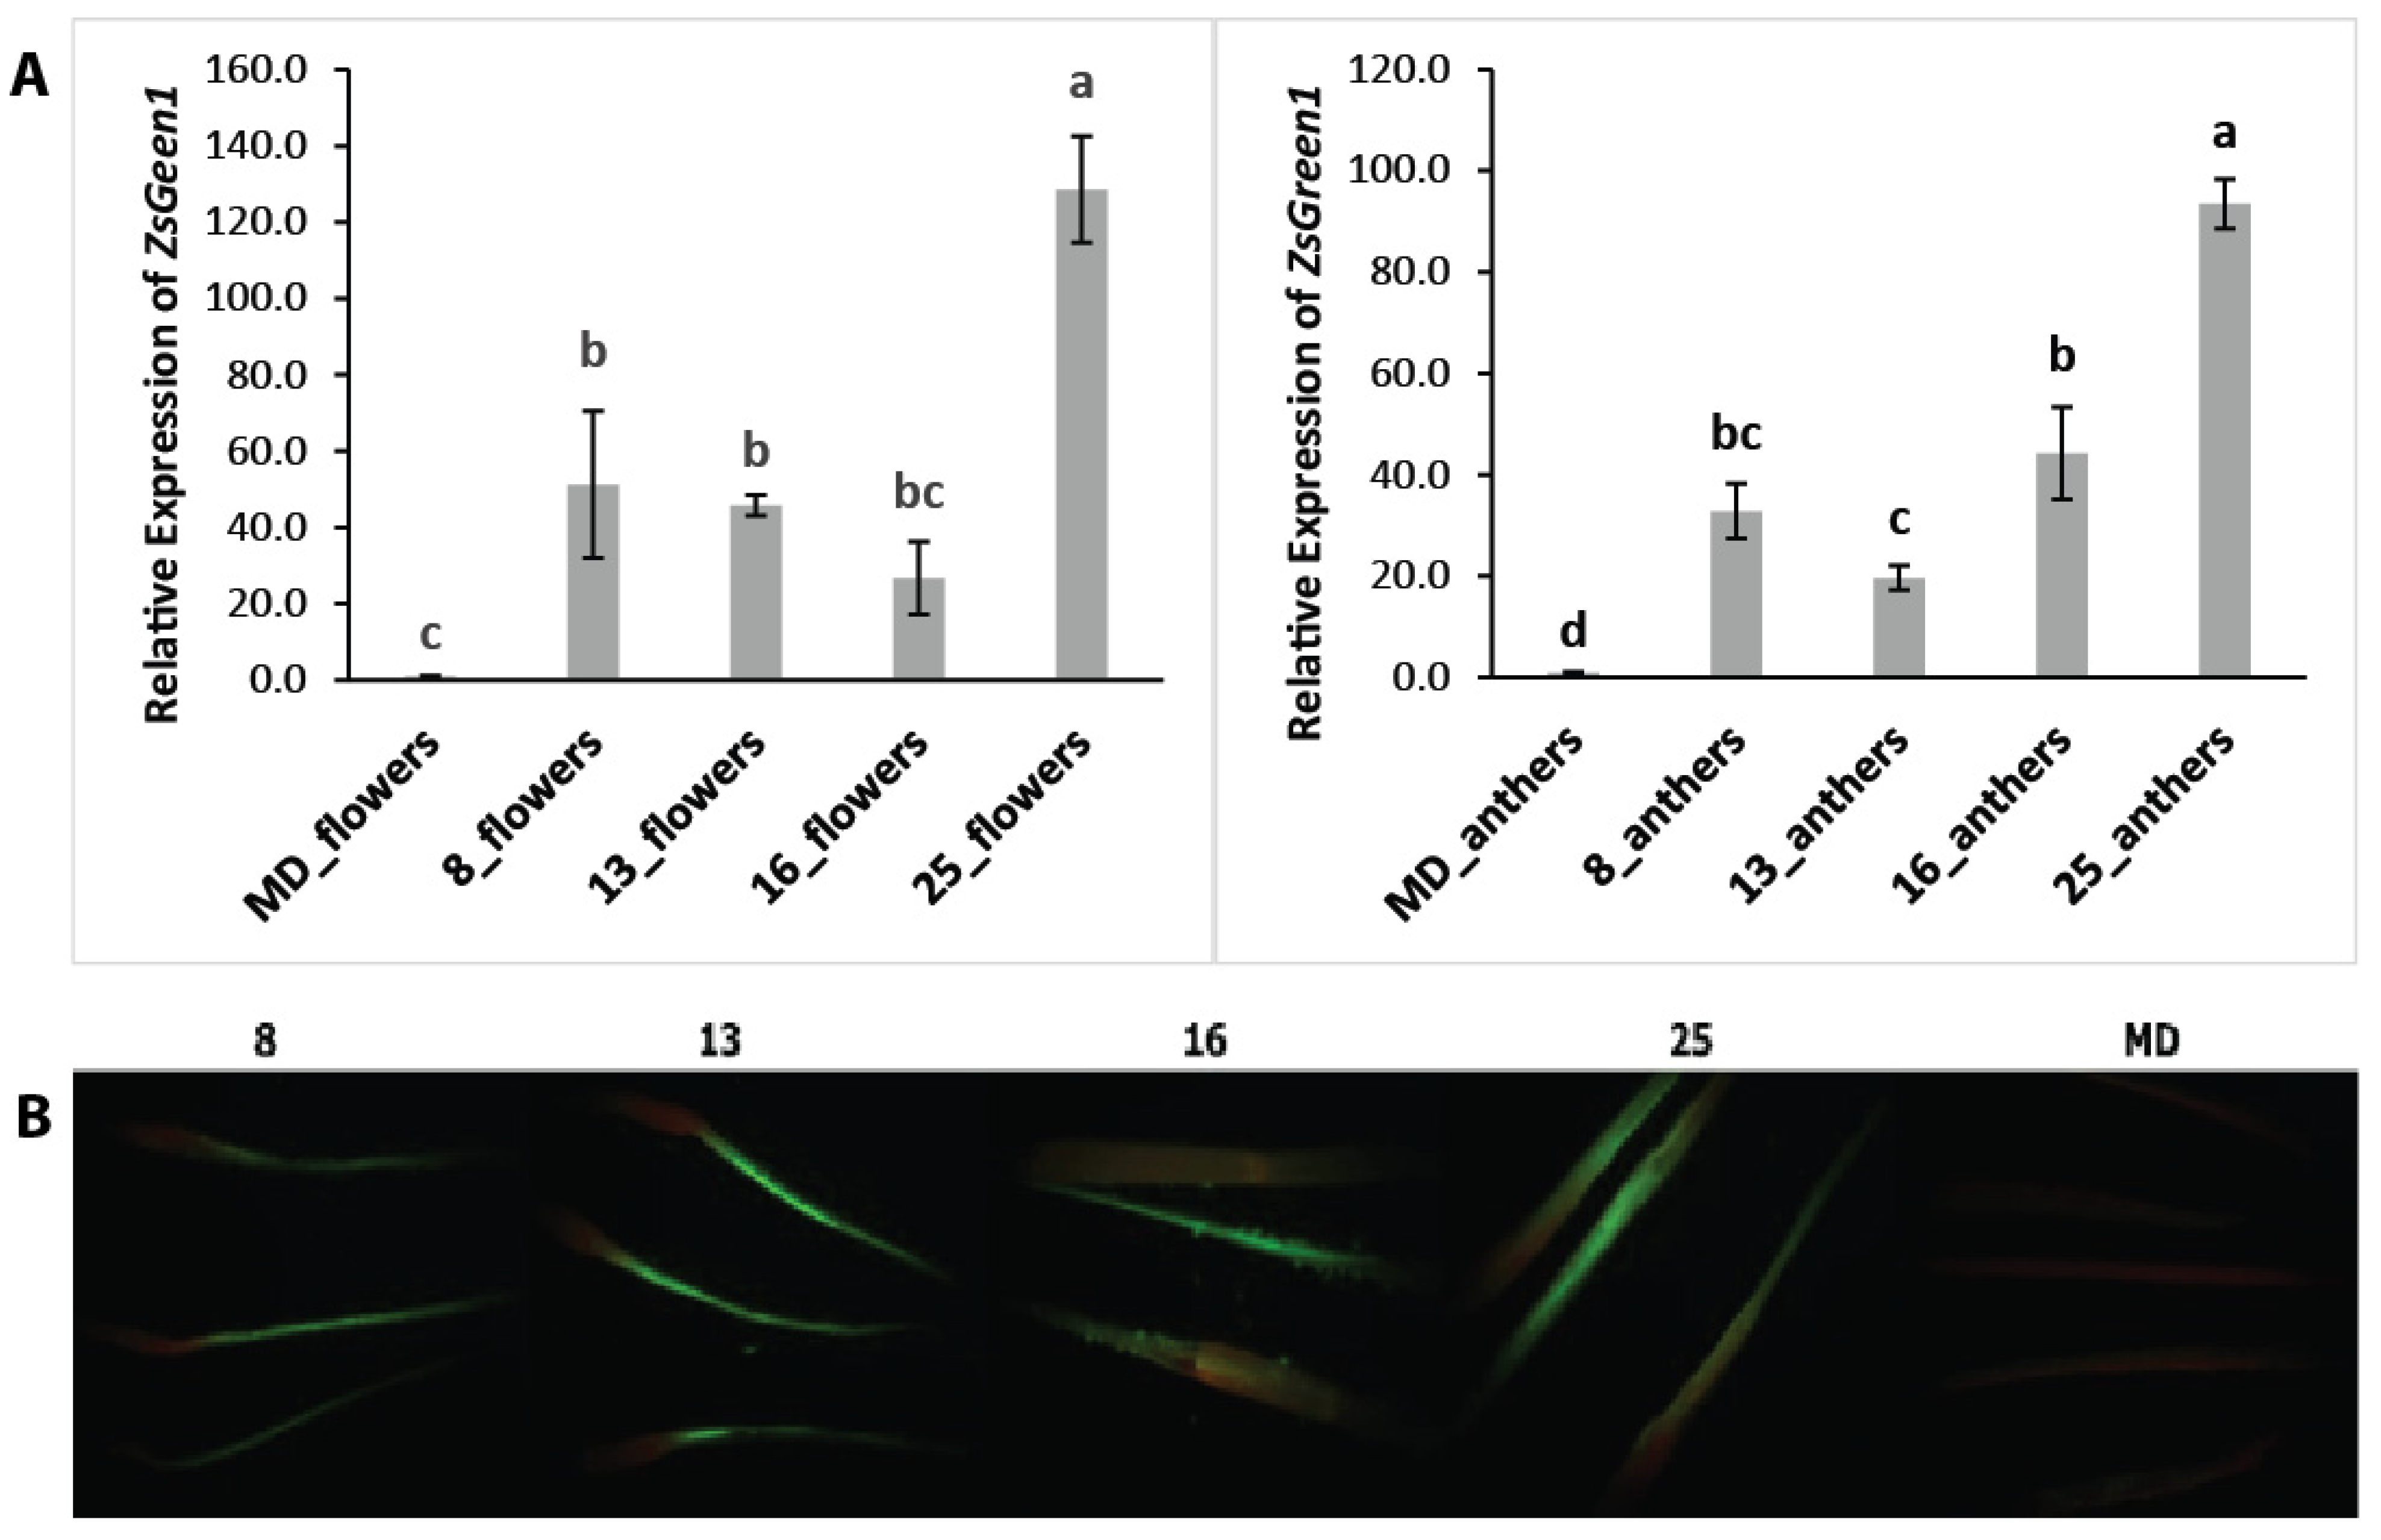
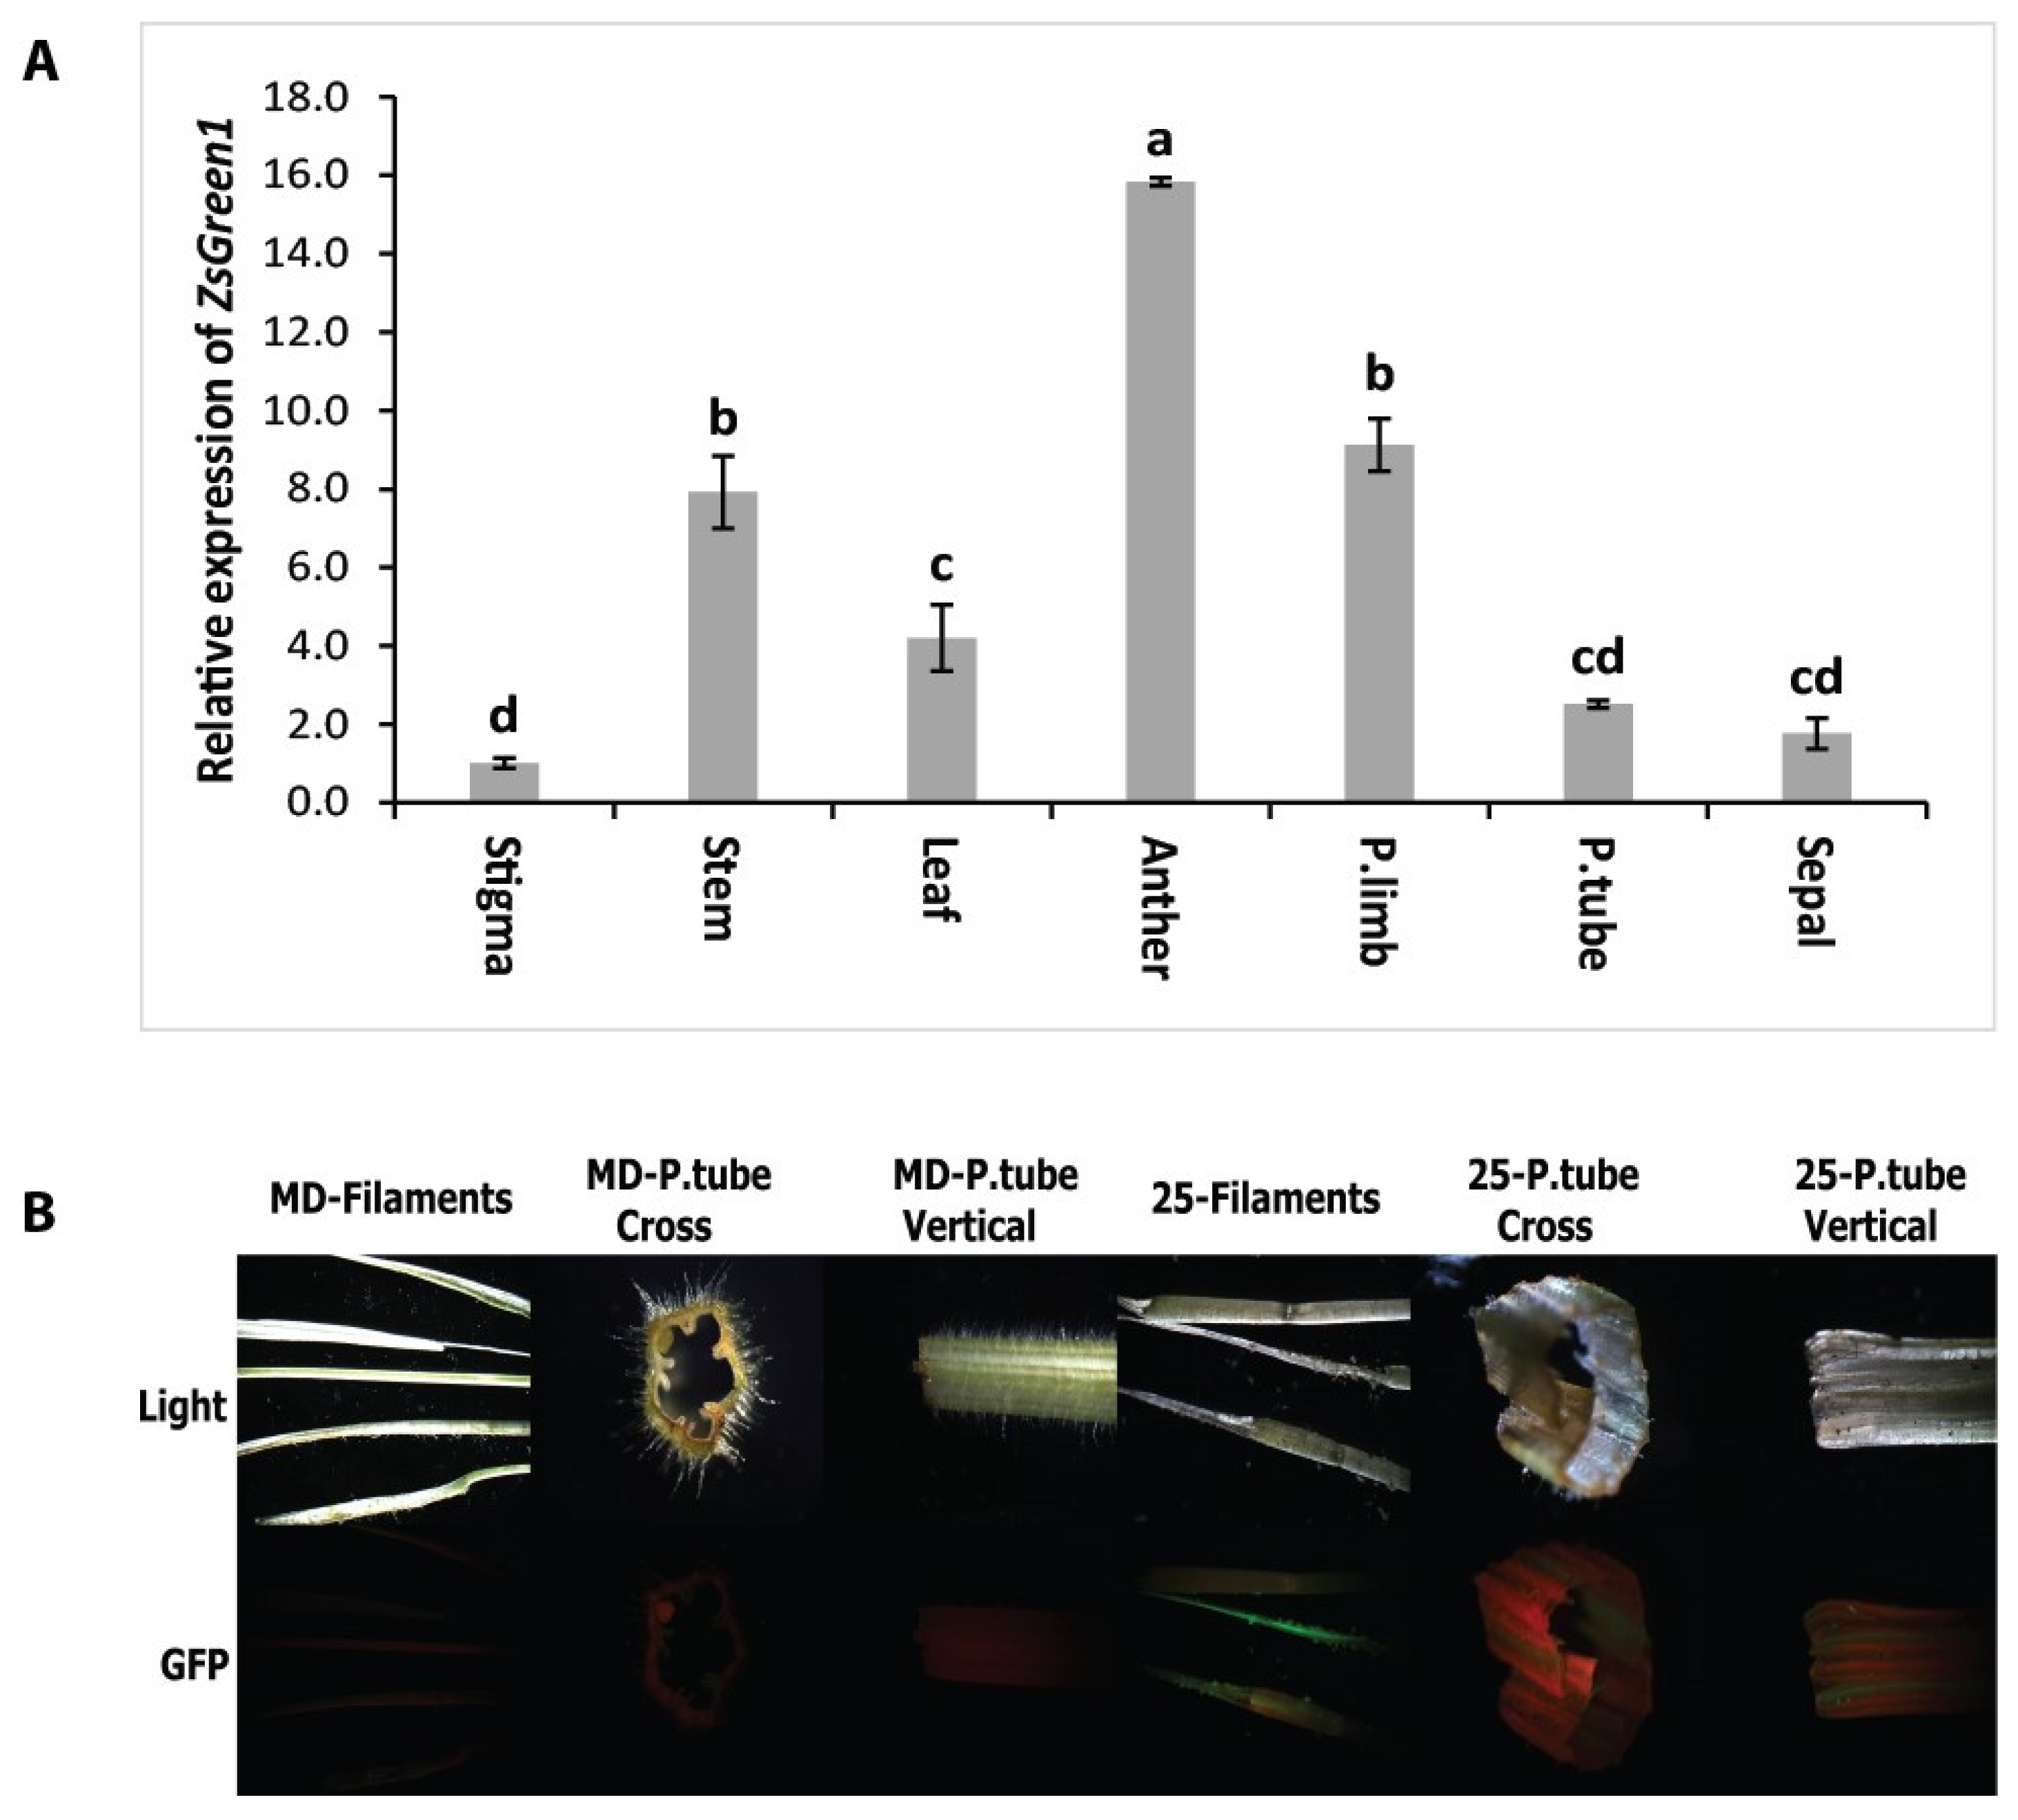
3.3. Male Tissue-Specific Expression of Caladium THI4 Promoter in Tobacco and Petunia Plants

A 5127 bp nucleotide, including a 5′ untranslated region (UTR) of the caladium THI4 gene, was cloned and analyzed using the Plant Cis-acting Regulatory DNA Elements (PLACE) database [29]. This sequence contained four elements related to the CaMV 35S promoter and fourteen elements related to MYB protein, including the anther-specific boxes, GTGANTG10, and POLLEN1LELAT52. There were sixteen GTGANTG10 and nine POLLEN1LELAT52 boxes in the 3.3 kb upstream region of the THI4 gene (Figure 5 and Table S4).
We investigated the transient expression of ZsGreen1 using different sizes of pCbTHI4 via Agrobacterium infiltration (Figure 6). ZsGreen1 signals were initially detected faintly in the veins of petunia flowers on the day after infiltration. Over time, the signals intensified and peaked three days after infiltration (Figure 7A). Due to the wilting of the flowers after three days, we could not determine the duration of transient expression or its maximum intensity. The regulation of pCbTHI4 was compared to the petunia promoters. The fluorescence of ZsGreen1 was not detectable in flowers using ABI but was observed in all other flowers. The intensity with 3.3 kb or 5.1 kb of pCbTHI4 was similar to that with pIGS but not significantly brighter than with pFMV (Figure 7B). The tissues injected with Agrobacterium containing pCbTHI4 showed faster browning than those injected with other promoters. Similar results were obtained in the transient expression assay in tobacco leaves, where ZsGreen1 fluorescence was absent with ABI but strong with pFMV (Figure 8A,B).
Petunia plants were genetically modified with ZsGreen1 using a 3.3 kb CbTHI4 promoter. Four lines, 8, 13, 16, and 25, showed high levels of ZsGreen1 expression through RT-PCR and qRT-PCR (Figure 9A). Using another reference gene, PhUbiq, the relative expression of ZsGreen1 showed the same pattern (Figure S1). The endogenous transcript levels of ZsGreen1 in whole flowers were significantly higher in these lines (26.75~128.55 folds) compared to MD plants, and the transcript levels of ZsGreen1 in the anthers of these lines also exceeded those of MD (32.8~93.45 folds) (Figure 9A). Under a fluorescence stereo microscope using a GFP filter, ZsGreen1 fluorescence was exclusively observed in the anthers and filaments (Figure 9B).
Seeing that line 25 exhibited the highest transcript levels, we used dissected tissues from this line for further investigation. The transcript of ZsGreen1 in the anther was 15.84 times higher than in the stigma (Figure 10A). ZsGreen1 fluorescence was especially observed in male reproductive tissues, such as anthers and filaments, and was absent in other flower parts including the ovary, petal limb, and sepal. In addition to the strong fluorescence detected in the anthers and filaments, we also observed slight fluorescence in the petal limbs connected to the filaments (Figure 10B).

4. Discussion

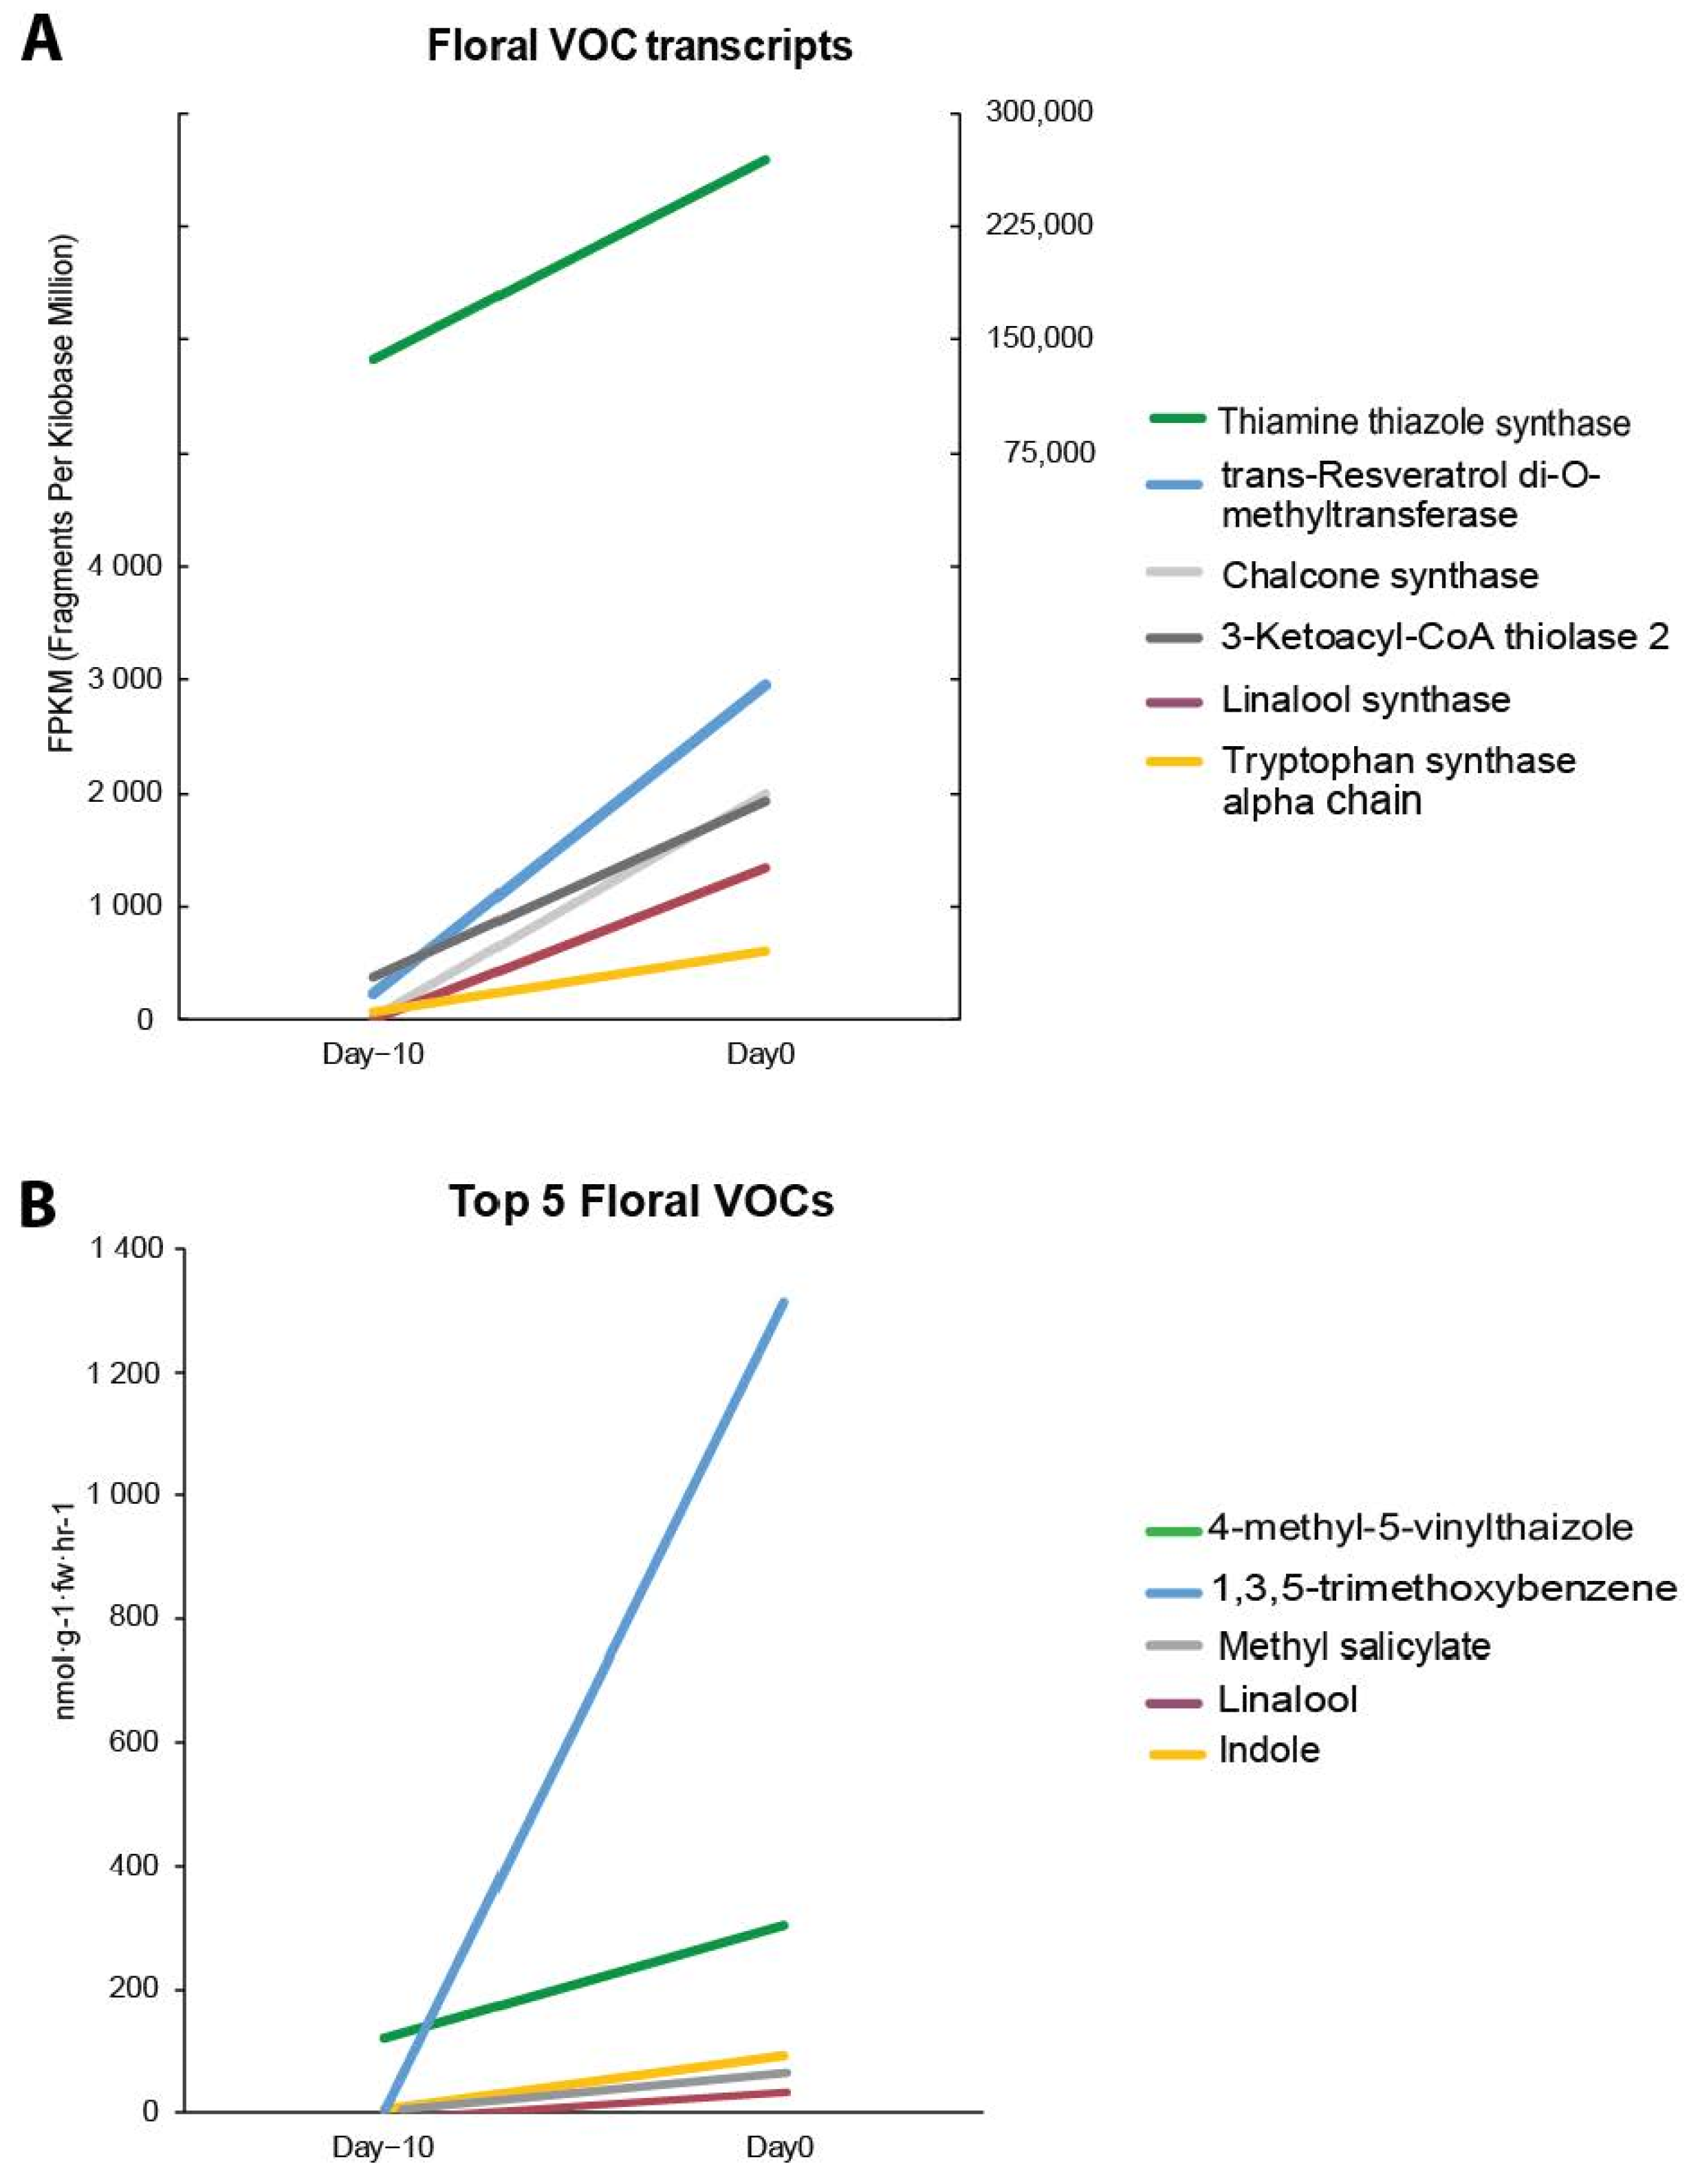
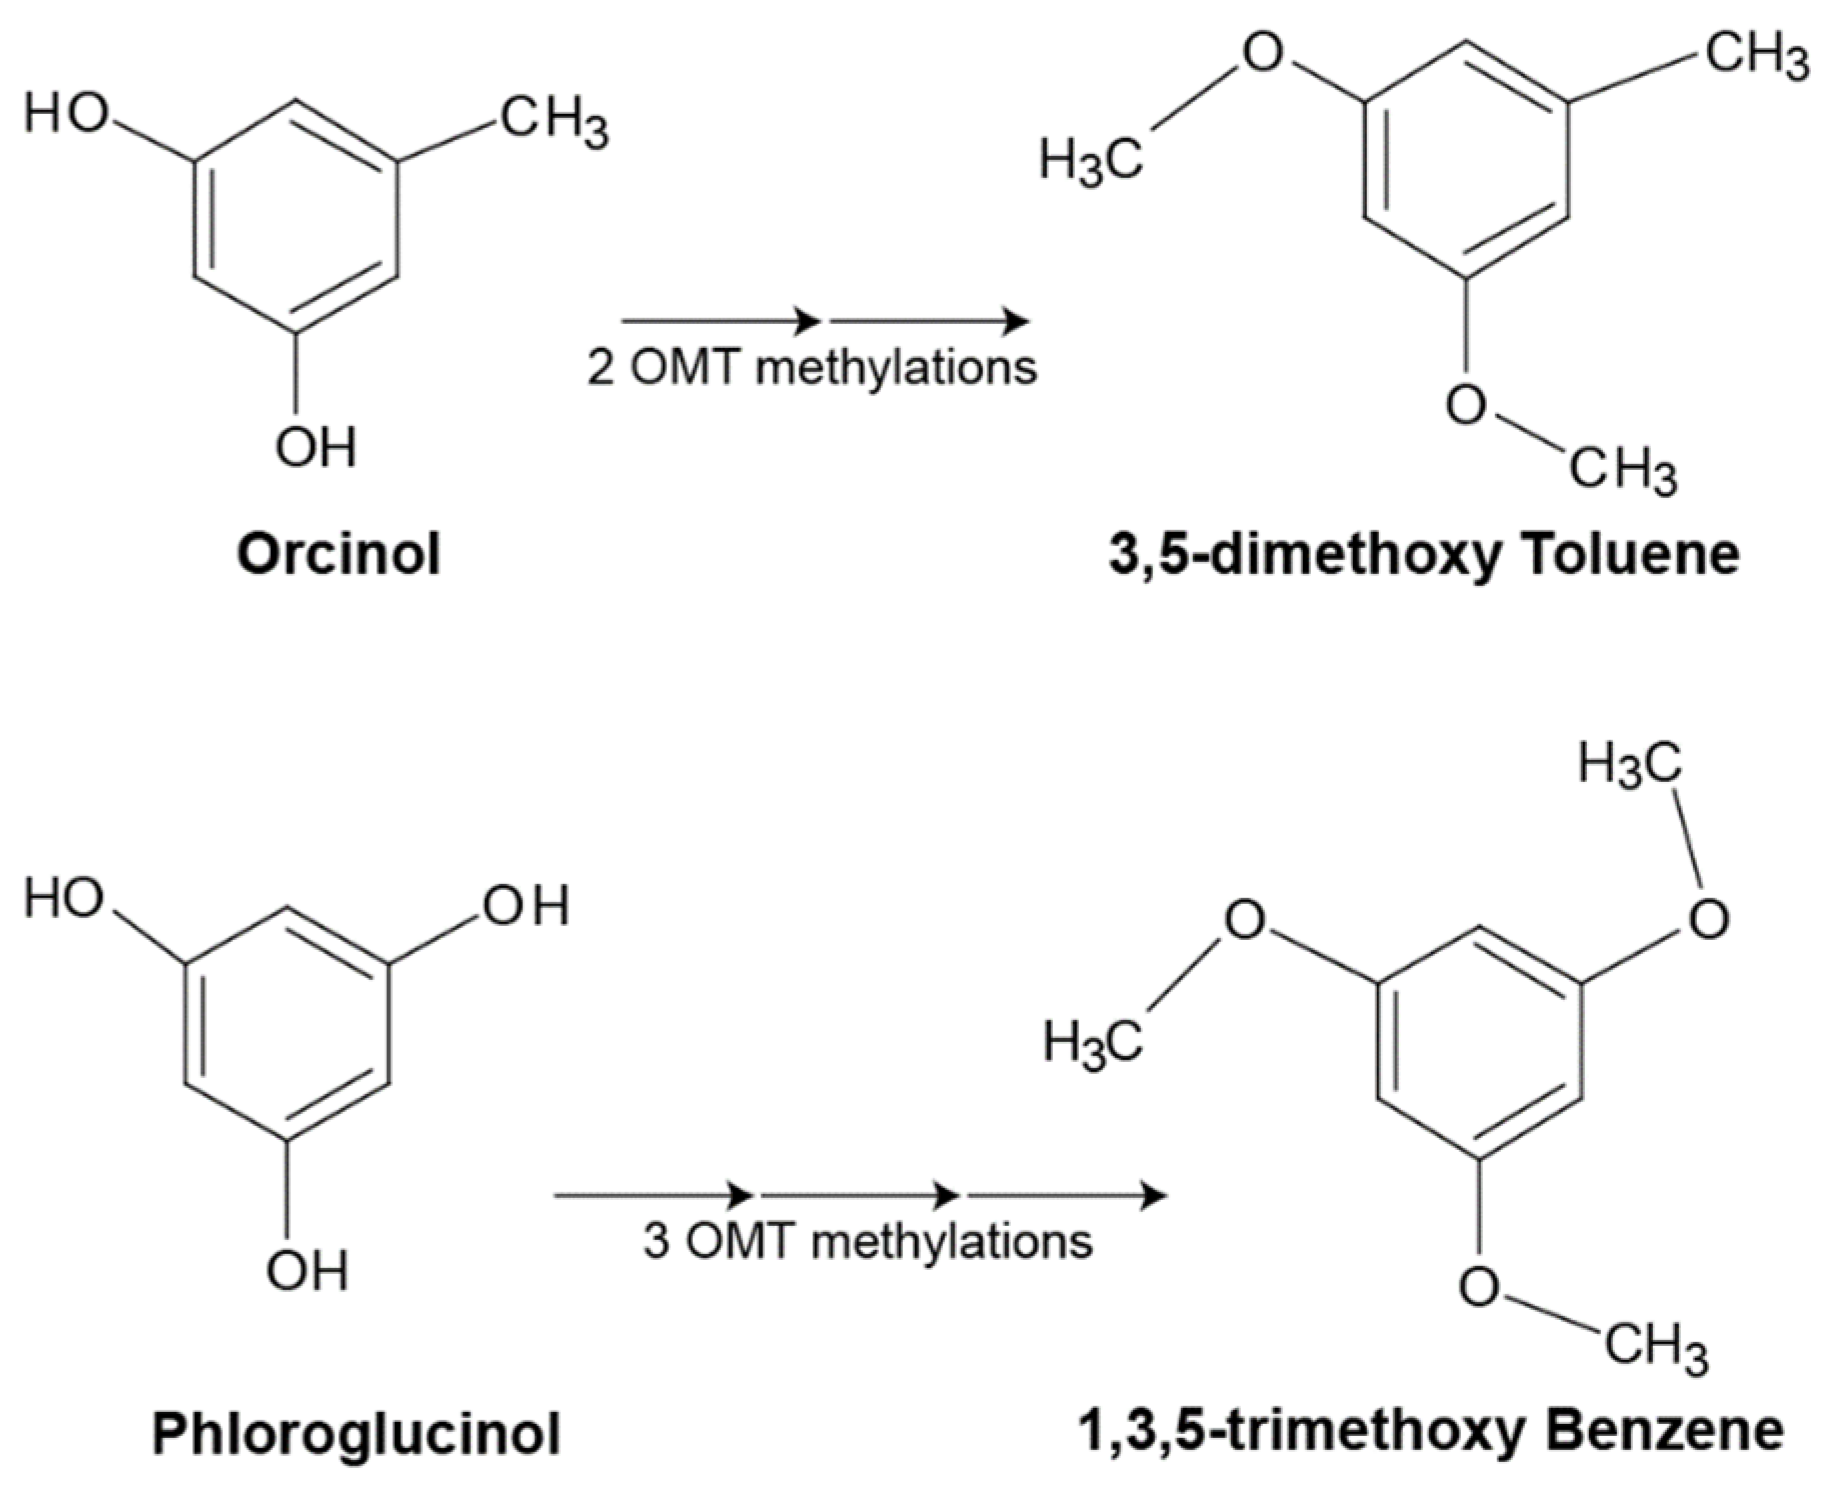
4.1. Transcripts Associated with Secondary Metabolite Biosynthesis Showing High Expression Coincided with De Novo C. bicolor Volatiles Emission

We previously showed that MVT was accumulated in caladium floral tissue throughout development, and that endogenous THI4 transcript level was high in male flowers [7]. MVT was the only volatile compound accumulated before female anthesis. With analyses of flower transcriptomes, we found that THI4 was the only elevated transcript corresponding to MVT expression during male flower development (Figure 3), supporting the idea that THI4 is a crucial precursor to producing MVT. MVT accumulated in large amounts throughout flower development (Day−10 to Day−1), while other volatile compounds were present only during flower maturation (Day−1 to Day+1). This is consistent with regulatory patterns of secondary metabolic transcripts observed in petunia and Arabidopsis. Elevated genes associated with volatiles, such as KAT1 and CHS, were found in these flowers upon maturation [30,31]. Other secondary metabolic regulators exhibiting high levels, such as TPS and triacylglycerol lipase SDP1, were associated with terpene biosynthesis and β-oxidation of fatty acids (Table S3). These processes generate volatile byproducts through primary metabolism and stress responses [32,33,34,35,36,37]. Further research would be necessary in the early stages of plant development to understand when THI4 and other candidate genes engage in MVT synthesis, as the accumulation of MVT and THI4 started with flower emergence. THI4 transcript expression also increased during shoot development (Figure S2).
The transcript displaying the highest level in secondary metabolite biosynthesis was ROMT, which is associated with 3,5-dimethoxy toluene (DMT) and 1,3,5-trimethoxy benzene (TMB) biosynthesis. The initial steps of the DMT and TMB pathways have not been fully understood. However, it is known that o-methyltransferases (OMTs) are involved in the methylation of orcinol and phloroglucinol to produce DMT and TMB, respectively (Figure 11). The structures of orcinol and phloroglucinol are similar, with phloroglucinol having an additional hydroxyl group at the 1-position of the benzene ring. Research has shown that several orcinol OMT methylate hydroxyl groups at the 3- and 5-positions of the benzene ring produce DMT in roses [38,39,40]. Wu et al. [41] found phloroglucinol OMT in rose petals along with two orcinol OMTs that methylate phloroglucinol to synthesize TMB in vitro. However, some OMTs can methylate hydroxyl groups of substrates that they typically do not have a high affinity for. For example, Schmidlin et al. [42] demonstrated that orcinol OMT1 methylate resveratrol, the substrate typically methylated by ROMT, yields pterostilbene. ROMT is responsible for producing rose oil and orcinol. The change in ROMT transcript level during caladium flower development corresponded with the change of TMB in volatile emissions as shown in Figure 3. This implies that caladium could use ROMT to methylate a benzaldehyde-containing precursor at the 1-, 3-, or 5-positions of the benzene ring to form TMB. Other OMTs are likely to be involved in TMB synthesis due to the multiple methylation steps required. For example, caffeoyl-CoA 3-O-methyltransferase (CCoAOMT) has been shown to methylate the 3-position of three hydroxycinnamoyl alcohol monolignol precursors and was found within the upregulated secondary biosynthetic transcript profile [43,44].

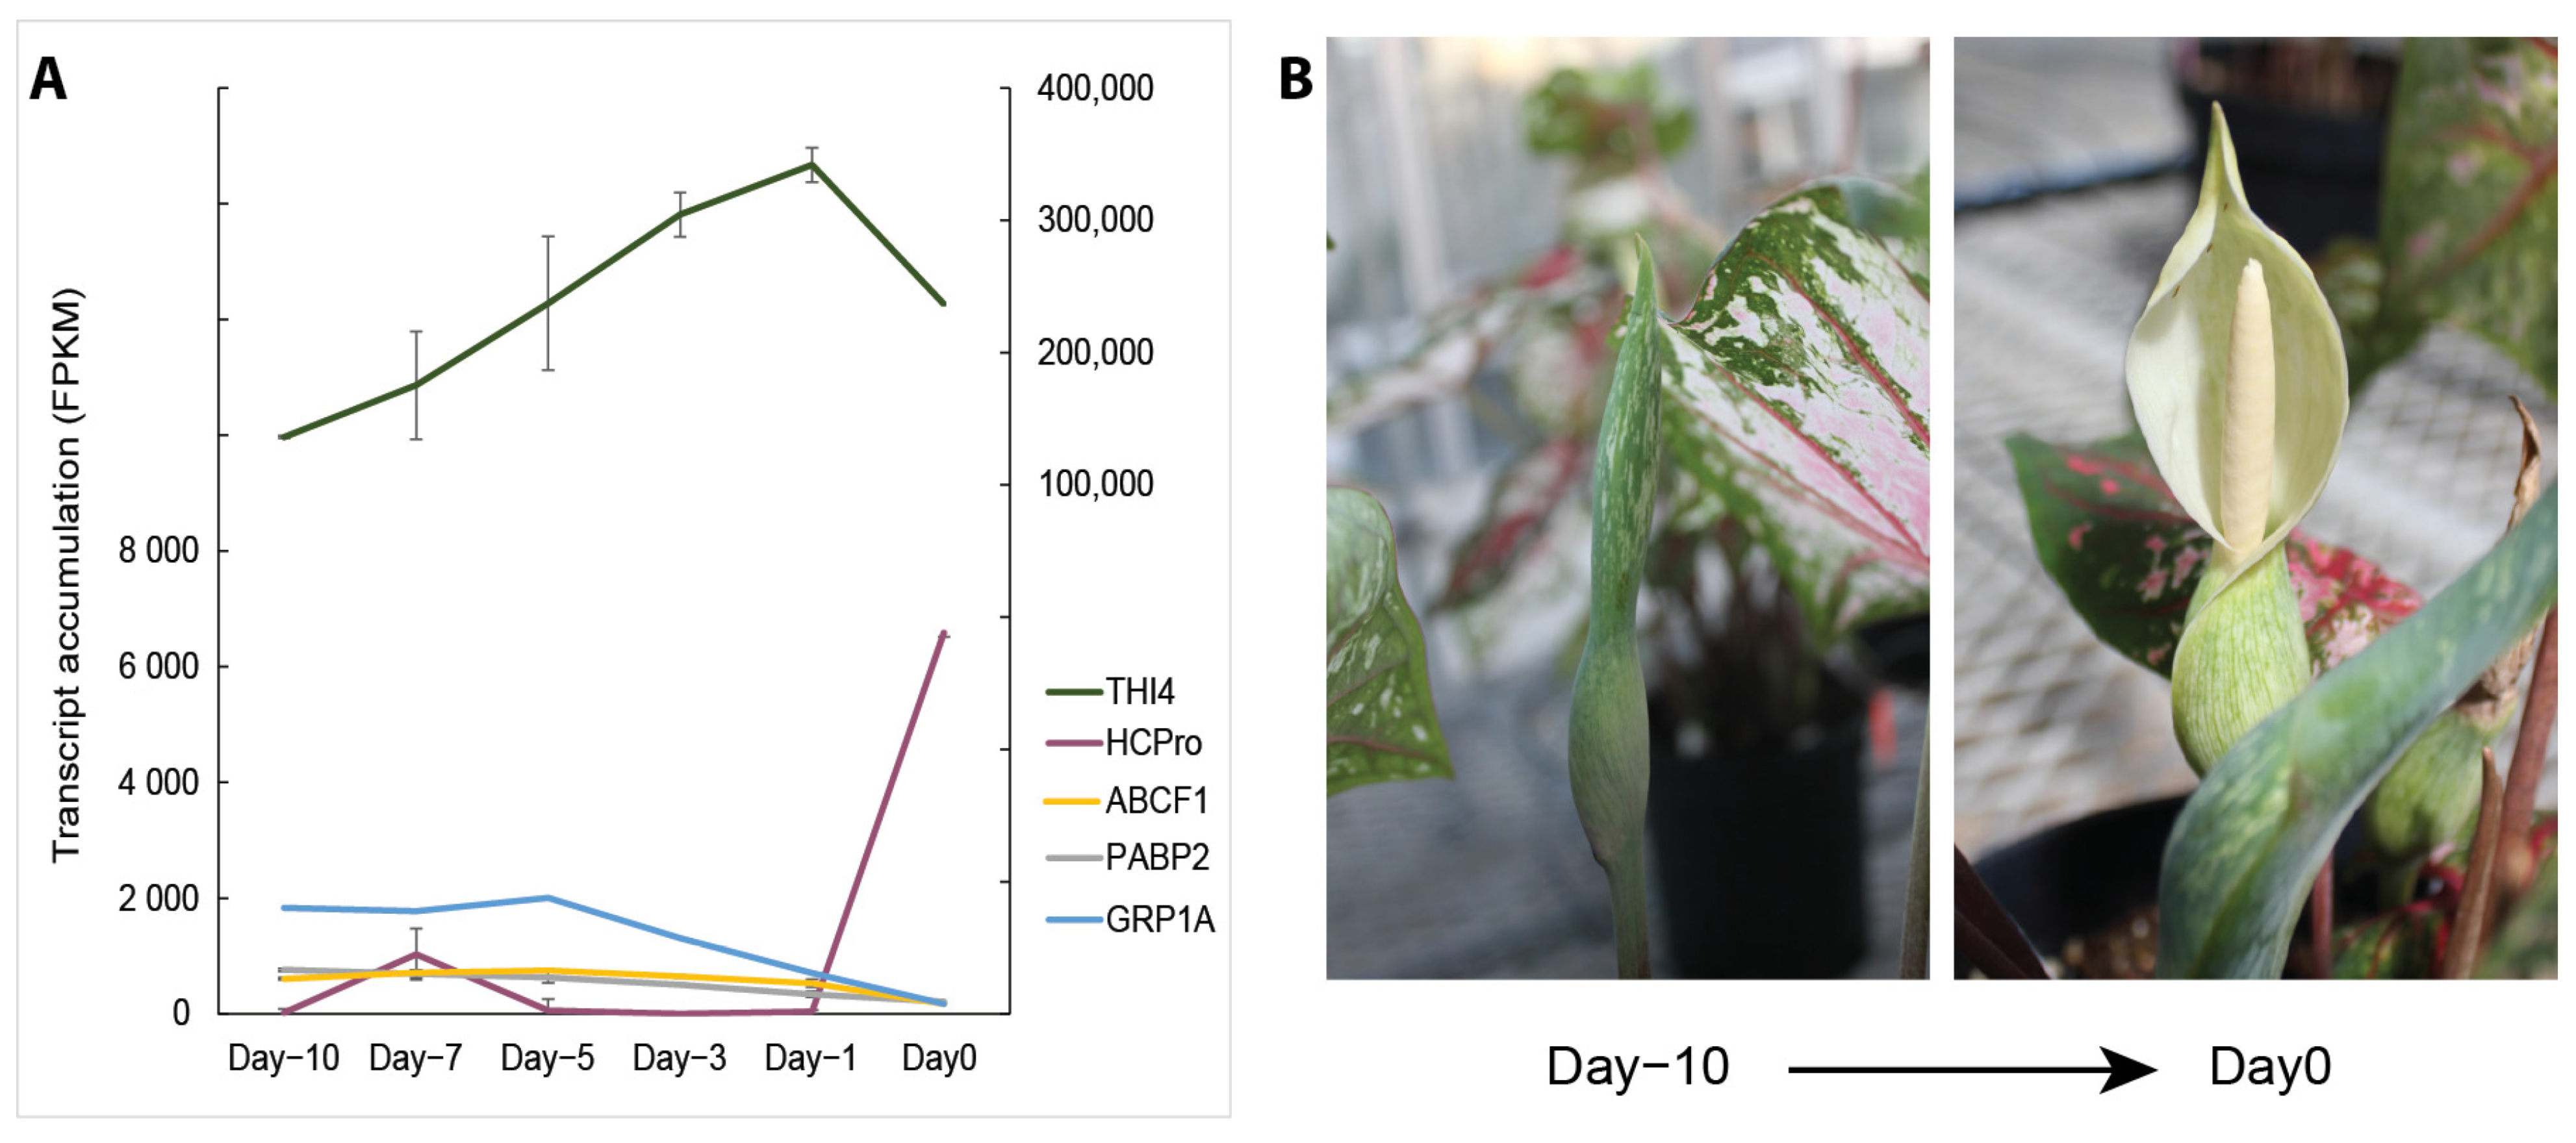
4.2. The Other Possible Transcripts Associated with the Flower Development of C. bicolor

The transcripts that displayed a significant difference from transcriptomes involved in RNA modification, degradation, or surveillance were HcPro and GRP1A. HcPro is a multifunctional protein found in the plant virus genus, Potyvirus. It has been shown to suppress transgene- and virus-induced RNA-silencing pathways in plants, and positively affects virion yield by enhancing capsid protein stability [45,46,47,48]. HcPro increased dramatically on Day−1 (Figure 4 and Table 1), suggesting that caladium could use HcPro to express large quantities of THI4 after female emergence since HcPro allows viruses to accumulate beyond host-mediated limits. Glycine-rich RNA binding proteins (GR-RBPs) have been known to function as an RNA chaperone and play an important role in various steps of RNA post-transcriptional processing under stressful conditions [49,50,51,52,53,54]. Several studies have demonstrated that GR-RBPs are involved in upregulating under oxidative stress induced by peroxide and downregulating under high temperatures [55,56]. This could explain why caladium GR-RBPs were constantly expressed throughout development (Figure 4 and Table 2) as aroid spadices are known to become internally hypoxic at the flowering stage [5]. GR-RBPs could potentially play a role in stabilizing the caladium THI4 mRNA processing throughout devolvement. PABP2 is vital for interacting with RNA-dependent RNA polymerase (RdRp) [57,58]. RdRp catalyzes the synthesis of RNA from viral positive and negative templates, which is critical for viral replication [59,60]. PABP is an essential factor in the viral replicase complex and is reported to be required for the efficient multiplication of potyviruses due to its regulation of RdRp. Caladium could regulate THI4 expression via PAPB2 throughout the developmental period, with expression dropping on Day 0 (Figure 4 and Table 2) when translation is no longer necessary. An RNase L inhibitor (RLI), ABCF2, which belongs to the ATP-binding cassette protein family [61], showed reduced transcript levels comparable to GR-RBP and PABP2. RLIs have the potential to be used like RNA interference (RNAi) to intercede viral resistance and regulate mRNA expression [62]. In caladium, ABCF may be used to silence RNA surveillance by inhibiting the degradation of THI4 mRNA throughout development via RLI activity. Combinations of upregulated and downregulated transcripts would avoid THI4 mRNA degradation caused by the endogenous RNA surveillance mechanism and allow for immense THI4 proliferation. The surveillance mechanism would then “turn on” anthesis to regulate the cellular process after THI4 and MVT are synthesized.

4.3. CbTHI4 Promoter Is a Male Tissue-Specific

Transcription factors are associated with crucial functions in plants, including photosynthesis (DOFCOREZM and CACTFTPPCA1), reproduction (CAATBOX1, POLLEN1LELAT52, and GTGANTG10), the oxidative system (GATABOX and GT1CONSENSUS), and environmental stress factors (MYCCONSENSUSAT) [63]. Some transcription factors can control genes through tissue or organ-specific expression. Anther-specific promoters include cis-acting regulatory elements and promoter regions related to anther-specific expression. Several elements, such as POLLEN1LELAT52, QUELEMENTZMZM13, and GTGANTG10 have been identified as being male tissue-specific [64,65], and caladium THI4 promoter contains significant amounts of the POLLEN1LELAT52 and GTGANTG10 elements (Figure 5). In transgenic petunia plants with ZsGreen1 driven by pCbTHI4, green fluorescence was detected only in the anthers and filaments when observed under a GFP filter (Figure 10), supporting the idea that CbTHI4 transcription factor is male tissue specific. There was also partial green fluorescence detected in the petal tubes, due to the filament tissues that were attached to the petal tubes. This indicates that the green fluorescence detected in the petal tubes originated from the gene expression in male tissues. Male sterility has been reported in plants using anther-specific promoters. An anther-specific GRP gene driven by a transcription factor (PhMYC2) showed significant male sterility in petunia [64], and a wheat pollen-specific promoter (PSG076) conferred pollen maturation in wheat [66]. However, the petunia plants controlled by pCbTHI4 did not show sterility or infertility. Male sterility was not reported in transgenic corn using a pollen-specific promoter (ZmSTK2_USP) [65] or an embryo-specific promoter (Emb5) [67]. This indicates that a male tissue-specific promoter is not necessary to induce infertility.
In the transient expression of ZsGreen1, fluorescence can be observed in all petunia flowers two days after Agrobacterium injection. However, the gene expression using pCbTHI4 was not stronger than the expression using pFMV (Figure 7). The lower expression of the transgene could be due to tissue-specific expression in small tissues of plants, or it could be influenced by regulatory sequences, such as enhancers or silencers [68]. For example, Cho et al. [24] found that the fluorescence of genes, including TurboRFP or ZsYellow1, was not strong enough in petunia plants, despite using a strong promoter, FMV. Moreover, fluorescence from certain genes such as DsRed2 and E2Crimson was not detectable in petunia MD flowers.

5. Conclusions

Our study explored novel regulatory mechanisms involved in non-traditional flower models, focusing on the expression of crucial enzymes, like THI4 in C. bicolor. Through RNA-seq analysis, we identified potential candidate genes associated with regulating THI4 expression. THI4 was the only highly expressed transcript corresponding to MVT expression during male flower development, supporting the idea that THI4 is a crucial precursor to produce MVT. We also identified the corresponding transcripts for elevated volatiles of caladium, links to the potyvirus-mediated post-translational gene silencing mechanism, and de novo fragrance biosynthesis pathways, including the role of ROMT in TMB biosynthesis. Caladium THI4’s unique regulatory mechanism offers insight into similar catalytically inefficient enzymes. Future research would be necessary to clarify the precise regulatory networks controlling THI4 and other related enzymes. Our identification and characterization of the male tissue-specific promoter suggest its potential application in targeted genetic modifications of crops. Exploration of the broader implications of these findings for crop biotechnology, bioengineering, and biochemistry could benefit the standards of consumers.

Supplementary Materials

The following supporting information can be downloaded at: https://www.mdpi.com/article/10.3390/horticulturae10080810/s1, Figure S1: ZsGreen1 expression in genetically modified petunia plants (MD) using a 3.3 kb caladium THI4 promoter. The endogenous transcript levels of ZsGreen1 in whole flowers and anthers were quantified by the 2−ΔΔCT method using quantitative PCR (qPCR) normalizing to the reference gene, ubiquitin. The relative expression of another reference gene (FBP1) was also stable. Data shows the relative transcription levels compared to MD plants. The bars indicate standard errors, and the letters denote statistically significant differences between the plants (p < 0.001, Tukey); Figure S2: THI4 transcript expressions of different developmental stages of C. bicolor ‘Tapestry’ shoots were quantified by the 2−ΔΔCT method using qPCR normalizing to the reference gene, 18S rRNA. Stage 1, initiated shoots from bulbs (<1 cm in length); Stage 2, elongated shoots under the soil (1~10 cm in length); Stage 3, shoots above soil (>10 cm in length). Data show the relative transcription levels compared to stage 1and bars on the graphs indicate standard deviation (p < 0.001, Tukey); Table S1: The primers used in this research; Table S2: The predicted functional transcripts analyses of C. bicolor ‘Tapestry’ inflorescence; Table S3: Top 20 transcripts of C. bicolor ‘Tapestry’ inflorescence involved with secondary metabolite biosynthesis that increased expression Day−10 to Day0; Table S4: The predicted cis-regulatory elements of the Caladium THI4 promoter (3.3 kb).

Author Contributions

The contributions of the respective authors are as follows: Conceptualization, T.A.C.; Methodology, C.L.S., J.Y.K. and K.H.C.; Validation, T.A.C. and J.Y.K.; Formal Analysis, C.L.S.; Investigation, J.Y.K.; Resources, K.H.C.; Data Curation, C.L.S. and J.Y.K.; Writing—Original Draft Preparation, C.L.S. and J.Y.K.; Writing—Review & Editing, T.A.C., K.H.C., M.D.G. and M.S.E.; Visualization, J.Y.K.; Supervision, J.Y.K.; Project Administration, T.A.C. and J.Y.K.; Funding Acquisition, T.A.C. All authors have read and agreed to the published version of the manuscript.

Funding

This research was supported by the United States Department of Agriculture: Agricultural Research Service-Floriculture and Nursery Research Initiative (ARS-FNRI) and American Floral Endowment.

Data Availability Statement

The data presented in this study are available on request from the corresponding author.

Conflicts of Interest

The authors declare no conflicts of interest.

References

  1. Chatterjee, A.; Jurgenson, C.T.; Schroeder, F.C.; Ealick, S.E.; Begley, T.P. Thiamin biosynthesis in eukaryotes: Characterization of the enzyme-bound product of thiazole synthase from Saccharomyces cerevisiae and its implications in thiazole biosynthesis. J. Am. Chem. Soc. 2006, 128, 7158–7159. [Google Scholar] [CrossRef]
  2. Chatterjee, A.; Jurgenson, C.T.; Schroeder, F.C.; Ealick, S.E.; Begley, T.P. Biosynthesis of thiamin thiazole in eukaryotes: Conversion of NAD to an advanced intermediate. J. Amer. Chem. Soc. 2007, 129, 2914–2922. [Google Scholar] [CrossRef]
  3. Chatterjee, A.; Abeydeera, N.D.; Bale, S.; Pein-Jing, P.; Dorrestein, P.C.; Russell, D.H.; Ealick, S.E.; Begley, T.P. Saccharomyces cerevisiae THI4p is a suicide thiamine thiazole synthase. Nature 2011, 478, 542–546. [Google Scholar] [CrossRef] [PubMed]
  4. Yazdani, M.; Zallot, R.; Tunc-Ozdemir, M.; de Crécy-Lagard, V.; Shintani, D.K.; Hanson, A.D. Identification of the thiamin salvage enzyme thiazole kinase in Arabidopsis and maize. Phytochemistry 2013, 94, 68–73. [Google Scholar] [CrossRef] [PubMed]
  5. Sun, J.; Sigler, C.L.; Beaudoin, G.A.W.; Joshi, J.; Patterson, J.A.; Cho, K.H.; Ralat, M.A.; Gregory, J.F.; Clark, D.G.; Deng, Z.; et al. Parts-Prospecting for a High-Efficiency Thiamin Thiazole Biosynthesis Pathway. Plant Physiol. 2019, 179, 958–968. [Google Scholar] [CrossRef] [PubMed]
  6. Joshi, J.; Beaudoin, G.A.; Patterson, J.A.; García-García, J.D.; Belisle, C.E.; Chang, L.Y.; Li, L.; Duncan, O.; Millar, A.H.; Hanson, A.D. Bioinformatic and experimental evidence for suicidal and catalytic plant THI4s. Biochemical. J. 2020, 477, 2055–2069. [Google Scholar] [CrossRef] [PubMed]
  7. Gottsberger, G. Beetle Pollination and Flowering Rhythm of Annona spp. (Annonaceae) in Brazil. Plant System. Evol. 1989, 167, 165–187. [Google Scholar] [CrossRef]
  8. Maia, A.C.D.; Schlindwein, C. Caladium bicolor (Araceae) and Cyclocephala celata (Coleoptera, Dynastinae): A well-established pollination system in the northern Atlantic rainforest of Pernambuco, Brazil. Plant Biol. 2006, 8, 529–534. [Google Scholar] [CrossRef]
  9. Ratcliffe, B.C.; Paulsen, M.J. The Scarabaeoid Beetles of Nebraska. Univ. Nebraska. 2008, 22, 2–6. [Google Scholar]
  10. Maia, A.C.D.; Schlindwein, C.; Navarro, D.M.A.F.; Gibernau, M. Pollination of Philodendron acutatum (Araceae) in the Atlantic Forest of northeastern Brazil: A single scarab beetle species guarantees a high fruit set. Int. J. Plant Sci. 2010, 171, 740–748. [Google Scholar] [CrossRef]
  11. Gibernau, M. Pollinators and Visitors of Aroid Inflorescences: An Addendum. Aroideana 2011, 34, 70–83. [Google Scholar]
  12. Maia, A.C.D.; Dotterl, S.; Kaiser, R.; Silberbauer-Gottsberger, I.; Teichert, H.; Gibernau, M.; Amaral Ferraz Navarro, D.M.; Schlindwein, C.; Gottsberger, G. The Key Role of 4-methyl-5-vinylthiazole in the Attraction of Scarab Beetle Pollinators: A Unique Olfactory Floral Signal Shared by Annonaceae and Araceae. J. Chem. Eco. 2012, 38, 1072–1080. [Google Scholar] [CrossRef]
  13. Schmid, M.; Davison, T.S.; Henz, S.R.; Pape, U.J.; Demar, M.; Vingron, M.; Schölkopf, B.; Weigel, D.; Lohmann, J.U. A gene expression map of Arabidopsis thaliana development. Nat. Gen. 2005, 37, 501–506. [Google Scholar] [CrossRef]
  14. Ma, L.; Sun, N.; Liu, X.; Jio, Y.; Zhao, H.; Deng, X.W. Organ-Specific Expression of Arabidopsis Genome during Development. Plant Physiol. 2005, 138, 80–91. [Google Scholar] [CrossRef]
  15. Fang, F.C.; Rimsky, S. New insights into transcriptional regulation by H-NS. Curr. Opin. Microbiol. 2008, 11, 113–120. [Google Scholar] [CrossRef] [PubMed]
  16. Du, F.; Fan, J.; Wang, T.; Wu, Y.; Grierson, D.; Gao, Z.; Xia, Y. Identification of differentially expressed genes in flower, leaf and bulb scale of Lilium oriental hybrid ‘Sorbonne’ and putative control network for scent genes. BMC Gen. 2017, 18, 899. [Google Scholar] [CrossRef] [PubMed]
  17. Cao, Z.; Deng, Z. De Novo Assembly, Annotation, and Characterization of Root Transcriptomes of Three Caladium Cultivars with a Focus on Necrotrophic Pathogen Resistance/Defense-Related Genes. Int. J. Mol. Sci. 2017, 18, 712. [Google Scholar] [CrossRef] [PubMed]
  18. Chang, S.; Puryear, J.; Cairney, J. A simple and efficient method for isolating RNA from pine trees. Plant Mol. Biol. Rep. 1993, 11, 113–116. [Google Scholar] [CrossRef]
  19. Bolger, A.M.; Lohse, M.; Usadel, B. Trimmomatic: A flexible trimmer for Illumina Sequence Data. Bioinformatics 2014, 30, 2114–2120. [Google Scholar] [CrossRef]
  20. Huang, Y.; Niu, B.; Gao, Y.; Fu, L.; Li, W. CD-HIT Suite: A web server for clustering and comparing biological sequences. Bioinformatics 2010, 26, 680–682. [Google Scholar] [CrossRef]
  21. van Bel, M.; Proost, S.; van Neste, C.; Deforce, D.; van de Peer, Y.; Vandepoele, K. TRAPID: An efficient online tool for the functional and comparative analysis of de novo RNA-Seq transcriptomes. Genome Biol. 2013, 14, R134. [Google Scholar] [CrossRef] [PubMed]
  22. Kanehisa, M.; Sato, Y.; Kawashima, M.; Furumichi, M.; Tanabe, M. KEGG as a reference resource for gene and protein annotation. Nucleic Acids Res. 2016, 44, D457–D462. [Google Scholar] [CrossRef] [PubMed]
  23. Jin, J.; Tian, F.; Yang, D.C.; Meng, Y.Q.; Kong, L.; Luo, J.; Gao, G. PlantTFDB 4.0: Toward a central hub for transcription factors and regulatory interactions in plants. Nucleic Acids Res. 2017, 45, D1040–D1045. [Google Scholar] [CrossRef] [PubMed]
  24. Cho, K.H.; Kim, J.Y.; Alvarez, M.I.; Laux, V.Y.; Valad, L.K.; Tester, J.M.; Colquhoun, T.A.; Clark, D.G. Strong Fluorescence Expression of ZsGreen1 in Petunia Flowers by Agrobacterium tumefaciens–mediated Transformation. J. Amer. Soc. Hort. Sci. 2019, 144, 405–413. [Google Scholar] [CrossRef]
  25. Dong, J.; Ding, X.; Wang, S. Purification of the recombinant green fluorescent protein from tobacco plants using alcohol/salt aqueous two-phase system and hydrophobic interaction chromatography. BMC Biotech. 2019, 19, 1–8. [Google Scholar] [CrossRef] [PubMed]
  26. Jorgensen, W.L.; Maxwell, D.S.; Tirado-Rives, J. Development and testing of the OPLS all-atom force field on conformational energetics and properties of organic liquids. J. Amer. Chem. Soc. 1996, 118, 11225–11236. [Google Scholar] [CrossRef]
  27. Verdonk, J.C.; Ric de Vos, C.H.; Verhoeven, H.A.; Haring, M.A.; van Tunen, A.J.; Schuurink, R.C. Regulation of floral scent production in petunia revealed by targeted metabolomics. Phytochemistry 2003, 62, 997–1008. [Google Scholar] [CrossRef] [PubMed]
  28. Livak, K.J.; Schmittgen, T.D. Analysis of relative gene expression data. Methods 2001, 25, 402–408. [Google Scholar] [CrossRef]
  29. Higo, K.; Ugawa, Y.; Iwamoto, M.; Korenaga, T. Plant cis-acting regulatory DNA elements (PLACE) database: 1999. Nucleic Acids Res. 1999, 27, 297–300. [Google Scholar] [CrossRef]
  30. van Moerkercke, A.; Schauvinhold, I.; Pichersky, E.; Haring, M.A.; Schuurink, R.C. A plant thiolase involved in benzoic acid biosynthesis and volatile benzenoid production. Plant J. 2009, 60, 292–302. [Google Scholar] [CrossRef]
  31. Dao, T.T.H.; Linthorst, H.J.M.; Verpoorte, R. Chalcone synthase and its functions in plant resistance. Phytochem. Rev. 2011, 10, 397–412. [Google Scholar] [CrossRef] [PubMed]
  32. Chen, F.; Tholl, D.; D’Auria, J.C.; Farooq, A.; Pichersky, E.; Gershenzon, J. Biosynthesis and Emission of Terpenoid Volatiles from Arabidopsis Flowers. Plant Cell 2003, 15, 481–494. [Google Scholar] [CrossRef] [PubMed]
  33. Baldermann, S.; Kato, M.; Fleischmann, P.; Watanabe, N. Biosynthesis of α- and β-ionone, prominent scent compounds, in flowers of Osmanthus fragrans. Acta Biochim. Polonica. 2012, 5, 79–81. [Google Scholar] [CrossRef]
  34. Hamberger, B.; Bak, S. Plant P450s as versatile drivers for evolution of species-specific chemical diversity. Philos. Trans. R. Soc. Lond. B. Biol. Sci. 2013, 368, 20120426. [Google Scholar] [CrossRef] [PubMed]
  35. Rastogi, S.; Kumar, R.; Chanotiya, C.S.; Shanker, K.; Gutpa, M.M.; Nagegowda, D.A.; Shasany, A.K. 4-Coumarate: CoA Ligase Partitions Metabolites for Eugenol Biosynthesis. Plant Cell Physiol. 2013, 54, 1238–1252. [Google Scholar] [CrossRef] [PubMed]
  36. Muhlemann, J.K.; Klempien, A.; Dudareva, N. Floral volatiles: From biosynthesis to function. Plant Cell Environ. 2014, 37, 1936–1949. [Google Scholar] [CrossRef] [PubMed]
  37. Bruno, M.; Beyeer, P.; Al-Babili, S. The potato carotenoid cleavage dioxygenase 4 catalyzes a single cleavage of β-ionone ring-containing carotenes and non-epoxidated xanthophylls. Arch. Biochem. Biophys. 2015, 572, 126–133. [Google Scholar] [CrossRef] [PubMed]
  38. Lavid, N.; Wang, J.; Shalit, M.; Guterman, I.; Bar, E.; Beuerle, T.; Menda, N.; Shafir, S.; Zamir, D.; Adam, Z.; et al. O-methyltransferases involved in the biosynthesis of volatile phenolic derivatives in rose petals. Plant Physiol. 2002, 129, 1899–1907. [Google Scholar] [CrossRef] [PubMed]
  39. Scalliet, G.; Journot, N.; Jullien, F.; Baudino, S.; Magnard, J.L.; Channelière, S.; Vergne, P.; Dumas, C.; Bendahmane, M.; Cock, J.M.; et al. Biosynthesis of the major scent components 3,5-dimethoxytoluene and 1,3,5-trimethoxybenzene by novel rose O-methyltransferases. FEBS Lett. 2002, 523, 113–118. [Google Scholar] [CrossRef]
  40. Scalliet, G.; Lionnet, L.; Le Bechec, M.; Dutron, D.; Magnard, J.L.; Baudino, S.; Bergougnoux, V.; Jullien, F.; Chambrier, P.; Vergne, P.; et al. Role of petal-specific orcinol O-methyltransferases in the evolution of rose scent. Plant Physiol. 2006, 14, 18–29. [Google Scholar] [CrossRef]
  41. Wu, S.; Watanabe, N.; Mita, S.; Dohra, H.; Ueda, Y.; Shibuya, M.; Ebizuka, Y. The Key Role of Phloroglucinol O-Methyltransferase in the Biosynthesis of Rosa chinensis Volatile 1,3,5-Trimethoxybenzene. Plant Physiol. 2004, 35, 95–102. [Google Scholar] [CrossRef] [PubMed]
  42. Schmidlin, L.; Poutaraud, A.; Claudel, P.; Mestre, P.; Prado, E.; Santos-Rosa, M.; Wiedemann-Merdinoglu, S.; Karst, F.; Merdinoglu, D.; Hugueney, P. A stress-inducible resveratrol O-methyltransferase involved in the biosynthesis of pterostilbene in grapevine. Plant Physiol. 2008, 48, 1630–1639. [Google Scholar] [CrossRef] [PubMed]
  43. Ye, Z.H.; Zhong, R.; Morrison, W.H., III; Himmelsbach, D.S. Caffeoyl coenzyme A O-methyltransferase and lignin biosynthesis. Phytochemistry 2001, 7, 1177–1185. [Google Scholar] [CrossRef] [PubMed]
  44. Do, C.T.; Pollet, B.; Thevenin, J.; Sibout, R.; Denoue, D.; Barriere, Y.; Lapierre, C.; Jouanin, L. Both caffeoyl Coenzyme A 3-O-methyltransferase 1 and caffeic acid O-methyltransferase 1 are involved in redundant functions for lignin, flavonoids and sinapoyl malate biosynthesis in Arabidopsis. Planta 2007, 226, 1117–1129. [Google Scholar] [CrossRef] [PubMed]
  45. Valli, A.; Gallo, A.; Calvo, M.; de Jesús Pérez, J.; García, J.A. A novel role of the potyviral helper component proteinase contributes to enhance the yield of viral particles. J. Virol. 2014, 88, 9808–9818. [Google Scholar] [CrossRef] [PubMed]
  46. Garcia-Ruiz, H.; Takeda, A.; Chapman, E.J.; Sullivan, C.M.; Fahlgren, N.; Brempelis, K.J.; Carrington, J.C. Arabidopsis RNA-dependent RNA polymerases and dicer-like proteins in antiviral defense and small interfering RNA biogenesis during turnip mosaic virus infection. Plant Cell 2010, 22, 481–496. [Google Scholar] [CrossRef] [PubMed]
  47. Syller, J. The roles and mechanisms of helper component proteins encoded by potyviruses and caulimoviruses. Physiol. Mol. Plant Pathol. 2005, 67, 119–130. [Google Scholar] [CrossRef]
  48. Anandalakshmi, R.; Pruss, G.J.; Ge, X.; Marathe, R.; Mallory, A.C.; Smith, T.H.; Vance, V.B. A viral suppressor of gene silencing in plants. Proc. Natl. Acad. Sci. USA 1998, 95, 13079–13084. [Google Scholar] [CrossRef]
  49. Lorković, Z.J. Role of plant RNA-binding proteins in development. stress response and genome organization. Trends Plant Sci. 2009, 14, 229–236. [Google Scholar] [CrossRef]
  50. Kim, J.Y.; Kim, W.Y.; Kwak, K.J.; Oh, S.H.; Han, Y.S.; Kang, H. Glycine-rich RNA-binding proteins are functionally conserved in Arabidopsis thaliana and Oryza sativa during cold adaptation process. J. Exp. Bot. 2010, 61, 2317–2325. [Google Scholar] [CrossRef]
  51. Kim, M.K.; Jung, H.J.; Kim, D.H.; Kang, H. Characterization of glycine-rich RNA-binding proteins in Brassica napus under stress conditions. Physiol. Plant 2012, 146, 297–307. [Google Scholar] [CrossRef]
  52. Kang, H.; Park, S.J.; Kwak, K.J. Plant RNA chaperones in stress response. Trends Plant Sci. 2013, 18, 100–106. [Google Scholar] [CrossRef]
  53. Ambrosone, A.; Batelli, G.; Nurcato, R.; Aurilia, V.; Punzo, P.; Bangarusamy, D.K.; Ruberti, I.; Sassi, M.; Leone, A.; Costa, A.; et al. The Arabidopsis RNA-binding protein AtRGGA regulates tolerance to salt and drought stress. Plant Physiol. 2015, 168, 292–306. [Google Scholar] [CrossRef] [PubMed]
  54. Yang, D.H.; Kwak, K.J.; Kim, M.K.; Park, S.J.; Yang, K.Y.; Kang, H. Expression of Arabidopsis glycine-rich RNA-binding protein AtGRP2 or AtGRP7 improves grain yield of rice (Oryza sativa) under drought stress conditions. Plant Sci. Int. J. Exp. Plant Biol. 2014, 214, 106–112. [Google Scholar] [CrossRef]
  55. Cramer, G.R.; Urano, K.; Delrot, S.; Pezzotti, M.; Shinozaki, K. Effects of abiotic stress on plants: A systems biology perspective. BMC Plant Biol. 2011, 11, 163. [Google Scholar] [CrossRef] [PubMed]
  56. Wienkoop, S.; Morgenthal, K.; Wolschin, F.; Scholz, M.; Selbig, J.; Weckwerth, W. Integration of metabolomic and proteomic phenotypes: Analysis of data covariance dissects starch and RFO metabolism from low and high temperature compensation response in Arabidopsis thaliana. Mol. Cell Proteom. 2008, 7, 1725–1736. [Google Scholar] [CrossRef]
  57. Dufresne, P.J.; Thivierge, K.; Cotton, S.; Beauchemin, C.; Ide, C.; Ubalijoro, E.; Laliberté, J.F.; Fortin, M.G. Heat shock 70 protein interaction with Turnip mosaic virus RNA-dependent RNA polymerase within virus-induced membrane vesicles. Virology 2008, 374, 217–227. [Google Scholar] [CrossRef]
  58. Beauchemin, C.; Laliberté, J.F. The poly(A) binding protein is internalized in virus-induced vesicles or redistributed to the nucleolus during Turnip mosaic virus infection. J. Virol. 2007, 81, 10905–10913. [Google Scholar] [CrossRef]
  59. Buck, K.W. Comparison of the replication of positive-stranded RNA viruses of plants and animals. Adv. Virus Res. 1996, 7, 159–251. [Google Scholar]
  60. Dufresne, P.J.; Ubalijoro, E.; Fortin, M.G.; Laliberté, J.F. Arabidopsis thaliana class II poly(A)-binding proteins are required for efficient multiplication of turnip mosaic virus. J. Gen. Virol. 2008, 9, 2339–2348. [Google Scholar] [CrossRef]
  61. Martinand, C.; Salehzada, T.; Silhol, M.; Lebleu, B.; Bisbal, C. The RNase L inhibitor (RLI) is induced by double-stranded RNA. J. Interferon Cytokine Res. 1998, 18, 1031–1038. [Google Scholar] [CrossRef]
  62. Braz, A.S.K.; Finnegan, J.; Waterhouse, P.; Margis, R. A Plant Orthologue of RNase L Inhibitor (RLI) Is Induced in Plants Showing RNA Interference. J. Mol. Evol. 2004, 59, 20–30. [Google Scholar] [CrossRef] [PubMed]
  63. Rivero-Manzanilla, G.; Narváez-Zapata, J.A.; Aguilar-Espinosa, M.; Carballo-Uicab, V.M.; Rivera-Madrid, R. Gene structure and potential regulation of the lycopene cyclase genes in Bixa orellana L. Physiol. Mol. Biol. Plants 2023, 29, 423–1435. [Google Scholar] [CrossRef] [PubMed]
  64. Yue, Y.; Yin, C.; Guo, R.; Peng, H.; Yang, Z.; Liu, G.; Bao, M.; Hu, H. An anther-specific gene PhGRP is regulated by PhMYC2 and causes male sterility when overexpressed in petunia anthers. Plant Cell Rep. 2017, 36, 1401–1415. [Google Scholar] [CrossRef] [PubMed]
  65. Wang, H.; Fan, M.; Wang, G.; Zhang, C.; Shi, L.; Wei, Z.; Ma, W.; Chang, J.; Huang, S.; Lin, F. Isolation and characterization of a novel pollen-specific promoter in maize (Zea mays L.). Genome 2017, 60, 485–495. [Google Scholar] [CrossRef] [PubMed]
  66. Chen, L.; Su, P.; Yang, G.; He, G.; Gao, C. PSG076 Promoter Shows Late Pollen-Specific Activity in Wheat (Triticum aestivum L.). Plant Mol. Biol. Rep. 2023, 41, 690–698. [Google Scholar] [CrossRef]
  67. Li, Y.; Yu, L.; Wang, Q.; Zhao, X.; Li, X.; Qi, B. Analysis of the Promoter of Emb5 from Zea mays Identifies a Region of 523 bp Responsible for Its Embryo-Specific Activity. Plant Mol. Bio. Rep. 2021, 39, 288–300. [Google Scholar] [CrossRef]
  68. Dolgova, A.S.; Dolgov, S.V. Matrix attachment regions as a tool to influence plant transgene expression. 3 Biotech. 2019, 9, 176. [Google Scholar] [CrossRef]
Figure 1. Top 5 transcripts expressed throughout male inflorescence development of caladium. The male flower tissue of C. bicolor ‘Tapestry’ was collected at five developmental time points leading up to anthesis (Day−10, Day−5, Day−3, Day−1, and Day0). THI4, thiamine thiazole synthase; E134, endo-1,31,4-beta-D-glucanase; HlfX, GTPase HflX; MJ1113, putative glycosyltransferase; MJ1065, uncharacterized protein; TCTP, translationally controlled tumor protein; 16OMT, tabersonine 16-O-methyltransferase; SAMS, S-adenosylmethionine synthase; NAD2, NADH-ubiquinone oxidoreductase chain 2; TPM, Transcripts Per Million.
Horticulturae 10 00810 g001
Figure 2. Short Time-series Expression Miner (STEM) clusters representing short time series gene expression data of C. bicolor ‘Tapestry’. The top left value in each box represents the cluster number, and the bottom left value in each box represents the p-value. Colored squares indicate significantly different DEG trends of transcript expression throughout development, and black lines display model profiles of expression change ratio over time. Profile 2 includes genes constantly expressed throughout development. Profile 16 includes genes increased on the day of anthesis (Day0). Profile 22 includes genes that drastically decreased on Day0. Profile 7 includes genes constantly expressed throughout development but at low levels.
Horticulturae 10 00810 g002
Figure 3. Top 6 transcripts of C. bicolor ‘Tapestry’ associated with secondary metabolite biosynthesis upregulated on Day0 (A) and their floral volatile products (B). THI4 was the only transcript showing notably high expression on Day−10 of the six transcripts associated with volatile biosynthesis, while MVT (4-methyl-5-vinylthiozole) was the only volatile present on Day−10.
Horticulturae 10 00810 g003
Figure 4. Transcript accumulation in C. bicolor ‘Tapestry’ male inflorescence tissue at five developmental time points leading up to anthesis (Day−10, Day−5, Day−3, Day−1, and Day0) (A) and caladium flowers on Day−10 and Day0 (B). While THI4 transcripts increased with flower development until Day−1 and dropped on Day0, the HCPro transcript elevated dramatically on Day0. ABCF1, ATP-binding cassette, subfamily F member 1; GRP1A, Glycine-rich RNA-binding protein 1A; HCPro, helper component proteinase; PABP2, polyadenylate-binding protein 2.
Horticulturae 10 00810 g004
Figure 5. The caladium THI4 promoter sequence contains cis-acting regulatory elements related to anther-specific expression, POLLEN1LELAT52 (AGAAA) and GTGANTG10 (GTGA).
Horticulturae 10 00810 g005
Figure 6. The map of vectors to express a fluorescent gene driven by various sizes of caladium THI4 promoter. The green and red lines indicate the location of anther-specific elements.
Horticulturae 10 00810 g006
Figure 7. Transient expression of ZsGreen1 in the flowers of Petunia x hybrida cv ‘Mitchell Diploid’(MD). The fluorescence of ZsGreen1 driven by the 0.75 kb, 1.5 kb, 3.3 kb, or 5.1 kb caladium THI4 promoter was observed under light and a GFP filter over time (A). The relative intensities of the fluorescent images were measured three days after injection (B). ABI is Agrobacterium strain ABI. IGS includes ZsGreen1 driven by a petunia isoeugenol synthase promoter, and FMV includes ZsGreen1 driven by a figwort mosaic virus 35S promoter.
Horticulturae 10 00810 g007
Figure 8. Transient expression of ZsGreen1 in the leaves of Nicotiana benthamiana. The infiltrated tobacco leaves were collected under UV light (A) and the fluorescence of ZsGreen1 was observed under a microscope (B). ABI, Agrobacterium strain ABI; 3.3 kb, ABI including a 3.3 kb caladium THI4 promoter; FMV, ABI including Agrobacterium with an FMV promoter.
Horticulturae 10 00810 g008
Figure 9. ZsGreen1 expression in genetically modified petunia plants (MD) using a 3.3 kb caladium THI4 promoter. The endogenous transcript levels of ZsGreen1 in whole flowers and anthers were quantified by the 2−ΔΔCT method using quantitative PCR (qPCR) normalizing to the reference gene, Ph18S rRNA (A) and ubiquitin (Figure S1). Data shows the relative transcription levels compared to MD plants. The bars indicate standard errors, and the letters denote statistically significant differences between the plants (p < 0.001, Student’s t-test). The fluorescence of ZsGreen1 in petunia filaments was observed under a fluorescence stereo microscope with a GFP filter (B).
Horticulturae 10 00810 g009
Figure 10. Gene expression of CbTHI4 in the different tissues of line 25 and the wild-type petunia (MD) was quantified by the 2−ΔΔCT method using quantitative PCR (qPCR), normalizing to the reference gene, Ph18S rRNA (A). Data shows the relative transcription levels. The bars indicate standard errors, and the letters denote statistically significant differences between the plant parts (p < 0.001, Tukey). The fluorescence of ZsGreen1 driven by the 3.3 kb caladium THI4 promoter was observed under light and a GFP filter with each section of fully opened petunia flowers (B).
Horticulturae 10 00810 g010
Figure 11. Potential methylation pathways of DMT and TMB biosynthesis adapted from Figure 1, Scalliet et al. [39]. Orcinol requires two methylations at the 3- and 5-positions to form 3,5-dimethoxy toluene. Phloroglucinol, the proposed precursor to 1,3,5-trimethyl benzene, requires 3 methylations at the 1-, 3-, and 5-position. OMT, O-methyltransferases.
Horticulturae 10 00810 g011
Table 1. Top 20 transcripts of C. bicolor ‘Tapestry’ inflorescence involved in RNA modification, degradation, and surveillance that increased expression from Day−10 to Day0.
Gene NamesGene DescriptionTranscript Expression Increase (Counts)
HcProPolyprotein6496.03
MYB305Myb-related protein 305-like1918.39
ASG4/RVE3Transcription factor REVEILLE 31408.32
AG1Floral homeotic protein AGAMOUS764.23
NAC047NAC domain-containing protein 718.10
ILL1IAA-amino acid hydrolase ILR1602.33
MYB1R1Transcription factor MYB1R1275.45
ZAT5Zinc finger protein274.07
NAC002NAC domain-containing protein 2267.89
CAF1-11Putative CCR4-associated factor241.46
NAC48NAC domain-containing protein143.84
NAC21NAC domain-containing protein 21/22121.13
NAC68NAC domain-containing protein 68119.79
EREBPEREBP-like factor105.17
MYBPTranscription factor MYB, plant95.03
NAC21NAC domain-containing protein 21/2291.09
EIN3Ethylene-insensitive protein 378.60
bHLH13Transcription factor73.69
bHLH146Transcription factor bHLH146-like66.49
RsfSRibosomal silencing factor RsfS62.47
Table 2. Top 20 transcripts of C. bicolor ‘Tapestry’ inflorescence involved in RNA modification, degradation, and surveillance that decreased expression from Day−10 to Day0.
Gene NamesGene DescriptionTranscript Expression Decrease (Counts)
GRP1AGlycine-rich RNA-binding protein −1386.71
PABP2Polyadenylate-binding protein 2−568.98
ABCF1ABC transporter F family member 1−455.91
IAA27Auxin-responsive protein−270.42
SPL13Squamosa promoter-binding-like protein 13−227.67
CPN60/groELRubisco large subunit-binding protein beta, chloroplast-like−218.24
SAHH1Adenosyl homocysteinase 1−188.89
CPN60Chaperonin CPN60-2, mitochondrial−181.68
IAA27Auxin-responsive protein−175.23
CPN60/groELRubisco large subunit-binding protein beta, chloroplast-like−172.44
HDT2Histone deacetylase HDT2−160.05
HDT2Histone deacetylase HDT2−126.55
ARF15Auxin response factor 15−106.02
WLIM1LIM domain-containing protein−103.82
CPN60/groELRubisco large subunit-binding protein beta, chloroplast-like−93.12
RH15DEAD-box ATP-dependent RNA helicase 56−81.59
ZF-HDZinc-finger homeodomain protein−76.05
AP3Floral homeotic protein APETALA 3−75.05
RNP1Heterogeneous nuclear ribonucleoprotein 1−72.78
ARF7Auxin response factor −71.05
Disclaimer/Publisher’s Note: The statements, opinions and data contained in all publications are solely those of the individual author(s) and contributor(s) and not of MDPI and/or the editor(s). MDPI and/or the editor(s) disclaim responsibility for any injury to people or property resulting from any ideas, methods, instructions or products referred to in the content.

